
Martian atmospheric thermal structures and dust distributions during the global dust storm and the regional dust storm of MY 34 from ACS TIRVIM observations onboard ExoMars TGO
 1,2,1,2,1,6
- 1Space Research Institute (IKI), Moscow, Russia
- 2Laboratoire de Météorologie Dynamique (LMD), Paris, France
- 3Istituto di Astrofisica e Planetologia Spaziali – Istituto Nazionale di Astrofisica, Rome, Italy
- 4Australian National University, Canberra, Australia
- 5DLR, Berlin, Germany
- 6LATMOS, Guyancourt, France
Abstract
Martian dust particles play an important part in radiative processes in Martian atmosphere, being involved in dust, H2O and CO2 cycles on Mars [1]. The most significant manifestations of such cycles are dust storms which last several weeks and strongly affect the thermal structure of Martian atmosphere [2]. In addition to regular storms, global dust storms (hereinafter GDS) occur irregularly once in several Martian Years (hereinafter MY) and cover the entire planet for months. GDS still remain unpredictable despite numerous studies [3]. The latest global dust storm occurred in MY 34 and has been simultaneously monitored by several spacecrafts including ExoMars Trace Gas Orbiter (TGO) [4].
In this paper we present results of analysis of thermal emission spectra of Mars measured with a Fourier-transform spectrometer ACS TIRVIM onboard TGO [5]. The main scientific goal of TIRVIM is long-term monitoring of temperatures and aerosols (dust and water ice) distribution in Martian atmosphere in nadir mode of observations in the 5–16 μm spectral range [6]. Here we consider two datasets obtained in MY 34: the first one covered the first month of the GDS in a period from 26th of May 2018 till 15th of July 2018 (Martian season Ls = 182.2°–211.7°), the second one lasted from 22nd of December 2018 till 18th of March 2019 (Ls = 310.9°–357.3°) and fully covered the regional dust storm (C-storm).
Retrieval of temperatures, dust and ice content from the thermal emission of Martian atmosphere in 15 μm CO2 band has been done in a number of previous similar experiments [7, 8, 9]. We use iterative retrieval algorithm based on optimum estimation approach [10]. With TIRVIM spectral resolution Δν = 1.17 cm-1, temperature profiles may be retrieved from the surface to 55–60 km of altitude with the vertical resolution in the order of few kilometers in the lower atmosphere. Spectral range from 780 to 1300 cm-1 is free from CO2 absorption lines and is suitable for retrieving the temperature of Martian surface and column abundances of aerosols. Dust and water ice contents are defined as optical depths at wavelengths of local maxima of their spectral extinction cross sections [11].
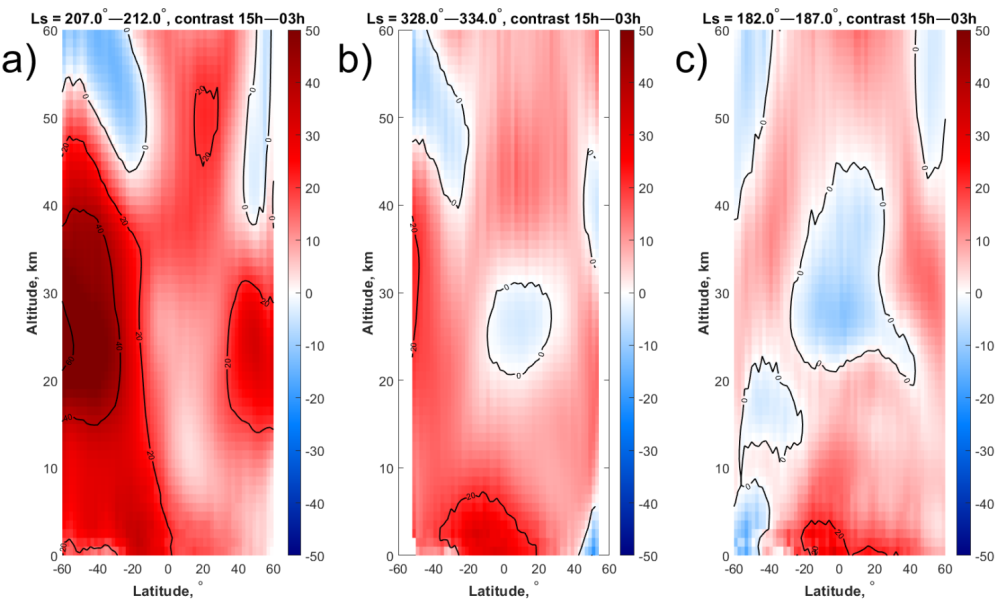
We have obtained the thermal structures of Martian atmosphere at various local times during the first month of the global dust storm and during the whole regional storm. We have compared temperature fields in the nighttime and daytime at the peaks of the two observed storms with structure of the pure from dust atmosphere. Asymmetric heating with dust particles ejected into the atmosphere is clearly seen in Fig. 1. Diurnal contrasts of temperature between nighttime and daytime are represented in Fig. 2. We notice an excellent agreement with co-located MCS/MRO measurements [12], with the account for a worse vertical resolution of nadir sounding with TIRVIM.
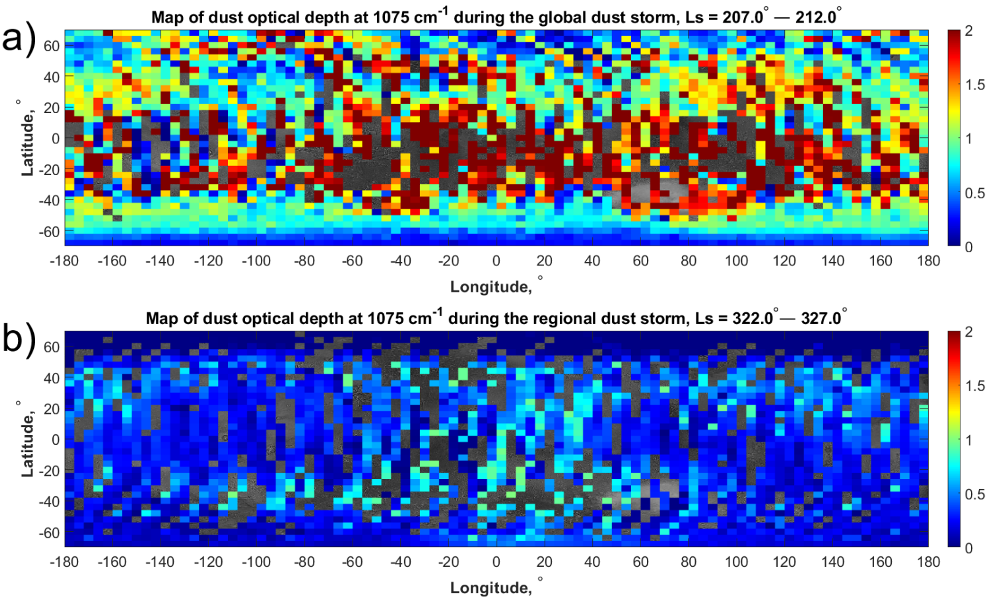
Along with the temperature field we also consider the variability of dust distribution during the two storms in MY 34. Spatial distributions of dust in terms of column optical depth at 1075 cm-1 at the peaks of the global dust storm and the regional dust storm are shown in Fig. 3. Due to unavoidable degeneracy of the dust and ice retrieval problems at some temperature conditions, these maps contain also unreliable high and zero values of optical depth, which are to be filtered out.
Acknowledgements
Science support in IKI is funded by the RSF grant #20-42-09035.
References
[1] Kahre M.A. et al. The Mars dust cycle. The atmosphere and climate of Mars. // MA: Cambridge Univ. Press, Cambridge, 2017
[2] Smith M.D. et al. Thermal Emission Spectrometer results: Mars atmospheric thermal structure and aerosol distribution. // Journal of Geophysical Research. – 2001. – Vol. 106(E10). – P. 23929–23945
[3] Zurek R.W., Martin L.J. Interannual variability of planet-encircling dust storms on Mars. // Journal of Geophysical Research. – 1993. – Vol. 98(E2). – P. 3247–3259
[4] Vago J. et al. ESA ExoMars program: The next step in exploring Mars. // Solar System Research. – 2015. – Vol. 49. – P. 518–528
[5] Korablev O. et al. The Atmospheric Chemistry Suite (ACS) of Three Spectrometers for the ExoMars 2016 Trace Gas Orbiter // Space Science Reviews. 2018. Vol. 214.
[6] Shakun A. et al. (2018). ACS/TIRVIM: Calibration and first results. // Proceedings SPIE 10765, Infrared Remote Sensing and Instrumentation XXVI, 107650E. – 2018
[7] Zasova L. et al. The Martian Atmosphere in the Region of the Great Volcanoes: Mariner 9 IRIS Data Revisited. // Planetary and Space Science. – 2001. – Vol. 49. – P. 977–992
[8] Smith M.D. et al. Separation of atmospheric and surface spectral features in Mars Global Surveyor Thermal Emission Spectrometer (TES) spectra. // Journal of Geophysical Research. – 2000. – Vol. 105(E4). – P. 9589–9607
[9] Grassi D. et al. The Martian atmosphere above great volcanoes: Early planetary Fourier spectrometer observations. // Planetary and Space Science. – 2005. – Vol. 53. – P. 1053–1064
[10] Conrath B.J. et al. Mars Global Surveyor Thermal Emission Spectrometer (TES) observations: Atmospheric temperatures during aerobraking and science phasing // Journal of Geophysical Research. – 2000. – Vol. 105. – P. 9509–9519
[11] Clancy R.T., Wolff M.J. et al. Mars aerosol studies with the MGS TES emission phase function observations: Optical depths, particle sizes, and ice cloud types versus latitude and solar longitude. // Journal of Geophysical Research. – 2003. – Vol. 108(E8).
[12] Kleinböhl A. et al. Diurnal Variations of Dust During the 2018 Global Dust Storm Observed by the Mars Climate Sounder. // Journal of Geophysical Research: Planets. – 2020. – Vol. 125.

How to cite: Vlasov, P., Ignatiev, N., Guerlet, S., Grassi, D., Grigoriev, А., Shakun, A., Patsaev, D., Maslov, I., Luginin, M., Millour, E., Forget, F., Arnold, G., Trokhimovskiy, А., Korablev, O., and Montmessin, F.: Martian atmospheric thermal structures and dust distributions during the global dust storm and the regional dust storm of MY 34 from ACS TIRVIM observations onboard ExoMars TGO, Europlanet Science Congress 2021, online, 13–24 Sep 2021, EPSC2021-405, https://doi.org/10.5194/epsc2021-405, 2021.