
 1,3,5,2,1,8
- 1Rhenish Institute for Environmental Research, Cologne, Germany, (Kerstin.peter@uni-koeln.de)
- 2Department of Physics and Astronomy, University of Iowa, Iowa, USA (feng-chu@uiowa.edu)
- 3Max Planck Institut für Sonnensystemforschung, Göttingen, Germany (fraenz@mps.mpg.de)
- 4Laboratory for Atmospheric and Space Physics, University of Colorado at Boulder, Colorado, USA (Ed.Thiemann@lasp.colorado.edu)
- 5Research and Scientific Support Department of ESA, ESTEC, Noordwijk, The Netherlands (owitasse@cosmos.esa.int)
- 6Astronomical Applications Dept., United States Naval Observatory, Washington, DC, USA (ajkopf@gmail.com)
- 7Universität der Bundeswehr München, Neubiberg, Germany (Bernd.Haeusler@unibw.de)
- 8Argelander Institut für Astronomie, Bonn, Germany (mbird@astro.uni-bonn.de)
While the orbital and environmental parameters (e.g. orbit-Sun-distance, planetary mass/diameter, gravity acceleration, rotation rate, surface pressure) of Venus and Mars are very different, their planetary ionospheres show many similarities.
Figures 1 and 2 illustrate the variability of the Venus and Mars dayside ionospheres. Both planetary dayside ionospheres contain a pronounced main peak region (V2/M2) originating mostly from the photoionization of the CO2 based atmosphere by solar extreme ultraviolet radiation. The region below the main peak (V1/M1) has its origin in the primary and secondary impact ionization of the neutral atmosphere by solar X-ray radiation [2]. The observed shape of the V1/M1 region in radio science observations ranges from a secondary peak (Figure 2b) to a smooth decrease in electron density without a pronounced V1/M1 feature.
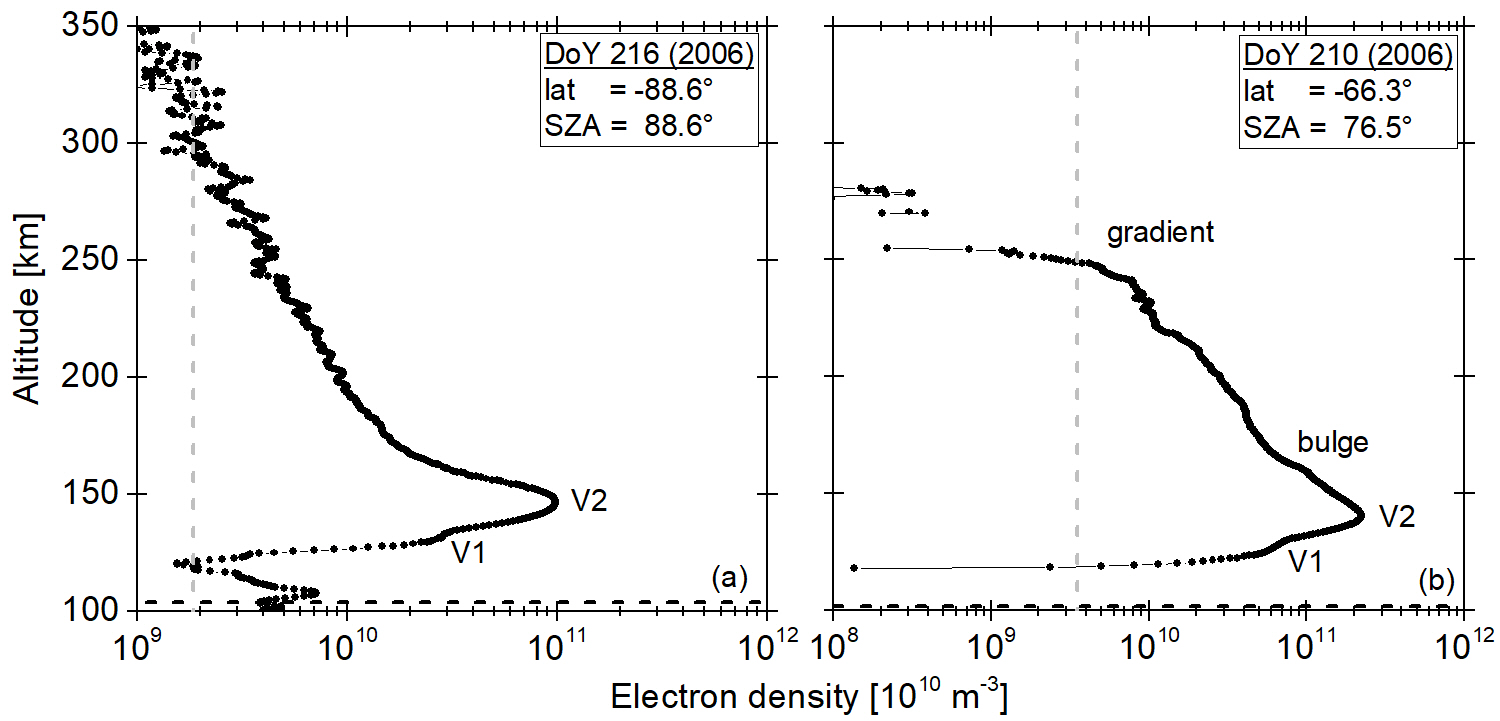
Figure 1: Dayside ionosphere of Venus observed by VeRa on (a) Day of Year (DoY) 216 (2006) and (b) DoY 210 (2006). The gray dashed line indicates the noise level, the black dash dotted line marks the lowest valid altitude of the individual observation (details in [1]).
Below V1/M1, several radio science observations contain a region with additional excess electron density (Vm/Mm, Figure 2b). Those features occur in a wide variety of shapes and were originally attributed to the influx and ionization of meteoroid dust (Mg/Fe based ions). Remote observations of atmospheric Mg+ by the Imaging UltraViolet Spectrograph onboard the Mars Atmosphere and Volatile Evolution spacecraft [3] indicated that the available amount of atmospheric Mg+ is not sufficient to be the sole origin of the Mm identified in Mars Express radio science observations [4]. While certain Mm shapes could be attributed to atmospheric ionization by solar radiation < 2 nm [1], the origin of other shapes remains unclear.
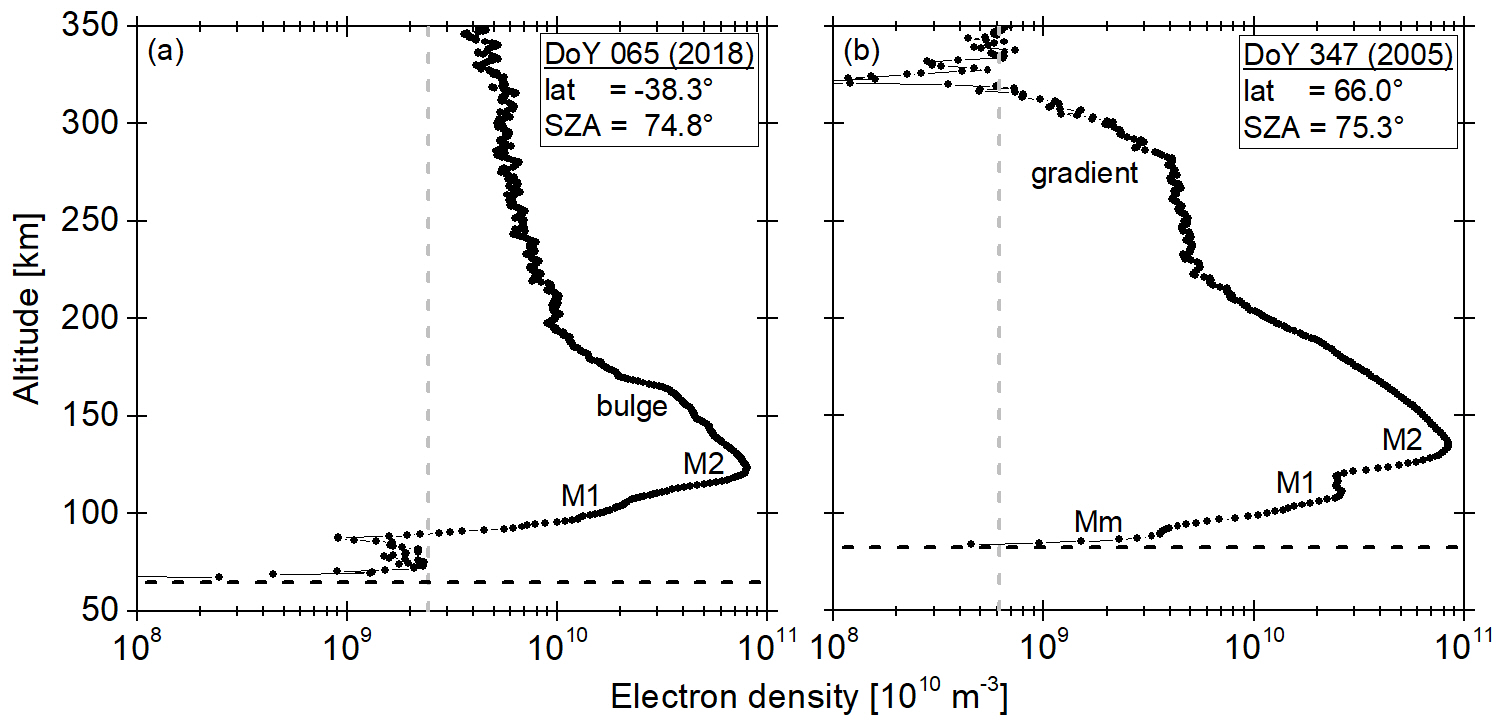
Figure 2: Dayside ionosphere of Mars observed by MaRS on (a) Day of Year (DoY) 065 (2018) and (b) DoY 347 (2005). The labeling is similar to that in Figure 1.
Above the main peak region, a bulge is often present in the ionospheric electron density profile (Figures 1b, 2a). While this feature has also been observed by other spacecraft instruments [5,6], its origin still remains unclear. Above the ionospheric photochemical region, transport processes begin to dominate. The interaction of the planetary ionosphere with the solar wind leads to the formation of a highly variable region, where the observed shapes of the ionospheric topside range from smooth exponential decay (Figures 1a, 2a) to sharp ionopause-like gradients (Figures 1b, 2b).
The radio science experiment VeRa on the Venus Express spacecraft observed the Venus ionosphere from 2006 to 2014. More than 700 radio science observations of the ionospheric electron density from the topside to the ionospheric base were conducted. The Mars Express spacecraft went into orbit around Mars in December 2003. Since then, the Mars Express Radio Science experiment (MaRS) has recorded more than 1,000 high-resolution height profiless of the Mars ionospheric electron density. This work combines the extensive VeRa and MaRS data sets with derived environmental parameters to investigate the similarities and differences of the planetary ionospheres and provides an overview of the currently identified drivers of the ionospheric variability.
References
[1] Peter et al. (2021), Icarus, 359.
[2] Fox et al. (1996), Adv. Space Res., 17, 11.
[3] Crismani et al. (2017), Nature Geoscience, 10.
[4] PhD thesis K. Peter. (2018), https://kups.ub.uni-koeln.de/8110/.
[5] Mayyasi et al. (2018), JGR Space Physics, 123,1.
[6] Kopf et al. (2017), JGR Space Physics, 122, 5.
How to cite: Peter, K., Pätzold, M., Chu, F., Fränz, M., Thiemann, E., Witasse, O., Girazian, Z., Kopf, A., Tellmann, S., Häusler, B., and Bird, M. K.: The variability of the ionospheres of Mars and Venus derived from Mars Express and Venus Express radio science observations, Europlanet Science Congress 2021, online, 13–24 Sep 2021, EPSC2021-509, https://doi.org/10.5194/epsc2021-509, 2021.