Europlanet Science Congress 2021
Virtual meeting
13 – 24 September 2021
Europlanet Science Congress 2021
Virtual meeting
13 September – 24 September 2021
TP10
Ionospheres of unmagnetized or weakly magnetized bodies

TP10

Ionospheres of unmagnetized or weakly magnetized bodies
Convener: Beatriz Sanchez-Cano | Co-conveners: Niklas Edberg, Xiaohua Fang, Christopher Fowler, Francisco González-Galindo, Yingjuan Ma
Tue, 21 Sep, 10:40–11:25 (CEST)

Session assets

Discussion on Slack

Oral and Poster presentations and abstracts

Chairperson: Beatriz Sanchez-Cano
Comet 67P/Churuyumov-Gerasimenko
EPSC2021-67
|
solicited
Hayley Williamson, Hans Nilsson, Gabriella Stenberg Wieser, and Anja Moslinger

Introduction: The Rosetta spacecraft followed the comet 67P/Churyumov-Gerasimenko for two years, through the atmosphere expanding and subsequently contracting with solar distance and cometary activity. Thus, while the spacecraft itself did not travel much, various cometary ionosphere-solar wind interaction regions passed over the spacecraft. The solar wind ion cavity was one such region, when the spacecraft detected no solar wind for a few months surrounding perihelion. Just before and after the solar wind ion cavity, the Rosetta Ion Composition Analyzer (ICA) saw a highly deflected solar wind, with occasionally sunward velocities. This deflection is due to mass loading, which occurs when heavy ions are slowly added via pickup to a fast-moving plasma such as the solar wind. Mass loading is driven by momentum transfer from the solar wind to the cometary pickup ions (primarily H2O+), and so the pickup ions are increasingly directed antisunward, while the solar wind is deflected away from its original path.

Figure 1: Solar wind and cometary ion momentum flux for the whole mission, with case study dates marked.

This momentum transfer is exemplified when comparing the momentum flux of the solar wind to that of the cometary ions. For roughly two months before and after the solar wind ion cavity, the magnitude of the solar wind momentum flux is below that of the pickup ions [1]. At the beginning and end of the mission, when comet activity was low, the solar wind momentum flux dominates. To study mass loading in more detail, we choose two days as case studies: January 23, 2016, where the momentum flux is dominated by the pickup ions, and May 10, 2016, when the solar wind dominates, shown by the red lines in figure 1.

Data: The data used in this study is from ICA, an ion mass spectrometer with a 360x90 degree field of view designed to measure the three-dimensional velocity distribution function of positive ions around comet 67P. ICA has a nominal energy range from a few eV to 40 keV and is capable of distinguishing between protons, helium ions, alpha particles, and water products originating from the comet nucleus [2]. We show the velocity distribution function for both cases in figures 2 and 3. ICA observes distribution function as a function of energy bin, sector, and azimuth angle. We project the distribution function values into cartesian coordinates where x is sunward, y is along B, and z is along E. Each row of figures 2 and 3 shows the 3D distribution projected onto the z and y axes, respectively. One ICA scan, and therefore one distribution function value, takes 192 s. We here show the values summed over a few hours during the case study days when the magnetic field was stable, so as to eliminate changes in the distribution due to a changing magnetic field direction. 

Results:
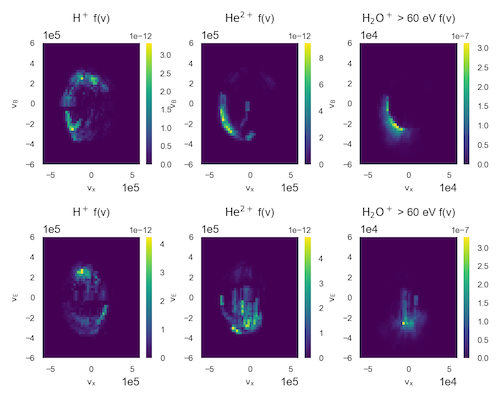
Figure 2: Distributions for H+, He2+, and pickup ions for case 1, January 23, 2016.

Figure 3: Distributions as above for case 2, May 10, 2016.

There is a clear difference for all three species shown between figure 2 and figure 3. Figure 3 shows the more "undisturbed" case, and the solar wind for both the protons and alphas looks relatively beam-like, as would be expected. The pickup ions are sparse during this time, as most of the cometary ions have energies below 60 eV, our chosen cutoff limit to distinguish pickup ions from newborn ions. However, they appear to be scattered into a partial shell distribution, typical for pickup ions.

In figure 2, however, this situation is nearly reversed, with the cometary ions having a more beam-like distribution than the protons, which are smeared in phase angle. The protons have both sunward and antisunward (+/- x) velocity, which is also reflected in the momentum flux for this day. Surprisingly, the alpha particles look more similar to the pickup ions. This is likely because, due to their larger mass, their gyroradius in this case is closer to that of the pickup ions than the protons. The reverse is true for figure 3, when the pickup ions have a much larger gyroradius.

While the proton distribution in figure 2 looks like a shell, the time evolution of the distribution shows that it is actually rotating in time, even though the magnetic field is not changing. This makes it a rotating non-gyrotropic distribution, which are most commonly seen in magnetosheaths such as at comet 1P/Halley and comet 26P/Grigg-Skjelleup for the pickup ions, not the protons [3,4]. 

Discussion: Models show rotating non-gyrotropic distributions for cometary pickup ions when their density is a fraction of the proton density. In case 1, however, the proton density is roughly 12% of the pickup ion density. Therefore, we suggest that due to the dominance of the pickup ions in case 1, the solar wind is mass loaded enough that the pickup ions and protons essentially switch roles. This could happen downstream of a bow shock (e.g. in a magnetosheath) that was not directly detected by Rosetta. However, detections of an "infant bow shock" and warm, broadened proton distributions during the same time period also suggest the spacecraft was downstream of a shock [5,6]. Because the protons are affected, but not the alphas, this indicates a phenomenon with a scale on the order of the proton gyroradius, but smaller than the alpha gyroradius, which would be possible for a narrow shock structure. Thus it is likely that case 1 is inside a nascent cometosheath downstream of a bow shock, similar to magnetosheaths seen at unmagnetized planets such as Mars.

[1] H. N. Williamson et al. Geophys. Res. Lett.47.15 (2020).

[2] H. Nilsson et al. Space Sci. Rev.128.1-4 (2007), pp. 671–695.

[3] U. Motschmann et al. Ann. Geophys.15.6 (1997), pp. 603–613.

[4] U. Motschmann et al. Ann. Geophys.17.5 (1999), pp. 613–622.

[5] H. Gunell et al. Astron. Astrophys.619. March 2015 (2018), pp. 1–5.

[6] C. Goetz et al. Ann. Geophys. October (2020), pp. 1–23.

How to cite: Williamson, H., Nilsson, H., Stenberg Wieser, G., and Moslinger, A.: The development of a cometosheath at comet 67P Churyumov-Gerasimenko, Europlanet Science Congress 2021, online, 13–24 Sep 2021, EPSC2021-67, https://doi.org/10.5194/epsc2021-67, 2021.

EPSC2021-344
|
ECP
Charlotte Goetz, Lucie Scharre, Cyril Simon-Wedlund, Hans Nilsson, Elias Odelstad, Matthew Taylor, and Martin Volwerk

Against expectations, the Rosetta spacecraft was able to observe protons of solar wind origin in the diamagnetic cavity at comet 67P/Churyumov-Gerasimenko. This study investigates these unexpected observations and gives a working hypothesis on what could be the underlying cause.

The cometary plasma environment of a comet is shaped by two distinct plasma populations: the solar wind, consisting of protons, alpha particles, electrons and a magnetic field, and the cometary plasma, consisting of heavy ions such as water ions or carbon dioxide ions and electrons. 
As the comet follows its orbit through the solar system, the amount of cometary ions that is produced varies significantly. This means that the plasma environment of the comet and the boundaries that form there are also dependent on the comet's heliocentric distance. 

For example, at sufficiently high gas production rates (close to the Sun) the protons from the solar wind are prevented from entering the inner coma entirely. The region where no protons (and other solar wind origin ions) can be detected is referred to as the solar wind ion cavity. 
A second example is the diamagnetic cavity, a region very close to the nucleus of the comet, where the interplanetary magnetic field, which is carried by the solar wind electrons, cannot penetrate the densest part of the cometary plasma. 

The Rosetta mission clearly showed that the solar wind ion cavity is larger than the diamagnetic cavity at a comet such as 67P/Churyumov-Gerasimenko. However, this new study finds that in isolated incidences this order can be reversed and ions of solar wind origin (mostly protons, but also helium) can be detected inside the diamagnetic cavity. We present the observations pertaining to these events and list and discard possible mechanisms that could lead to such a configuration. Only one mechanism cannot be discarded: that of a solar wind configuration where the solar wind velocity is aligned with the magnetic field. We show evidence that fits this hypothesis as well as solar wind models in support. 

How to cite: Goetz, C., Scharre, L., Simon-Wedlund, C., Nilsson, H., Odelstad, E., Taylor, M., and Volwerk, M.: Solar wind protons in the diamagnetic cavity at comet 67P/Churyumov-Gerasimenko, Europlanet Science Congress 2021, online, 13–24 Sep 2021, EPSC2021-344, https://doi.org/10.5194/epsc2021-344, 2021.

EPSC2021-823
Peter Stephenson, Marina Galand, Jan Deca, Pierre Henri, and Gianluca Carnielli

The Rosetta Mission rendezvoused with comet 67P/Churyumov-Gerasimenko in August 2014 and escorted it for two years along its orbit. The Rosetta Plasma Consortium (RPC) was a suite of instruments, which observed the plasma environment at the spacecraft throughout the escort phase. The Mutual Impedance Probe (RPC/MIP; Wattieaux et al, 2020; Gilet et al., 2020) and Langmuir Probe (RPC/LAP; Engelhardt et al., 2018), both part of RPC, measured the presence of a cold electron population within the coma.

Newly born electrons, generated by ionisation of the neutral gas, form a warm population within the coma at ~10eV. Ionisation is either through absorption of extreme ultraviolet photons or through collisions of energetic electrons with the neutral molecules. The cold electron population is formed by cooling the newly born, warm electrons via electron-neutral collisions. Assuming the radial outflow of electrons, the cold population was only expected at comet 67P close to perihelion, where outgassing rate from the nucleus was at its highest (Q > 1028 s-1). However, cold electrons were observed until the end of the Rosetta mission at 3.8au when the outgassing was weak (Q<1026 s-1). Under the radial outflow assumption, there should not have been sufficient neutral gas to efficiently degrade the electron energies.

We have developed the first 3D collision model of electrons at a comet. Self-consistently calculated electric and magnetic fields from a collisionless and fully-kinetic Particle-in-Cell model (Deca et al., 2017; 2019) are used as a stationary input for the test particle simulations. We model the neutral coma as a spherically symmetric cloud of pure water, which follows 1/r2 in cometocentric distance. Electron-neutral collisions are treated as a stochastic process using cross sections from Itikawa and Mason (2005). The model incorporates elastic scattering of electrons and a variety of inelastic collisions, including excitation and ionization of the water molecules.

We show that the radial outflow of electrons from the coma is insufficient to generate a cold electron population under weak outgassing conditions. Using our original test particle model, we demonstrate the trapping of electrons in the inner coma by an ambipolar electric field and how this increases the efficiency of the electron cooling.  We also show that, at low outgassing rates, electron-neutral collisions significantly cool electrons within the coma and can lead to the formation of a cold population.


How to cite: Stephenson, P., Galand, M., Deca, J., Henri, P., and Carnielli, G.: Forming a cold electron population at a weakly outgassing comet, Europlanet Science Congress 2021, online, 13–24 Sep 2021, EPSC2021-823, https://doi.org/10.5194/epsc2021-823, 2021.

Venus
EPSC2021-16
Martin Volwerk and the the Bepi Venus 1 MAG Team

Out of the two Venus flybys that BepiColombo uses as a gravity assist manoeuvre to finally arrive at Mercury, the first took place on 15 October 2020. After passing the bow shock, the spacecraft travelled along the induced magnetotail, crossing it mainly in the YVSO-direction. We discuss the BepiColombo Mercury Planetary Orbiter Magnetometer (MPOMAG)
data, with support from three other plasma instruments: the Planetary Ion Camera (PICAM), the Mercury
Electron Analyser (MEA) and the radiation monitor (BERM). Behind the bow shock crossing, the magnetic field showed a
draping pattern consistent with field lines connected to the interplanetary magnetic field wrapping around the planet. This flyby showed a highly active magnetotail, with, e.g., strong flapping motions at a period of ~7 min. This activity was driven by solar wind conditions. Just before this flyby, Venus’s induced magnetosphere was impacted by a stealth coronal mass ejection, of which the trailing side was still interacting with it during the flyby. This flyby is a unique opportunity to study the full length and structure of the induced magnetotail of Venus, indicating that the tail was most likely still present at about 48 Venus radii. This presentation will take place after the second Venus flyby by Solar Orbiter and BepiColombo and Solar Orbiter on 9 and 10 August, respectively.

How to cite: Volwerk, M. and the the Bepi Venus 1 MAG Team: Venus’s induced magnetosphere during active solar wind conditionsat BepiColombo’s Venus 1 flyby, Europlanet Science Congress 2021, online, 13–24 Sep 2021, EPSC2021-16, https://doi.org/10.5194/epsc2021-16, 2021.

EPSC2021-517
|
ECP
Moa Persson, Yoshifumi Futaana, Andrey Fedorov, Nicolas André, and Stas Barabash

Introduction
The Venusian ionosphere interacts directly with the solar wind, and forms an induced magnetosphere. The interaction transfers energy from the solar wind to the ionospheric ions, and causes some ions to escape into the induced magnetotail (Futaana et al., 2017; Persson et al., 2020). In the magnetotail, the ions do not simply flow from Venus and outward to space. The ion flows have an additional component back towards Venus: return flows (Kollmann et al., 2016; Persson et al., 2018). These return flows was shown to decrease the total average escape rates from Venus for both H+ and O+ ions (Persson et al., 2018). In this study, we delve deeper into the structure of the ion flows in the magnetotail in order to provide further insight into these return flows.

Method
To analyse the ion flows we use the Ion Mass Analyser (IMA), a part of the ASPERA-4 instrument suite (Barabash et al., 2007b), on board Venus Express. IMA is a top-hat electrostatic analyser with an energy range of 0.01-36 keV, with ΔE/E=7%. The mass separating capabilities allows us to efficiently separate the lighter H+ from the heavier O+ ions. From the electrostatic deflector plates and the cylindrical symmetry the field-of-view has a resolution of 5.6x22.5˚ for each of the 16x16 pixels, which gives a total field-of-view of 90x360˚.

We use the full dataset of IMA from 2006 to 2014 to calculate average ion velocity distributions. We combine the measurements by location in the magnetotail. As the induced magnetotail of Venus is structured by the direction of the upstream Interplanetary Magnetic Field (IMF) and the solar wind motional electric field (Jarvinen et al., 2013; McComas et al., 1986; Pérez‐de‐Tejada, 2001), we use the direction of the IMF to group the measurements together. The average ion distributions are then used to analyse the structure of flows in the magnetotail, in order to provide further insight in the return flow mechanisms.

Results and discussion
The structure of the magnetotail with respect to the solar wind motional electric field implies a difference in the ion flows between the hemisphere where the electric field points away from Venus (+E) and the hemisphere where the electric field points towards Venus (-E). The magnetic field draping in the -E hemisphere provides a more narrow draping near the plasma sheet, which indicates a preference for magnetic reconnection (Zhang et al., 2010). If magnetic reconnection is the main mechanism that causes the return flows, we therefore expect a preference of return flows in the -E hemisphere. 

Preliminary results indicate that there is no clear dependence of the return flow with +E or -E hemisphere. In agreement with previous studies, our results show that the main anti-sunward acceleration in the magnetotail occurs in the +E hemisphere (Barabash et al., 2007a; Fedorov et al., 2011). However, the unclear relationship of the return flows with hemisphere warrants a further investigation. In this presentation, we present our results of an expanded study where we will have investigated the ion flows in the magnetotail in further detail to see if there is a preferred location or condition where the return flows are appearing.

References
Barabash, et al. (2007a). The loss of ions from Venus through the plasma wakes. Nature, 450(7170), 650–653. https://doi.org/10.1038/nature06434

Barabash, et al. (2007b). The Analyser of Space Plasmas and Energetic Atoms (ASPERA‐4) for the Venus Express mission. Planetary and Space Science, 55(12), 1772–1792. https://doi.org/10.1016/j. pss.2007.01.014 

Fedorov, et al. (2011). Measurements of the ion escape rates from Venus for solar minimum. Journal of Geophysical Research, 116, A07220. https://doi.org/10.1029/2011JA016427 

Futaana, et al. (2017). Solar wind interaction and impact on the Venus atmosphere. Space Science Reviews, 212(3‐4), 1453–1509. https://doi.org/10.1007/s11214‐017‐0362‐8 

Jarvinen, et al. (2013). Hemispheric asymmetries of the Venus plasma environment. Journal of Geophysical Research: Space Physics, 118, 4551–4563. https://doi.org/10.1002/jgra.50387 

Kollmann, et al. (2016). Properties of planetward ion flows in Venus' magnetotail. Icarus, 274, 73–82. https://doi.org/10.1016/j.icarus.2016.02.053 

McComas, et al. (1986). The average magnetic field draping and consistent plasma prop- erties of the Venus magnetotail. Journal of Geophysical Research, 91(A7), 7939–7953. https://doi.org/10.1029/JA091iA07p07939 

Pérez‐de‐Tejada, H. (2001). Solar wind erosion of the Venus polar ionosphere. Journal of Geophysical Research, 106(A1), 211–219. https:// doi.org/10.1029/1999JA000231 

Persson, et al. (2018). H+/O+ escape rate ratio in the Venus magnetotail and its dependence on the solar cycle. Geophysical Research Letters, 124, 4597–4607. https://doi.org/10.1029/2018JA026271 

Persson, et al. (2020). The Venusian atmospheric oxygen ion escape: Extrapolation to the Early Solar System. Journal of Geophysical Research: Planets, 125. https://doi. org/10.1029/2019JE006336

Zhang, et al. (2010). Hemispheric asymmetry of the magnetic field 
wrapping pattern in the Venusian magnetotail. Geophysical Research Letters, 37, L14202. https://doi.org/10.1029/2010GL044020 

How to cite: Persson, M., Futaana, Y., Fedorov, A., André, N., and Barabash, S.: Structure of ion flows in the magnetotail of Venus, Europlanet Science Congress 2021, online, 13–24 Sep 2021, EPSC2021-517, https://doi.org/10.5194/epsc2021-517, 2021.

EPSC2021-33
|
ECP
Shaosui Xu, Rudy Frahm, Yingjuan Ma, David Mitchell, and Janet Luhmann

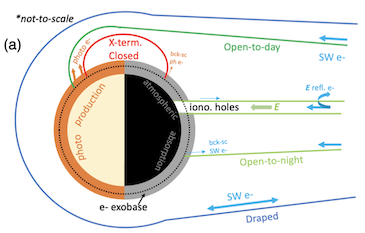
Venus lacks significant intrinsic magnetic fields and thus its atmosphere and ionosphere interact directly with the solar wind flow and magnetic fields. Interplanetary magnetic fields (IMF) can penetrate into the ionosphere when the upstream solar wind dynamic is stronger than the ionospheric plasma pressure. Magnetic topology can be inferred at Venus if it is defined as the magnetic connectivity to the collisional atmosphere/ionosphere, rather than connectivity to the planet’s surface. Utilizing electron and magnetic field measurements from the Venus Express mission, this study provides the first characterization of magnetic topology at Venus by examining the pitch angle and energy distribution of superthermal (> ~1 eV) electrons. More specifically, the presence of loss cones in electron pitch angle distributions infers the connectivity to the nightside collisional atmosphere and the presence of ionospheric photoelectrons (identified from electron energy distributions) indicates the connectivity to the dayside collisional ionosphere. We show case examples of various magnetic topology types at Venus, including the most expected draped IMF, open field lines connected to the nightside atmosphere, open field lines connected to the dayside ionosphere, and, most surprisingly, cross-terminator closed field lines. More interestingly, during one of the ionospheric hole events identified by Collinson et al. [2014, JGRA], we discover not only the expected open magnetic topology but also a field-aligned potential drop, which has implications for its formation mechanism. The characterization of magnetic connectivity could provide new insights into many important topics on Venus, such as planetary ion outflow, energetic electron precipitation (possible auroral emission), and the formation mechanism of Venusian ionospheric holes.

How to cite: Xu, S., Frahm, R., Ma, Y., Mitchell, D., and Luhmann, J.: Magnetic topology at Venus: new insights to the Venus plasma environment, Europlanet Science Congress 2021, online, 13–24 Sep 2021, EPSC2021-33, https://doi.org/10.5194/epsc2021-33, 2021.

EPSC2021-87
Hector Pérez-de-Tejada and Rickard Lundin

SOUTHBOUND DISPLACEMENT OF VORTEX STRUCTURES IN THE VENUS WAKE

  • Pérez-de-Tejada (Institute of Geophysics, UNAM, Mexico) hectorperezdetejada@gmail.com


  • Lundin (Swedish Space Research Institute, Kiruna, Sweden)

 rickard.lundin@irf.se


1 – VEX Data


From measurements conducted with the Venus Express spacecraft (VEX) it has been possible to identify vortex structures within the Venus plasma wake (Pérez-de-Tejada et al., INTECH (ISBN 978-953-51-0880), 2012; Lundin et al., GRL 40(7), 273, 2013). Such features derive from the energy spectra of the solar wind H+ and planetary O+ ions measured with the ASPERA instrument and are reproduced in Figure 1. The energy spectra of the O+ ion component (second panel) indicate the presence of appreciable planetary O+ ion fluxes between 02:05 UT and 02:30 UT and that lead to their enhanced density and speed values.  


Figure 1. Energy spectra of the H+ and O+ ions (upper panels) measured during the Sept 26-2009 VEX orbit in the Venus wake by the midnight plane (small Y-values at the bottom of the figure). Between 02:05 UT and 02:30 UT there are enhanced O+ density and speed values (third and fifth panels).  


2 - Vortex Structures in the Venus wake


A comparative view of the distribution of the vortex structures on the XZ plane obtained in different VEX orbits is presented in Figure 2 to show the position of the VEX entry and exit crossings in orbits that probed near the midnight plane. Most notable is a general tendency for the vortex structure to be displaced toward the southern hemisphere with decreasing distance downstream from Venus. At larger (negative) X-values the vortex is located at larger (negative) Z-values. Two sets with 4 orbits corresponding to measurements made in 2006 and in 2009 indicate a different displacement of the vortex structures in that plane. There is a general preference of those features to occur closer to Venus in the 2009 measurements since their passage across the Z = 0 axis is by X = -1.7 RV in that set while it reaches X = -2.2 RV in the 2006 measurements. This difference implies that the vortex structures are located closer to Venus during solar cycle minimum conditions by 2009 and that their position along the wake varies during that cycle.


  • Figure 2. Position of the VEX spacecraft projected on the XZ plane during its entry (inbound) and exit (outbound) through a vortex structure in orbits traced by the midnight plane. The two traces correspond to 4 orbits in 2006 and 2009 (Pérez-de-Tejada and Lundin, ICARUS, submitted 2021).


3 – Origin of the southbound displacement


A dominant feature in the motion of the solar wind particles that stream around the Venus ionosphere is that they experience local heating when they move over its polar regions. That heating derives from dissipation processes produced by the transport of solar wind momentum to the Venus polar ionosphere where there is a reduced local pile up of the solar wind magnetic field fluxes. As a result the solar wind plasma expands by thermal pressure forces and thus moves into the Venus wake from both polar regions. An implication of that displacement is that there are two different flows of plasma particles reaching the central wake from two opposite directions along the Z-axis. Both flows move from a region where the planetary O+ ions first experience a week polar rotation around Venus and then are displaced to lower latitudes where the rotation speed of the local planetary ions around the planet is larger. Since both plasma flows also move along the X-axis following the solar wind direction there should be a Coriolis force that deflects them along the Y-axis. For both flows the deflection should be in opposite direction to each other since in the north hemisphere it will move in the –Z sense and in the south hemisphere in the +Z-sense. In addition to this motion they will also be influenced by the effects of a general Magnus force that drives all planetary ions to move around the planet with a velocity component directed in the +Y sense (Pérez-de-Tejada, JGR, 111(A11), 2006). 


Since the latter force is contrary to the direction of motion along the -Y sense imposed by the Coriolis force for the O+ ions in the south hemisphere their resulting total velocity will be smaller than that for the O+ ions in the upper hemisphere where the velocity components implied by the Coriolis and by the Magnus force are directed in the same sense along the +Y axis. An implication of that velocity difference between both hemispheres is that the momentum of the planetary O+ ions along the Y-axis in the south hemisphere is smaller than that for the O+ ions that move in the north hemisphere. Also, from such momentum difference in the XY plane there will be a tendency for the velocity component of the planetary ions moving along the +Z-axis in the south hemisphere to contribute with a fraction of their own momentum to balance the momentum difference in the XY plane. Consequently, a fraction of the momentum of the O+ ion fluxes that move north along the Z-axis will be transferred to that in the Y-sense to compensate for the smaller values of their momentum with respect to the larger +Y-directed momentum values of the O+ ions in the north hemisphere. Thus, there will be smaller values in the momentum of the O+ ions that drive north along the Z-axis in the south hemisphere. Under such conditions the momentum of the O+ ions that are directed south in the north hemisphere will be dominant over that directed north in the south hemisphere. As a result the motion of the O+ ions in the north hemisphere will force the entire vortex structure to be displaced south in the –Z direction. Such an effect is in agreement with the profiles on the XZ plane of the VEX position where the vortex structures measured during the 2006 and 2009 orbits become displaced to lower –Z values with increasing distance downstream from Venus as indicated in Figure 2.

How to cite: Pérez-de-Tejada, H. and Lundin, R.: Southbound Displacement of Vortex Structures in the Venus wake, Europlanet Science Congress 2021, online, 13–24 Sep 2021, EPSC2021-87, https://doi.org/10.5194/epsc2021-87, 2021.

Venus-Mars
EPSC2021-170
Riku Jarvinen, Esa Kallio, and Tuija Pulkkinen

We investigate the effect of foreshock ultra-low frequency (ULF) waves on the solar wind induced heavy ion escape from Venus and Mars in a global hybrid model. The foreshock ULF waves are excited by backstreaming ion populations scattered at the quasi-parallel bow shock, and convect downstream with the solar wind. In the model, the waves affect magnetic and electric fields in the Venusian and Martian plasma environments causing fluctuations in the heavy ion acceleration processes such as the solar wind ion pickup. This leads to significant modulations in global escape rates of ionized planetary volatiles at the ULF wave frequency. We study this process in a global hybrid model, where ions are treated as particle clouds moving under the Lorentz force and electrons are a charge-neutralizing fluid. The analyzed simulation runs use more than 200 simulation particle clouds per cell on average to allow enough velocity space resolution for resolving foreshock, wave phenomena and ion escape processes self-consistently. We find that at Venus the global ion escape is modulated by the ULF waves even under nominal solar wind and IMF upstream conditions, while at Mars the modulation becomes significant under a strongly radial IMF orientation.

How to cite: Jarvinen, R., Kallio, E., and Pulkkinen, T.: Modulation of ion escape by ultra-low frequency waves at Venus and Mars in a global hybrid simulation, Europlanet Science Congress 2021, online, 13–24 Sep 2021, EPSC2021-170, https://doi.org/10.5194/epsc2021-170, 2021.

EPSC2021-509
|
solicited
Kerstin Peter, Martin Pätzold, Feng Chu, Markus Fränz, Ed Thiemann, Oliver Witasse, Zachary Girazian, Andrew Kopf, Silvia Tellmann, Bernd Häusler, and Michael K Bird

While the orbital and environmental parameters (e.g. orbit-Sun-distance, planetary mass/diameter, gravity acceleration, rotation rate, surface pressure) of Venus and Mars are very different, their planetary ionospheres show many similarities.

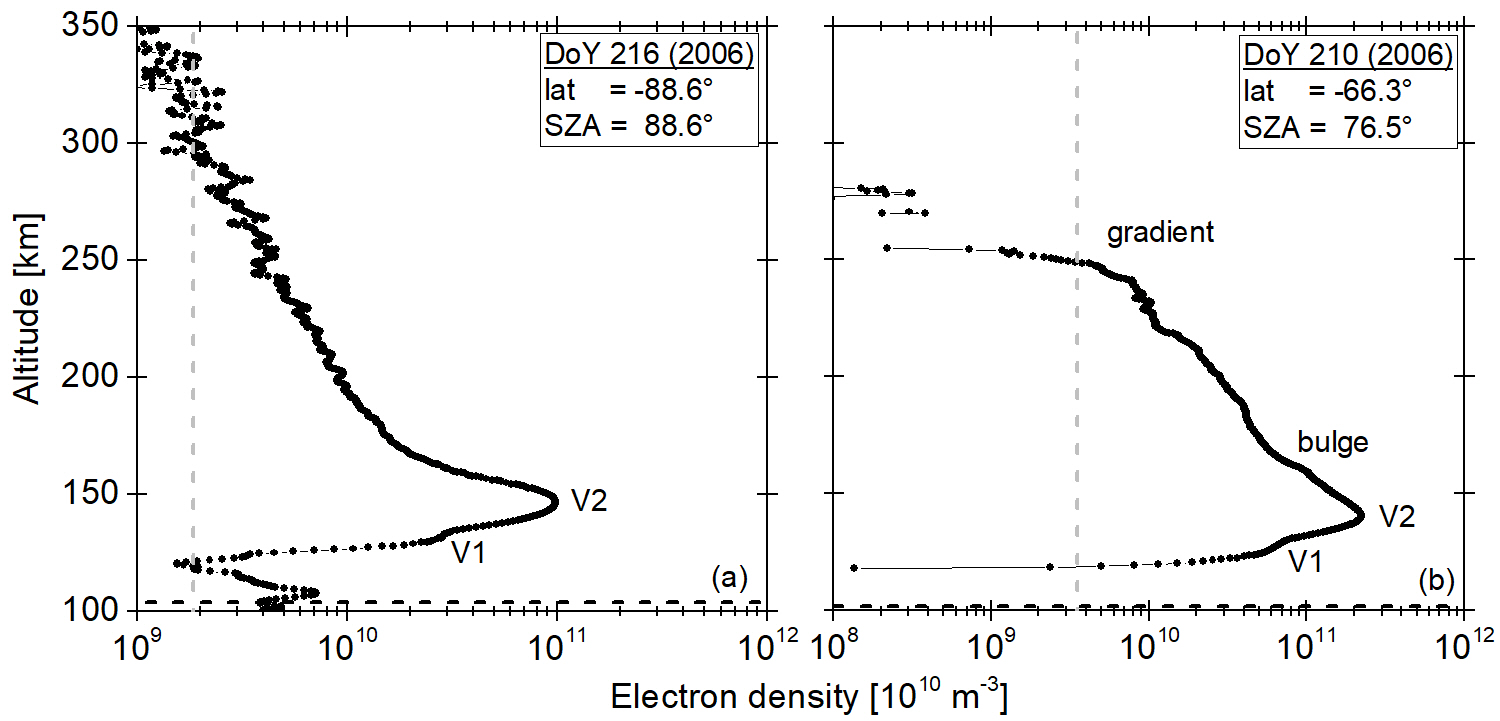
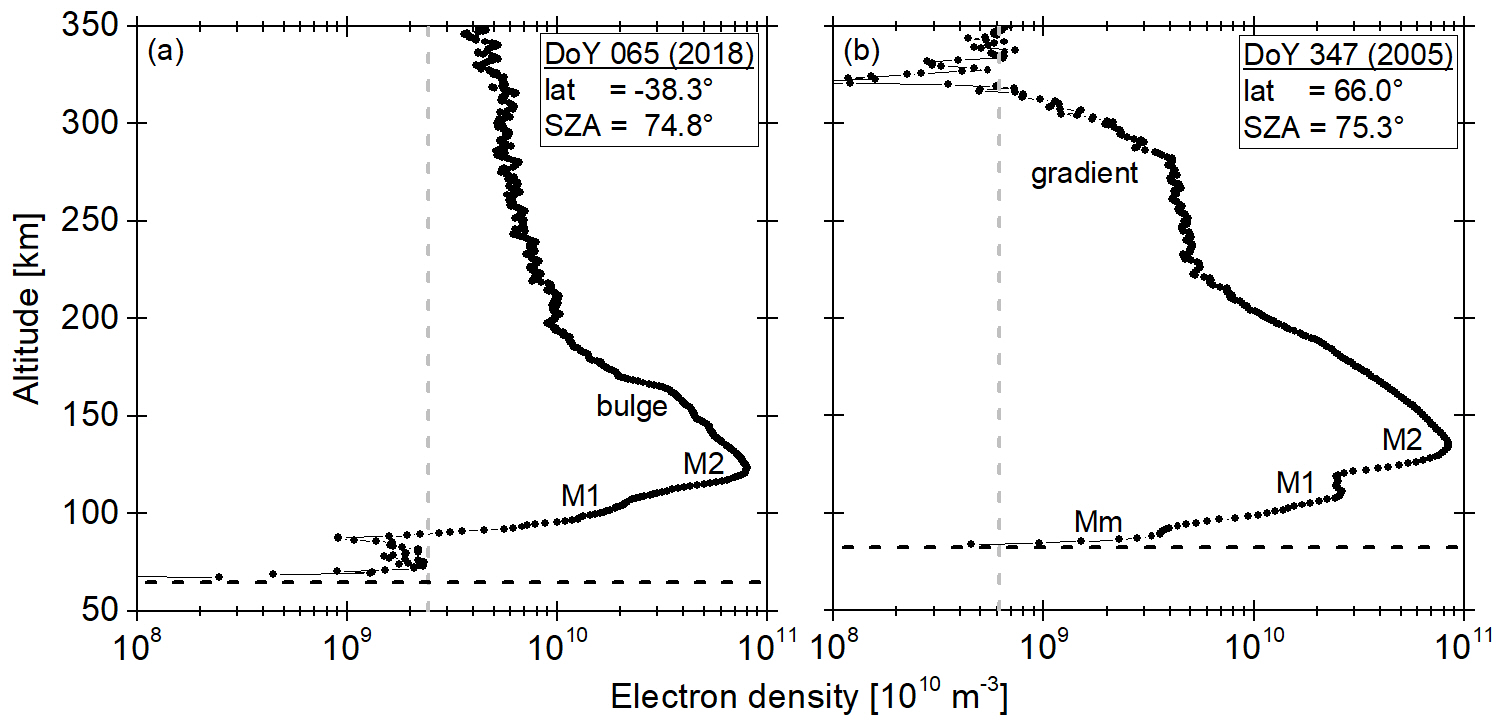
Figures 1 and 2 illustrate the variability of the Venus and Mars dayside ionospheres. Both planetary dayside ionospheres contain a pronounced main peak region (V2/M2) originating mostly from the photoionization of the CO2 based atmosphere by solar extreme ultraviolet radiation. The region below the main peak (V1/M1) has its origin in the primary and secondary impact ionization of the neutral atmosphere by solar X-ray radiation [2]. The observed shape of the V1/M1 region in radio science observations ranges from a secondary peak (Figure 2b) to a smooth decrease in electron density without a pronounced V1/M1 feature.

Figure 1: Dayside ionosphere of Venus observed by VeRa on (a) Day of Year (DoY) 216 (2006) and (b) DoY 210 (2006). The gray dashed line indicates the noise level, the black dash dotted line marks the lowest valid altitude of the individual observation (details in [1]).

Below V1/M1, several radio science observations contain a region with additional excess electron density (Vm/Mm, Figure 2b). Those features occur in a wide variety of shapes and were originally attributed to the influx and ionization of meteoroid dust (Mg/Fe based ions). Remote observations of atmospheric Mg+ by the Imaging UltraViolet Spectrograph onboard the Mars Atmosphere and Volatile Evolution spacecraft [3] indicated that the available amount of atmospheric Mg+ is not sufficient to be the sole origin of the Mm identified in Mars Express radio science observations [4]. While certain Mm shapes could be attributed to atmospheric ionization by solar radiation < 2 nm [1], the origin of other shapes remains unclear.

Figure 2: Dayside ionosphere of Mars observed by MaRS on (a) Day of Year (DoY) 065 (2018) and (b) DoY 347 (2005). The labeling is similar to that in Figure 1.

Above the main peak region, a bulge is often present in the ionospheric electron density profile (Figures 1b, 2a). While this feature has also been observed by other spacecraft instruments [5,6], its origin still remains unclear. Above the ionospheric photochemical region, transport processes begin to dominate. The interaction of the planetary ionosphere with the solar wind leads to the formation of a highly variable region, where the observed shapes of the ionospheric topside range from smooth exponential decay (Figures 1a, 2a) to sharp ionopause-like gradients (Figures 1b, 2b).

The radio science experiment VeRa on the Venus Express spacecraft observed the Venus ionosphere from 2006 to 2014. More than 700 radio science observations of the ionospheric electron density from the topside to the ionospheric base were conducted. The Mars Express spacecraft went into orbit around Mars in December 2003. Since then, the Mars Express Radio Science experiment (MaRS) has recorded more than 1,000 high-resolution height profiless of the Mars ionospheric electron density. This work combines the extensive VeRa and MaRS data sets with derived environmental parameters to investigate the similarities and differences of the planetary ionospheres and provides an overview of the currently identified drivers of the ionospheric variability.


References

  [1] Peter et al. (2021), Icarus, 359.

  [2] Fox et al. (1996), Adv. Space Res., 17, 11.

  [3] Crismani et al. (2017), Nature Geoscience, 10.

  [4] PhD thesis K. Peter. (2018), https://kups.ub.uni-koeln.de/8110/.

  [5] Mayyasi et al. (2018), JGR Space Physics, 123,1.

  [6] Kopf et al. (2017), JGR Space Physics, 122, 5.

How to cite: Peter, K., Pätzold, M., Chu, F., Fränz, M., Thiemann, E., Witasse, O., Girazian, Z., Kopf, A., Tellmann, S., Häusler, B., and Bird, M. K.: The variability of the ionospheres of Mars and Venus derived from Mars Express and Venus Express radio science observations, Europlanet Science Congress 2021, online, 13–24 Sep 2021, EPSC2021-509, https://doi.org/10.5194/epsc2021-509, 2021.

Mars
EPSC2021-305
Charlie Bowers, James Slavin, Gina DiBracccio, Yuki Harada, and Shaosui Xu

At Mars, the conductive ionosphere and localized, crustal magnetic anomalies interact with the upstream solar wind creating a unique, hybrid magnetosphere. As the interplanetary magnetic field (IMF) lines encounter the planet, the nature of their interaction with the magnetosphere will vary depending on whether they encounter regions in which crustal anomalies are absent, primarily in the northern hemisphere, or regions of strong (100-1000 nT at the surface) crustal magnetic fields, primarily in the southern hemisphere. Around regions of weak crustal magnetic fields, the IMF first encounters the conducting ionosphere of Mars and drapes around the obstacle analogous to the dayside of planets without global intrinsic magnetosphere. Around regions of strong crustal fields, the magnetic anomalies protrude out into space and create a “mini-magnetospheric” interaction between the draped IMF and the crustal anomalies analogous to the dayside of planets with a global intrinsic dipole field. Previous studies at Mars using both the Mars Global Surveyor (MGS) and Mars Atmosphere and Volatile EvolutioN (MAVEN) observations have found evidence of complex dynamics within these mini-magnetospheres within the dayside ionosphere, including current sheets, and magnetic flux ropes. Both these phenomena play a role in plasma transport and acceleration within the ionosphere and are associated with magnetic reconnection, which implicates a variety of dynamic process in planetary magnetospheres. 

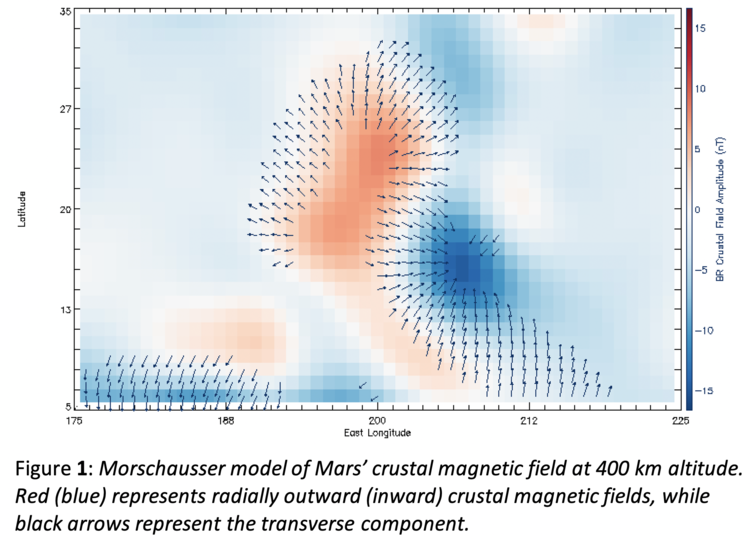
In this study, we focus a single crustal anomaly region (CF1) in the northern Martian magnetosphere (~185°-215° longitude, ~5°-30° latitude (Figure 1)). Despite the magnetic moment of this anomaly being roughly 9 times weaker than those of strongest anomalies at Mars, it still shows evidence for dynamic interactions between the anomaly and the draped IMF. Here, we present analysis of current sheets and magnetic flux ropes found directly downstream from CF1 using magnetic field data taken by the magnetometer (MAG) instrument on board MAVEN. We also use data from the Solar Wind Electron Analyzer instrument to estimate magnetic topology, known as the topology score. This parameter distinguishes among 7 magnetic topologies and allows us to analyze the magnetic connectivity of the lobes of the current sheets and the likely formation mechanism of the flux ropes.

Limiting our search to regions where MAVEN was on the dayside sampling at low altitude (<1000 km) around this anomaly, we used a modified version of previously developed procedures to search MAVEN MAG data for the quick magnetic field rotations that define current sheet crossings. We have identified 15 current sheets in the regions surrounding CF1 within the dayside ionosphere of Mars. Of the 15 current sheets, we see examples of 3 magnetic topologies exhibited within the lobes (closed-dayside, open-dayside, and draped). This suggests the magnetic field lines that comprise the lobes of the current sheets may have a variety of sources on either side of the current sheet. For example, current sheets around CF1 may be formed at the interface between the draped IMF and crustal anomaly, between the crustal field lines themselves, or between multiple draped IMF field lines on top of the anomaly.

Magnetic flux ropes on the dayside of Mars are thought to have multiple formation mechanisms, some involving magnetic reconnection of a current sheet. We visually inspected MAG data for over 300 orbits to search for flux ropes near CF1 and applied Minimum Variance Analysis to identify these structures and determine their orientation. From these 300 orbits, we identified 10 magnetic flux ropes in the near-downstream region of CF1. These flux ropes exhibit the same 3 topology scores as those measured in current sheets. Previous studies have suggested the topology of a flux rope detected on the dayside of Mars indicates its likely formation mechanism. Flux ropes in our database suggest a variety of interesting processes occurring around CF1, including magnetic reconnection between the draped field and the transverse component of the magnetic anomaly.

The detection of current sheets and flux ropes with a variety of topologies near a single, weak crustal anomaly in the northern hemisphere suggests that “mini-magnetospheric” processes are not limited to regions of strong crustal fields found in the southern hemisphere. The properties of these current sheets and flux ropes, including their topology score, suggest a variety of interesting processes including magnetic reconnection with multiple sources of magnetic field lines on either side of the X-line. Furthermore, CF1 only protrudes out to low-altitudes (<350 km) during nominal solar wind conditions, which is slightly above where the atmosphere of Mars is collisional, suggesting ion-neutral collisions may play a role in these dynamics. Our identification of these processes at Mars will further our understanding of the dynamics that comprise the complex coupling between planetary magnetospheres and atmospheres, as well as their interaction with the solar wind.

How to cite: Bowers, C., Slavin, J., DiBracccio, G., Harada, Y., and Xu, S.: MAVEN Observations of Mini-Magnetosphere Dynamics within the Dayside Ionosphere of Mars, Europlanet Science Congress 2021, online, 13–24 Sep 2021, EPSC2021-305, https://doi.org/10.5194/epsc2021-305, 2021.

EPSC2021-797
|
ECP
Energization of ions near the terminator in the ionosphere of Mars.
(withdrawn)
Lukas Maes, Markus Fraenz, and Romain Maggiolo
EPSC2021-195
|
ECP
Beatriz Sanchez-Cano, Mark Lester, Marco Cartacci, Roberto Orosei, Olivier Witasse, Pierre-Louis Blelly, and Wlodek Kofman

Mars Express has been exploring Mars since late 2003 giving us fascinating views of the red planet as well as unique science insights. The long-life of Mars Express is an asset in order to understand the long-term evolution of the atmosphere of Mars, and in particular, of the ionosphere and upper atmosphere. Currently, we have about 16 years of ionospheric observations at Mars, which cover near two cycles of solar activity. This is the first time that such a long time series observations can be investigated in other planet rather than Earth.  In particular, this work focuses on Mars’ ionospheric behaviour during two consecutive solar minima (23/24 and 24/25) using the same dataset. We use the Mars Advanced Radar for Subsurface and Ionospheric Sounding (MARSIS) on board Mars Express to investigate the total electron content behaviour of the whole atmosphere in relation to key parameters, such as the solar flux, solar illumination, dust storms and Sun-Mars distance. The topside variability of the ionosphere is also investigated through variations in the neutral scale height, and results are supported by ionospheric modelling. The main goal of this study is to investigate whether the ionosphere during the recent solar minimum 24/25 was similar (and to which degree) to the ionosphere at solar minimum 23/24, which was characterised by a pronounced reduction of both the topside and bottomside regions.

How to cite: Sanchez-Cano, B., Lester, M., Cartacci, M., Orosei, R., Witasse, O., Blelly, P.-L., and Kofman, W.: Mars ionosphere during two consecutive solar minima, Europlanet Science Congress 2021, online, 13–24 Sep 2021, EPSC2021-195, https://doi.org/10.5194/epsc2021-195, 2021.

EPSC2021-601
Mark Lester, Beatriz Sanchez-Cano, and Hermann Opgenoorth

Large scale solar wind disturbances such as Interplanetary Coronal Mass Ejections (ICMEs) have a major impact on planetary systems.  At Mars, for example, Solar Energetic Particles released during the process that creates the ICME cause large scale radar blackouts as a result of enhanced ionisation at lower altitudes than normal.  The increased absorption of the radar signals can last for up to 10 – 12 days, depending on the operational frequency of the radar.  These events occur at all latitudes and local times but there does appear to be a peak in occurrence at a solar zenith angle of about 160o, i.e. deep in the tail of the Martian plasma system. Using data from MAVEN, Mars Express and Mars Reconnaissance Orbiter we investigate the background plasma  and magnetic field conditions, which occur at the same time as these events to investigate how the SEP impact on the nightside atmosphere.  This will provide crucial evidence for plasma transport in the Martian system, in particular during the passage of ICMEs.

How to cite: Lester, M., Sanchez-Cano, B., and Opgenoorth, H.: Plasma and magnetic field conditions during radar blackouts at Mars., Europlanet Science Congress 2021, online, 13–24 Sep 2021, EPSC2021-601, https://doi.org/10.5194/epsc2021-601, 2021.

EPSC2021-318
|
ECP
Catherine Regan, Andrew Coates, Geraint Jones, Anne Wellbrock, Mats Holmstrom, and Rudy Frahm

2007 and 2018 saw global scale dust storms engulfing the entirety of Mars, lasting several months. These events have a profound impact across Mars, with dust reaching altitudes up to 80 km and global temperatures rising by up to 40 K. This significant change in the Martian atmosphere may lead to changes in the ionosphere and above. During the 2007 storm, it was seen in Mars Express (MEx) radar data that ionisation created in the lower atmosphere is observed at higher altitudes, with an altitude dependent enhancement in plasma density over crustal magnetic fields (Venkateswara et al., 2019). It may be likely that during these dust events, atmosphere loss is enhanced.

MEx launched in 2003, became operational in 2004 and is still collecting data today. Onboard are seven scientific instruments which are answering questions about the atmosphere, surface and geology at Mars, whilst looking for signs of water and life. With a period of seven hours, MEx provides extensive coverage of data collection. One of the seven instruments, the Analyzer of Space Plasmas and Energetic Atoms (ASPERA-3) has produced a long time-base of plasma measurements from as low as 250 km. ASPERA-3 aims to investigate the interaction of the solar wind with the Martian atmosphere, looking at the mechanisms that may enhance the loss of gases from Mars.

ASPERA-3 will be used to investigate the effects the 2007 and 2018 global dust storms had on the plasma environment by comparing data before, during, and after the event.  Of particular interest are plasma measurements over radial magnetic fields from crustal anomalies, where transport of charged particles is guided out of the atmosphere.  The before, during, and after effects will shed light on to the influence dust storms have on the escaping plasma measured by ASPERA-3 and how dust changes the local plasma escape directly from the atmosphere. Our initial study focuses on data from the electron spectrometer (ELS) where we investigate how the energy distribution and peak energy value varies in altitude above the Martian surface. We will also relate our observations back down to the Martian surface, where we will investigate how surface features may influence the atmosphere and ionosphere above them. This will focus on the southern hemispheric crustal fields and geological features, such as impact basins and volcanoes.

How to cite: Regan, C., Coates, A., Jones, G., Wellbrock, A., Holmstrom, M., and Frahm, R.: Investigating global scale dust storms on Mars with ASPERA-3, Europlanet Science Congress 2021, online, 13–24 Sep 2021, EPSC2021-318, https://doi.org/10.5194/epsc2021-318, 2021.

EPSC2021-485
|
ECP
Kerstin Peter, Martin Pätzold, Luca Montabone, Ed Thiemann, Olivier Witasse, Silvia Tellmann, and Michael K Bird

Since December 2003, when the Mars Express spacecraft entered Mars orbit, the Mars Express Radio Science experiment (MaRS) has recorded more than 1,000 high-resolution height profiles of the Mars ionospheric electron density from the topside down to the ionospheric base [1]. The two dominant features of the undisturbed Martian dayside ionosphere are the main peak region (M2), which is mainly caused by solar radiation in the Extreme Ultraviolet and the secondary layer (M1), which is produced mostly by the primary and secondary impact ionization of short solar X-rays < 10 nm [2].

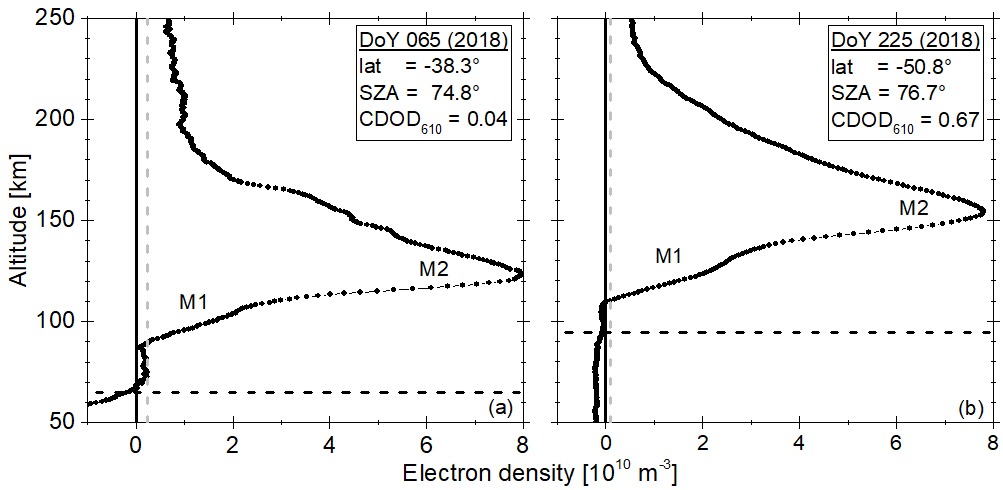
Dust interacts strongly with the Mars atmospheric circulation. Observed dust-associated effects range from local to regional and upward to planet encircling global dust storms. Previous observations indicated a rise of the main ionospheric region during dust storms from local heating of the neutral atmosphere by the absorption of solar radiation (e.g. [3, 4, 5]). An increase in the height of the ionospheric main peak was also observed by MaRS during the 2018 global dust storm (Figure 1). While the observation in Figure 1a was conducted before the onset of the global dust storm, the observation presented in Figure 1b was conducted during the storm’s declining phase. The altitude increase of the entire ionospheric photochemical region by ~31 km from DoY 065 to DoY 225 correlates well with a large increase in atmospheric dust content.

 Figure 1: Dayside ionosphere of Mars observed by MaRS on (a) Day of Year (DoY) 065 (2018) before the beginning and (b) DoY 225 (2018) during the declining phase of the 2018 global dust storm. The gray dashed line indicates the noise level; the black dash-dotted line marks the lowest valid altitude of the individual observation (details in [1]).

This work combines 17 years of MaRS ionospheric dayside measurements with observations of environmental parameters describing the solar flux and atmospheric dust content to investigate the effect of the varying atmospheric dust on the Mars dayside ionosphere during local/regional dust events and the 2018 global dust storm. A total of 361 MaRS height profiles of the ionospheric dayside with low observational noise level were selected for this study. The solar flux for each observation is either derived from the MAVEN EUVM based Flare Irradiance Spectral Model for Mars (FISM-M, [6]) or the Earth FISM V2 [7] model calibrated for the Mars position. Individual dust parameters (column dust optical depth – CODO610: infrared 9.3 mm absorption values normalized to 610 Pa) were derived for each observation from the gridded and kriged Martian dust maps of Montabone et al. [8, 9]. CDOD610 varies between 0.01 and 0.68 in the MaRS data set.

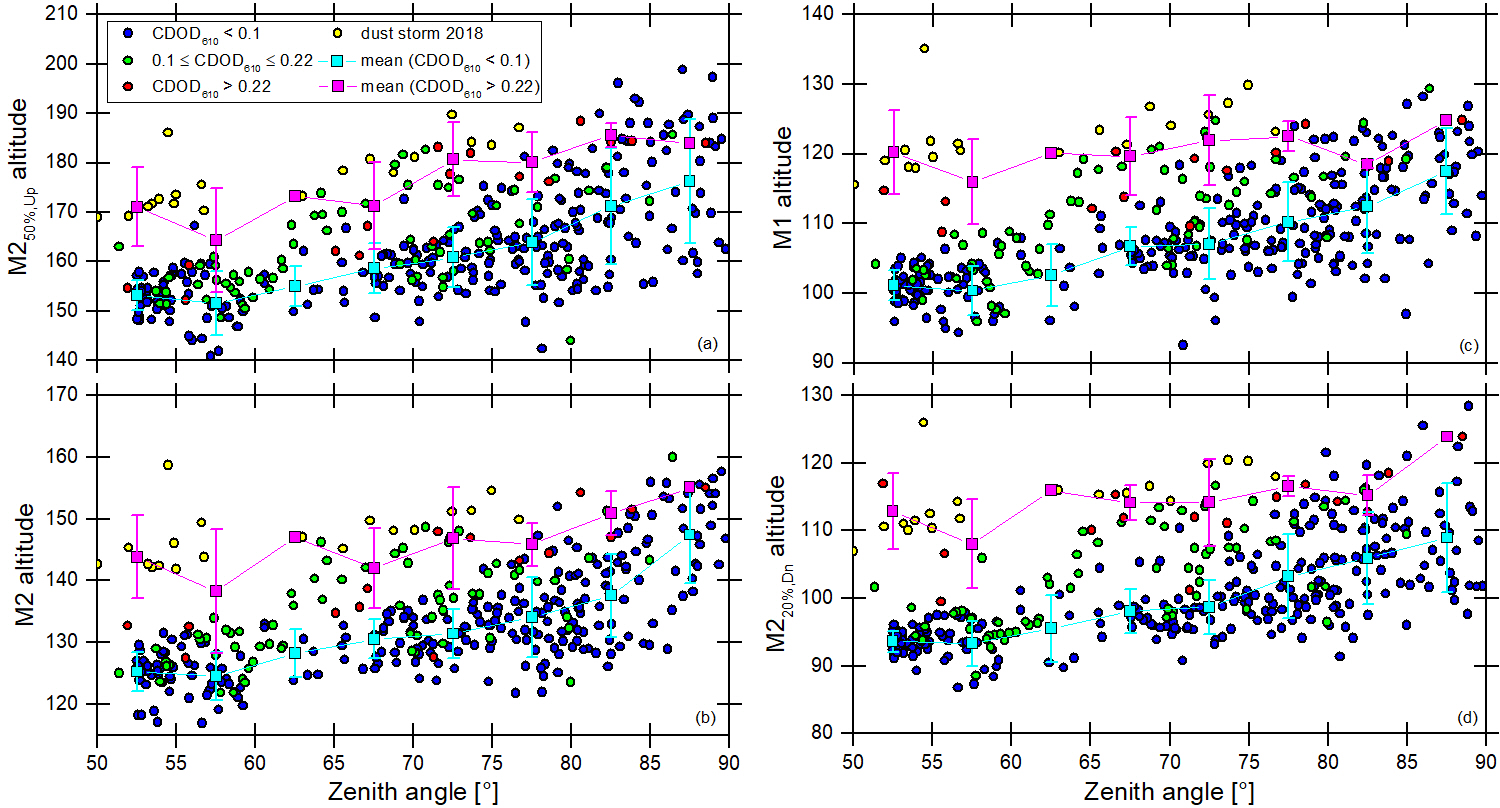
The raising effect of the atmospheric dust content on the main ionospheric region is statistically confirmed in the MaRS data set (Figure 2b). In addition, it is found that the dust’s raising effect actually affects the entire photochemical region of the Martian ionosphere, including the base (Figure 2d), the M1 region (Figure 2c), and the region above the main peak where the electron density reaches 50% of the main peak electron density (Figure 2a).

Figure 2: Altitudes of (a) 50% M2 electron density above the main peak, (b) M2 main peak, (c) M1 peak and (d) 20% M2 electron density below the main peak in dependence of SZA and CDOD610. Cyan squares/error bars indicate the mean and standard deviation of the low CDOD610 MaRS observations in each 5° SZA bin, while magenta squares/error bars indicate those of the high CDOD610  MaRS observations.

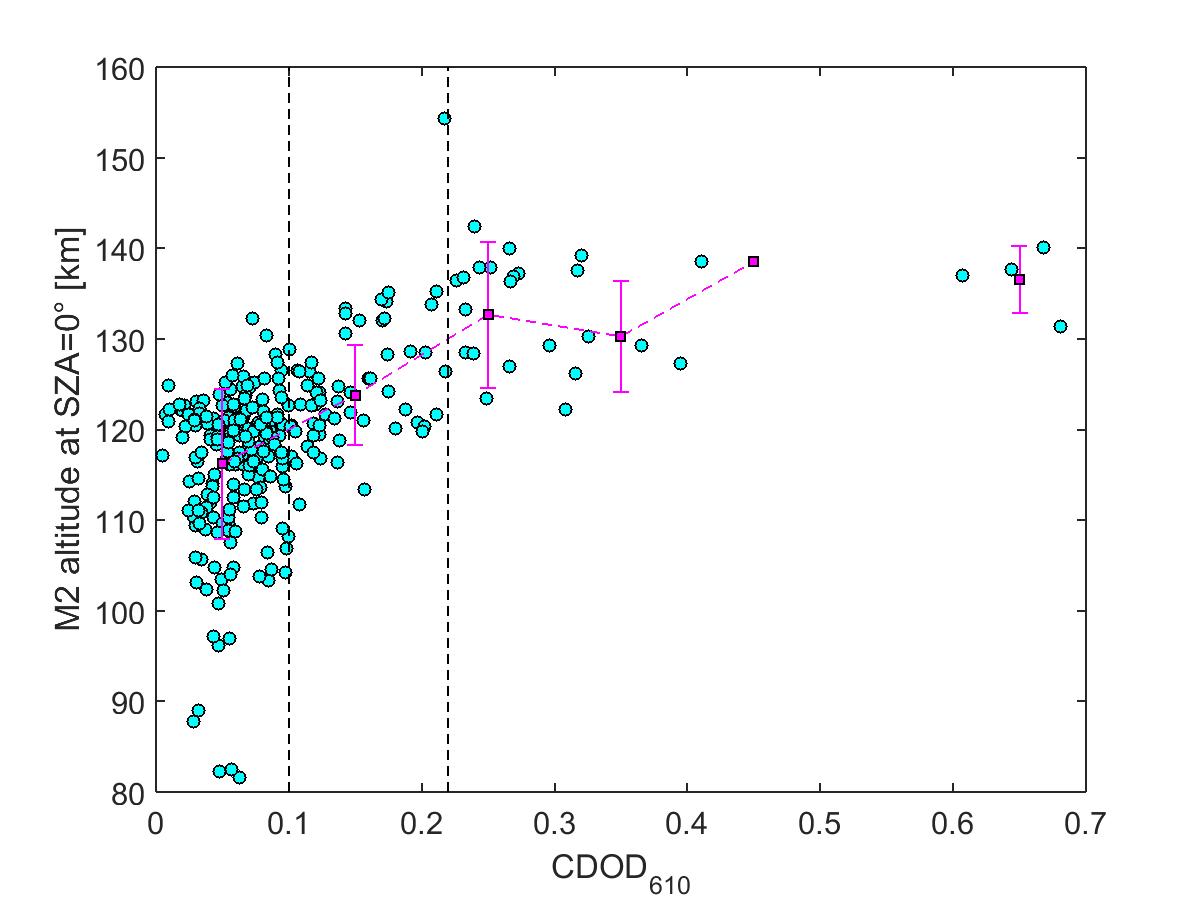
Figure 3 illustrates the M2 peak altitude at a solar zenith angle (SZA) of 0° as a function of the CDOD610 distribution, derived by applying a Chapman fit to the main peak region of each individual ionospheric profile. The altitude distribution of M2 at SZA=0° as a function of the associated CDOD610 indicates a saturation of the dust raising effect for CDOD610 > 0.22.

Figure 3: Derived M2 altitude for SZA=0°. Magenta squares and error bars indicate the mean and standard deviation in each 0.1 CDOD610 bin.


References

  [1] Peter et al. (2021), Icarus, 359.

  [2] Fox et al. (1996), Adv. Space Res., 17, 11.

  [3] Wang and Nielsen (2003), PSS, 51, 4-5.

  [4] Girazian et al. (2019), JGR Planets, 124.

  [5] Felici et al. (2020), JGR Space Physics, 125.

  [6] Thiemann et al. (2017), JGR Space Physics, 122.

  [7] Chamberlin et al. (2020), Space Weather, 18, 12.

  [8] Montabone et al. (2015), Icarus, 251.

  [9] Montabone et al. (2020), JGR Planets, 125.

How to cite: Peter, K., Pätzold, M., Montabone, L., Thiemann, E., Witasse, O., Tellmann, S., and Bird, M. K.: The effect of atmospheric dust on the Mars dayside ionosphere derived from 17 years of Mars Express Radio Science observations, Europlanet Science Congress 2021, online, 13–24 Sep 2021, EPSC2021-485, https://doi.org/10.5194/epsc2021-485, 2021.

EPSC2021-562
Özgür Karatekin, Ananya Krishnan, Nayeem Ebrahimkutty, Greg Henry, Ahmed El Fadhel, and Olivier Witasse

ESA’s Mars Express spacecraft has been exploring the red planet since January 2004. The spacecraft is able to receive and transmit signals at both S-band and X-band. Changes in the radio signals properties while propagating through the atmosphere yield information on the electron density profile. The Mars’ ionosphere is very variable in time. One source of its variability is the solar activity. Here we study the effect of solar flares and coronal mass ejections on the Mars’ ionosphere using the publicly available Mars Express radio occultation data. A new software in python was developed to process the residual frequencies data sets, and was validated using higher-level archival data. We calculate the electron density profiles before, during, and after such solar events. The variations in ionospheric parameters (total electron content, peak density and altitude) are quantified in order to understand the ionospheric changes due to solar activity. As expected, significant variations in these parameters have been identified. The results are compared with additional measurements and models.

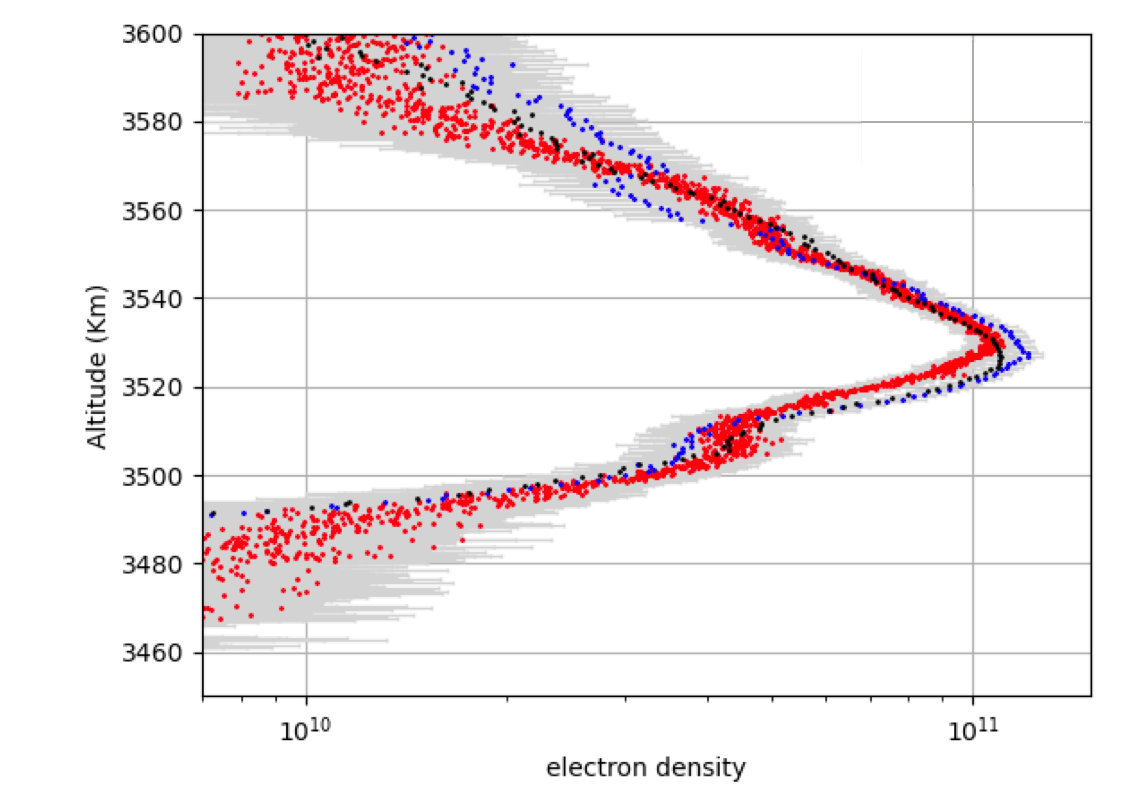
Figure 1: Electron density profiles observed by MEX on 2011 during 2 days following a solar event.

How to cite: Karatekin, Ö., Krishnan, A., Ebrahimkutty, N., Henry, G., El Fadhel, A., and Witasse, O.: Analysis of selected Solar events with Mars Express radio occultation data, Europlanet Science Congress 2021, online, 13–24 Sep 2021, EPSC2021-562, https://doi.org/10.5194/epsc2021-562, 2021.

EPSC2021-605
Bruno Nava, Yenca Migoya-Orue, Anton Kashcheyev, Beatriz Sánchez-Cano, Olivier Witasse, Håkan Svedhem, Jacob Parrott, Dimitri Titov, Andrea Toni, and Chi Ao

Radio Occultation (RO) is a very powerful technique to probe a planetary atmosphere, in providing vertical density profiles of the neutral atmosphere and ionosphere. The standard method uses a radio link between a spacecraft and an Earth ground station. Nevertheless, the possibility to obtain information about the Martian atmosphere with mutual RO events, using data from NASA Mars Odyssey and Mars Reconnaissance Orbiters (MRO), has been demonstrated by Ao et al. (2015).
Taking advantage of two European spacecraft in orbit around Mars, the European Space Agency is currently preparing experiments of mutual RO between Mars Express (MEX) and the ExoMars Trace Gas Orbiter (TGO). In preparation of MEX and TGO data inversion and analysis, a simulation-based strategy has been adopted and an algorithm able to retrieve vertical electron density profiles from Doppler shift measurements has been implemented and validated. Subsequently, in order to test the mentioned algorithm with experimental data, the same three RO events considered in the paper by Ao et al. (2015) have been processed. In particular, for each RO event, having the information about the satellites’ orbit, the (excess) Doppler shift values corresponding to the Mars Odyssey-MRO ray-paths have been converted to bending angles as a function of impact parameter. Then, assuming a spherical symmetry (Fjeldbo et al., 1971) for the ionosphere electron density, the bending angles have been transformed (through Abel integral) to a vertical refractivity profile, which, in turn, has been converted to an ionospheric electron density profile.
In this work, the results obtained by the application of the mentioned inversion algorithm to experimental data will be presented, with particular focus on the retrieval of the ionospheric electron density profiles.

References

Ao, C. O., C. D. Edwards Jr., D. S. Kahan, X. Pi, S. W. Asmar, and A. J. Mannucci (2015), A first demonstration of Mars crosslink occultation measurements, Radio Sci., 50, 997–1007, doi:10.1002/2015RS005750.

Fjeldbo, G., A. J. Kliore, and V. R. Eshleman (1971), The neutral atmosphere of Venus as studied with the Mariner V radio occultation
experiments, Astron. J., 76, 123–140.

How to cite: Nava, B., Migoya-Orue, Y., Kashcheyev, A., Sánchez-Cano, B., Witasse, O., Svedhem, H., Parrott, J., Titov, D., Toni, A., and Ao, C.: Mutual radio occultation experiment between ExoMars Trace Gas Orbiter and Mars Express: algorithms testing, Europlanet Science Congress 2021, online, 13–24 Sep 2021, EPSC2021-605, https://doi.org/10.5194/epsc2021-605, 2021.