Passive radar probing of the Galilean Moons
- 1IPAG, Université Grenoble Alpes, Saint Martin d'hères, France
- 2Centrum Badan Kosmicznych Polskiej Akademii Nauk, Warsaw, Poland
- 3ESTEC, ESA, Noordwijk, Netherlands
Studying the presence of water and characterizing the tectonic structure in the firsts tens of kilometers of the crust of the Galilean icy moons are crucial to understand the formation and evolution of these bodies and could provide an insight into the setting for extra-terrestrial life within our solar system (Nimmo and Pappalardo, 2016). The most promising technique for directly detecting subsurface oceans is a penetrating radar and the use of low frequencies (< 30 MHz) is preferred to probe the moons' subsurfaces since the losses due to the surface roughness and absorption of the ice are reduced (Bruzzone et al., 2011). However, Jupiter has a loud radio environment for frequencies < 40 MHz (Cecconi et al., 2012), and the use of a passive mode, which would exploit Jupiter’s decametric radio emissions, is considered to operate the radar with low frequencies in the sub-Jovian hemispheres. However, the passive radar operates in a complex bistatic 3D geometry where Doppler and delay information are not separable. This justifies the use of simulations with realistic orbitographies to identify which configurations will lead to the best and worst performances, which is necessary to establish the scenarios of observation of the radar. In this paper, we compute the impact of the geometry on the final bistatic performances, using planned Juice orbits.
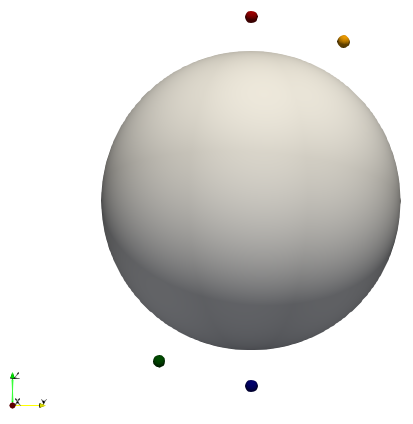
In order to study the influence of the geometry only, we do not take into consideration the stochastic character of Jupiter’s noise. The emission is then a simple impulsion located in the Jupiter auroral coronas: we regard four sources, at the Eastern and Western borders of Jupiter’s North and South auroral coronas, as presented in Figure 1.
In this geometry, the passive radar is orbiting around Ganymede and studies the reflection of the Jovian signal by a point target at the nadir in a monostatic geometry, or a point making a specular reflection in the bistatic case. To recognize weak, delayed, and Doppler-shifted contributions of the Jovian signal (also called reference signal), cross-correlation is carried out between the registered Jovian signal and the measured reflection. The next signal processing is the computation of the SAR synthesis to retrieve a Range-Doppler map of the surface probed.

Figure 1. Considered location for the four sources of emission of Jupiter’s radio emissions, and Jupiter. The sources will then be referred to as red source, blue source, yellow source, and green source.
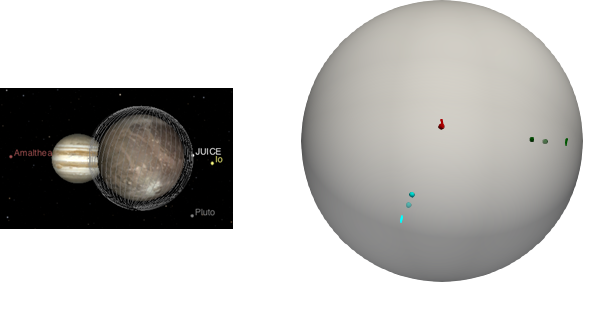
To compute the performances of the radar, we simulate the signal scattered in monostatic and bistatic cases, for three different scenarios (figure 2, table 1) using different integration times, perform SAR synthesis and compute on the images the size of the resolution cell. We depict in table 2 the area of the resolution cell for each scenario, as well as the size of the Fresnel zone.
The area of the resolution cell is always better than the size of the Fresnel zone, but table 2 depicts that with an integration time of one minute, probing close to the center of the sub-Jovian hemisphere provides the best resolution (1.33 km²). However, this conclusion changes when the integration times are increased to two minutes, and probing with an incidence angle of 38° becomes more favorable than along the nadir (0.28 km²). Indeed, in this geometry, the Range and Doppler sidelobes are not separated, and this non-separability increases with the integration.
Thus, while the along-track resolution is predictably worsened in the bistatic case compared to the monostatic scenario and improves with increasing integration time, the resolution in across-track varies as well with the integration time. For orbit 2, it improves with an increasing integration time, while, for orbit 1 and 3, which are aligned with nadir, the integration time does not seem to largely impact it. This means that, while probing along the center of the sub-Jovian hemisphere seems more efficient with small integration times, probing different parts of the sub-Jovian hemisphere might become of interest if increasing the integration time is possible.
This study showed that, as expected, the resolutions obtained are largely dependent on the geometry, but as well on the integration time. These conclusions will have to be kept in mind will preparing the probing strategy of Jupiter’s moons.

Figure 2.
Left: JUICE orbits as visualized on Cosmographia (https://www.cosmos.esa.int/web/spice/cosmographia)
Right: Position of the three considered orbits ( orbit n°1 in red, orbit n°2 in green, and orbit n°3 in cyan), with the bistatic specular point in bright color, and the nadir point with an opacity.
Table 1 Description of each scenario.
| Orbit | Associated color | Date | Center Time | Incidence |
| Orbit n°1 | Red | 18/03/2033 | 15:41 | 2 |
| Orbit n°2 | Green | 21/03/2033 | 09:46 | 38 |
| Orbit n°3 | Cyan | 27/04/2033 | 08:02 | 27 |
Table 2 Performances resulting from each orbit. ρ2 is the area of the resolution cell while Fresnel depicts the area of the Fresnel zone.
| ρ2 (km2) |
Fresnel (km2) | |||
| Orbit n°1 | 1 mn | Monostatic | 0.503 | 22 |
| Bistatic | 1.33 | 38 | ||
| 2 mn | Monostatic | 0.25 | 22 | |
| Bistatic | 0.655 | 38 | ||
| Orbit n°2 | 1 mn | Monostatic | 0.518 | 22 |
| Bistatic | 1.78 | 55 | ||
| 2 mn | Monostatic | 0.25 | 22 | |
| Bistatic | 0.28 | 55 | ||
| Orbit n°3 | 1 mn | Monostatic | 0.518 | 22 |
| Bistatic | 1.92 | 46 | ||
| 2 mn | Monostatic | 0.28 | 22 | |
| Bistatic | 0.953 | 46 |
How to cite: Gassot, O., Herique, A., Kofman, W., and Witasse, O.: Passive radar probing of the Galilean Moons, European Planetary Science Congress 2021, online, 13–24 Sep 2021, EPSC2021-521, https://doi.org/10.5194/epsc2021-521, 2021.

