
 1,2,4,
- 1DLR, Planetary Research, Berlin, Germany (mario.damore@dlr.de)
- 2INAF-IAPS, Rome, Italy
- 4University of Aizu, Aizu-Wakamatsu 965-8580, Fukushima, Japan
- 5Institute of Space and Astronautical Science (ISAS), Japan Aerospace Exploration Agency, Sagamihara, 252-5210, Japan
- 13Planetary Science Institute, 1700 E. Fort Lowell, Suite 106, Tucson, AZ 85719-2395, USA
- *A full list of authors appears at the end of the abstract
Introduction:
The Haybusa-2 spacecraft approached the C-type Near Earth asteroid 162173 Ryugu on June 2018 [1].
Haybusa2 is equipped with three remote sensing instruments such i.e.
as the Thermal Infrared Imager TIR [2], the NIRS 3 spectrometer [3] and the Optical Navigation Camera-Telescopic (ONC-T) with a wideband and seven narrow band filters [4].
Ryugu is a top-shaped Cb type asteroid and is covered by a large number of boulders [5,6].
It is one of the darkest object in our Solar System with a quite homogenous composition, including OH-rich materials [7,9].
Method:
We found that the NIRS3 data contains sensible variations, possibly linked to geomorphological structures, even though Ryugu surface varies only of few percent in reflectance.
Our approach is to exploit the whole spectrometer dataset, to find correlation that could not be foreseen with traditional methods relying on fewer spectral points.
Past experience on Mercury data shows that this is a sensible approach, in case of homogeneous featureless targets.
We collect NIRS3 data from 20180711_l3a and 20180719_l3a counting around 20k useful spectra, covering almost the whole surface.
The data were windowed between 1.8 and 3.1 um to avoid residual thermal effects at higher wavelength, obtaining a data matrix of 20k row x 75 feature or bands.
Then we applied a PCA transformation step to retain 10 component or 98% of the total variance, effectively compressing the data from 75 to 10 components.
Even though the PCA components per se doesn’t normally have a clear physical meaning, because they mix spectral feature in an unpredictable way, it is interesting to look at the results.
The first PCA component has redder slope between 1.8 and 2.5 um, where the second has an inverted redder slope in the same range.
The third is spectrally flatter, with an hint of absorption between 2.4 and 2.5 um.
The concentration distribution of those three components is also worth investigating: the PCA.0 is anti-correlated with the equatorial bulge and higher in craters, PCA.1 is also higher in crater but not strongly anti-correlated with the equatorial bulge like PCA.0.
PCA.3 this is clearly showing a north-south asymmetry.
The PCA component order indicate also the importance in explaining total data variance.
After that, we apply T-distributed Stochastic Neighbour Embedding (t-SNE)[5]: this converts similarities between data to joint probabilities, minimize the divergence between the joint probabilities of the low-dimensional embedding and the high-dimensional data, typically 2 or 3 dimensions.
Essentially, we can feed high dimensional data and get a lower dimension 2D map representation were closer point are also close in the original data space that is easy to visualize.
On top of that we partitioned the data point using an Agglomerative Clustering algorithm: starting from all separated data point it clusters the closest together, where closeness is calculated with complete linkage, i.e.
the maximum distances between all observations in each pair of classes.
Hierarchical algorithm has the nice advantage to show which partition is more stable via a dendrogram plot.
In our case, a 6 classes parti tion show as the most suitable one.
Results:
The surface of Ryugu could be separated in 6 spectral classes, which have a similar spectral trend (Fig.1 top paner) and are spatially coherent (Fig.1 bottom panel)
Classes (0,1,5,3) have same trend, but different albedo (from lower to higher reflectance).
Class 0 and 1 (C0/C1) are inter-craters terrains, the former mostly in the north , the latter in the south, with minor outcrops in the other hemisphere. C0 is up to -2% darker than Global Mean Reflectance (GMR) and C1 up to +4% brighter.
Class 2 (C2) is the darkest class (-5% GMR), and it is found mostly in craters interiors.
Class 3 (C3) is the brightest (+5% GMR) and it is found on the the equatorial bulge, but interrupted by Urashima, Momotaro, Kintaro and Kolobock craters.
Class 4 and 5 (C4/C5) are two different trend of intermediate terrains. Those are the closest to GMR with a 2% variation around GMR. C4 is mostly found in the north, where C5 in the south, with substantial outcrops in the other hemisphere. The most interesting difference is that C5 follows the global trend of being slightly bluer than GMR between 1.9 um and 2.5 um, but C4 shows an inverted trend, being redder then GMR.
In conclusion, we find an automated approach to extract spatially coherent region on Ryugu surface based only on spectral data using almost the whole NIRS3 spectral range.
Those classes show a significant spatial correlation with geomorphological feature and different spectral trends. This work will be updated using photometrically corrected NIRS3 data .
This work will be applied to photometrically corrected data, that will show features inherently linker to surface materials properties.
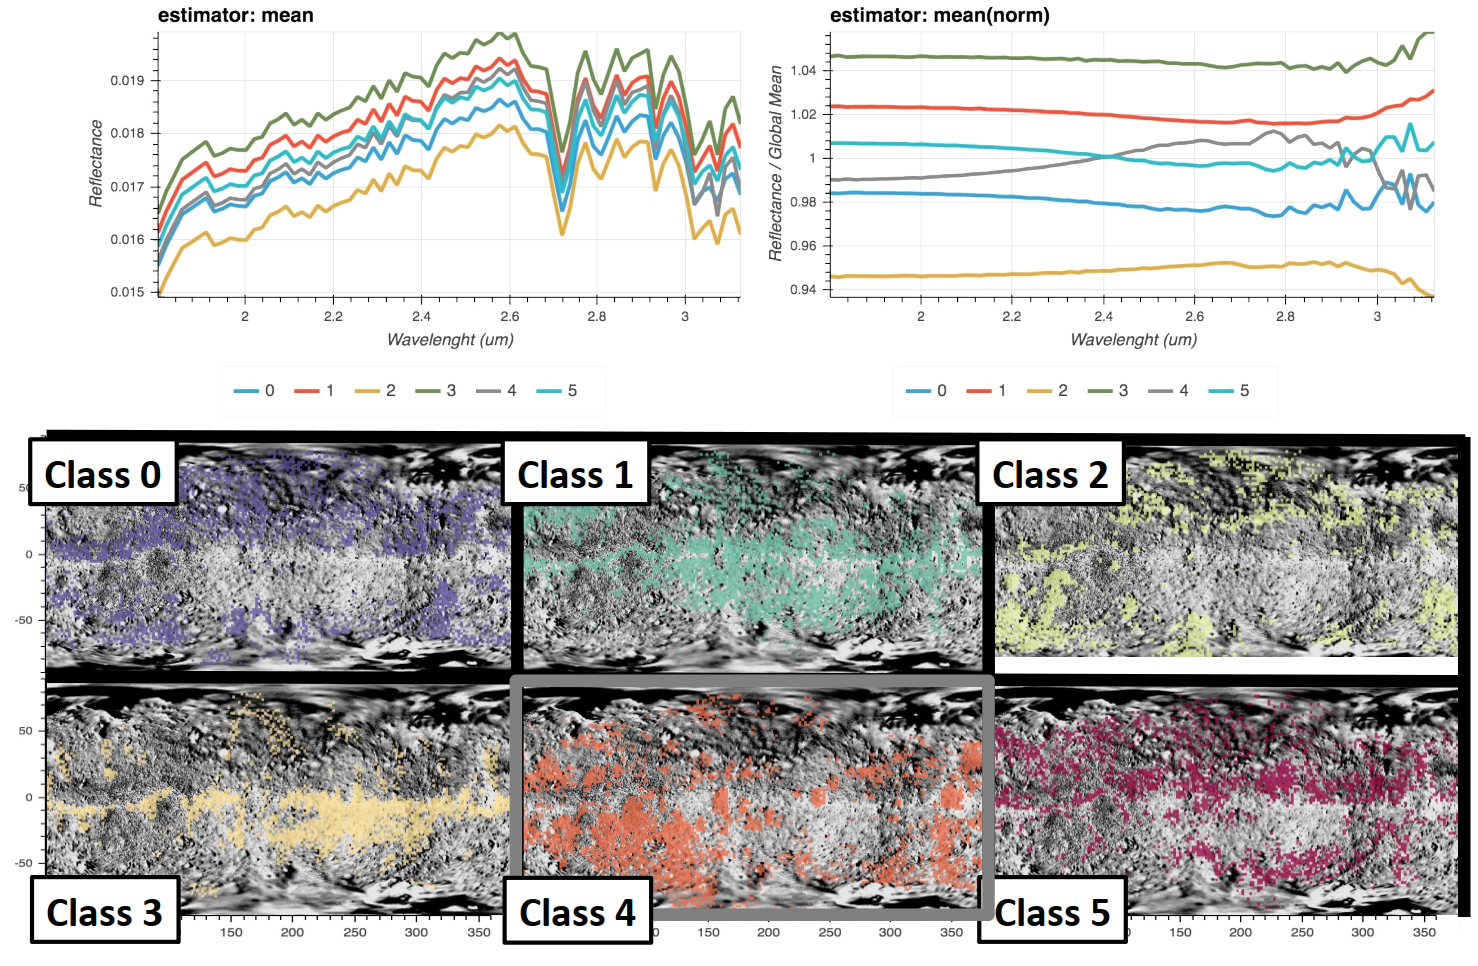
Fig.1 : (top panel) Classes average (left) and normalized to global mean (right). (bottom panel) Classes spatial distribution on the surface of Ryugu.
References:
[1] Watanabe S. et al. (2017) Space Sci. Rev. , 208, 3–16,
[2] Okada T. et al. (2017) Space Sci. Rev., 208, 255-286,
[3] Iwata T. et al. (2017) Space Sci. Rev., 208, 317–337 (2017),
[4] Kameda S. et al. (2016) Space Sci. Rev., 208, 17–31,
[5] Sugita et al., (2019) Science, 364, eaaw0422 ,
[6] Watanabe S. et al. (2019) Science, 364, 268-272 .
[7] Kitazato, K. et al., (2019) Science, 364, 272-275.
[8] L.J.P. van der Maaten, Journal of Machine Learning Research, 2008.
Angelo Zinzi (3),Fabrizio Dirri (2),Andrea Longobardo (2),Iwata Takahiro (5),Takahiro Hiroi (6),Driss Takir (7),Tomoki Nakamura (8),Masanao Abe (5),Makiko Ohtake (5),Shuji Matsuura (9),Seiichiro Watanabe (10),Makoto Yoshikawa (5),Takanao Saiki (5),Satoshi Tanaka (5),Tatsuaki Okada (5),Yukio Yamamoto (5),Yuto Takei (5),Kei Shirai (5),Naoyuki Hirata (11,4) Koji Matsumoto (12),Yuichi Tsuda (5)
How to cite: D'Amore, M., Ernesto, P., Domingue, D. L., Matsuoka, M., and Kitazato, K. and the other authors: Update on Ryugu spectral surface regions classification: dimensionality reduction, manifold learning and unsupervised clustering of NIRS3 data, Europlanet Science Congress 2021, online, 13–24 Sep 2021, EPSC2021-553, https://doi.org/10.5194/epsc2021-553, 2021.