SB4
Session assets
Please decide on your access
Please use the buttons below to download the presentation materials or to visit the external website where the presentation is linked. Regarding the external link, please note that Copernicus Meetings cannot accept any liability for the content and the website you will visit.
Forward to presentation link
You are going to open an external link to the presentation as indicated by the authors. Copernicus Meetings cannot accept any liability for the content and the website you will visit.
We are sorry, but presentations are only available for users who registered for the conference. Thank you.
Oral and Poster presentations and abstracts
Introduction: On December 6, 2020, the Hayabusa2 mission successfully returned to Earth ~ 5.4 g of samples collected at the surface of the C-type asteroid Ruygu [1,2]. Its surface was first sampled on February 22, 2019, then on July 12, 2019, close to a 10-meter large artificial crater, so as to possibly access sub-surface material [3]. The collected samples are now kept at the Extraterrestrial Samples Curation Center of JAXA at ISAS in Sagamihara, Japan, for a first round of preliminary analyses, with the objective to characterize in a non-destructive manner both the bulk samples and a few hundreds of grains extracted from them [4]. In particular, the objective is 1) to support their further detailed characterization by the international initial analysis teams, which will start their activity in July 2021, and 2) to catalog the grains, accessible to the international community through AO selection, starting mid-2022.
The preliminary characterization of these samples is being conducted with a visible microscope with four color filters, a FTIR spectrometer operating in the 1-5 µm range and MicrOmega, a hyperspectral NIR microscope developed at Institut d'Astrophysique Spatiale (Université Paris-Saclay/CNRS, Orsay, France), operating in the near-infrared range (0.99-3.65 µm) [5]. It is noteworthy that never before have the preliminary analyses of returned extraterrestrial samples included the characterization by a NIR hyperspectral microscope.
Results: Preliminary outcomes of the analyses performed with MicrOmega will be presented at the conference. In particular, the question of the representativity of the samples collected by the Hayabusa2 spacecraft will be addressed thanks to the comparison of the spectra obtained by MicrOmega and the NIRS3 remote sensing IR spectrometer [6] which performed a spectral characterization (1.8-3.2 µm) of Ryugu's surface, including the sites of the samples' collection [7,8]. A preliminary analysis of the spatial compositional heterogeneity will be presented. Specific signatures, detected in grains typically present in <1% of the pixels, but of high relevance regarding the processes determining Ryugu formation and evolution, will also be discussed.
References: [1] Binzel R. P. et al. (2002), Physical Properties of Near-Earth Objects. pp. 255-271, [2] Vilas F. (2008) The Astronomical Journal 135 (4), 1101-1105, [3] Morota et al. (2020) Science 368, Issue 6491, pp. 654-659, [4] Yada T. et al., in preparation, [5] Bibring J.-P. et al. (2017) Astrobiology 17, Issue 6-7, pp.621-626, [6] Iwata T. et al. (2017) Space Science Reviews 208 (1-4), 317-337, [7] Kitazato K. et al. (2019) Science 364 (6437), 272-275, [8] Kitazato K. et al. (2020) Nature Astronomy, Volume 5, p. 246-250.
How to cite: Riu, L., Brunetto, R., Carter, J., Gondet, B., Hamm, V., Hatakeda, K., Langevin, Y., Lantz, C., Le Pivert-Jolivet, T., Loizeau, D., Nakatoh, A., Okada, T., Pilorget, C., Poulet, F., Usui, T., Yada, T., Yogata, K., Moussi-Soffys, A., and Bibring, J.-P.: Hayabusa2 Returned Samples: First Results From the MicrOmega Investigation Within the ISAS Curation Facility, Europlanet Science Congress 2021, online, 13–24 Sep 2021, EPSC2021-564, https://doi.org/10.5194/epsc2021-564, 2021.
1. Background
The nature of asteroid phase curves is typically explained solely by the scattering properties of atmosphereless particulate surfaces. Models such as the H, G [1] and H, G1, G2 [2] systems aim to approximate the behaviour of these scattering properties without any assumption of the physical processes involved. However, these and other models are unable to account for changes in disk-integrated brightness of asteroids due to changing viewing aspect geometry during and between apparitions. If the viewing geometry of an asteroid changes rapidly, then the change in the cross-sectional area visible by the observer can impart modulations to the phase curve, becoming more significant for elongated asteroids [3]. These effects are likely to be significant for asteroids that undergo large changes to viewing aspect during apparitions, i.e. the near-Earth Asteroids (NEAs). Shape-induced modulations to phase curves limit the taxonomic information that can be extracted from parameters such as G, or G1 & G2. In this work we are aiming to characterise the magnitude of these shape effects, and investigate the potential error introduced into interpretation of individual phase curves.
2. Modelling Phase Curve Variability
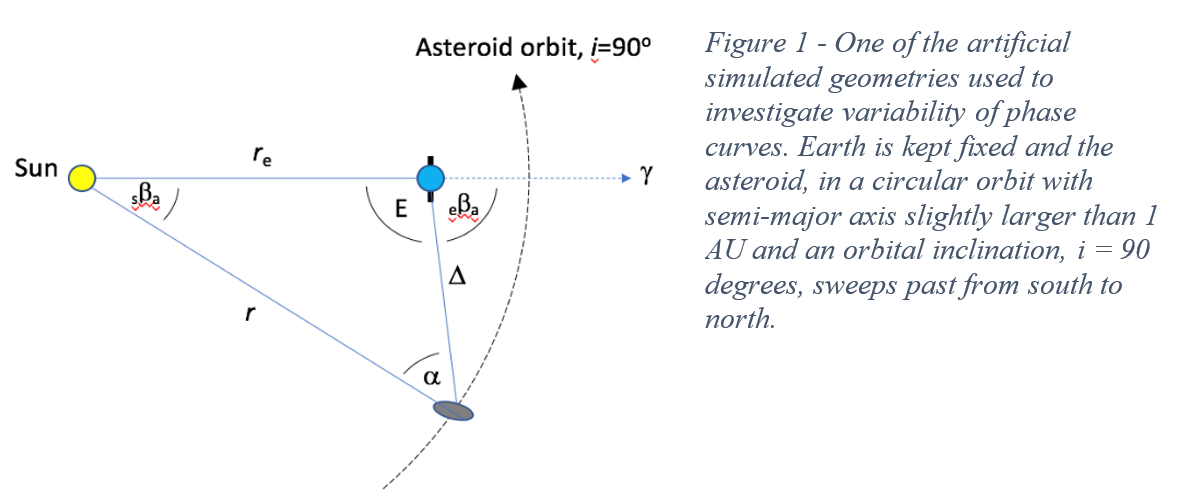
To study this effect, we have simulated asteroid phase curves for a variety of shapes over different geometries. Figure 1 describes one of these geometries that has the Earth kept fixed, with the asteroid sweeping past from south to north during a close approach with the Earth. We create ellipsoidal models, with a spherical model as a control, with differing pole orientations. The rotationally averaged reduced magnitudes for points along the orbit are simulated using a Hapke scattering model [4], using assumed S-type parameters based on (433) Eros [5].
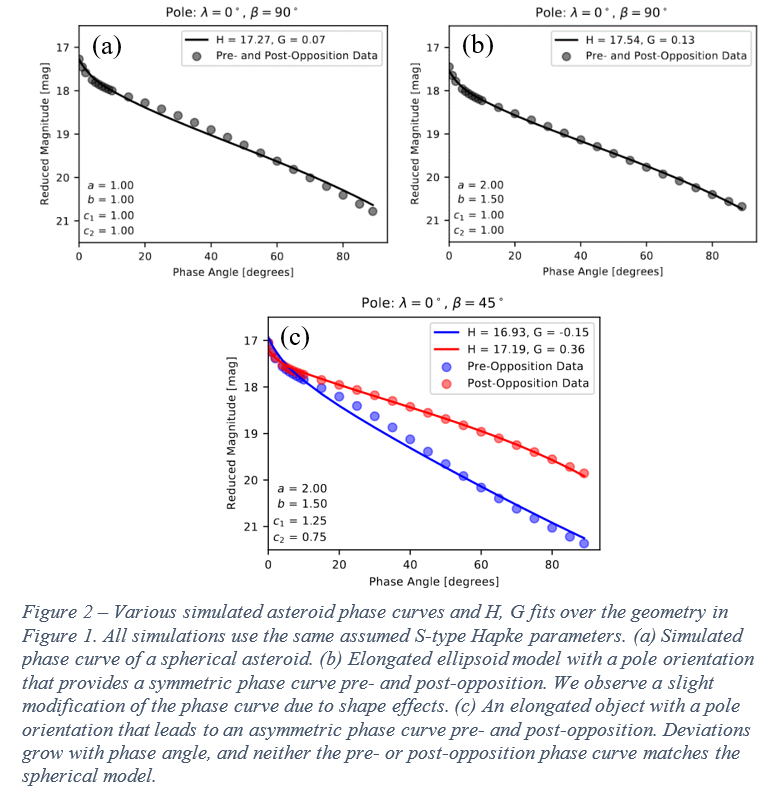
We note significant deviations from the spherical model for elongated objects over these geometries and observe clear separation of pre- and post-opposition phase curves for certain pole orientations (Figure 2). The large differences between these phase curves and the spherical model at high phase angles indicate that taxonomic information may be far more limited in individual phase curves of NEAs than previously thought. Using a single parameter taxonomic fitting method [6] we obtain a classification for the pre-opposition phase curve in Figure 2(c) as C-type, and for the post-opposition phase curve we obtain an E-type classification. The taxonomic classification using this method changes entirely based on when the asteroid is observed. The separation of the phase curve in Figure 2(c) is significantly larger at higher phase angles, underscoring the importance of this effect in NEA phase curves.
3. Observational Detection of Phase Curve Variability
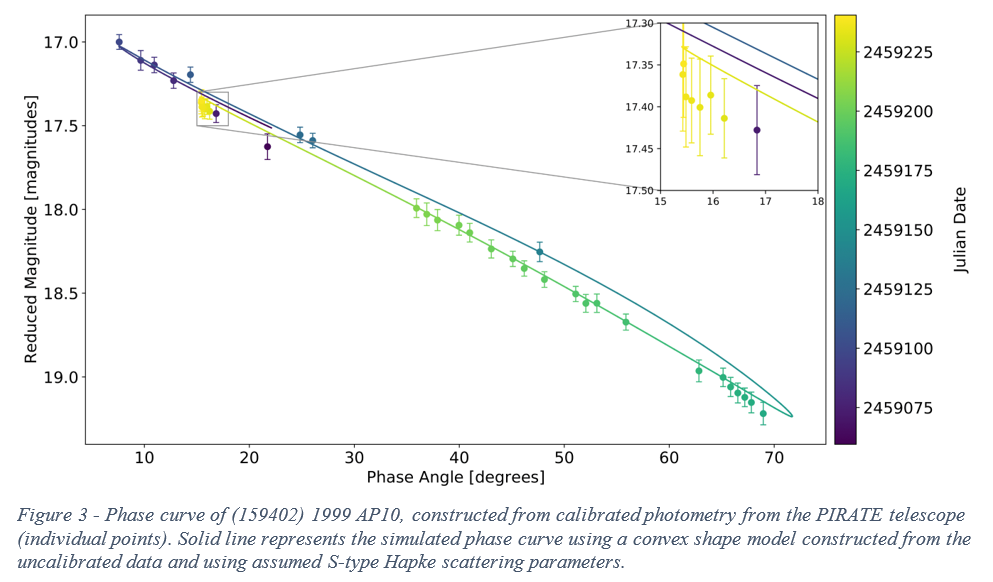
Phase curve variability has been detected in rotationally averaged calibrated photometry from the PIRATE telescope of NEA (159402) 1999 AP10 over a single apparition from 2020-07-29 to 2021-01-24 (Figure 3). PIRATE is a 0.43m aperture telescope located at Observatorio del Teide, Tenerife. These observations were conducted as part of an ongoing NEA observation and facility characterisation project [7]. A convex shape model is constructed from the uncalibrated PIRATE photometric data and additional archival data from ALCDEF [8]. Using simulations of the phase curve over this apparition using the convex model and assumed S-type Hapke parameters we verify that the variability in the phase curve is a result of aspect changes during the apparition.
4. Future Work
Further work will investigate the potential impact of shape modulations to phase curves in the formulation and optimisation of the basis functions in phase curve models. Methods for extracting taxonomic information from phase curves with potential shape modifications will need to be developed to continue to aid the classification of NEAs from photometric data in existing and upcoming datasets (e.g. LSST).
References
[1] Bowell et al. 1989, in Asteroids II, 524
[2] Muinonen et al. 2010, Icarus, 209, 542
[3] Rozitis et al. 2020, Bulletin of the AAS, 52(6)
[4] Hapke 1984, Icarus, 59, 41
[5] Li et al. 2004, Icarus, 172, 415
[6] Penttilä et al. 2016, Planetary and Space Science, 123, 117
[7] Jackson et al. 2021, submitted to PASP
[8] Stephens et al. 2018, AAS, DPS Meeting #50, id 417.03.
How to cite: Jackson, S., Rozitis, B., Green, S., Kolb, U., Andrews, A., Dover, L., and Lowry, S.: Phase Curve Variability of near-Earth Asteroids, Europlanet Science Congress 2021, online, 13–24 Sep 2021, EPSC2021-255, https://doi.org/10.5194/epsc2021-255, 2021.
The discovery, characterisation, and monitoring of Near-Earth Objects (NEOs) are critical for understanding and potentially mitigating the long-term threats to our civilisation from Potential Hazardous Asteroids (PHAs). Current survey telescopes have a sensitivity of around 20–21 magnitude, which means PHAs, with absolute magnitude H > 22, are typically discovered at distances of a fraction of an astronomical unit (Jedicke et al. 2016). This has two consequences: first, the angular speeds of these objects are often tens of arc-seconds per minute in discovery data, smearing out the faintest objects and making the discovery even more challenging. Second, uncertainties in preliminary orbits calculated from discovery data coupled with the relatively short distance from Earth lead to large uncertainties in the sky positions of these objects: ranging from tens of arc-seconds to a fraction of a degree just half a day after discovery. To confirm such faint objects and refine their orbits, one needs meter class telescopes with relatively wide fields of view.
GROWTH-India Telescope (GIT1, MPC Observatory Code: N51) is a 70-cm robotic telescope located at the Indian Astronomical Observatory (IAO) site at Hanle, Ladakh. Equipped with a 4k back-illuminated CCD, GIT has a 0.7° field of view at 0.67" resolution and reaches a depth of r' ≈ 21 in 5-minute exposures. GIT was set up as part of the Global Relay of Observatories Watching Transients Happen (Kasliwal et al. 2019)2, an international collaboration with NEO studies as one of its key science goals.
GIT began solar system observations in September 2020 and has been used to observe 75 solar system objects as of May 2021 (Figure 1). GIT is broadly used for three types of solar system studies. First, we study NEOs to confirm the discoveries and refine their orbits. The geographic location of GIT — on the opposite side of Earth to the major NEO discovery engines like ZTF (Bellm et al. 2018), CSS (Christensen et al. 2018), ATLAS (Tonry et al. 2018) and PanSTARRs (Chambers et al. 2016) — allows us to observe NEOs before the positional uncertainties blow up to unmanageable scales. Secondly, we undertake coordinated observations of solar system objects with other observatories to obtain continuous coverage over long time spans. An excellent example is the joint study of the episodically active asteroid (6478) Gault (Purdum et al. 2021) where continuous observations were key to reveal the 2.5-hour rotational period. Lastly, we also undertake observations of cometary outbursts - 29P/Schwassmann-Wachmann 1 (Kelley et al. 2021d), 22P/Kopff (Kelley et al. 2021a), C/2020 R4 (ATLAS) (Kelley et al. 2021b) and 99P/Kowal 1 (Kelley et al. 2021c).
Calculating accurate asteroid positions and magnitudes from non-sidereally tracked images poses a unique challenge. All the star images appear as streaks, and standard astrometry software are ill-suited for detecting and extracting such elongated sources. A common approach is to use the start (end) point of each streak as markers for the star positions at the start (end) of the exposure. But this approach needs significant human intervention. We have developed a new automated pipeline to process such images and obtain asteroid positions and photometry. Our pipeline detects streaks in the image and creates a synthetic image with point-like sources that can be solved for astrometry with any software. The final astrometric solutions can be transferred back to the original image, giving a coordinate system for the mid-point of observations. Testing our pipeline on sources with angular speeds as high as 2'/min and stellar streaks up to 5' in length, we have consistently obtained asteroid positions with arc-second residuals (Figure 2). This pipeline is built using open-source python packages like photutils (Bradley et al. 2020), and will soon be released publicly.
The GROWTH-India Telescope (GIT), set up by the Indian Institute of Astrophysics (IIA) and the Indian Institute of Technology Bombay with support from the Indo-US Science and Technology Forum (IUSSTF) and the Science and Engineering Research Board (SERB) of the Department of Science and Technology (DST), Government of India. It is located at IAO (Hanle), operated by IIA.
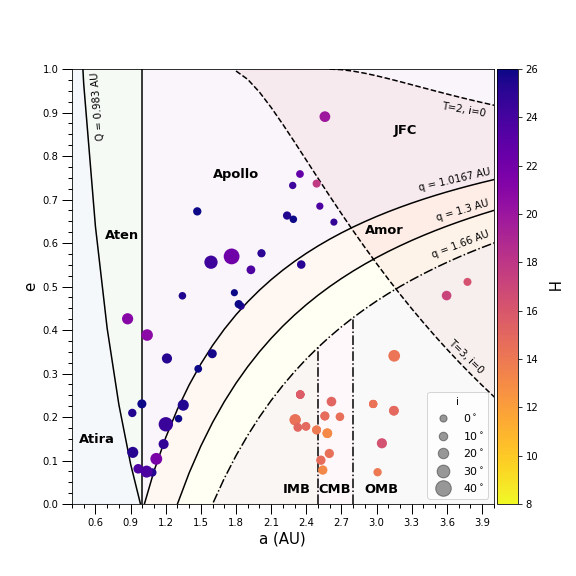
Figure 1: An (a, e, i) orbital distribution of all solar system objects observed with GIT, including 36 NEOs, 15 Main-Belt Asteroids (MBAs), 1 Jupiter Trojan, 7 Periodic Comets and 16 Non-Periodic Comets. The region between perihelion q = 1.3 AU and aphelion Q = 0.983 AU demarcates the NEO regime. We have observed 5 Atens (NEOs with Q ≥ 0.983 AU and a < 1 AU), 21 Apollos (NEOs with a ≥ 1 AU and q ≤ 1.0167 AU) and 9 Amors (NEOs with 1.0167 AU < q ≤ 1.3 AU). The orbital parameters of periodic comets with a > 4 AU and non-periodic comets are not included in this figure. We have also observed 5 Inner MBAs (a ≤ 2.5 AU and q ≥ 1.66 AU), 5 Central MBAs (2.5 < a ≤ 2.8 AU and q ≥ 1.66 AU) and 7 Outer MBAs (a > 2.8 AU and q ≥ 1.66 AU).
Figure 2. Observed-minus-Computed (O-C) residuals in the X and Y directions of all positions of NEOs observed with GIT. The NEOs tracked had a proper motion in the range of 4 − 120"/min. The exposures of 40 − 500 s were taken, resulting in streaking reference stars of lengths in the range 22 − 310". Astrometry on this data was performed using the GROWTH-India Astrometry Pipeline with a standard deviation of 0.57", which is fairly good for faint and fast-moving NEOs.
References:
- Eric C. Bellm et al 2019 PASP 131 018002
- Bradley, L. et al. 2020, Zenodo, doi: 10.5281/zenodo.4049061
- Chambers, K. C. et al. 2016, arXiv e-prints, arXiv:1612.05560
- Christensen, E. et al. 2018, AAS Vol. 50, Abstracts #50, 310.10
- Jedicke, R. et al. 2016, Icarus, 266, 173
- Kasliwal, M. M. et al. 2019, PASP, 131, 038003
- Kelley, M. S. P. et al. 2021a, ATel, 14565, 1
- -. 2021b, ATel, 14618, 1
- -. 2021c, ATel, 14628, 1
- -. 2021d, ATel, 14543, 1
- Purdum, J. N. et al. 2021, ApJL, 911, L35
- Tonry, J. L. et al. 2018, PASP, 130, 064505
1https://sites.google.com/view/growthindia/
2https://www.growth.caltech.edu/
How to cite: Sharma, K., Kumar, H., Bolin, B., Bhalerao, V., Anupama, G., and Barway, S.: GROWTH-India Observations of Solar System Objects, Europlanet Science Congress 2021, online, 13–24 Sep 2021, EPSC2021-378, https://doi.org/10.5194/epsc2021-378, 2021.
Pamela Cambianica1, Gabriele Cremonese1, Giovanni Munaretto1,2, Maria Teresa Capria3,Marco Fulle4, Walter Boschin5,6,7, Luca Di Fabrizio5, Avet Harutyunyan5
1.INAF Astronomical observatory of Padova, Vicolo dell'Osservatorio 5, 35122 Padova, Italy (email: pamela.cambianica@inaf.it)
2. Department of Physics and Astronomy "Galileo Galilei", University of Padova, Vicolo dell'Osservatorio 3, 35141 Padova, Italy
3. INAF-IAPS, Via Fosso del Cavaliere 100, Tor Vergata, 00133 Roma, Italy
4. INAF Astronomical Observatory of Trieste, via Tiepolo 11, 38121 Trieste, Italy
5. Fundación Galileo Galilei-INAF, Rambla José Ana Fernandez Pérez 7, E-38712 Breña Baja, TF, Spain
6. Instituto de Astrofisica de Canarias, C/Via Lactea s/n, E-38205 La Laguna (Tenerife), Spain
7. Departamento de Astrofisica, Univ. de La Laguna, Av. del Astrofisico Francisco Sánchez s/n, E-38205 La Laguna (Tenerife), Spain
Abstract
Comets are primitive bodies left over from the formation of the Solar System. Formed at large distance from the Sun, comets have been preserved at low temperatures since their birth. Therefore, the study of comets offers a unique opportunity to investigate the physical and chemical processes that occurred during the early stages of the formation and evolution of our Sun and Solar System. Most of the species in the coma are the products of physical and chemical processes acting on the parent molecules in the nucleus or in the inner coma. The study of their emission lines could then provide a large information on the physical phenomena occurring in the coma and on the composition of the nucleus. Comet C/2020 F3 (NEOWISE) is considered as the brightest comet in the northern hemisphere since comet C/2005 O1 (Hale-Bopp) in 1997. From Earth, comet NEOWISE was observable within elongations less than 20 degrees from the Sun between 11 June and 9 July, 2020. The perihelion occurred on 3 July, 2020, at a small heliocentric distance of 0.29 AU. Observations from the Comet OBServation Database (COBS)1 of the Minor Planet Center (MPC)2 show that comet NEOWISE had brightened from a visual magnitude of about 8 at the beginning of June to 0 early July.
1 https://cobs.si/
2 https://minorplanetcenter.net//
1. Observation and emission line identification
We obtained two high resolution optical spectra of comet NEOWISE on 26 July and 5 August, 2020, by using the High Accuracy Radial velocity Planet Searcher (HARPS-North) echelle spectrograph installed on the 360-cm Telescopio Nazionale Galileo (TNG). This instrument covers the wavelength range between 383 and 693 nm, with a resolving power of 115000. The unique passage and brightness of comet NEOWISE yielded spectra with a large number of emission lines, providing information on the coma composition and the physical and chemical processes occurring on the nucleus. The spectra have been used to generate a catalog of emission lines to be used for future studies of comets, since there are no catalogs in the literature with this spectral resolution. The spectral extraction has been performed automatically by the HARPS-N Data Reduction Pipeline. To compile the high-resolution catalog, we collected and digitized several laboratory molecular line lists covering the same wavelength range of our spectra. Once the molecular line lists were collected, we analyzed our spectra with the aim of finding wavelength coincidences of emission lines in the line lists and emission features in our spectra. We included all catalog lines matching our observed emissions within the spectral resolution, i.e. +/- Δλ= λ/R, where R is the resolving power. To verify the reliability of our identification, we used spectra from both nights. Finally, to further validate the final identification, we compared our catalog with other atlas resulting from the spectral analysis of other comets [1,2,3,4,5,6,7,8,9,10,11,12].
2. Results
We catalogued more than 4000 comet emissions. We found cometary lines due to C2, C3, CH, CN, CO+, H2O+, N2+ ,NaI, NH2, and [OI]. In particular, we found 82 CN lines, some of which belong to the violet system (B2Σ+ --> X2Σ+ band). The spectral resolution of our spectra allows to reveal definite structure of the 3883 Å sequence of the CN bands, and the P-branch is resolved into individual lines. Our spectra also reveal the presence of sodium. The identified emissions belong to the sodium doublet at 5889.95 and 5895.92 Å. We identified the emission of the forbidden green oxygen line at 5577.31 Å, and the strong red doublet emission of [OI] at 6300.31 and 6363.78 Å. C2 and C3 neutral radicals are also present in the spectra of comet NEOWISE. In particular, we found C3 emission lines in the 4050-Å Group both in the spectrum of 26 July, and in the spectrum of 5 August, 2020.We also identified NH2 and CH emissions, and observed three ionic species (H2O+, N2+, and CO+).
References
Bembenek, Z. (1997). Journal of Molecular spectroscopy, 181(1):136–141.
1. Bernath, P., Brazier, C., Olsen, T., Hailey, R., Fernando, W., Woods, C., and Hardwick, J. (1991). Journal of Molecular Spectroscopy, 147(1):16–26.
2. Cremonese, G., Capria, M. T., and de Sanctis, M. C. (2007). A&A, 461(2):789–792.
3. Heimer, T. (1932). Zeitschrift für Physik, 78(11-12):771–780.
4. Herzberg, G. and Johns, J. (1969). The Astrophysical journal, 158:399–418.
5. Kepa, R., Para, A., Rytel, M., and Zachwieja, M. (1996). Journal of Molecular Spectroscopy, 178(2):189–193.
6. Kumar, A., Hsiao, C.-C., Hung, W.-C., and Lee, Y.-P. (1998). The Journal of chemical physics, 109(10):3824–3830.
7. Li, X. and Lee, Y.-P. (1999). The Journal of chemical physics, 111(11):4942–4947.
8. McKemmish, L. K., Syme, A.-M., Borsovszky, J., Yurchenko, S. N., Tennyson, J., Furtenbacher, T., and Császár, A. G. (2020). Monthly Notices of the Royal Astronomical Society, 497(1):1081–1097.
9. Para, A. (1996). Journal of Physics B: Atomic, Molecular and Optical Physics, 29(23):5765.
10. Sneden, C., Lucatello, S., Ram, R. S., Brooke, J. S., and Bernath, P. (2014). The Astrophysical Journal Supplement Series, 214(2):26.
11. Zachwieja, M. (1995). Journal of Molecular Spectroscopy, 170(2):285–309.
12. Zachwieja, M. (1997). Journal of Molecular Spectroscopy, 182(1):18–33.
How to cite: Cambianica, P.: A high spectral resolution catalog of emission lines in the visible spectrum of comet C/2020 F3 (NEOWISE), Europlanet Science Congress 2021, online, 13–24 Sep 2021, EPSC2021-523, https://doi.org/10.5194/epsc2021-523, 2021.
Phase curves of minor bodies describe their brightness change with phase angle, once distance effects have been removed. Using phase curves it is possible to obtain absolute magnitudes, useful parameters as they can be used as a proxy of sizes, with limitations due to albedo. In particular, in this work, we present phase curves of several thousands of minor objects in the filter system of the SLOAN Digital Sky Survey (SDSS).
We obtained the phase curves using the Moving Object Catalog (MOC) of the SDSS including in the final uncertainties those of the input magnitudes and also the uncertainty due to the likely change in magnitude due to rotational variation of the objects. The final products are the absolute magnitudes Hλ and G12λ, where λ indicates any of the five central wavelengths of the SDSS filter system. We computed colors at zero phase angle, or absolute colors, that are not affected by phase effects and could be used as a benchmark for future studies. We also analyze the behavior at small phase angles (<7.5 degrees) where the opposition effect dominates.
How to cite: Alvarez-Candal, A., Benavidez, P., Campo Bagatin, A., Santana-Ros, T., and Jimenez Corral, S.: The multi-wavelength phase curves of minor bodies from the SLOAN Moving Objects Catalog, Europlanet Science Congress 2021, online, 13–24 Sep 2021, EPSC2021-38, https://doi.org/10.5194/epsc2021-38, 2021.
Abstract
Basaltic asteroids, known as V-types, are distributed throughout the main belt region.
The greatest group of these objects is located in the inner main belt, constituting the Vesta family. However, in the last 20 years, many objects showing a basaltic composition have been identified also beyond 2.5 AU. These seem not to be related to (4) Vesta and require further investigation to better constrain their nature.
We present the spectroscopic and dynamical investigation of 23 asteroids, 15 of which located in the middle and outer main belt regions. Results show that asteroids in these regions, confirmed as basaltic based on their spectra in the visible and near infrared, are more likely related to other asteroidal families, possibly differentiated.
- Introduction
Basaltic material is reckoned as the result of an extensive geochemical differentiation, resulting in a body with a dense metallic core, a mantle of lighter olivine-rich material and an even lighter basaltic surface. This process should occur only on large-size objects, like (4) Vesta for instance, due to the heat needed to melt the chondritic material. The spectrum of (4) Vesta presents two deep absorption bands, at 0.92-0.94 μm and at 2.0μm, which are representative of pyroxenes. It also shows a very peculiar absorption band at 506 nm due to a forbidden transition of Fe2+. Most of the basaltic asteroids, identified through photometric measurements and then spectroscopically confirmed, are located in the inner main belt region (2.15-2.5AU) and mostly constitute the so-called Vesta family. This family counts more than 4500 members, only a small percentage of which have been spectrally characterised so far. These asteroids are indeed dynamically linked to Vesta (Milani et al. 2014) and share similar spectroscopic properties (Duffard et al. 2006; Moskovitz et al. 2010; De Sanctis et al. 2011; Migliorini et al. 2017). However, recent measurements allowed the identification of basaltic asteroids located beyond 2.5 AU (Lazzaro et al. 2000; Hardersen et al. 2004, 2018; Roig et al. 2008; De Sanctis et al. 2011; Solontoi et al. 2012; Ieva et al. 2018, Leith et al. 2017; Medeiros et al. 2019; Migliorini et al. 2017, 2021), which are unlikely related to Vesta, based on dynamical considerations. In addition, their surface composition shows some differences with respect to the V-types in the Vesta family region (see Jasmim et al. 2013).
In the present work, we summarise the properties of basaltic asteroids, especially located beyond 2.5 AU, that were observed at Telescopio Nazionale Galileo (TNG) and ESO facilities during several observing runs. We also discuss their dynamical evolution, in relation to asteroid families that seem to be differentiated.
- Spectral analysis
We have obtained vis and nir spectra of 23 asteroids, 15 of which located in the middle and outer main belt, selected as putative V-types according to vis and nir photometric surveys (Roig and Gil-Hutton 2006; Carvano et al. 2010; Licandro et al. 2017). Eight more asteroids in the inner main belt, non-belonging to the Vesta family, were observed for comparison reasons. Figure 1 shows the distribution of the observed asteroids in the proper semimajor axis-proper inclination plane. Sixteen asteroids show the pyroxene bands at 1 and 2 μm, confirming their basaltic nature. In addition, these all show the faint band at 506 nm, strengthening the composition of the so-called V-type asteroids. Of the asteroids in the middle and outer belt, 9 are confirmed as basaltic asteroids, while 3 are more compatible with Q- or S- complex.
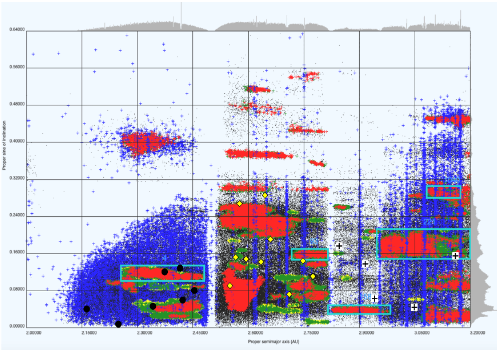
Fig. 1. Distribution of the observed asteroids in the inner, middle and outer main belt region. Observed asteroids are marked with black dots (in the inner main belt region), yellow diamonds (in the middle) and white squares (in the outer).
- Dynamical results
The presence of basaltic asteroids far from the Vesta family region raises the question whether the V-type asteroids, observed all around the main belt, are indeed basaltic, like Vesta, or from some other bodies. In our work, the dynamics of a total of 14 asteroids in the middle main belt and 14 in the outer main belt (following Michtchenko et al. 2016), all confirmed as V-types was investigated. Among these objects, 7 were finally identified as either members or located nearby some families (Migliorini et al. 2021), whose parent body was probably differentiated or partially differentiated. This finding is in agreement with the hypothesis that V-types in the middle and outer regions have not been originated from (4) Vesta. In addition, this suggests that the number of differentiated objects in the middle and outer main belt must be much larger than previously assumed.
Our work has contributed to enlarge the number of asteroids in the middle and outer main belt region, confirmed as basaltic, and successfully identified asteroidal families, which might contain basaltic asteroids.
Acknowledgements
Based on observations made with the VLT/X-shooter of the European Southern Observatory. This work is based on observations made with the Italian Telescopio Nazionale Galileo (TNG) operated on the island of La Palma by the Fondazione Galileo Galilei of the INAF (Istituto Nazionale di Astrofisica) at the Spanish Observatorio del Roque de los Muchachos of the Instituto de Astrofisica de Canarias.
This research was partly supported by the Italian Space Agency (grant DAWN-VIR n. I/004/12/0).
References
[1] Carvano J.M., et al., 2010, A&A, 510, A43.
[2] De Sanctis M.C., et al., 2011, MNRAS, 412, 2318.
[3] Duffard R., et al., 2006, A&A, 456, 775.
[4] Hardersen P., et al., 2004, Icarus, 167, 170.
[5] Jasmim F.L., et al., 2013, A&A, 552, A85.
[6] Ieva S., et al., 2018, MNRAS, 479, 2607.
[7] Lazzaro D., et al., 2000. Science, 288, 2033.
[8] Leith T.B., et al., 2017, Icarus, 205, 61.
[9] Licandro J., et al., 2017, A&A, 600, A126.
[10] Medeiros H., et al., 2019, MNRAS, 488, 3866.
[11] Michtchenklo T.A., et al., 2016, A&A, 588, A11.
[12] Migliorini A., et al. 2017, MNRAS, 464, 1718.
[13] Migliorini A., et al., 2021, MNRAS, 504, 2019.
[14] Milani A. et al., 2014, Icarus, 239, 46.
[15] Moskovitz N., et al., 2010, Icarus, 208, 773.
[16] Roig F. and Gil-Hutton R., 2006, Icarus, 183, 411.
[17] Solontoi M., et al., 2012, Icarus, 218, 571.
How to cite: Migliorini, A., Michtchenko, T. A., Lazzaro, D., De Sanctis, M. C., Lazzarin, M., La Forgia, F., Barbieri, M., and Mesa, D.: Properties of basaltic asteroids in the middle and outer main belt, Europlanet Science Congress 2021, online, 13–24 Sep 2021, EPSC2021-117, https://doi.org/10.5194/epsc2021-117, 2021.
Polana, Eulalia, and Themis are known to have negative spectral slope (blue) in visible wavelengths (VIS). We revisited our observations of those asteroid family members from 2010 to 2012 with the 3.56-m Telescopio Nazionale Galileo (El Roque de Los Muchachos Observatory, La Palma, Spain), in order to characterize their reflectance in the near-ultraviolet region (NUV, 0.35-0.55 µm). These spectrally blue asteroids are gaining great attention because they can be related to the sample return mission targets, (162173) Ryugu (Watanabe et al. 2019) and (101955) Bennu (Lauretta et al. 2019). These two asteroids show flat or upturn in NUV (Tatsumi et al. 2020, DellaGiustina et al. 2020). This peculiar characteristic may be a hint to seek their parent bodies. Tholen et al. (1984) suggested that spectrally blue asteroids can be categorized into two types: F and B types. Especially F types are characterized by a flat NUV reflectance. We aim to characterize the reflectance spectra of 20 members from these families and discuss the possible link to two mission targets.
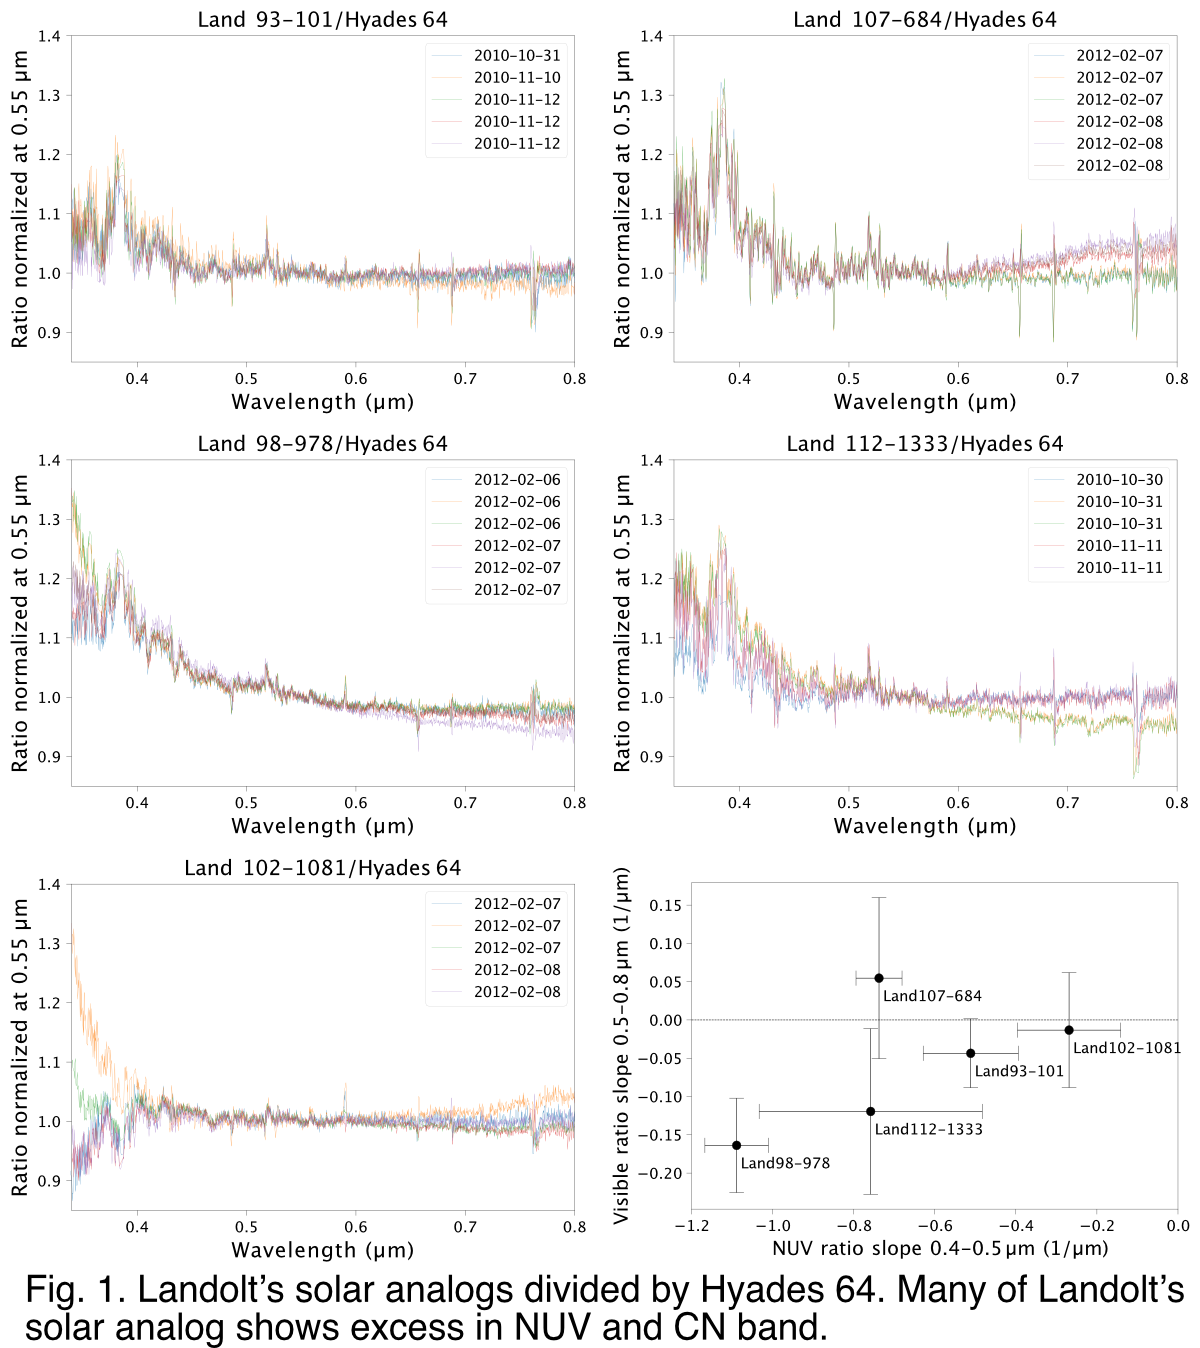
In asteroid spectroscopy, to remove solar colors from the observed asteroid spectra, measurements of solar analogs (instead of the Sun itself) are commonly used. Although solar analogs are known to be spectrally similar to the Sun over the visible wavelength range, they are not very well characterized in NUV region. The stars listed in Landolt (1983) are commonly used as solar analogs. However, we found that they are not the case for NUV due to the difference in CN (~0.385 µm) absorption and metallically (Fig. 1). To avoid this problem, we use only Hyades 64 (HD 28099) to obtain the reflectance spectra. This star was well characterized in NUV by Hardorp (1978) and was found spectrally closest analog to the Sun. While the spectral differences caused by the incorrect solar analog are acceptable in visible wavelength, on the NUV region this produces erroneous results. Actually, even if we use the same data, we obtain very different NUV spectra from those presented de Leon et al. (2016), as they used Hyades 64 and several Landolt stars. This is showing how important are the solar analogs. Similarly, the Eight-Color Asteroid Survey (ECAS, Zellner et al. 1985) used only four well characterized solar analogs in the NUV to obtain their spectrophotometry from 0.32 to 1.05 µm. Thus, we collect the family member spectra also from ECAS in addition to our observations.
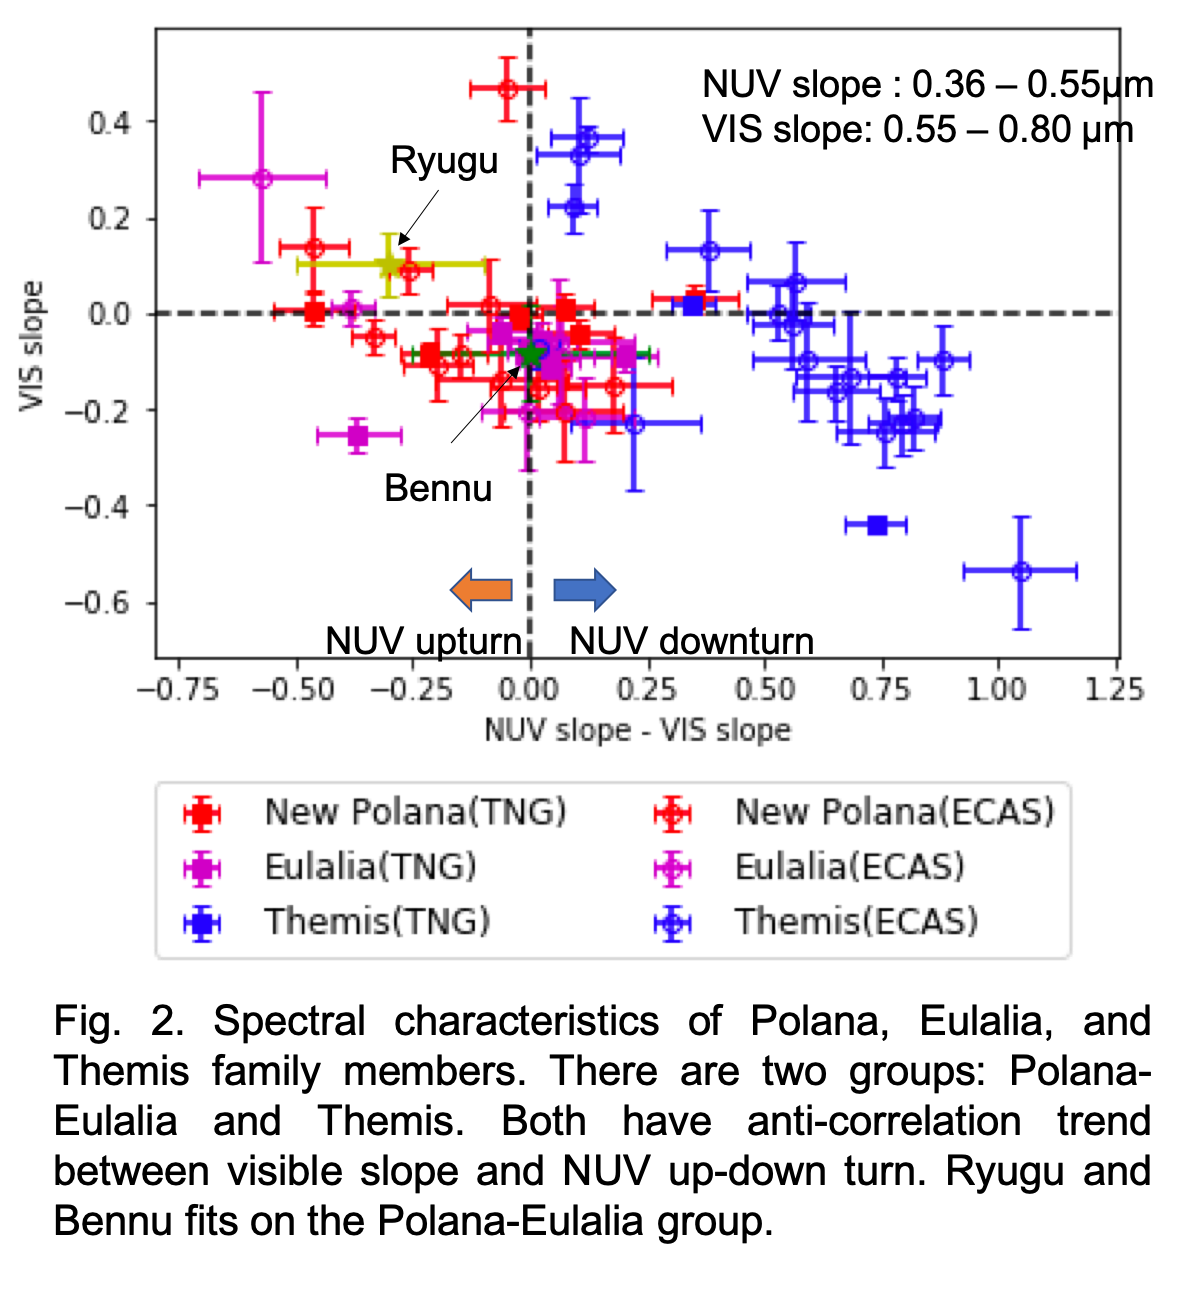
We measured the NUV and VIS (0.50-0.80 µm) spectral slopes for characterizing the family members (Fig. 2). The results show two groups, Themis and Eulalia-Polana. Both groups follow the trend from redder in VIS with more upturn in NUV to bluer in VIS with more downturn in NUV. The downturn in NUV typically starts at < 0.44 µm. Themis group is offset to more NUV absorption than the Eulalia-Polana group. For comparison, Ryugu and Bennu are both on the trend of the Eulalia-Polana group, which suggests two space mission targets were originated possibly from these families. Inside of each group, there is a large variation in both VIS and UV slopes, which may be caused by the hydration or by the space weathering alteration. Hiroi et al. (1996) showed that NUV absorption correlates with 3 µm absorption band based on the laboratory measurements of carbonaceous chondrites. Meaning that, more NUV downturn may indicate more hydration. Despite, a recent study (Hendrix and Vilas, 2019) showed that space weathering also affects the NUV region, suggesting that more UV upturn is proportional with the space weathering degree. If Ryugu and Bennu are originated from the same family, the degree of hydration is more plausible for explaining the NUV variation than space weathering because they show different degree of OH-band absorptions (Kitazato et al. 2019, Hamilton et al. 2019). The relation between Ryugu and Bennu will be revealed by the sample analyses in near future.
We confirmed that Eulalia-Polana members are mostly F types and Themis members are mostly B types, which is originally argued by Tholen (1984). Moreover, both Ryugu and Bennu are classified into F types in Tholen’s taxonomy. We found that there is a concentration of F types in the inner main belt region. Thus, our spectral analysis strongly suggests that both Ryugu and Bennu are originated from the inner main belt based on spectroscopy. This is consistent with probability calculation by Campins et al. (2010, 2013).
References:
- Watanabe et al. (2019) Science 364, 268.
- Lauretta et al. (2019) Nature 568, 55.
- Tatsumi et al. (2020) Astron. Astrophys. 639, A83.
- DellaGiustina et al. (2020) Science 370, eabc3660.
- Tholen (1984) PhD. Thesis, University of Arizona.
- Landolt (1983) Astron. J. 88, 439
- Hardorp (1978) Astron. Astrophys. 63, 383.
- De Leon et al. (2016) Icarus 266, 57.
- Zellner et al. (1985) Icarus 61, 355.
- Hiroi et al. (1996) MAPS 31, 321.
- Hendrix and Vilas (2019) GRL 46, 14307.
- Kitazato et al. (2019) Science 364, 272.
- Hamilton et al. (2019) Nat. Astron. 3, 332.
- Campins et al. (2010) ApJL 721, L53.
- Campins et al. (2013) ApJ 146, 26.
How to cite: Tatsumi, E., de León, J., Popescu, M., Licandro, J., and Tinaut, F.: Near Ultraviolet Observations of Polana, Eulalia, and Themis Families: Origin of Ryugu and Bennu, Europlanet Science Congress 2021, online, 13–24 Sep 2021, EPSC2021-283, https://doi.org/10.5194/epsc2021-283, 2021.
1. Introduction
(4) Vesta is the second most massive body in the main asteroid belt and exhibits absorption features indicative of basaltic minerals [1]. The discovery of new basaltic objects taxonomically classified as V-type asteroids [2] is probably linked to the fragments produced during a catastrophic event where Vesta is believed to have lost about one percent of its mass less than a billion years ago.
VIR spectra of Vesta’s and V-type asteroids surface show absorption bands centred at approximately 0.9 and 1.9µm, confirming the pyroxenes presence [1] and they have a reflectance spectrum which is very similar to HED.
We aim to infer the modal mineralogical compositions and regolith grain size of some V-type asteroids using the Hapke radiative transfer model, basing on the results of scatterplot analysis of spectral parameters such as Band Center I (hereafter BCI) and Band Center II (hereafter BCII), Band depth (hereafter BDI) and Band depth II (hereafter BDII) and Half-width-half-maximum (hereafter HWHM). It is also foreseen to test the genetic linkages between V-type asteroids and HED meteorites and Vesta.
2. Data and method
We analysed 76 V-type asteroids normalized spectra in the infrared from 0.7-0.8 µm to 2.5 µm, divided in two datasets. The first group was from [3] and the second was from [4, 5, 6]. All the spectra were downloaded from the Planetary Data System (PDS).
To study the spectral properties and to understand the mineral composition and possibly the physical characteristics of the regolith (i.e., effective grain size), we introduced spectral parameters such as the band BC, BD and HWHM as defined in [7] and compared the results obtained from V-type asteroid with HED meteorites used in [7]. We also applied Hapke’s bidirectional reflectance model to retrieve compositional and grain size information for the V-type asteroids and HED analysed in this work.
The whole procedure can be schematized as follows:
- Retrieve the mineralogy of each V-type asteroid dataset, by comparing them with HED in BCI versus BCII scatterplot (Figure 1)
- Retrieve the grain size regolith range of each V-type asteroid dataset, by comparing them with HED in BDI versus BDII and HWHM I dx versus BDII scatterplot (Figure 2, Figure 3)
- Application of the Hapke’s bidirectional reflectance model to the spectral deconvolution of the selected asteroids and meteorites.
The used end-members in the Hapke retrieval are clinopyroxene, orthopyroxene and plagioclase [8]. We assume that the scattering is isotropic and no backscattering is considered.
In order to simulate HED mineralogy, abundance limits on fractional mass of pyroxene (40% to 100%) and of plagioclase (0% to 60 %) were set in the Hapke retrieval.
In addition, the grain size for each mixture was varied (in step of 5 µm) from 5 µm up to a limit of 80 µm, in agreement with scatterplot analysis (Figure 2, Figure 3).
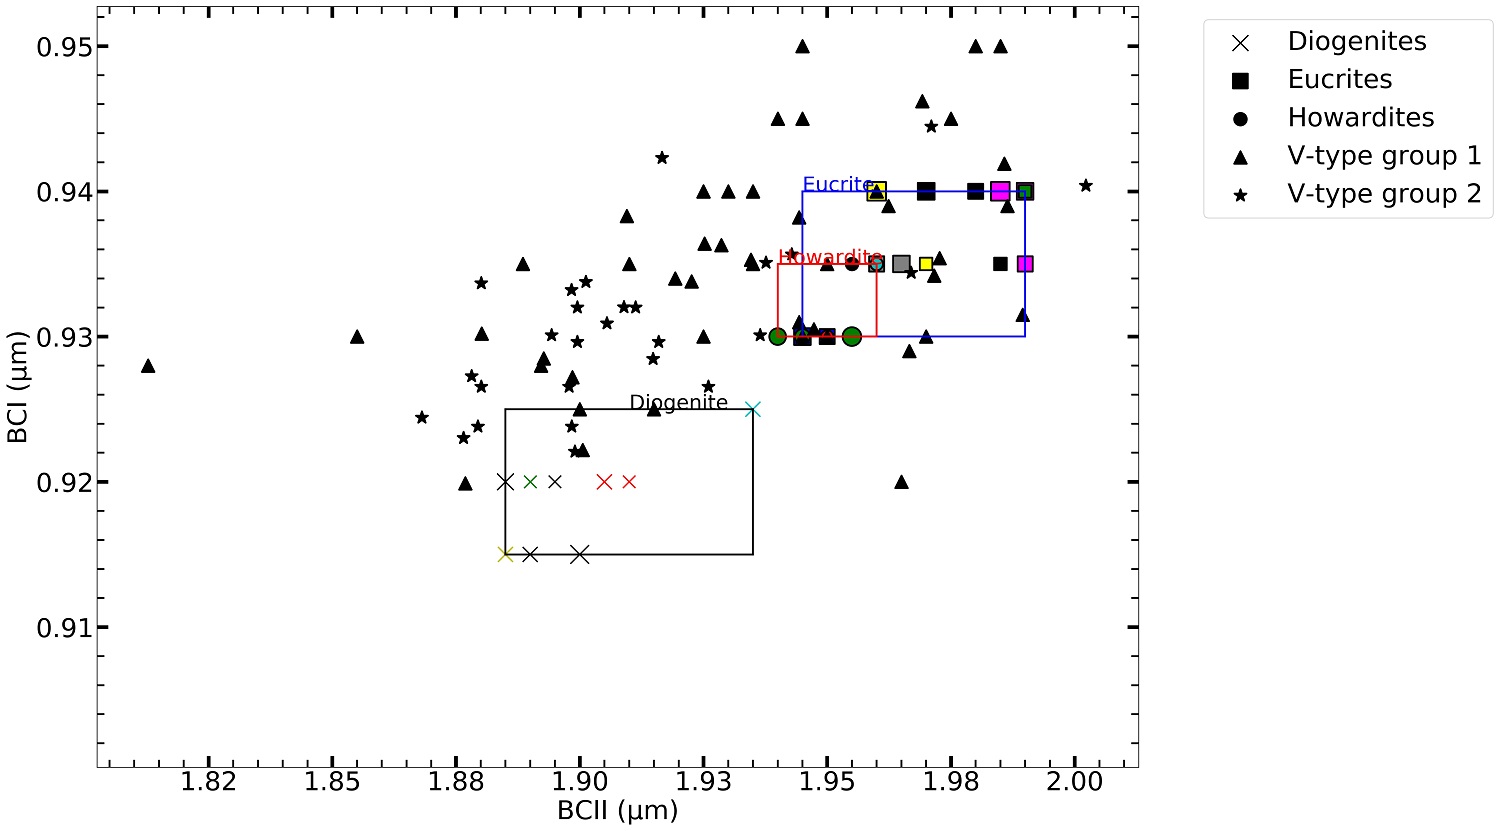
Figure 1: Band I Center versus Band II Center scatterplot of HED and V-type group 1 and group 2. For the entire legend see [9] .
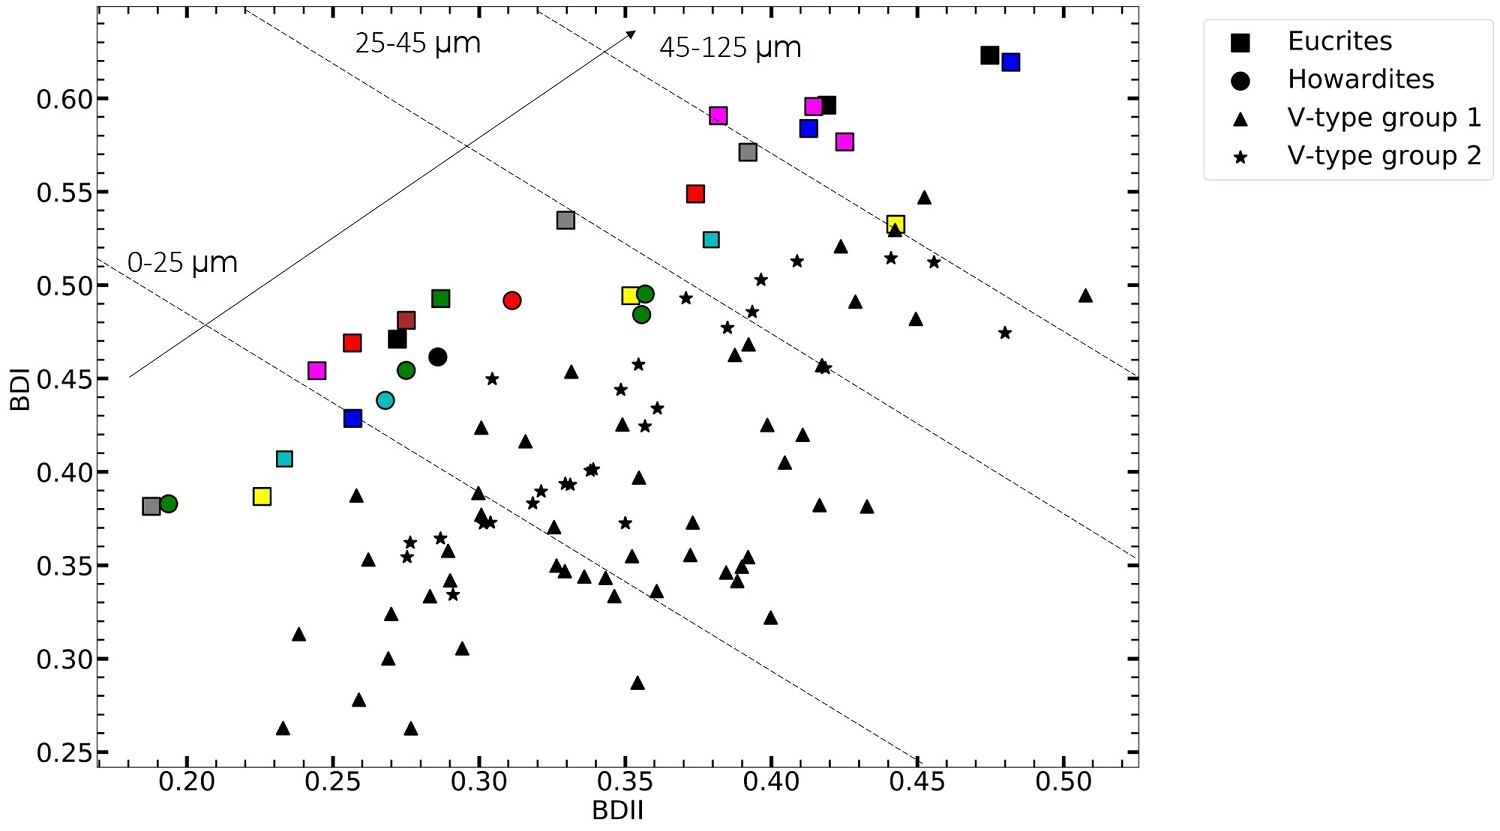
Figure 2: BDI versus BDII scatterplot on Eucrite, Howardite and V-type group 1 and group 2.
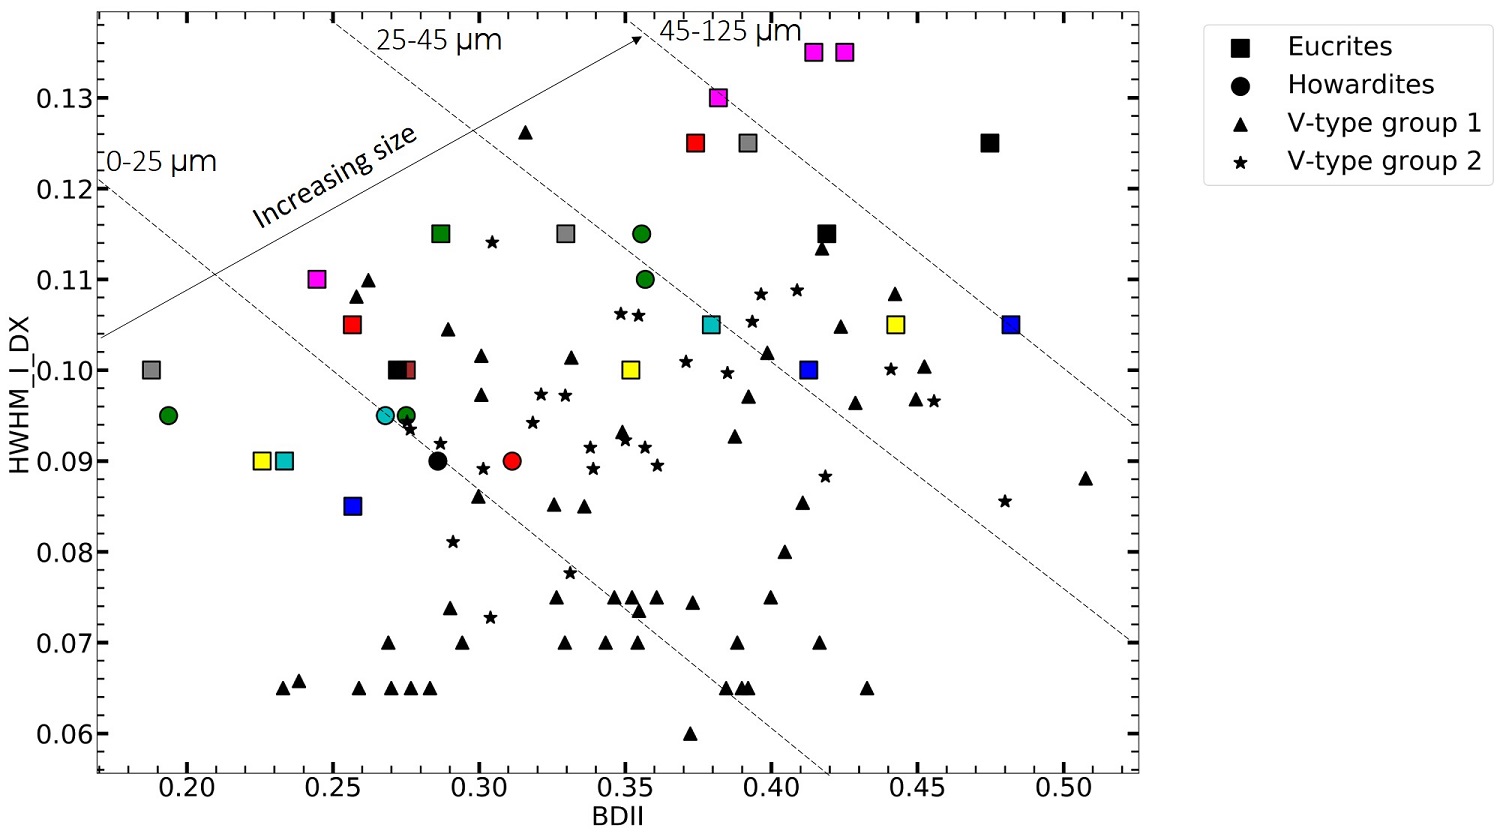
Figure 3: HWHM I DX vs BDII scatterplot on Eucrite, Howardite and V-type group 1 and group 2.
3. Results and conclusions
Through the scatterplot analysis (Figure 1) we observed that the asteroids have the same mineralogy of HED (same trend line) and an upper limit of grain size of 80 µm. Basing on these results, we applied Hapke retrieval on asteroid sample using the main endmembers of HED (plagioclase, clinopyroxene and orthopyroxene) and a fixed grain size range (Figure 2, Figure 3) to simulate spectra. In order to find the best fit, a R2 statistical test was performed.
Hapke procedure tested on HED spectra with known composition from [8] gave a global R2 with a mean value of 0.92. The 86 % of grain size, resulting from Hapke model on HED (with known and unknown composition [8]), lied in the declared range .
The Hapke procedure on asteroids sample had a R2 mean value of 0.97, in addition a mean grain size of ≈20 µm is given. This is in agreement with previous analyses.
So, our Hapke implementation, basing on the results of scatterplot analysis, is able to reproduce the spectral shapes and absorption features for all the V-type asteroids examined here, providing a globally satisfactory fit, confirming a link between V-type asteroids, HED meteorites and Vesta.
References
|
[1] |
M. C. De Sanctis, Meteoritics & Planetary Science 48, n. Nr 11, p. 2166–2184, 2013. |
|
[2] |
F. E. DeMeo, Icarus 202, p. 160–180, 2009. |
|
[3] |
N. A. Moskovitz, Icarus 208, p. 773–788, 2010. |
|
[4] |
P. S. Hardersen, «,» The Astronomical Journal, 156:11, p. 16, 2018. |
|
[5] |
P. S. Hardersen, The Astrophysical Journal Supplement Series, 221:19, p. 12, 2015. |
|
[6] |
P. S. Hardersen, Icarus 242, p. 269–282, 2014. |
|
[7] |
E. Palomba, Icarus 240, p. 58–72, 2014. |
|
[8] |
D. W. Mittlefehldt, Chemie der Erde 75, pp. 155-183, 2015. |
|
[9] |
M. Angrisani, «Master degree thesis,» Università Federico II, 2021. |
How to cite: Angrisani, M., Palomba, E., Longobardo, A., Raponi, A., and Dirri, F.: Spectral properties of V-type asteroids, Europlanet Science Congress 2021, online, 13–24 Sep 2021, EPSC2021-357, https://doi.org/10.5194/epsc2021-357, 2021.
The Herschel Space Observatory had two imaging instruments, working in the far-infrared and submillimetre regimes: the PACS cameras at 70/100 and 160 μm and the SPIRE photometers at 250, 350 and 500 μm. Small solar system bodies, especially main belt asteroids were serendipitously present in the field of view mainly in large scan maps. We identified these objects with the original aim to mark the affected sources in the Herschel PACS and SPIRE Point Source Catalogues. In our present study we are extracting flux densities in the PACS bands for asteroids above the detection limit, either using existing standard level 2 data products from the Herschel Science Archive, or re-reducing the PACS maps in the co-moving frame of the target.
We are performing aperture photometry on the PACS maps with the HIPE software, because it has all the necessary built-in functions and values for the aperture correction. To obtain high S/N flux densities we are using somewhat smaller aperture radii, namely 4, 5 and 8 arcsecs in blue, green and red bands, see Figure 1. For the faintest objects, where the S/N is below 10, we are using larger apertures of 6, 7, and 10 arcsec in radius, to get a higher encircled energy fraction. We are making a 5' cutout around the asteroid, which is being stored as a png file to allow us to make visual inspections of the source and its surroundings.
Using HIPE's annularSkyAperturePhotometry function we are performing the photometry, using the above mentioned aperture sizes and the built-in centroid algorithm. The initial coordinates are derived from RA and DEC values from JPL/Horizons. On the raw photometry results we perform the aperture correction with the photApertureCorrectionPointSource task, taking into account the band, the observation mode (parallel or not) and the scan speed. The centered aperture is also plotted on the cutout.
One of the most important and difficult task is to give a proper error estimation for the extracted fluxes. First, we are using the photometry error given by the HIPE tasks, and the coverage, to determine how much time the asteroid spent on the detector and assess the quality of the photometry. Finally we are adding 5 percent absolute flux calibration error.
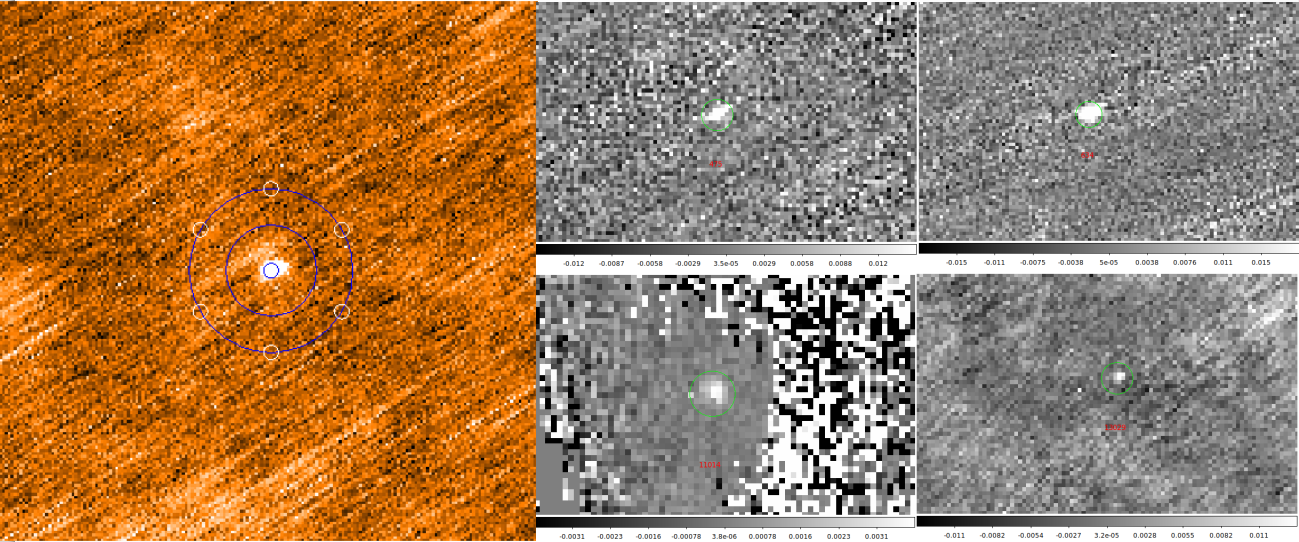
Figure 1. Left: (16) Psyche in red band. The aperture for photometry, and the annulus for background estimation is plotted on the image, as well as the apertures for an alternative error estimation. Right: Four serendipitously observed asteroids on blue maps with no shape model and very limited or no thermal measurements. Left upper: (475) Ocllo, Left bottom: (11014) Svatopluk, Right upper: (634) Ute, Right bottom: (13029) 1989 HA
With this method we extracted 633 flux densities of 275 asteroids, on 272 maps, 229 in the blue band, 179 in the green and 225 in the red band.
Five of the serendipitously observed asteroids are mission targets, and are well known, e.g. (1) Ceres, (4) Vesta. 59 of them have shape model and sufficient multi-mission thermal measurements, e.g. (13) Egeria, (43) Ariadne, 12 have shape model, but very limited or no thermal measurements, e.g. (212) Medea, or (675) Ludmilla. In these cases the new flux densities can help confirming the existing shape model and to develop thermophysical models for the asteroids. 48 have sufficient multi-mission thermal measurements, but no shape models, e.g. (58) Concordia or (128) Nemesis. Finally, 19 asteroid from our work don't have shape model and has very limited or no thermal measurements, e.g. (475) Ocllo or (634) Ute, see Figure 1.
We are planning to publish the new fluxes and these new flux densities will be included in the Small Bodies: Near and Far (SBNAF) Infrared Database (Szakáts et al., 2020). The fluxes obtained from Herschel are excellent for radiometric studies to get the object's size, albedo and maybe also thermal properties, when combined with other measurements (Alí-Lagoa et al., 2020).
A natural continuation of our current work is the extension to SPIRE maps to find serendipitous asteroids, extract new submm fluxes and flag sources in the SPIRE Point Source Catalog for possible contamination. For those asteroids which have thermal emission data available at shorter wavelengths the Herschel PACS and SPIRE measurements allow us to determine the far infrared and submmm emissivities.
How to cite: Szakáts, R., Kiss, C., Müller, T., Alí-Lagoa, V., and Pál, A.: Photometry of main belt asteroids from serendipitous Herschel/PACS observations, Europlanet Science Congress 2021, online, 13–24 Sep 2021, EPSC2021-761, https://doi.org/10.5194/epsc2021-761, 2021.
Introduction
Within the NEOROCKS project, we are performing a spectroscopic investigation of NEOs in the visible region, in particular, when available, of PHAs, with the Asiago Observatory telescopes (1.80m and 1.20m). Potentially Hazardous Objects are a subgroup of about 2000 NEOs on orbits that can make close approaches to the Earth and large enough to cause significant regional damage in the event of impact. More precisely, a NEO is a PHA if its minimum orbit intersection distance (MOID) with respect to Earth is less than 0.05 AU – about 19.5 lunar distances – and its absolute magnitude is brighter than 22, approximately corresponding to a diameter larger than 140 meters. Part of them has known orbits, and others are currently discovered and need rapid spectrophotometric investigation.Their observation is particularly challenging because of their typical faintness and their high rate of velocity.
With our observations we aim to perform the taxonomic classification of the objects, the study of their surface compositon and possible heterogeneity and the comparison with meteorites taken from known catalogues in order to investigate better the nature of the observed objects. The program is ongoing since its beginning in January 2020. The collaboration with the other members of the team, for example those performing photometric observations, further completes the study of these objects.
Observations
The data are obtained at the 1.22m Galileo Telescope and at the 1.80m Copernico Telescope at the Asiago Observatory, Italy. The Galileo Telescope is equipped with a Boller & Chivens spectrograph, the Copernico Telescope is equipped with AFOSC (Asiago Faint Object Spectrograph and Camera), for a spectral range 0.4-1 micron. The spectra are reduced using the standard IRAF routine and normalized at 0.55 micron. We have applied a median filter at 3 sigma to remove the cosmic rays and the spurious features (see Fig.1 with some examples of the obtained spectra).
Results
Since the beginning of the project, January 2020, in spite of the many problems caused by the pandemic as for example the closure of the Observatories to the observers for several months assuring only service mode, we have observed about 30 objects. Some of them are new discovered NEOs, including many PHAs, with size range from 60m to about 3000m. Most of them have not a taxonomic classification or not a clear one yet. We perform the taxonomic classification through a comparison with spectral type spectra from Bus-Binzel Taxonomy (2002) and with laboratory meteorites spectra from Relab database (http://www.planetary.brown.edu/relabdocs/relab.htm), using a least square method to obtain the best fit. We have found different types of asteroids, spanning from carbonaceous C to silicate S, and even more rare types as O or B. Some of the objects (eg, 1998 OR2) have been investigated spectroscopically along their known rotational period. This gives the further opportunity to investigate the surface variegation of the objects that, in some cases (when pole solution is known), we can also interpret in terms of observational surface coverage and therefore in terms of latitudinal and/or longitudinal surface variations (see Fig. 2 for an example). The observational campaign is still ongoing, we plan to add more objects to this survey and here we will present the preliminary results.
References
Bus, S. J., and R. P. Binzel 2002. Phase II of the small main-belt asteroid spectroscopic survey: A Feature-Based Taxonomy. Icarus 158, 146.
Devogele, M.; Virkki, A.;Marshall, S.E. et al. (2020). Bulletin of the American Astronomical Society, 52, 6, e-id 2020n6i415p04
Acknowledgements. This project has received funding from the European Union’s Horizon 2020 research and innovation programme under grant agreement No 870403.
*NEOROCKS Team: E. Dotto, M. Banaszkiewicz, S. Banchi, M.A. Barucci, F. Bernardi, M. Birlan, B. Carry, A. Cellino, J. De Leon, M. Lazzarin, E. Mazzotta Epifani, A. Mediavilla, J. Nomen Torres, D. Perna, E. Perozzi, P. Pravec, C. Snodgrass, C. Teodorescu, S. Anghel, N. Ariani, A. Bertolucci, F. Calderini, F. Colas, A. Del Vigna, A. Dell’Oro, A. Di Cecco, L. Dimare, P. Fatka, S. Fornasier, E. Frattin, P. Frosini, M. Fulchignoni, R. Gabryszewski, M. Giardino, A. Giunta, T. Hromakina, J. Huntingford, S. Ieva, J.P. Kotlarz, F. La Forgia, J. Licandro, H. Medeiros, F. Merlin, F. Pina, G. Polenta, M. Popescu, A. Rozek, P. Scheirich, A. Sergeyev, A. Sonka, G.B. Valsecchi, P. Wajer, A. Zinzi.
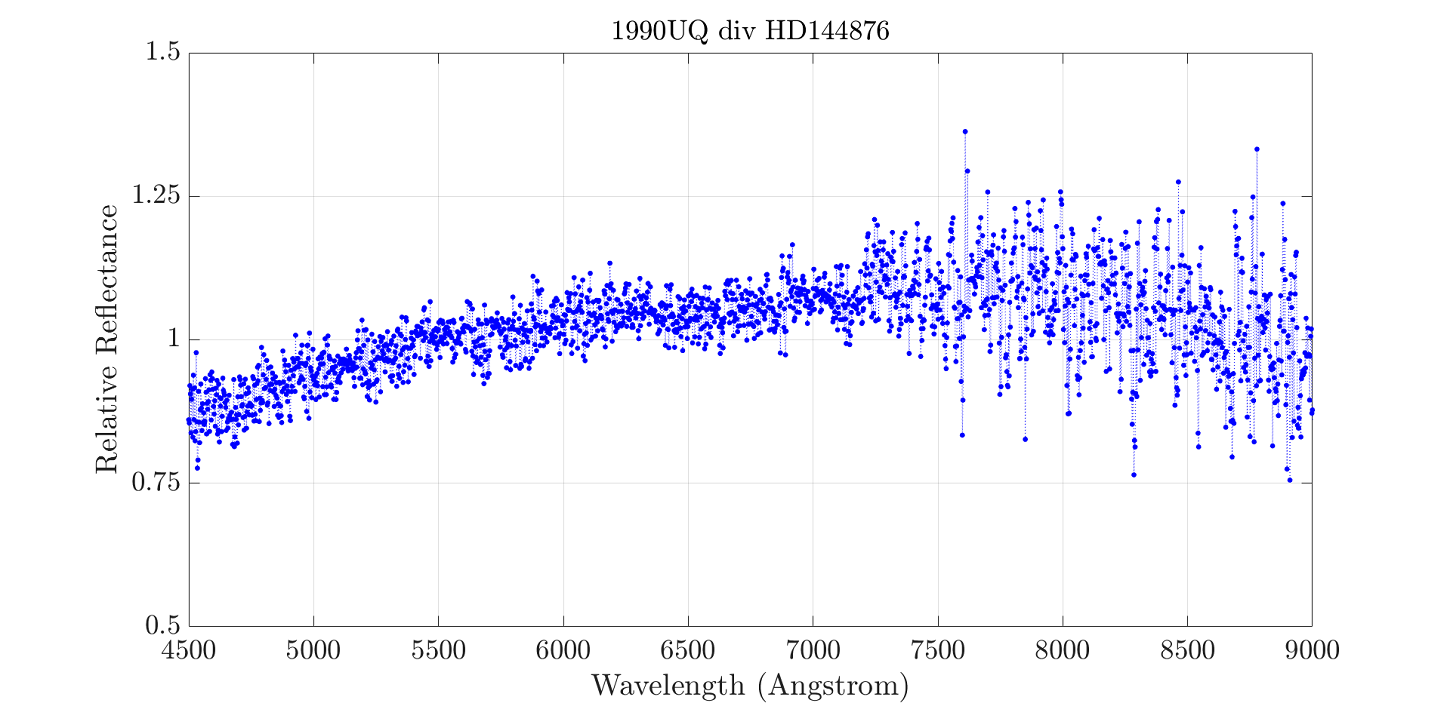
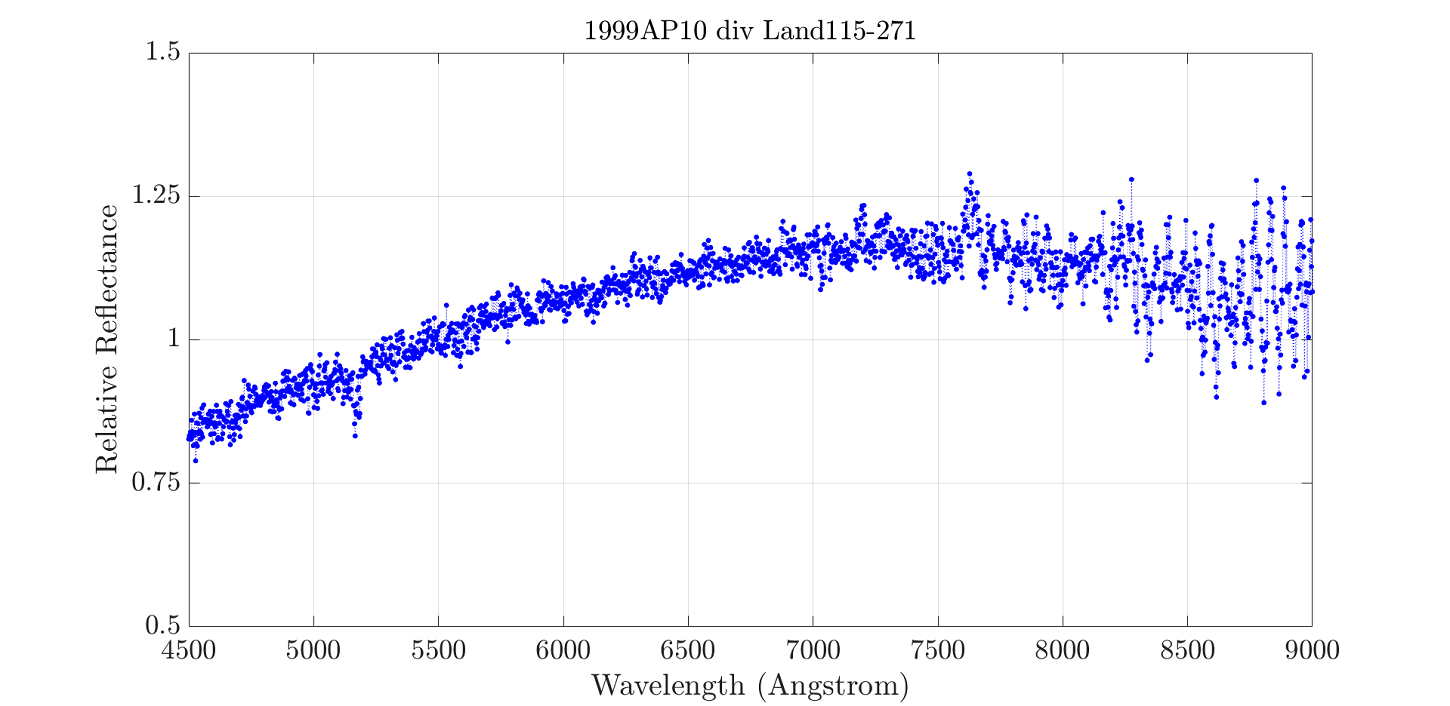
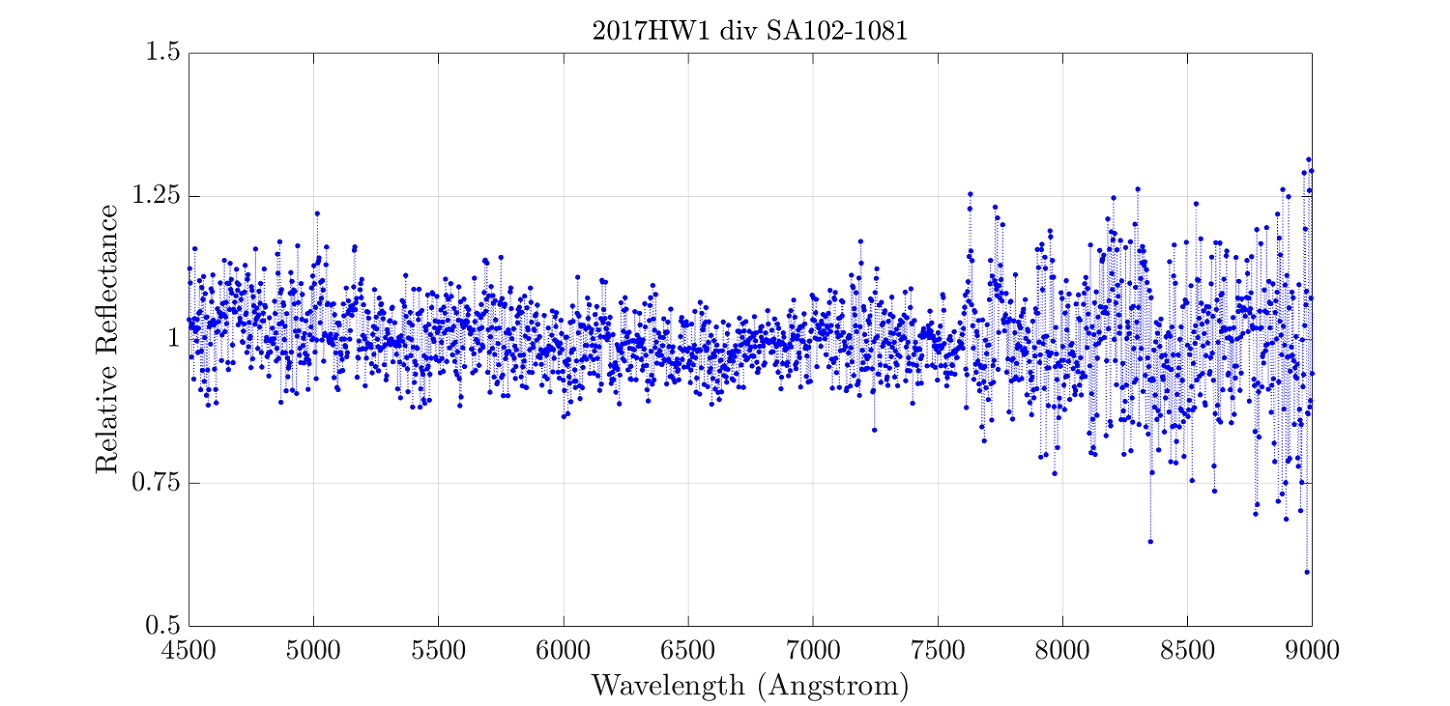
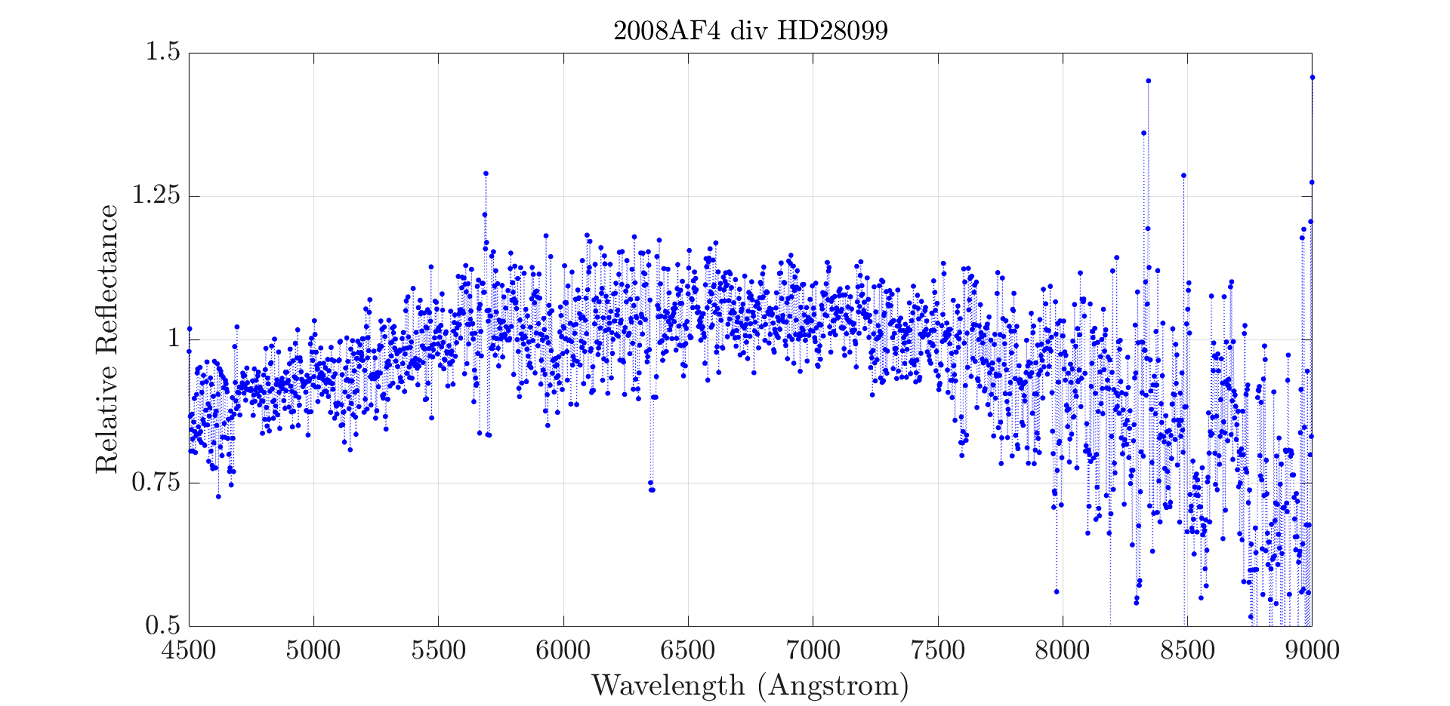
Fig.1 Some examples of the spectra obtained at 1.22 m Galileo Telescope in the spectral range 0.4-0.9 micron.
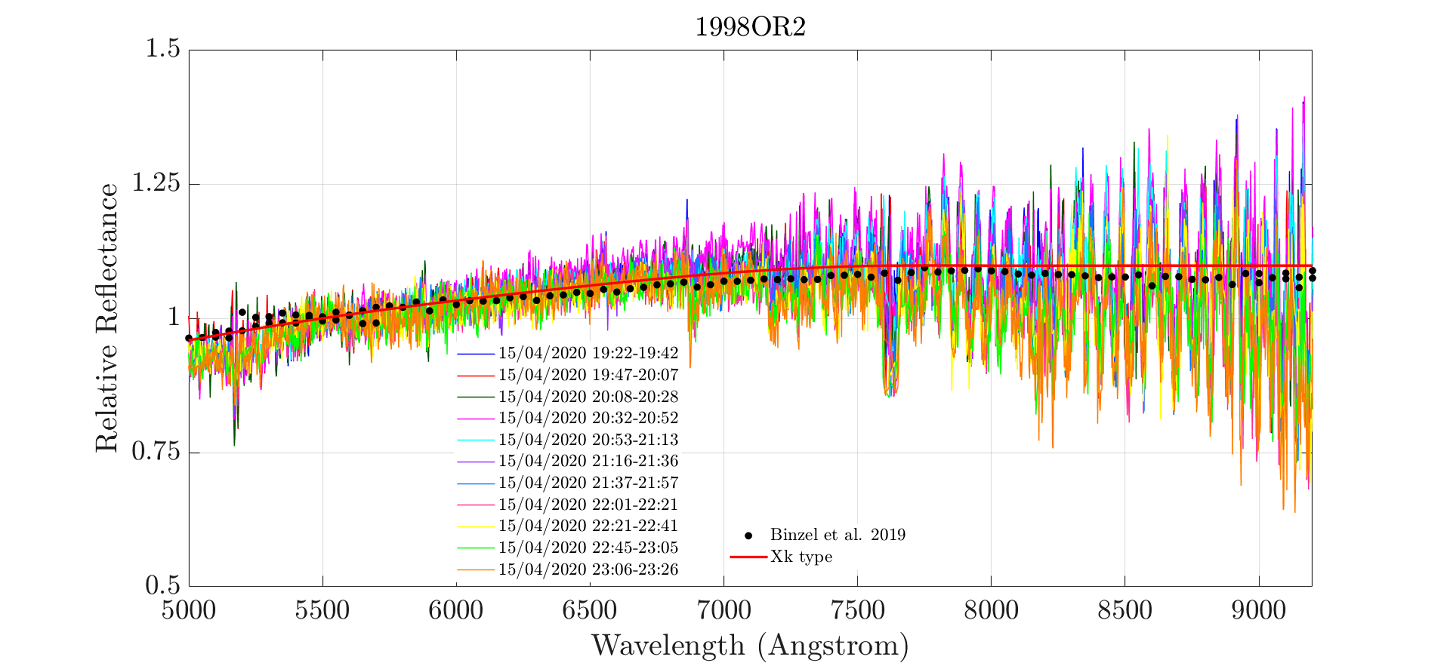
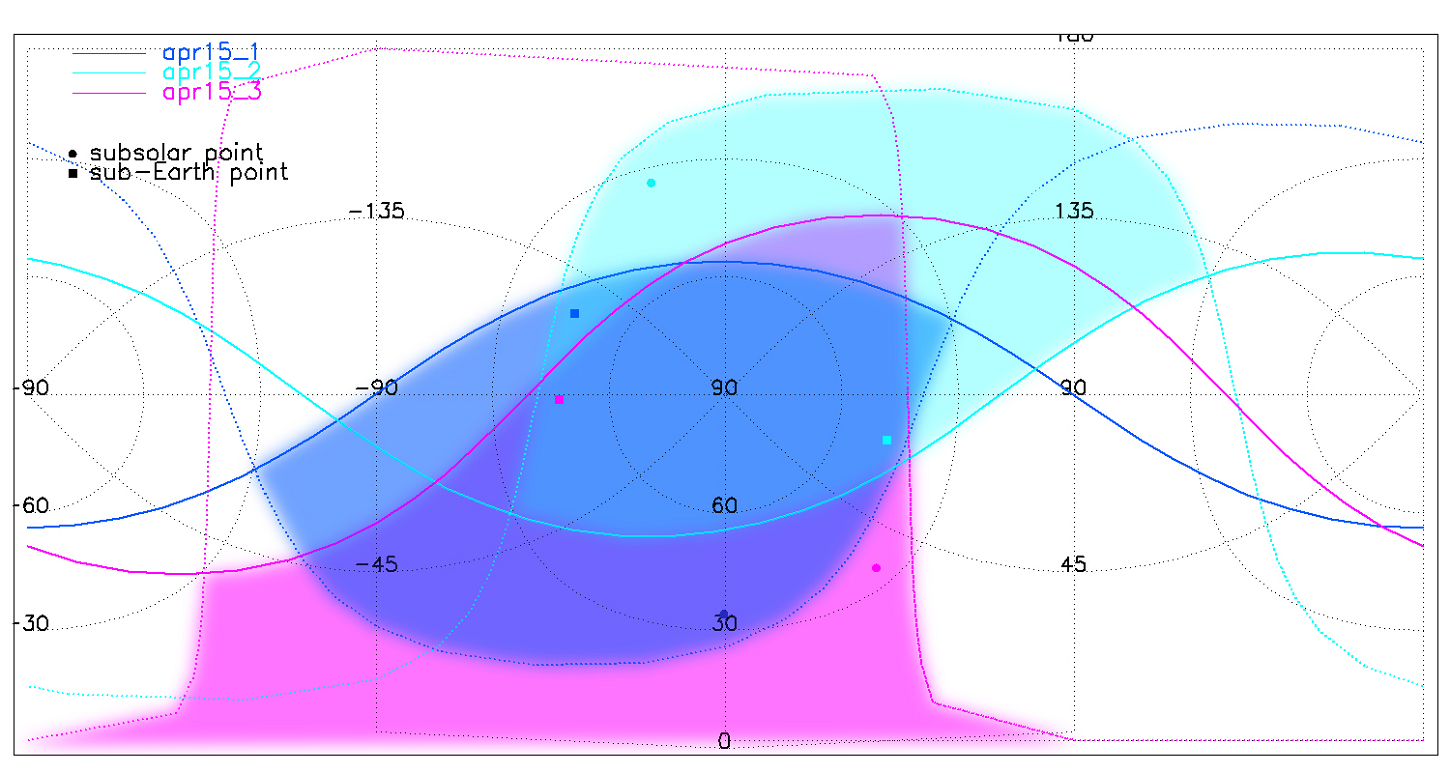
Fig.2 Eleven spectra of 1998 OR2 covering almost the entire rotational period of the asteroid compared with Xk taxonomic type and previous observation by Binzel. On the right, the computed geometry of the observations based on the pole solution by Devogele et al. (2020) that corresponds to the ecliptic coordinates (λ; β)= (331.0;+27.4) deg (Devogele, personal communication), and the rotation period of 4.109h∓0.001h (Devogele et al.2020).
How to cite: Lazzarin, M., Frattin, E., La Forgia, F., Ochner, P., and siviero, A.: Visible spectroscopic survey of Near-Earth Asteroids from the Asiago Observatory within the NEOROCKS project, Europlanet Science Congress 2021, online, 13–24 Sep 2021, EPSC2021-387, https://doi.org/10.5194/epsc2021-387, 2021.
Comet nuclei in the transneptunian region are submitted to heating at temperatures from 30 to 50 K over the age of the solar system [1]. The timescale for sublimated volatiles to escape the objects at these temperatures is long though [1]. Once these nuclei enter the inner solar system and become active, subsurface sublimation puts a gas phase in contact of the porous and tortuous ice structure of cometary material. In this context, the formation of clathrate hydrates may be considered as a plausible trapping mechanism of these gases, occurring in subsurface layers, and allowing some of the most volatile species to subsequently survive in cometary material at temperatures higher than the sublimation temperature of the corresponding pure solid [2].
Hydrates are ice-like crystalline compounds, resulting from the tridimensional stacking of cages of H-bonded water molecules. Clathrates are gas hydrates, meaning that the guests are gas molecules encased in a host framework of water molecules. Gas hydrates only form and remain stable in specific temperature and pressure regimes that depend on the nature of the guest molecules [3]. Theoretical phase diagram of clathrate hydrates show that it would be possible to form clathrates at very low pressure (10-10 bar) and temperature (< 80 K), but there is a critical lack of experimental data using these preparation methods [4]. Could clathrate hydrates be formed under conditions relevant to the interior of comet nuclei? The formation and characterization of these ice-like structures under such conditions could provide valuable experimental evidence for understanding the preservation of some volatile species during the thermally-induced evolution of comets.
In an effort to assess whether hydrates may play a role in maintaining volatile species in cometary material, FTIR spectroscopic identification of several species have been performed. We present results related to carbon dioxide and methane hydrates, in conditions relevant to cometary nuclei, i.e. at low temperature (10 K) and pressure (base pressure 10-7 mbar) regimes. To understand the nature of the gas hydrates formed under these conditions, vibrational spectra of distinct gas/ice interactions (clathrate hydrate, gas in/on water ice) were compared. The behaviour of the water crystalline skeleton interactions with the trapped molecules at different temperatures, as well as the influence of the gas mixture and the deposition method, will be presented.
Acknowledgements
This study is part of a project that has received funding from the European Research Council (ERC) under the European Union’s Horizon 2020 research and innovation programme (Grant agreement No. 802699).
[1] Prialnik et al. (2004) in Comets II, Festou, Keller and Weaver (Eds.), 359-387
[2] Mandt et al. (2017) in Comets as Tracers of Solar System Formation and Evolution, Mandt, Mousis, Bockel{\'e}e-Morvan and Russel (Eds.)
[3] Sloan (2003) Nature, 426, 353-359
[4] Choukroun et al. (2003) in The Science of Solar System Ices, Gudipati and Castillo-Roguez (Eds.), 409-454
How to cite: Esteves Lopez, N., Guilbert-Lepoutre, A., Coussan, S., Mascetti, J., Desmedt, A., and Aupetit, C.: Clathrate hydrates FTIR spectroscopy to understand cometary ices, Europlanet Science Congress 2021, online, 13–24 Sep 2021, EPSC2021-396, https://doi.org/10.5194/epsc2021-396, 2021.
Introduction:
The Haybusa-2 spacecraft approached the C-type Near Earth asteroid 162173 Ryugu on June 2018 [1].
Haybusa2 is equipped with three remote sensing instruments such i.e.
as the Thermal Infrared Imager TIR [2], the NIRS 3 spectrometer [3] and the Optical Navigation Camera-Telescopic (ONC-T) with a wideband and seven narrow band filters [4].
Ryugu is a top-shaped Cb type asteroid and is covered by a large number of boulders [5,6].
It is one of the darkest object in our Solar System with a quite homogenous composition, including OH-rich materials [7,9].
Method:
We found that the NIRS3 data contains sensible variations, possibly linked to geomorphological structures, even though Ryugu surface varies only of few percent in reflectance.
Our approach is to exploit the whole spectrometer dataset, to find correlation that could not be foreseen with traditional methods relying on fewer spectral points.
Past experience on Mercury data shows that this is a sensible approach, in case of homogeneous featureless targets.
We collect NIRS3 data from 20180711_l3a and 20180719_l3a counting around 20k useful spectra, covering almost the whole surface.
The data were windowed between 1.8 and 3.1 um to avoid residual thermal effects at higher wavelength, obtaining a data matrix of 20k row x 75 feature or bands.
Then we applied a PCA transformation step to retain 10 component or 98% of the total variance, effectively compressing the data from 75 to 10 components.
Even though the PCA components per se doesn’t normally have a clear physical meaning, because they mix spectral feature in an unpredictable way, it is interesting to look at the results.
The first PCA component has redder slope between 1.8 and 2.5 um, where the second has an inverted redder slope in the same range.
The third is spectrally flatter, with an hint of absorption between 2.4 and 2.5 um.
The concentration distribution of those three components is also worth investigating: the PCA.0 is anti-correlated with the equatorial bulge and higher in craters, PCA.1 is also higher in crater but not strongly anti-correlated with the equatorial bulge like PCA.0.
PCA.3 this is clearly showing a north-south asymmetry.
The PCA component order indicate also the importance in explaining total data variance.
After that, we apply T-distributed Stochastic Neighbour Embedding (t-SNE)[5]: this converts similarities between data to joint probabilities, minimize the divergence between the joint probabilities of the low-dimensional embedding and the high-dimensional data, typically 2 or 3 dimensions.
Essentially, we can feed high dimensional data and get a lower dimension 2D map representation were closer point are also close in the original data space that is easy to visualize.
On top of that we partitioned the data point using an Agglomerative Clustering algorithm: starting from all separated data point it clusters the closest together, where closeness is calculated with complete linkage, i.e.
the maximum distances between all observations in each pair of classes.
Hierarchical algorithm has the nice advantage to show which partition is more stable via a dendrogram plot.
In our case, a 6 classes parti tion show as the most suitable one.
Results:
The surface of Ryugu could be separated in 6 spectral classes, which have a similar spectral trend (Fig.1 top paner) and are spatially coherent (Fig.1 bottom panel)
Classes (0,1,5,3) have same trend, but different albedo (from lower to higher reflectance).
Class 0 and 1 (C0/C1) are inter-craters terrains, the former mostly in the north , the latter in the south, with minor outcrops in the other hemisphere. C0 is up to -2% darker than Global Mean Reflectance (GMR) and C1 up to +4% brighter.
Class 2 (C2) is the darkest class (-5% GMR), and it is found mostly in craters interiors.
Class 3 (C3) is the brightest (+5% GMR) and it is found on the the equatorial bulge, but interrupted by Urashima, Momotaro, Kintaro and Kolobock craters.
Class 4 and 5 (C4/C5) are two different trend of intermediate terrains. Those are the closest to GMR with a 2% variation around GMR. C4 is mostly found in the north, where C5 in the south, with substantial outcrops in the other hemisphere. The most interesting difference is that C5 follows the global trend of being slightly bluer than GMR between 1.9 um and 2.5 um, but C4 shows an inverted trend, being redder then GMR.
In conclusion, we find an automated approach to extract spatially coherent region on Ryugu surface based only on spectral data using almost the whole NIRS3 spectral range.
Those classes show a significant spatial correlation with geomorphological feature and different spectral trends. This work will be updated using photometrically corrected NIRS3 data .
This work will be applied to photometrically corrected data, that will show features inherently linker to surface materials properties.
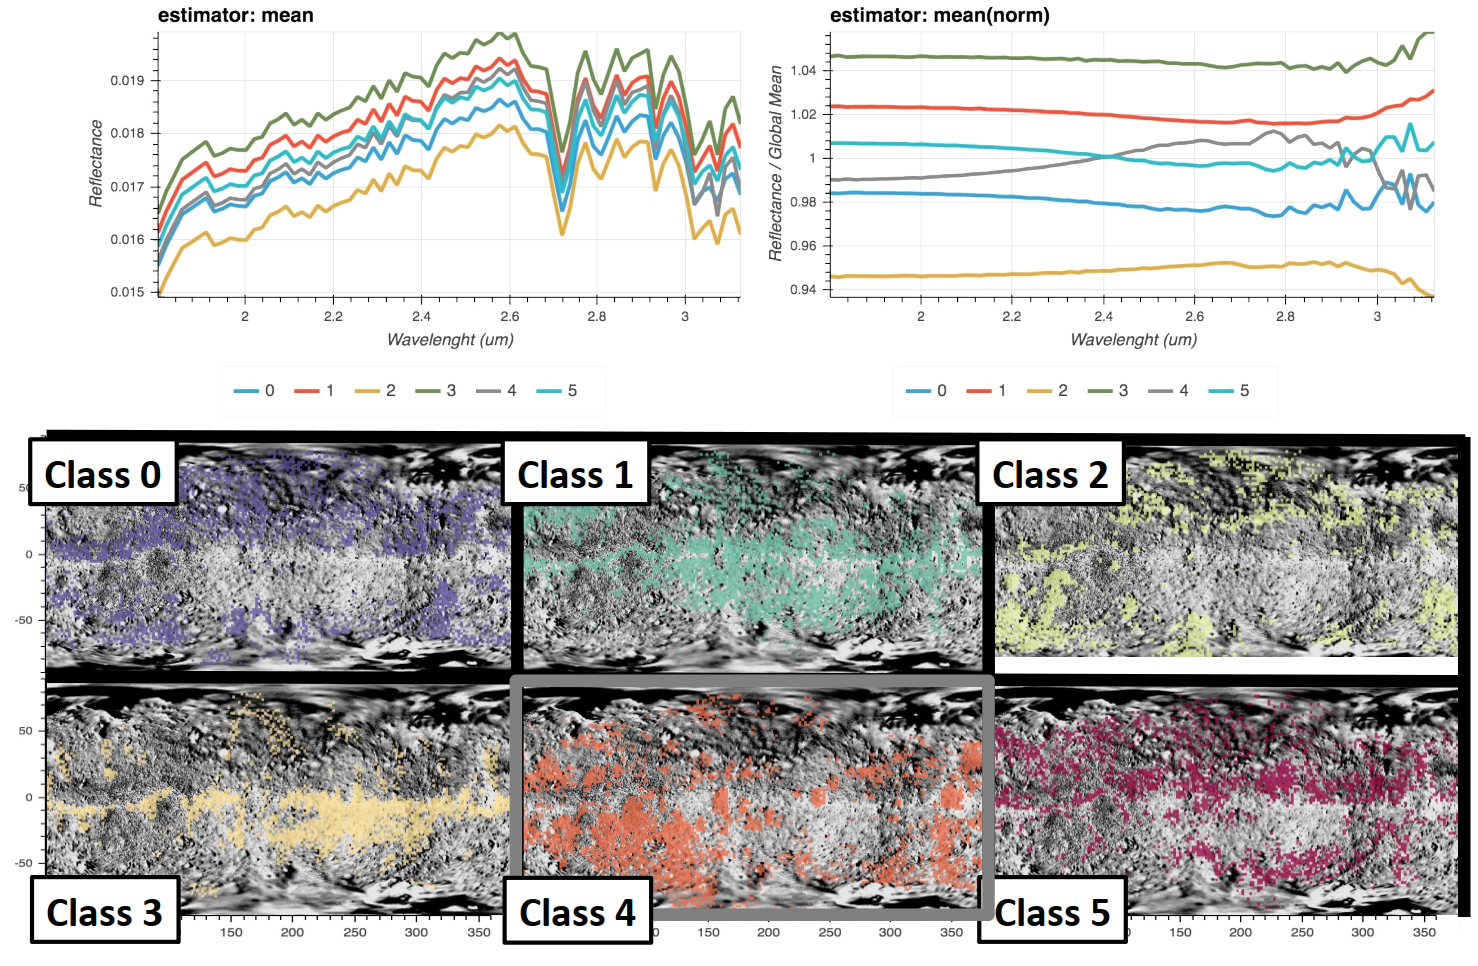
Fig.1 : (top panel) Classes average (left) and normalized to global mean (right). (bottom panel) Classes spatial distribution on the surface of Ryugu.
References:
[1] Watanabe S. et al. (2017) Space Sci. Rev. , 208, 3–16,
[2] Okada T. et al. (2017) Space Sci. Rev., 208, 255-286,
[3] Iwata T. et al. (2017) Space Sci. Rev., 208, 317–337 (2017),
[4] Kameda S. et al. (2016) Space Sci. Rev., 208, 17–31,
[5] Sugita et al., (2019) Science, 364, eaaw0422 ,
[6] Watanabe S. et al. (2019) Science, 364, 268-272 .
[7] Kitazato, K. et al., (2019) Science, 364, 272-275.
[8] L.J.P. van der Maaten, Journal of Machine Learning Research, 2008.
How to cite: D'Amore, M., Ernesto, P., Domingue, D. L., Matsuoka, M., and Kitazato, K. and the other authors: Update on Ryugu spectral surface regions classification: dimensionality reduction, manifold learning and unsupervised clustering of NIRS3 data, Europlanet Science Congress 2021, online, 13–24 Sep 2021, EPSC2021-553, https://doi.org/10.5194/epsc2021-553, 2021.
The optical constant of the material, meaning the complex refractive index m=n+ik, is an essential parameter when considering the reflection and absorption properties of that material. The refractive index is a function of wavelength of the light, and usually the imaginary part k is what governs the reflection or transmission spectral behavior of the material.
The knowledge of the complex refractive index as a function of wavelength, m(λ), is needed for light scattering simulations. On the other hand, rigorous scattering simulations can be used to invert the refractive index from measured or observed reflection spectra. We will show how the combination of geometric optics and radiative transfer codes can be used in this task.
In this work, the possible application is with the future visual-near infrared observations of Mercury by the ESA BepiColombo mission. That application in mind, we have used four particulate igneous glassy materials with varying overall albedo and in several size fractions in reflectance spectra measurements (hawaiitic basalt, two gabbronorites, anorthosite, see details from Carli et al, Icarus 266, 2016). The grounded material consist of particle with clear edges and quite flat facets, and we choose to model the particle shapes by geometries resulting from Voronoi division of random seed points in 3D space.
The refractive index inversion is done here using first a geometric optics code SIRIS (Muinonen et al, JQSRT 110, 2009) to simulate the average Mueller matrix, albedo, and scattering efficiency for a single Voronoi particle. Then, these properties are fed into radiative transfer code RT-CB (Muinonen, Waves in Random Media 14, 2004) to produce the reflective properties of a semi-infinite slab of these particles. This procedure is repeated for a 2D grid of particle size parameters x=2πr/λ, where r is the radius of particle, and imaginary part k of refractive index. In Vis-NIR wavelengths, the real part n is quite constant and is estimated to be about 1.58 for all the four glasses. From the simulated slab reflectance data with the 2D x, k parameter grid, we can first interpolate, and then invert the k parameter for any reflectance value with given wavelength and particle size.
The resulting spectral behavior of k for the four glasses and for all the size fractions was seems very realistic. Carli et al. (Icarus 266, 2016) inverted the k spectral behavior for these same samples using Hapke modeling, and the results are quite similar. Furthermore, we have measured the transmission of the material using polished slabs of varying thinkness, and will compare the results that can be dervied from these transmission results to those from relfectance measurements.
How to cite: Penttilä, A., Väisänen, T., Martikainen, J., Carli, C., Capaccioni, F., and Muinonen, K.: Rigorous inversion of absorption coefficient from spectral properties of particulate material, Europlanet Science Congress 2021, online, 13–24 Sep 2021, EPSC2021-689, https://doi.org/10.5194/epsc2021-689, 2021.
Abstract
This work is related to the spectral unmixing problem, where the goal is to estimate the abundances corresponding to the decomposition of an observed spectrum into a linear mixture of "pure" spectra, called endmember. This problem is a classic problem of spectral analysis in planetary science, see for instance [1]. If the use of a dictionary including a large number of spectra allows to refine the model, it makes the estimation problem particularly difficult, these spectra being highly correlated between them. Using the tool developed in [2], we illustrate how additional constraints can improve the quality of the estimated mixtures. In particular group exclusivity (only one spectra per group of spectra), is promising to handle a complex spectral database. We discuss here how groups can be defined in a practical planetary science problem.
Method
We proposed to use a new approach for the linear unmixing problem, based on mixed integer programs (MIPs) [3], where a binary variable encodes the presence or absence of each dictionary element in the mixture. This formulation allows to model exactly a large variety of problems incorporating different types of constraints, among which :
- positivity/sum-to-one (POS): all abundances are positive and sum-to-one. Even though these constraints are becoming usual in spectral linear unmixing problems [1], we stress that MIP can easily encompass them.
- exact sparsity (SPA): A low number of non-zero abundances (called “active component”) is expected in the mixture [4]. Where classical sparsity methods are limited, the MIP reformulation allows to approach the problem in "l0 norm" in its exact form, i.e: a constraint on Kmax the maximum number of non-null elements.
- structuring the dictionary (Group Exclusivity GE): We impose one active component among subgroups of spectra constituting the dictionary [5]. In the case of planetary surface, the definition of subgroups can be minerals, or family of minerals.
- minimum abundance (Significant Abundance SA): We constraint the abundances of the active components to be higher than a threshold. This constraint, relevant to model the search for significant components, is usually not addressed directly. Instead of a posteriori thresholding of abundances, MIP allows to directly include this constraint in the estimation of the abundances.
The resolution of optimization problems using MIP allows an exact resolution for problems of moderate size [2], which is often the case for the demixing problems. It has been shown that the solution can be reached in a reasonable time when the number of active components remains small (~10) for a spectral database composed of about 500 endmembers.
We tested the results on the USGS spectral library [6], composed of 481 spectra, sampled in the 113 wavelength, based on the OMEGA hyperspectral imaging spectrometer [7]. To face any discrepancies between the spectral library and the real data, we also added synthetic slopes that mimic the effect of grain size and aerosols contribution [1].
Here we propose and discuss ways to design groups, meaningful for planetary science cases. In addition to the natural mineralogical groups (simply by names of mineral), we also designed groups of minerals, that we called “family”. In addition, we also add a special family that contains the slopes, that are always active, in order to take into account the potential differences between spectral library and actual observation.
Results
Figure 1 shows a typical behavior in one synthetic example using different constraints. Figure 2 presents the same example as Figure 1, but with an alteration. The synthetic spectra is added by 0.1, in order to mimic a simple discrepancy between the spectral library and the actual data. In this case, one retrieved spectra is not exactly the same as the true one, but in the same family (both in the hematite group). Figure 3 presents the results of the proportion of the correct spectra/mineral/family that is retrieved as a function of SNR.
Discussion and conclusion
We proposed a way to group spectra into families and used this constraint to tackle the barrier of the limitation of the number of endmember in the spectral library. Group Exclusivity in addition to Significant Abundance or sparsity, seems a promising constraint to improve the spectral data analysis.
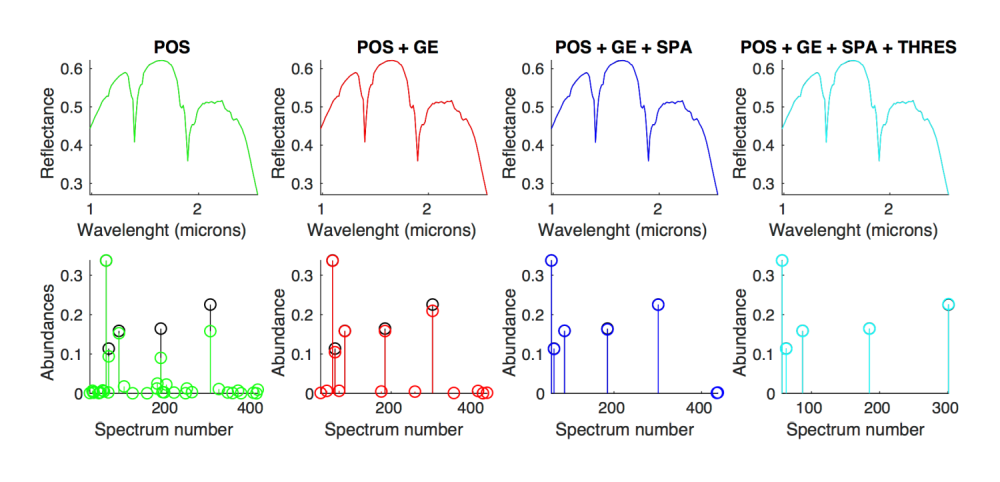
Figure 1 : Typical example of a mixture of Kmax=5 endmember out of 481 at noise level of 60 dB (very low noise level) black ground truth, color estimation. Using the POS constraints, the fit is acceptable, but the retrieved non null components are not corresponding to the actual active endmembers. By adding Group Exclusivity only (GE), all active components are detected. By adding sparsity (SPA) and significant abundance (SA), the results are drastically improved.
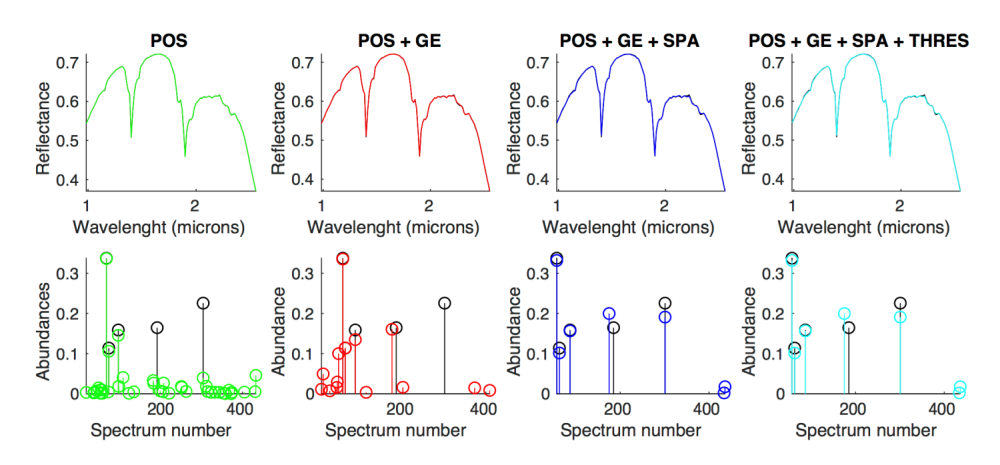
Figure 2: Same as Fig.1 but for a brighter synthetic spectra (synthetic spectra of Fig. 1 + 0.1). One detected spectra is not the same as the ground truth, but in the same family (hematite), leading to the same conclusion.
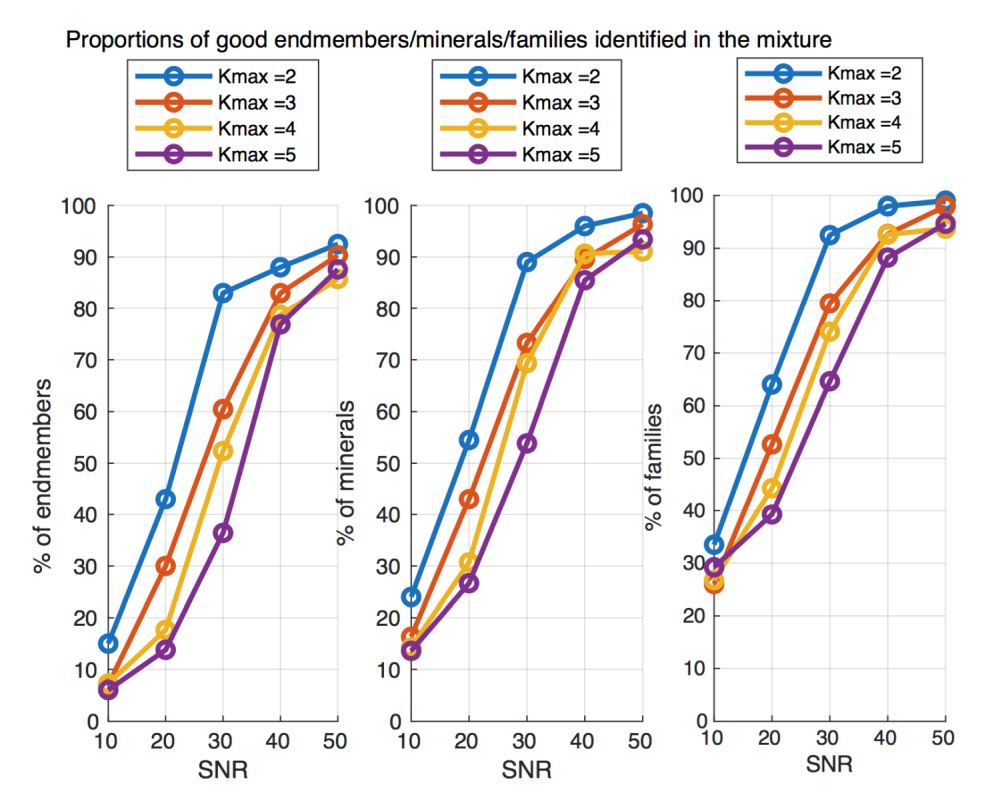
Figure 3: Average number of good endmember detection on 100 random examples, using POS + GE + SPA + THRES algorithm. At SNR 50, 90% of the endmembers are correctly detected, but 95% of the minerals (same mineral name), and 99% of the same family (same group of minerals).
Reference
[1] F. Schmidt, M. Legendre, and S. Le Mouelic, “Minerals detection for hyperspectral images using adapted linear unmixing: LinMin,” Icarus, vol. 237, 2014.
[2] Ben Mhenni, R.; Bourguignon, S.; Ninin, J. & Schmidt, F. Spectral Unmixing with Sparsity and Structuring Constraints Workshop on Hyperspectral Image and Signal Processing: Evolution in Remote Sensing (WHISPERS), 2018 9th Workshop, held 23-26 September 2018, Amsterdam, The Netherlands, 2018, 1-4,
[3] S. Bourguignon, J. Ninin, H. Carfantan, and M. Mongeau, “Exact sparse approximation problems via mixed-integer programming : Formulations and computational performance,” IEEE Trans. Signal Process., vol. 64, no. 6, Mars 2016.
[4] M.D. Iordache, J.M. Bioucas-Dias, and A Plaza, “Sparse unmixing of hyperspectral data,” IEEE Trans. Geosci. Remote Sens., vol. 49, no. 6, Juin 2011.
[5] L. Drumetz, T. R. Meyer, J. Chanussot, A. L. Bertozzi and C. Jutten, "Hyperspectral Image Unmixing With Endmember Bundles and Group Sparsity Inducing Mixed Norms," in IEEE Transactions on Image Processing, 2019.
[6] Clark, R. N.; Swayze, G. A.; Wise, R.; Livo, K. E.; Hoefen, T. M.; Kokaly, R. F. & Sutley, S. J. USGS Digital Spectral Library splib05a U.S. Geological Survey, U.S. Geological Survey, 2003 http://speclab.cr.usgs.gov/spectral-lib.html
[7] Bibring, J. P.;et al., OMEGA: Observatoire pour la Minéralogie, l'Eau, les Glaces et l'Activité Mars Express: the Scientific Payload, 2004, 1240, 37-49,
How to cite: Schmidt, F., Salomon, G., Mège, D., Gurgurewicz, J., and Bourguignon, S.: Spectral unmixing with positivity, sparsity and group exclusivity constraints, Europlanet Science Congress 2021, online, 13–24 Sep 2021, EPSC2021-665, https://doi.org/10.5194/epsc2021-665, 2021.
Introduction
The Visible channel of the Rosetta VIRTIS spectrometer is known to be affected by significant straylight, which makes it difficult to take advantage of its whole 230-1040 nm spectral range [1]. Straylight is by definition an extra signal due to photons reaching the detector through anomalous optical paths. The main evidence of contamination is the presence of residual solar (Fraunhofer) lines in calibrated reflectance spectra and anomalously high reflectance levels in the short-wavelength edge of the spectral range. The origin of such straylight in VIRTIS is twofold: a diffracted component, related to the IR diffraction grating, and a scattered one, related to internal reflections.
Diffracted straylight
The VIRTIS circular convex diffraction grating is formed by an outer corona optimized to disperse IR wavelength photons towards the IR detector through its diffraction order mIR = +1 and an inner circular part optimized to disperse VIS-NIR wavelength photons towards the VIS detector, through its diffraction order mV = -1 [2]. Both IR and VIS detectors are only sensitive to photons in their respective spectral range, but visible photons can reach the VIS detector also through diffraction on the IR grating portion. E.g., being VIS grating’s grooves 5 times denser (268 grooves/mm) than IR one (54 grooves/mm), the VIS detector is also illuminated by the order mIR = -5, which owns the same dispersion law. These photons simply add to those from order mV = -1, both forming the nominal VIS-NIR signal, calibrated by standard radiometric pipeline.
However, also other diffraction orders of the IR grating illuminate the VIS detector (namely orders mIR = -2,-3,-4,-6,-7,-8), spreading VIS wavelength photons each with its own dispersion law. As a result, the photons of a given wavelength, forming the signal at a given VIS spectel b once diffracted through the VIS grating, are actually contributing to the signal in other spectels, through IR grating higher diffraction orders [3]. The amount of spectral mixing introduced this way in the final spectrum depends on the overall shape of the radiance spectrum incident on the grating.
This unfavourable diffraction effect has been characterized, during ground calibration, by measuring in the laboratory the spectral efficiencies of IR grating higher orders. These lab data allow to model the diffracted straylight, enabling an effective technique for removing it from the VIRTIS-V space observations. The correction amount for any given spectrum is evaluated from the whole VIS spectrum itself, using an iterative method to gradually approximate the solution. The non-linearity of the problem forces evaluating the correction independently for each spectrum, hence no simple corrective factors can be found effective for the whole dataset.
Scattered straylight
Contrary to the diffracted one, scattered straylight is an out-of-field contamination, since the scattered photons impinging on a given detector pixel can also come from locations on the entrance slit different from that pertaining to that pixel. VIRTIS-V images across body limbs make clear the presence of such straylight, readily identifiable as an off-limb signal against the dark sky. Its spatial distribution, gradually dimming in going farther from the limb, demonstrates the interpixel correlation introduced by this effect.
The correction developed for this kind of contamination is based on two main points: a) the stability of the spectral shape of the off-limb straylight against variation of the target body and its location in the field of view, and b) the capability of VIRTIS-V of resolving some Fraunhofer lines and measuring their depth. However, the latter is only possible when the SNR in the blue side of the spectrum is high enough, and unfortunately this condition is not often met. A systematic application of this technique to the whole VIRTIS-V dataset is therefore not possible so far.
Discussion and conclusions
We describe separately two techniques for the removal of the two straylight components identified in VIRTIS-V spectra. Of course, the two phenomena take place at the same time and a complex interplay can exist between them. In good SNR condition, the estimation of the total straylight signal proceeds by alternatively iterating the two corrections, removing the straylight modeled at each iteration step from the original measured spectrum until convergence, which is usually reached in a dozen iterations.
However, the scattered straylight model shows a high sensitivity to the noise, amplifying and propagating the fluctuations in the Fraunhofer lines region to the whole spectral range. As a consequence, a full straylight correction can only be achieved in selected spectra subsets, e.g. pertaining to bright surface regions of target bodies.
Since the straylight correction here presented has been included in a full recalibration process of the entire VIRTIS dataset, to be provided to the ESA PSA archive, only the correction for diffracted straylight has been implemented. Even if this approach keeps significant straylight levels in the data, on the other hand it represents a minimal, deterministic, correction, which can make the basis for future developments.
Finally, it is worth noting the special case of stellar targets: while in the full pixel case the amount of scattered and diffracted straylight is comparable, in the case of point sources the former is expected much lower, if any. The diffracted straylight correction is in this case very effective in recovering the unperturbed spectrum in the full V range. Since these observations are used for in-flight calibration updates, the discussed correction may have significant consequences on the radiometric calibration of the whole dataset.
References: [1] Ammannito, A. et al., RSI, 2006, doi: 10.1063/1.2349308 ; [2] Filacchione, G. PhD Thesis 2006, doi: 10.6092/UNINA/FEDOA/1462; [3] Filacchione, G. et al., RSI 2006, doi: 10.1063/1.2360786.
How to cite: D'Aversa, E., Filacchione, G., Capaccioni, F., Carlson, R. W., Raponi, A., Ciarniello, M., and Rinaldi, G.: Rosetta VIRTIS-V channel straylight correction, Europlanet Science Congress 2021, online, 13–24 Sep 2021, EPSC2021-231, https://doi.org/10.5194/epsc2021-231, 2021.
Abstract
We are proposing a new approach for estimating the effects of photometry on Europa’s remote sensing data by estimating at the same time an albedo map as well as unique empirical photometric model for the surface from past observations, for engineering and mapping purposes.
Introduction
With its young icy surface covering a global water ocean, Europa is a strong contender in the search for habitability in our Solar System. Photometry plays a key role in deriving remote sensing science products. As such, photometric correction is often the first step of any remote sensing analysis such as mapping or spectroscopy. In itself, photometry is closely linked to the surface microtexture and can help us better understand the physical state of a surface. In this study, we are proposing to approach the issue of photometric correction by estimation an albedo map as well as a unique global photometric model.
Dataset
We are working from the dataset that we compiled for our regional photometric study [1] comprised of images from the Voyager probes dataset taken with the Imaging Science System (ISS) [2] and from the New Horizons spacecraft taken with the LOng Range Reconnaissance Orbiter (LORRI) [3] with a ground resolution between 10 km and 30 km at the subspacecraft point. All Voyager images are limited to the clear filter.
The entire data processing pipeline is described in [1] and [4]. This includes corrections of metadata errors - such as spacecraft position and camera orientation – distortion and absolute calibration inconsistencies. This last point ensures that two observations of the same location and same geometries are consistent, which was not the case in the raw dataset.
Method
- Model
We project each image of the dataset to a map with a 10º resolution both in latitude and longitude. We want to approximate the photometry of Europa as an albedo map of 10º by 10º modulated by a unique photometric model across the surface. In other words, for every point, we want to estimate the reflectance as:
r(lon, lat, e, i, g) = A(lon, lat) * f(e,i,g)
where:
- r is the reflectance
- lon is the local longitude
- lat is the local latitude
- e is the emission angle
- i is the incidence angle
- g is the phase angle
- A is the albedo map
- f is the global photometric model
For this study, we want to replicate our approach with several models:
- the Hapke model detailed in Hapke, 1993 [5]
- the Oren-Nayar model [6]
- a polynomial model defined as:
r = I/F = x0 + x1cos(i) + x2cos(e) + x3cos(g) + x4cos(i)cos(e) + x5cos2(i) + x6cos2(e) + x7cos2(g)
Estimation
Intuitively, we could try to estimate all the albedos and the photometric parameters at the same time. But this would be very inefficient and necessitate considerable computing power. Let's consider a global map sampled at 10° intervals. We have 36*18=648 values to estimate. If we choose the polynomial photometric model, this adds 8 parameters to estimate, which makes a total of 648+8=656 unknowns.
To have a more efficient estimation, we proceed in two steps:
- step 1: we select areas with dense coverage : the 20 locations with the densest number of pixels and the 20 areas imaged with the widest phase angle coverage. For these 40 areas, we have a unique set of 8 photometric parameters as well as an albedo value for each of them, which makes a subset of 48 unknowns.
- step2: we use the photometric results of step 1 to estimate the albedo values for the rest of the map.
We are using a Nelder-Mead simplex method to estimate the parameters. The complete algorithm is described in [7] and implemented in the fminsearch function in Matlab. It has been used in the past to estimate photometric parameters (e.g. [8]).
Preliminary results
Our preliminary results show good regional agreement with high resolution maps derived from Voyager and Galileo data [9, 10]. For example, on figure 1 showing our estimated albedo map, we can clearly see that the trailing hemisphere (east longitude 0º to 180º) is darker than the leading. Figure 2 shows the root mean square (RMS) values for each area. We see fairly low residuals across the surface.
Figure 1: Albedo map (resolution 10º) estimated for Europa
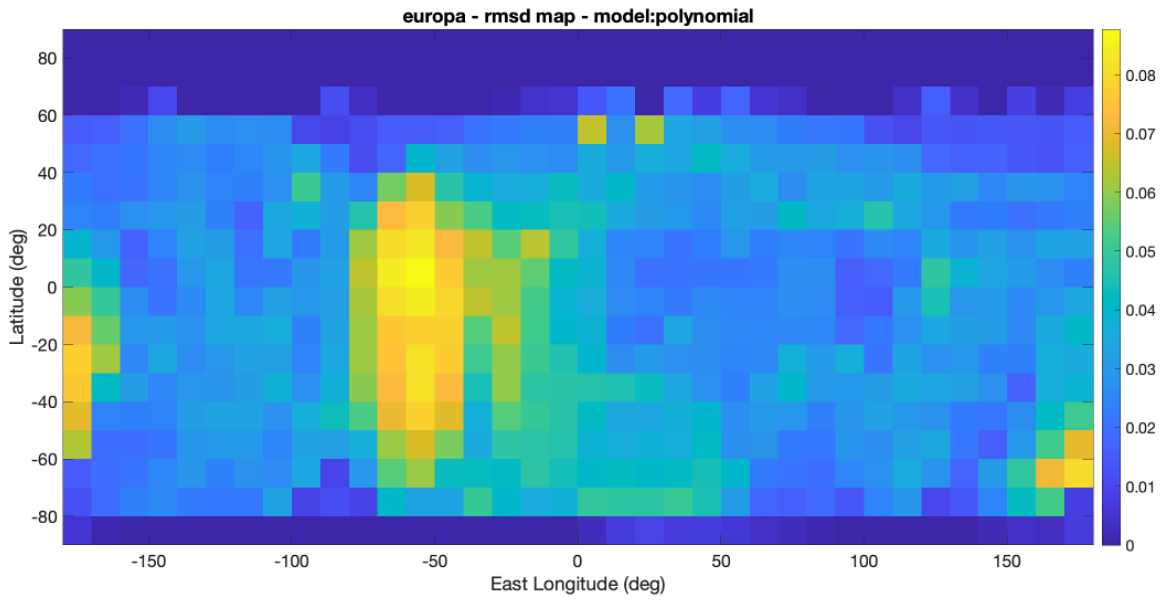
Figure 2: RMS map (in IOF units) obtained after estimation of albedo map and polynomial photometric model for Europa
Conclusion and future work
The preliminary results of this study are very encouraging in proposing a global photometric correction of Europa remote sensing data.
We plan on extending this work by using a more reliable estimation method based on previous work of estimating photometry using Bayesian statistics [1, 11, 12]. We would also like to provide a comprehensive analysis of the most common photometric models associated to this approach.
Acknowledgements
This work has been funded by the Université Paris-Saclay and the ESA research fellowship program.
References
[1] I. Belgacem et al. Regional study of Europa’s photometry, Icarus, 2019.
[2] A.Cheng , New Horizons Calibrated LORRI Jupiter Encounter v2.0, nh-j-lorri-3-jupiter-v2.0, NASA PDS, 2014.
[3] M. Showalter, VG1/VG2 Jupiter ISS processed images v1.0 VGISS_5101-5214, NASA PDS, 2013.
[4] I. Belgacem et al. Image processing for precise geometry determination, Planetary and Space Science, 2020.
[5] B. Hapke, Theory of reflectance and emittance spectroscopy. Topics in Remote Sensing, Cambridge University Press, 1993.
[6] Oren, M., Nayar, S.K. Generalization of Lambert's reflectance model, in: SIGGRAPH94, ACM Press, 1994.
[7] Lagarias et al., Convergence properties of the Nelder-Mead simplex method in low dimensions, SIAM Journal on Optimization 9, 1998.
[8] Masoumzadeh et al., Photometric analysis of asteroid (21) lutetia from rosetta-OSIRIS images. Icarus, 2015.
[9] U.S. Geological Survey, Europa Voyager - Galileo SSI Global Mosaic 500m v2, 2010.
[10] Kersten et al., Controlled global
564 ganymede mosaic from voyager and galileo images, under review at Planetary and Space Science
[11] J. Fernando, F. Schmidt, and S. Douté, Martian Surface Microtexture from Orbital CRISM Multi-Angular Observations: A New Perspective for the Characterization of the Geological Processes, Planetary and Space Science, 2016.
[12] F. Schmidt and S. Bourguignon, Efficiency of BRDF sampling and bias on the average photometric behavior Icarus, 2019.
How to cite: Belgacem, I., Schmidt, F., and Le Contellec, A.: Photometry of Europa: estimation of albedo map and empirical global photometric model, Europlanet Science Congress 2021, online, 13–24 Sep 2021, EPSC2021-276, https://doi.org/10.5194/epsc2021-276, 2021.
Introduction
The JAXA/Hayabusa2 mission observed the Ryugu asteroid for one year and half (e.g., Yoshikawa, 2021) and acquired images by means of the ONC camera (Sugita et al., 2019) and NIR spectra in the 1.8-3.6 microns range thanks to the NIRS3 spectrometer (Iwata et al., 2017).
Ryugu is a very dark body (albedo of 0.043, Sugita et al., 2019) and its NIR spectrum is characterized by the shallow 2.72 and 2.8 microns absorption bands, ascribed to OH stretiching and thus indicating a weak hydration (Kitazato et al., 2019).
Photometric properties are very useful to infer optical and physical properties of the surface. The Ryugu photometry in the visible range has been studied by Tatsumi et al. (2020), which retrieved the average geometric albedo and the visible phase reddening. Pilorget et al. (2020) studied the NIR photometry observing a local anti-correlation between albedo and band depth.
In this work, we focus on the photometric behavior of the main spectral parameters, describing the Ryugu’s NIR spectrum, i.e., infrared reflectance, albedo and spectral slope.
Method
We performed a statistical analysis of the NIRS3 dataset acquired between the two Hayabusa2 touchdown operations on Ryugu (i.e., between February and July 2019). The method is based on an empirical model already applied on several small bodies (e.g., Longobardo et al., 2017, 2019) and consists of the following steps:
- Removal of the topography influence by applying a disk function which removes the influence of incidence and emission angles. We selected the Akimov disk function (Shkuratov et al., 1999);
- Retrieval of the median value of spectral parameters at different phase angles;
- Fit of the median spectral parameter as a function of the phase angle;
- Comparison with behaviors observed on other small bodies
Results and discussion.
Infrared albedo. Due to the small phase angle coverage (15°-40°), we approximated the phase function as a straight line (Figure 1) and compared its slope with the slope of the phase function of other asteroids retrieved in the infrared range. We found a similarity between Ceres and Ryugu and flatter phase functions for Eros and Vesta, confirming the well known anti-correlation between albedo and phase function steepness.
Figure 1. Ryugu’s phase function.
2.72 and 2.8 band depths. Band depths are observed to decrease with increasing phase angle. This is a unique behavior that has not been observed on any other small body visited by a space mission. This behavior can be ascribed to Ryugu’s very dark surface (~2% of incident light is reflected from the surface, Sugita et al., 2019; Kitazato et al., 2019), in which the role of multiple scattering is negligible and the large absorption properties of the surface reduces the radiation reflected at larger phase angles.
Photometrically corrected band depth seems uncorrelated with albedo. This does not contradict the outcomes by Pilorget et al. (2020), which found a local anticorrelation. As a matter of fact, the anticorrelation is observed locally and limited to the darkest regions, while we studied a global behavior.
Infrared slope. A small phase reddening is observed, very similar to that observed by the ONC camera in the visible range (Tastumi et al., 2020). This is a different behavior with respect to other small bodies, where the visible phase reddening is generally larger than the infrared one. This could be ascribed to absence of multiple scattering and/or to microscopically smooth particles on Ryugu
Photometrically corrected infrared slope anticorrelated with albedo, confirming outcomes of previous works (e.g., Galiano et al., 2020).
Conclusions
The Ryugu’s photometric behavior is generally similar to other dark asteroids. Nevertheless, the photometric behavior of spectral parameters is some cases is different, mainly due to its very low albedo and probably to smoother particles.
References:
Galiano et al., 2020, Icarus 351, 113959; Iwata et al., 2017, SSR 208, 317-337; Kitazato et al., 2019, Science 364, 6367, 272-275; Longobardo et al., 2017, MNRAS 469, 346-356; Longobardo et al., 2019, Icarus 240, 20-35; Pilorget et al., 2020, Icarus 355, 114-126; Sugita et al., 2019, Science 364, 6437, 252; Tatsumi et al., 2020, A&A 639, A83; Yoshikawa, 2021, in Sample Return Missions, Elsevier, ISBN 9780128183304
How to cite: Longobardo, A., Palomba, E., Galiano, A., Dirri, F., Zinzi, A., D'Amore, M., Domingue, D., Kitazato, K., and Schroeder, S. and the Hayabusa2/NIRS3: Photometric behavior of the Ryugu’s spectral parameters retrieved from NIRS3 spectra, Europlanet Science Congress 2021, online, 13–24 Sep 2021, EPSC2021-292, https://doi.org/10.5194/epsc2021-292, 2021.
Physically realistic simulated images of small bodies are needed, for example, when planning for space mission operations and testing for performance of imaging instruments on board. With smaller bodies (asteroids, comets), the geometry of the body and the photometric properties of the surface might not be known in detail before the mission. However, one can use rougher shape models and simulate realistic small-scale surface features such as boulders, craters, and albedo variations. Using this kind of simulated target shape, one can employ ray tracing software such as Blender (https://www.blender.org/) and create physically realistic models of irradiances received by a camera on a spacecraft with given position.
We have developed a Python/Blender-based software package (https://bitbucket.org/mariofpalos/asteroid-image-generator/) that is targeted to simulate the performance of the ASPECT hyperspectral camera onboard the MILANI CubeSat on ESA Hera mission. We also seek to develop the package to be used with the MIRMIS hyperspectral camera onboard the ESA Comet Interceptor mission. The package can both be used to produce the simulated image of the target in given observing geometry, and the same image when taking into account the optics throughput and the sensitivity of the detector. Planetary photometric functions such as Lommel-Seeliger and ROLO models are programmed as Blender shaders for realistic output. Therefore, the tool can be used to optimize the mission operations from the imaging point of view, and to verify the performance of the imaging instrument in the planned conditions.
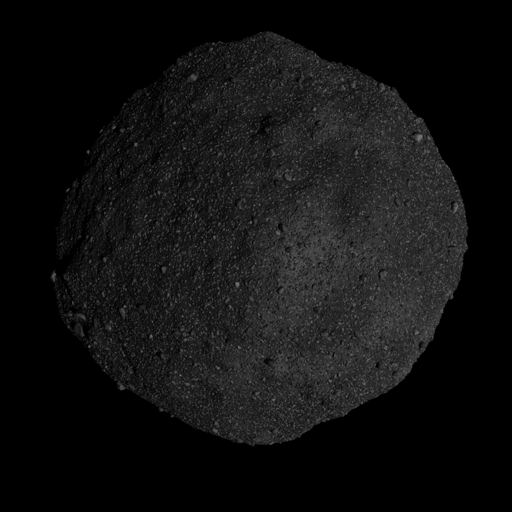
Figure: An example image of rough-scale geometric model of the asteroid (101955) Bennu with simulated procedural small-scale details on the surface. The visualization is done in Blender using Lommel-Seeliger photometric shader.
How to cite: Penttilä, A., Palos, M. F., and Kohout, T.: Realistic visualization of solar system small bodies using Blender ray tracing software, Europlanet Science Congress 2021, online, 13–24 Sep 2021, EPSC2021-791, https://doi.org/10.5194/epsc2021-791, 2021.
Introduction Reflectance spectroscopy is a common tool used to retrieve physical and mineralogical information on Solar System planetary bodies. However, the reflectance spectrum of a surface depends on several parameters, including the illumination condition and observing geometry [1]. The observed reflectance of small bodies is generally compared to laboratory measurements of meteoritic samples or terrestrial analogues to assess the composition and alteration history of the target’s surface. Laboratory measurements are performed in a controlled environment, where the composition and texture of the sample are known and the illumination and observing geometry is fixed. However, if the spectroscopic observations of the small body are unresolved, its reflectance is integrated over the whole observed surface, which averages spatial compositional and textural heterogeneities and changes in the illumination and observation geometries due to both the shape of the object and the topography of its surface (slopes, craters, …).
Here we use spectral bidirectional reflectance of terrestrial analogues measured in the laboratory and applied on 3D model of the small body (4)Vesta. We simulate the observation of these bodies by a spacecraft during a spot-pointing manoeuvre and two different fly-bys, and compare them with the spectroscopic results obtained in the laboratory.
Sample, measurements and inversion models We consider a fine powder of howardite as a reference sample for the surface of Vesta. The laboratory Bidirectional Reflectance Distribution Function (BRDF) measurement, and inversion procedure used to model the reflectance of the surface under any triplet of incidence, emergence, and phase angles are described in [2, 3]. Two generic models are considered: parametric RTLSR and physical Hapke.
Simulation of the observations We apply the BRDF model of the howardite on each facet of the shape model of Vesta. This results in a simulated body homogeneously covered with the surface studied in the laboratory. We then simulate image acquisition by a simple pinhole camera under various illumination and observation conditions to recreate a spot-pointing manoeuvre and two fly-bys: one following the equator (hereafter called “equatorial fly-by”), the other following a meridian line (hereafter called “polar fly-by”). As an example, Figure 1 presents the images resulting from the simulation of the equatorial fly-by with a phase angle ranging from 6 to 135°. For comparison purposes, the spot-pointing and equatorial fly-by scenarios at phase angle 30° point toward the same spot on the surface and present identical illumination and observation conditions.
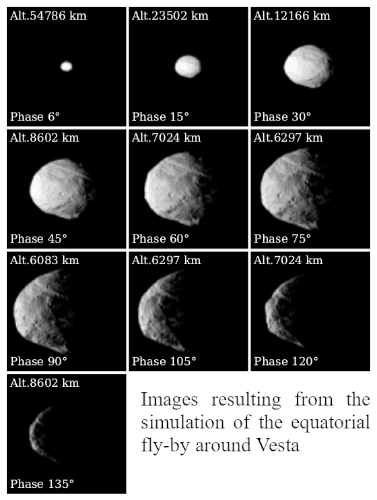
Comparison of the phase curves Unresolved reflectance spectroscopy of the simulated Vesta is calculated for each image with comparison to a Lambertian sphere of similar size. We define, as a function of the phase angle, the photometry as the value of reflectance measured at 740 nm. We also compare the spectral parameters derived from the observations to those derived from the laboratory measurements and their RTLSR modeling. Figure 2 presents the evolution of the reflectance, spectral slope and 3µm band depth with increasing phase angle for each simulated observation.
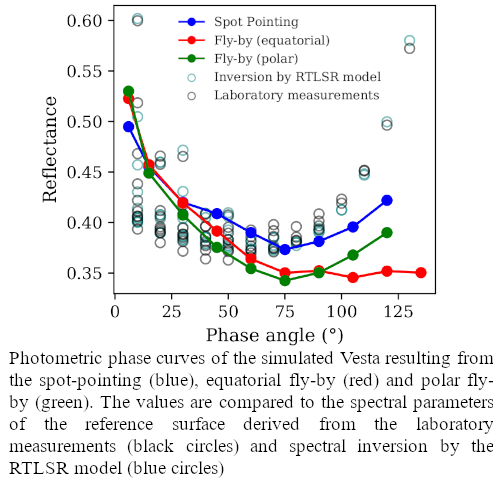
We observe that the photometric phase curve of Vesta strongly depends on the type of observations. The phase curve resulting from the spot-pointing presents roughly the same evolution as what has been measured in the laboratory. The reflectance measured on the spot-pointing differs from the reference for phase angles wider than 90°. The phase curve resulting from the polar fly-by present the same concave evolution with increasing phase angle, but its reflectance value differs from the reference for phase angles wider than 60°. Finally, the phase curve resulting from the equatorial fly-by presents the most differences from the reference surface. With increasing phase angle, the unresolved reflectance of the simulated Vesta only decreases until reaching a plateau around 0.35. The composition of the observed small body being constant between each experiment, the variations detected here on the phase curves are only due to the variation of shape and topography of the surface, resulting in various local incidence and emergence angles on the surface of the simulated Vesta. As an example, Figure 3 presents the distribution of the local emergence angles at phase angle 90° on each simulated observation.
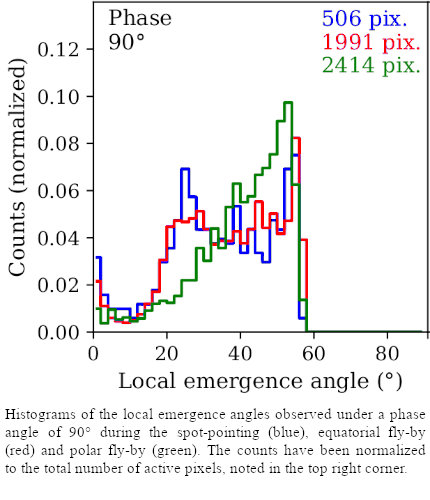
The global shape of the small body and topography of its surface induce variations in local incidence and emergence angles, leading to differences between the observed reflectance and the values measured in the laboratory on the reference surface. Moreover, the different simulations presented here induce a variation of the illumination and observation conditions, observed areas on the surfaces and projected shape of the body. These thus create the differences observed when analysing the photometric phase curves.
Conclusion We compared the photometric phase curves resulting from simulated non-resolved observation of Vesta under various scenarios. We observed that the evolution of the reflectance strongly depends on the illumination and viewing conditions. Moreover, the projected shape and topography of the surface will lead to the observed reflectance differing from the direct measurement on the reference surface.
References [1] Potin et al. (2019) Icarus, 333, 415-428 [2] W. Lucht et al. (2000), IEEE Trans. Geosci. Remote Sens., 38, 977-998. [3] Z. Jiao et al. (2019) Remote Sens. Env., 221, 198-209.
How to cite: Manigand Potin, S. and Douté, S.: Comparison of photometric phase curves resulting from various observation scenes, Europlanet Science Congress 2021, online, 13–24 Sep 2021, EPSC2021-99, https://doi.org/10.5194/epsc2021-99, 2021.
The reflection of visible/near-infrared light from Mars can vary depending on the directional scattering characteristics of surface materials. Multispectral images have been acquired in situ under different illumination/viewing angles by the Viking and Mars Pathfinder landers, the Mars Exploration Rovers (MER), the Mars Science Laboratory (MSL) Curiosity, and the Mars 2020 (M2020) Perseverance rover. We review the use of these data sets with radiative transfer models to constrain the single scattering albedo (w), phase function, surface roughness, grain size and/or porosity of martian materials.
Soils at the Viking Lander sites were modeled with the initial version of the Hapke model [1], which showed wavelength–dependent backscattering phase functions [1-3] (Fig. 1). Model results suggested that variations in thickness of nanophase ferric oxide coatings could explain differences between darker and brighter rock facet colors [4]. Surfaces exhibited a strong opposition effect and smooth rock surfaces exhibited specular reflections, consistent with rocks abraded by wind [4].
Fig. 1. Viking Lander 2 red filter images: (a) Sol 045, incidence=85.1° showing pronounced specular reflection in ~20 cm rock (arrow); (b) Sol 025, incidence=29.1°[4].
The Imager for Mars Pathfinder (IMP) acquired multispectral images at phase angles from near 0° to ~155°. “Bright soil” materials appeared brighter and redder than “dark soil” materials, whereas “gray” rocks were interpreted to be relatively less dust-covered than “red” rocks [5]. The phase curves suggested a dominantly backscattering function, although a strong forward scattering component was observed for gray rocks. The w values of bright soils were highest in red and near-infrared bands, whereas w for gray rocks was highest at 443 nm. The single particle scattering function parameters b (asymmetry parameter) and c (backscattering fraction) were compared to those modeled from laboratory data of artificial particle types [6]. Soils and red rocks clustered at high c values, near materials with a high density of internal scatterers. The gray rocks exhibited lower c values similar to agglutinates and rough, clear spheres, consistent with smooth surfaces (possibly a coating) similar to terrestrial varnished rock surfaces [4,6]. The opposition width parameter h was relatively larger for the dark soils, implying materials with lower porosity and/or a more uniform particle size distribution. Conversely, the gray rocks’ low values suggested materials with higher porosity and/or a broader particle size distribution than red rocks. The opposition effect amplitude (B0) decreased with increasing wavelength, which suggested that these materials were more opaque (more surface scattering) in blue wavelengths, and become more transparent (more internal scattering) at longer wavelengths [cf. 8].
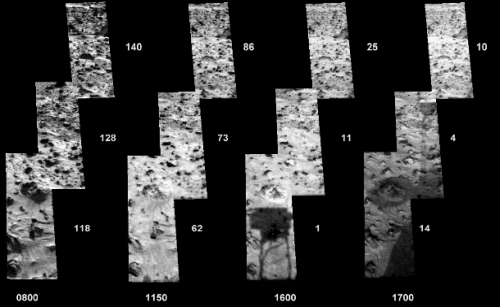
Fig. 2. IMP images (752 nm) with acquisition times (bottom) and phase angles (sides) shown. Note shadow of IMP camera head in 16:00 and 17:00 images[5].
Spectrophotometric observations acquired throughout the MER missions by the Panoramic Cameras (Pancams) were used to investigate the surface scattering properties of the basaltic rocks and soils in Gusev crater (Spirit) and the sulfate-rich outcrop rocks, hematite-bearing spherules and basaltic sands in Meridiani Planum (Opportunity) (Fig. 3). A Hapke model [9] was used in combination with corrections for diffuse sky illumination and local surface facet orientations (derived from stereo images) to analyze photometric observations [10-13] (Fig 4.). At the Spirit site, modeled w values among all typical “Soil” units were similar except for areas subjected wind events. “Gray” rocks were less contaminated with dusty coatings than “Red” rocks and were typically more forward scattering. Gray rock surfaces were consistent with rough/irregular particles with few internal scatterers [6], whereas Red rock and most Soil surfaces exhibited more internal heterogeneity. Most Red rocks and Soils were more porous (or exhibited a less uniform grain size) than Gray rocks and generally exhibited lower macroscopic roughness values. The w values of spherule-rich soils along the Opportunity traverse varied (due to dust coatings), and outcrop rocks exhibited the highest w values. Spherule soils were typically backscattering and consistent with particles with internal scatterers and/or rough, clear spheres. Observations of large drifts were modeled with w values that exhibited a downturn toward 1009 nm, consistent with minor hydration [14]. These “Dust” deposits were the smoothest of all units studied by Opportunity and exhibited the highest h values, suggesting a more homogeneous grain size distribution and/or lower porosity.
Fig. 3. MER Opportunity Pancam images of Tipuna rock on Sols 306-307 (a)09:06, (b)11:42, (c)14:46, (d) 16:08, (e) 17:05[11].
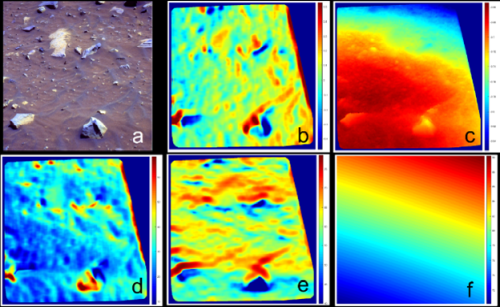
Fig 4. Example of geometric information computed from MER Spirit Pancam stereo images from the Troy area: (a) false-color image, Sol 1944, 10:32; (b) surface normal (x direction); (c) z-value; (d) incidence; (e) emission; (f) phase angle[15].
MSL has collected twenty spectrophotometric Mastcam datasets (including Navigation Camera stereo images for topography) (Fig. 5), along with five data sets using the MAHLI camera on the arm as a goniometer to acquire phase angle coverage [16]. Analyses have revealed a combination of typical effects associated with dust coatings but also changes in absorption band strengths with phase angle and phase reddening effects [e.g., 17-19]. Recently, photometric data were collected by the Perseverance Mastcam-Z camera east of the landing site (Fig. 6), imaging sand ripples, rover tracks, and rocks with variable degrees of dust and coatings, whose spectra varied with phase angle.
Fig 5. MSL Mastcam false-color images (Sol 172) acquired at times shown; note enhanced visibility of light-toned veins at low phase angle [cf.18-19].
Fig 6. Perseverance Mastcam-Z false-color mosaics looking east near M2020 landing site (times 10:30(left), 17:10(right)).
A common theme among these in situ studies is the dominantly backscattering nature of the martian surface, modulated by the presence of dust coatings. This photometric variability encourages ongoing refinement of radiative transfer methods to help categorize and map distinct photometric units on Mars, particularly in support of ongoing and upcoming orbital and landed missions.
[1]Hapke,B.,JGR,86,3039-3054,1981
[2]Guinness,E.A.,JGR,86,7983-7992,1981
[3]Guinness,E.A.,etal.,JGR,92,E575-E587,1987
[4]Guinness,E.A.,etal.,JGR,102,28687-28703,1997
[5]Johnson,J.R.,etal.,JGR,104,8809-8830,1999
[6]McGuire,A.F.,and B.Hapke,Icarus,113,134-155,1995
[7]McSween,H.Y.Jr.,etal.,JGR.,111,E02S10,doi:10.1029/2005JE002477,2006
[8]Domingue,D.,and B.Hapke,Icarus,99,70-81,1992
[9]Hapke,B.,Theory of Reflectance/Emittance Spectroscopy,Cambridge-University-Press,455p.,1993
[10]Johnson,J.R.,etal.,JGR,111,E02S14,doi:10.1029/2005JE002494,2006
[11]Johnson,J.R.,etal.,JGR.,111,E12S16,doi:10.1029/2006JE002762,2006
[12]Johnson,J.R.,etal.,Ch. 19,in The Martian Surface: Composition,Mineralogy,and Physical Properties,Cambridge University Press,428-450,2008
[13]Johnson,J.R,etal.,Icarus,248,25-71,doi:10.1016/j.icarus.2014.10.026,2015
[14]Rice,M.S.,etal., Icarus 205,375-395,2010
[15]Johnson,J.R.,etal.,Icarus,357,114261,doi.org/10.1016/j.icarus.2020.114261,2021
[16]Liang,W.,etal.,Icarus,335,13361,,doi.org/10.1016/j.icarus.2019.06.022,2020
[17]Johnson,J.R.,etal.,LPSC,#1371,2014
[18]Johnson,J.R.etal.,LPSC,#1354,2018
[19]Johnson,J.R.,etal.,LPSC,#1313,2019
How to cite: Johnson, J., Bell III, J., Lemmon, M., Grundy, W., Hayes, A., Liang, W., Deen, R., Herkenhoff, K., Kinch, K., and Arvidson, R.: In Situ Spectrophotometric Observations of Mars from Viking to Perseverance, Europlanet Science Congress 2021, online, 13–24 Sep 2021, EPSC2021-61, https://doi.org/10.5194/epsc2021-61, 2021.
Please decide on your access
Please use the buttons below to download the presentation materials or to visit the external website where the presentation is linked. Regarding the external link, please note that Copernicus Meetings cannot accept any liability for the content and the website you will visit.
Forward to presentation link
You are going to open an external link to the presentation as indicated by the authors. Copernicus Meetings cannot accept any liability for the content and the website you will visit.
We are sorry, but presentations are only available for users who registered for the conference. Thank you.
Please decide on your access
Please use the buttons below to download the presentation materials or to visit the external website where the presentation is linked. Regarding the external link, please note that Copernicus Meetings cannot accept any liability for the content and the website you will visit.
Forward to session asset
You are going to open an external link to the asset as indicated by the session. Copernicus Meetings cannot accept any liability for the content and the website you will visit.
We are sorry, but presentations are only available for users who registered for the conference. Thank you.

