Global monitoring of atmospheric dust with OMEGA/MarsExpress over 2004-2010.
- 1Institut d'Astrophysique Spatiale, Université Paris-Saclay, CNRS, Orsay, France (yann.leseigneur@ias.u-psud.fr)
- 2LATMOS, UVSQ, Université Paris-Saclay, CNRS, Sorbonne Université, Guyancourt, France
Introduction: Dust has different impacts on the physics operating on Mars. On the surface, dust, which is a high albedo material, can settles in inhomogeneous and unstable layers. If an area gets covered by dust, local albedo increases which changes the surface heat balance. Possible thermic contrasts between areas with two different albedos may then initiate wind and turbulence, which can send dust back into the atmosphere where it also impacts heat balance and circulations. Dust movements on Mars involve different spatial scales, from planet-scale atmospheric circulation during global dust storm to small-scale phenomena such as RSL, where changing albedo contrast may be both a consequence (dust removal) and a cause (wind initiation) of dust activity. In this work, we derive seasonal maps of atmospheric dust content over 3 Martian years using the OMEGA dataset. We then study the possible correlations between atmospheric dust activity and surface movements of dust at recurring slope lineae (RSL).
Data and Method: For this study, we use OMEGA [1] which is an imaging spectrometer onboard MarsExpress orbiter. More precisely, we focus on the near-infrared channel of the instrument. This dataset is well-suited for the study of dust dynamics as it combines a near-global spatial coverage of Mars, with a typical sampling of 1 km, to an observation period covering 3 Martian Years (2004-2010), including a global dust storm and surrounding years.
To study atmospheric dust dynamics at regional and global scale, we have developed a new method based on the 2 µm carbon dioxide (CO2) absorption band reduction. CO2 is the most abundant element on the Martian atmosphere (approx. 96%), so this band is fairly deep. Thus, when aerosols (e.g. dust) are in the atmosphere, the light travel is reduced, and the absorption band is less deep [2]. To notice a reduction of this band, we had to develop a physical model (described in [2]), to predict the 2 µm absorption band depth, that has been calibrated with OMEGA observations selected to have low dust load of the atmosphere.
As a result, we automatically compute the CO2 optical depth (from the 2 µm absorption band) predicted value (τprediction) and the observed value (τ). This allows us to work on the entire OMEGA dataset (about 8,300 observations) and make a global monitoring of the dust impact on the CO2 optical depth. For that, we defined an atmospheric dust index (Δτ/τ), which is the ratio of difference between τprediction and τ by τ.

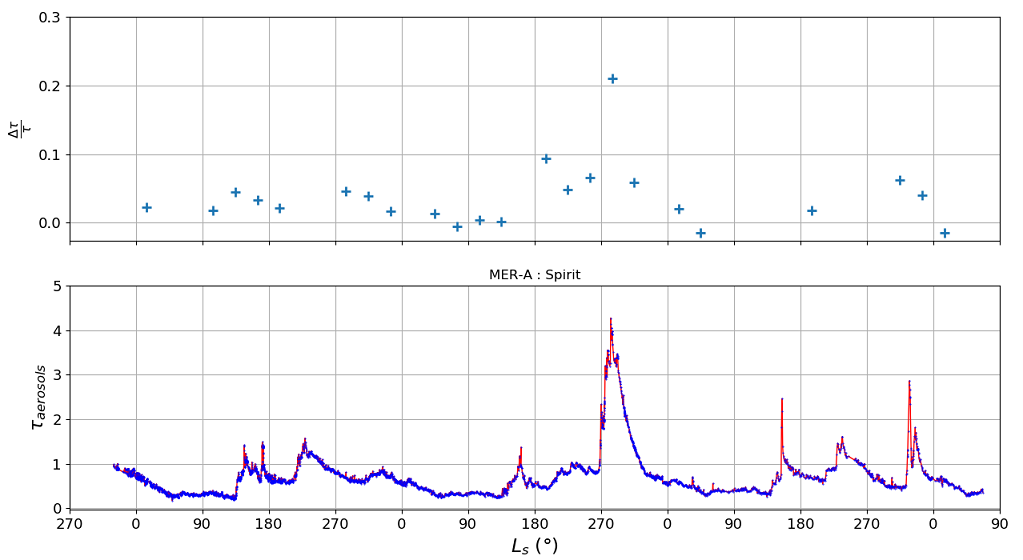
Figure 1: The time evolution of the difference between observed and predicted CO2 optical depth by the observed value (top graph), and the aerosol optical depth recorded by the MER-A (Spirit) rover. The first Ls=0° mark the beginning of the MY27.
Results and Discussion: We have first compared our dust index to ground truth concomitant measurements by the Mars Exploration Rover (MER). The aerosols optical depth temporal profile of the MER-A rover (Spirit) [3] is represented on the bottom of figure 1 and the Δτ/τ profile (of the MER area) on the top. We can notice a good temporal correlation with our dust index, notably during the global dust storm (Ls∼240° in MY28) or the clear atmosphere season (Ls=0-140°). This method allows the recovery of the seasonal variations in atmospheric dust.
Figure 2: A global map of our atmospheric dust index (Δτ/τ) constructed from observations with an Ls range between 300° and 360° of all the OMEGA Martian years of observation except MY28 (global dust storm).
We have then constructed global seasonal maps of atmospheric dust index, one of which is in figure 2 and covers a solar longitude range between 300° and 360°. This Ls range frames “C storms” as defined by [4], which could be correlated to some RSL activity at Hale crater [2]. We identify higher values of Δτ/τ located in the southern hemisphere, and also in and around Hellas. Another area of high atmospheric dust index is observed from 300°E to 350°E and 0°N to 60°N (Chryse and Acidalia Planitia), which corresponds to the main RSL area of the northern hemisphere (“CAP” area, see [5]). At this location RSL lengthening rates are maximum over that Ls range according to [5]. This suggests a spatial and time correlation between the amount of atmospheric dust and northern RSL.
Conclusion: We have developed a new method to characterize the atmospheric dust, based on the 2 µm CO2 absorption band. The application of this method to the entire OMEGA dataset allows to reproduced the well-known dust seasonal variability by comparing to the MER data (ground measurements). A seasonal map of our atmospheric dust index allows to find regions of dust storms, and reveal spatial and temporal correlation with some RSL sites.
Acknowledgments: The OMEGA/MEx data are freely available on the ESA PSA at https://archives.esac.esa.int/psa/#!Table%20View/OMEGA=instrument.
References: [1] Bibring J-P. et al. (2004) ESA Publication Division, 1240, 37-49. [2] Leseigneur Y. et al. (2021) 52nd LPSC, No. 2548, id. 1471. [3] Lemmon M. T. et al. (2015) Icarus, 251, 96-111. [4] Kass D. M. et al. (2016) Geophys Res. Lett., 43, 6111-6118. [5] Stillman D. E. et al. (2016) Icarus, 265, 125-138.
How to cite: Leseigneur, Y., Vincendon, M., and Stcherbinine, A.: Global monitoring of atmospheric dust with OMEGA/MarsExpress over 2004-2010., Europlanet Science Congress 2021, online, 13–24 Sep 2021, EPSC2021-568, https://doi.org/10.5194/epsc2021-568, 2021.

