Jupiter’s Polar Vortices in the Mid-Infrared as Observed by Subaru/COMICS Prior to and During the Juno Mission
- 1Jet Propulsion Laboratory, California Institute of Technology, Pasadena, CA, United States of America (glenn.orton@jpl.nasa.gov)
- 2University of Alabama, Huntsville, AL, USA
- 3Subaru Telescope, National Astronomical Observatory of Japan, Hilo, HI, USA
- 4Tohoku University, Japan
- 5California Institute of Technology, Pasadena, USA
- 6University of Leicester, Leicester, UK
Motivation
Recent close-up views of Jupiter’s polar regions by NASA’s Juno spacecraft are providing a wealth of information about the dynamics and composition of Jupiter’s poles. We present thermal imaging observations from a series of repeated observations over fifteen years. These images complement the observations made by the Juno spacecraft by observing in a spectral region not covered by its instrumentation, providing a near-global context for the narrow fields-of-view of Juno’s Microwave Radiometer and JunoCam instruments and providing a long term baseline to study Jovian atmospheric evolution. In this work, we specifically focus on the distinct thermal signatures of Jupiter’s northern and southern polar regions in both the troposphere and stratosphere. Although Cassini CIRS maps of Jupiter in 2000 could see this transition to coll polar vortices (e.g. Simon-Miler et al. 2006, Fletcher et al. 2016), the spatial resolution of the 8-m facility provides access to higher latitudes.
Data
We present thermal imaging from the Subaru Telescope using the COoled Mid-Infrared Camera and Spectrometer (COMICS, Kataza et al., 2000), between 7.8 and 25 μm. These data map temperatures in the upper troposphere (100 – 500 mbar) and stratosphere (20 – 0.5 mbar), and they constrain the distribution of tropospheric gases and condensate aerosols. This data set covers 2005 to 2020, allowing for the investigation of long-term trends, as well as comparisons with Juno and Juno-supporting observations at other wavelengths from 2016 onward.
Preliminary Results
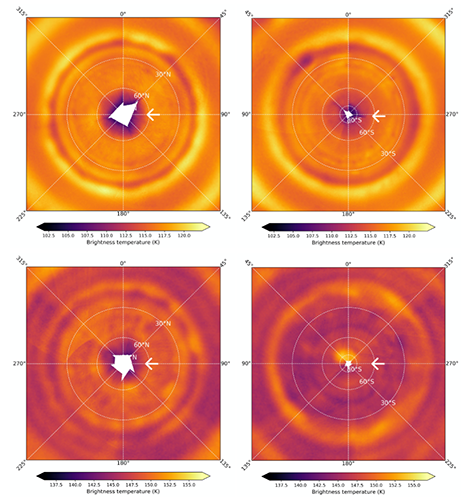
Figure 1 illustrates the composite polar maps of brightness temperature for each hemisphere using images measured in January, 2017. The retrieved temperatures in each latitude circle were derived from these data were binned over μ (= cosine of emission angle) and the centre-to-limb variation was inverted using the NEMESIS radiative transfer code (Irwin et al., 2008). The results demonstrated that tropospheric temperatures exhibit a steep decline of at least 2 K poleward of 60°N-63°N (planetocentric), which we believe marks the boundary of a tropospheric polar vortex. A similar drop in temperature takes place more gradually over 54°S-64°S. The precise latitude of the inferred vortex boundary varies slightly between observations in both hemispheres. No seasonal trends in these latitude variations were observed. Stratospheric polar temperatures are affected by auroral-related heating at 140° – 230°W (System III) at high-northern latitudes (>55°N) and 330° – 90°W at high-southern latitudes (<70°S). Away from regions affected by auroral heating, the boundaries of the vortex in the stratosphere appear to be similar to those in the troposphere, as stated above. However, unlike the uniformly colder temperatures of the polar vortices in the troposphere, temperatures in the polar vortices in the stratosphere appear be the same or even warmer than lower latitudes, with the south polar region appearing warmer and the north polar region cooler in 2016-2020. To first order, the zonally variable latitude boundaries of the polar vortices appear to be coincident with the boundaries of distinct regions of overlying hazes known as the polar caps, which are detected in reflected sunlight. This suggests the dynamical boundaries are controlled by a Rossby wave and important contributions by these aerosols to the radiative balance within these polar regions (see Zhang et al 2015, Guerlet et al. 2020).

Figure 1. Polar projection of brightness temperatures in Jupiter from observations made by the Subaru/ COMICS instrument in January of 2017. The top panels for the north (left) and the south (right) display a composite brightness temperature map for observations made with a filter centered at 7.80 µm that is sensitive to stratospheric temperatures near 10 mbar of atmospheric pressure. The bottom panels for the north (left) and south (right) are made similar with a filter centered at 17.65 µm that is sensitive to temperatures near 190 mbar of atmospheric pressure.
The location of polar-vortex temperature change is indicated by the arrows. The cooler temperatures associated with the north polar vortex at 190 mbar (upper left) is the most prominent. There is essentially no meridional stratospheric temperature change detectable at high-southern latitudes (lower right); the compact brightening close to 0° W longitude is the result of auroral-related heating of the stratosphere (see, for example, Sinclair et al., 2021, and references therein).
References
Fletcher, L. N. et al. 2016. Icarus. 278, 128-161.
Guerlet, S., et al. 2020. Icarus, 351:113935. doi: https://doi.org/10.1016/j.icarus.2020.113935. 129
Irwin, P. G. J. et al. 2008. J. Quant. Spectr. Rad. Transfer 109, 1136-1150.
Kataza, H. et al. 2000. Proc. SPIE 4008, 114-1152
Simon-Miller, et al. 2006. Icarus 180, 98-112.
Sinclair, J. A. et al. 2019. Nature Astronomy 3, 607-613.
Zhang, X., R. A. 2016. Nature Communications 6:10231. Doi 10.1038/ncomms10231.
How to cite: Orton, G., Sinclair, J., Burke, A., Fujiyoshi, T., Kasaba, Y., Momary, T., Chan, R., and Fletcher, L.: Jupiter’s Polar Vortices in the Mid-Infrared as Observed by Subaru/COMICS Prior to and During the Juno Mission, European Planetary Science Congress 2021, online, 13–24 Sep 2021, EPSC2021-59, https://doi.org/10.5194/epsc2021-59, 2021.

