
Spectral curvature of hollows on Mercury as an indicator of their composition?
 1,2
1,2- 1LESIA, Observatoire de Paris, Université PSL, CNRS, Sorbonne Université, Université de Paris, 5 place Jules Janssen, 92195 Meudon, France (oceane.barraud@obspm.fr)
- 2Aurora Technology B.V., European Space Astronomy Centre/ESA, Madrid, Spain
Introduction
Mercury reflectance spectra obtained with the Mercury Atmospheric and Surface spectrometer (MASCS) on board MESSENGER spacecraft lack absorption features to constrain the mineralogical composition of surface materials. In particular, reflectance spectra exhibit no clear evidence for an absorption band centered near 1 µm that would be associated with the presence of ferrous iron in silicates [1]. Multispectral measurements from the Mercury Dual Imaging System (MDIS/MESSENGER) show evidence of weak absorption features in several geological units. Multispectral observations of Low Reflectance Materials (LRM) exhibit a weak, broad absorption band near 600 nm, which is consistent with carbon [2]. Hollows landforms, unique to Mercury, revealed a weak absorption feature around 630 nm attributed to sulfides like CaS and/or MgS [3], or a mixture of sulfides and pyroxenes [4]. MASCS reflectance spectra of hollows lack absorption features, however, they show a strong concave curvature between 300 and 600 nm, unique to hollow materials [5]. Here, we present a comparison between the reflectance spectra of Mercury's hollows and measurements carried out in laboratory under the thermal conditions of Mercury's surface [6] in preparation for the BepiColombo observations. This comparison is done with the aim to better constrain the composition of Mercury’s hollows from reflectance spectra.
Material and method
The MASCS instrument consists of a visible detector (VIS) between 300 and 1050 nm and a second detector in the near-infrared range (NIR) between 850 and 1450 nm. We used the MASCS Derived Data Record (DDR) data products available on the Planetary Data System (PDS). These data have been radiometrically and photometrically calibrated by the MESSENGER team. Additional processing, using the method developed by [7], is applied to the data to obtain a continuous spectrum from 300 to 1450 nm with a spectral resolution of 5 nm. Due to the configuration of the spacecraft, MASCS observations are carried out with large phase angles; no observations below 78° are available. The reflectance spectra of hollows used in this study are similar to those used by [5]. The 113 spectra are from hollows within Hopper, Tyagaraja, Warhol and Eminescu impact craters.
The laboratory measurements used are carried out on synthetic powder samples of sulfides (CaS, MgS-old, MgS-syn, CrS, FeS, MnS, NaS, TiS) of at least 99 % purity and grain size about 10 µm. Here, we used spectra achieved on fresh and heated (500°C) sulfides between 300 and 1000 nm with a spectral resolution around 4 cm-1 and phase angle of 80°.
The curvature of MASCS and laboratory spectra are computed in the same way. This parameter is represented by the coefficient of the squared power of the polynomial fit (degree 2) of the spectrum between 300 and 600 nm [5]:
Reflectance= cλ2+ bλ + a (c=curvature)
The curvature is then normalized to the reference spectrum provided by [1], who computed it from an average of 850,000 spectra of Mercury's surface. Thus, Curvature parameter equals to 1 is representative of Mercury's mean surface.
Results
The curvature parameter of MASCS reflectance spectra of hollows ranges from 3 to 17. The curvature of the samples MgS-old heated, TiS heated (gray exterior), CaS heated and CaS fresh are respectively 22, 38, 45 and 72. MgS-syn (heated and fresh) and NaS (heated and fresh) have curvature parameters superior to 100. The sample of CrS, FeS, MnS and TiS (heated green interior) heated and fresh have negative curvature parameters which indicate convexe spectral curvature.
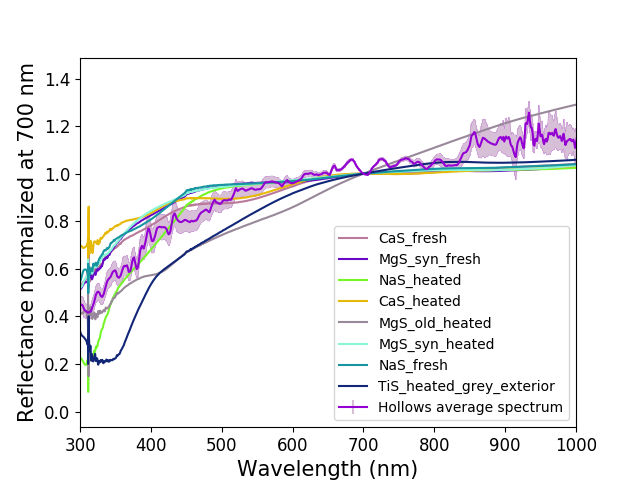
Figure 1: Hollows mean spectrum [5] and sulfides spectra [6]. The spectra are normalized by the reflectance at 700 nm for comparison. Only the sulfides with curvature superior to one are represented here.
Reflectance spectra of TiS heated sample (grey exterior) exhibits a strong absorption band centered around 330 nm which is not observed in MASCS data (Fig. 1). In addition, MESSENGER XRS (X-ray spectrometer) and GRS (Gamma ray spectrometer) observations indicate low abundance of Ti (<1 wt%) which makes TiS an unlikely candidate for hollows [8]. The most favourable candidates are CaS, MgS et NaS. Although the curvature of these quasi-pure samples is higher than that of the MASCS spectra, a portion of them in the hollows may contribute to the observed curvature. XRS data reveal a positive correlation between the concentrations of S and Ca on Mercury’s surface interpreted as evidence for an abundance of Ca-bearing sulfide minerals (e.g., oldhamite) [8].
Conclusion
Preliminary results show that the curvatures observed in hollows reflectance spectra may be related to the presence of sulfide-bearing minerals. The curvature parameter, if linked to the composition, allows us to eliminate a number of sulfides including CrS, FeS, MnS and TiS (fresh) which have negative curvatures. The most likely candidates seem to be CaS, MgS and NaS, the first two having already been proposed for the weak absorption band observed in the multispectral data. To better characterize the volatiles, we conduct further work on linear spectral or physical mixture models to quantify the sulfide concentrations in hollows by comparing with observation.
References
[1] Izenberg et al. (2014). Icarus, 228. [2] Klima et al. (2018). GRL, 45(7), 2945-2953. [3] Vilas et al. (2016). GRL, 43(4), 1450-1456. [4] Lucchetti et al., (2018). J. Geophys. Res. Planets, 123. [5] Barraud et al. (2020). JGR: Planets, 125(12), e2020JE006497. [6] Varatharajan et al. (2019). Earth and Planetary Science Letters, 520, 127-140. [7] Besse et al., (2015), J. Geophys. Res. Planets, 120. [8] Nittler et al. (2011). Science, 333.
How to cite: Barraud, O., Doressoundiram, A., and Besse, S.: Spectral curvature of hollows on Mercury as an indicator of their composition? , European Planetary Science Congress 2021, online, 13–24 Sep 2021, EPSC2021-596, https://doi.org/10.5194/epsc2021-596, 2021.