- 1INAF – Osservatorio Astronomico di Roma, Via Frascati 33, 00078 Monte Porzio Catone, Italy (nicolas.bott@inaf.it)
- 2LESIA, Observatoire de Paris, Université PSL, CNRS, Université de Paris, Sorbonne Université, Meudon, France
- 3Planetary Science Institute, Tucson, AZ, USA
- 4University of Aizu, Fukushima, Japan
- 5Institute of Space and Astronautical Science (ISAS), Japan Aerospace Exploration Agency (JAXA), Sagamihara, Japan
- 6Istituto di Astrofisica e Planetologia Spaziali, Istituto Nazionale di Astrofisica (INAF), Rome, Italy
1. Introduction
The JAXA Hayabusa2 mission probed the surface of the C-type asteroid (162173) Ryugu both with two touchdown operations to collect samples and return them to Earth, and with remote sensing instruments to characterize it at global scale. Among the payload of the spacecraft, the Near InfraRed Spectrometer (NIRS3) [1] is a point-spectrometer which acquired spectra in the 1.8-3.2 µm range of the asteroid surface to analyse its composition and detect possible heterogeneities. The surface of Ryugu has been shown to be uniformly dark (reflectance factor of 0.017 at 2.0 µm), slightly red-sloped and hydrated due to the presence of a weak, narrow absorption band at 2.72 µm attributed to Mg-phyllosilicates [2]. However, recent studies [3,4] using independent methods of analyses identified minor heterogeneities in the composition on Ryugu.
2. Data and methods
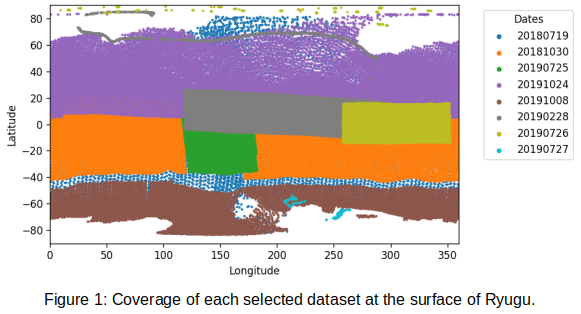
Here we continue and expand such studies by selecting NIRS3 datasets that complement the investigated regions of the surface of Ryugu and/or improve the used spatial resolution. The dates corresponding to the datasets retained are the following (sorted by chronological order): July 19th 2018, October 30th 2018, February 28th 2019, July 25th 2019, July 26th 2019, July 27th 2019, October 8th 2019 and October 24th 2019. The coverage of each dataset on Ryugu is displayed in Figure 1. The data used for the analyses have been thermally corrected [2] and photometrically corrected [5].

The selected datasets are analysed using the G-mode multivariate statistical approach, using the same technique as in [3]. From a sample of N objects, each expressed by M variables, the code classifies each object in an homogeneous group with no other intervention from the user than the choice of the confidence level (labeled q and expressed in term of σ). The errors on each variable are taken into account in the classification. Further details on the method are available in [3,6].
3. Preliminary results
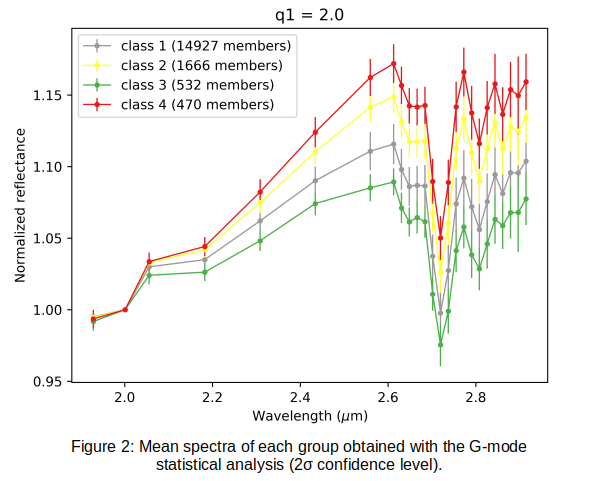
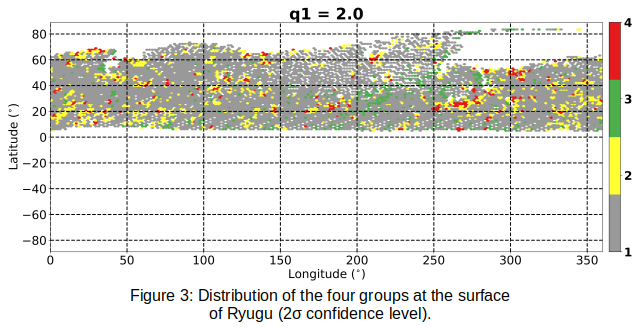
Preliminary results are shown from the analysis of the October 24th 2019 dataset only, which has the highest spatial resolution among the datasets we selected (7.66-9.67 m/footprint) and which covers the majority (~10°-~80°N) of the Northern hemisphere of Ryugu. Applying the G-mode with a confidence level of 2σ, and only on twenty-four selected wavelengths representative of the asteroid spectral properties, as in [3], we obtain four spectral groups. The mean spectra of each cluster are shown in Figure 2. The distribution of the four groups at the surface of Ryugu is presented in Figure 3.


Group #1 contains almost 85% of the spectra, thus corresponding to the average spectral properties of Ryugu. Groups #2 to #4 can be attributed to the compositional heterogeneities. The mean spectra (Figure 2) are mainly separated according to their spectral slope between 2.05 and 2.61 µm. Groups #2 and #4 are the reddest (highest spectral slope), while group #3 is bluer (lower slope) than group #1. We also noted a slight variation for the 2.72 µm absorption band by computing its depth, groups #2 and #4 having the strongest band and group #3 the weakest.
The distribution of the four groups on Ryugu (Figure 3) highlights interesting trends. Groups #2 and #4 seem to be concentrated around large craters (e.g. Cendrillon) and large depressions, such as the one located between 230° and 300° in longitude. On the contrary, group #3 appears inside this depression and in the region gathering large boulders between 200° and 230° in longitude.
4. Conclusion and perspectives
We continue and expand previous clustering analyses of NIRS3 data by applying the G-mode algorithm to new datasets, which improve the spatial resolution and/or surface coverage of Ryugu. The preliminary results obtained for the Northern hemisphere of Ryugu are in overall good agreement with the previous findings for the equatorial region [3], confirming the presence of small heterogeneities on the surface. Moreover, they suggest that the material surrounding craters and depressions could present a redder spectral behaviour and a deeper band at 2.7 µm.
The G-mode will be applied to all of the selected datasets (Figure 1). Selected regions of interest will also be investigated, notably the second Hayabusa2 touch-down region on which was dropped the Small Carry-on Impactor (SCI) to collect fresh material under the weathered surface [7], by analysing and comparing spectra of the area before and after the impact.
Acknowledgements
We thank the Haybusa2 JAXA team for their efforts in making the mission successful. Hayabusa2 was developed and built under the leadership of JAXA, with contributions from the DLR and the CNES, and in collaboration with NASA, Nagoya University, University of Tokyo, National Astronomical Observatory of Japan, Aizu University, Kobe University, and other universities, institutes, and companies in Japan. We would also wish to thank all the engineers who contributed to the success of the Hayabusa2 mission, especially T. Masuda, S. Yasuda, K. Matsushima, and T. Ohshima. We acknowledge financial support from ASI contract No. 2018-27-HH.0 “Partecipazione alla fase E della Missione Hayabusa2”. We also acknowledge funding from the European Union’s Horizon 2020 research and innovation programme under grant agreement No. 870403. ED and JDPD thanks the financial support of the Agenzia Spaziale Italiana (ASI, contract No. 2017-37-H.0 CUP F82F17000630005). MA Barucci and M Fulchignoni acknowledge financial support by CNES.
References
[1] Iwata, T, et al.: NIRS3: The Near Infrared Spectrometer on Hayabusa2, Space Sci. Rev., 208, 317-337, 2017.
[2] Kitazato, K, et al.: The surface composition of asteroid 162173 Ryugu from Hayabusa2 near-infrared spectroscopy, Science, 364, 272-275, 2019.
[3] Barucci, M. A., et al.: Multivariable statistical analysis of spectrophotometry and spectra of (162173) Ryugu as observed by JAXA Hayabusa2 mission, A&A, 629, 2019.
[4] Matsuoka, M, et al.: Clustering analysis of NIRS3 infrared spectral data of Ryugu, 51st LPSC, LPI Contribution No. 2326, 2020.
[5] Matsuoka, M, et al. (in preparation)
[6] Gavrishin, A. I., et al.: Multivariate classification methods in planetary sciences, Earth, Moon and Planets, 59, 141-152, 1992.
[7] Arakawa, M, et al.: An artificial impact on the asteroid (162173) Ryugu formed a crater in the gravity-dominated regime, Science, 368, 67-71, 2020.
How to cite: Bott, N., Perna, D., Deshapriya, J. D. P., Hasselmann, P. H., Barucci, M. A., Domingue, D. L., Dotto, E., Kitazato, K., Matsuoka, M., Palomba, E., Usui, T., and Fulchignoni, M.: Multivariate statistical analysis of high spatial resolution spectra of asteroid (162173) Ryugu obtained by the Hayabusa2 spacecraft, Europlanet Science Congress 2021, online, 13–24 Sep 2021, EPSC2021-656, https://doi.org/10.5194/epsc2021-656, 2021.

