
Automated NPLD scarp mapping for the block falls monitoring pipeline
 ,,
,,- Deutsches Zentrum für Luft- und Raumfahrt (DLR), Planetengeodesie, Germany (oleksii.martynchuk@dlr.de)
1. Introduction
The north polar region of Mars is one of the most active places of the planet with avalanches[1] and ice block falls[2] being observed every year on High Resolution Imaging Science Experiment (HiRISE) data. Both phenomena originate at the steep icy scarps surrounding the north polar plateau, Planum Boreum. The exposed layers of ice and dust contain important information about the climate cycles of the planet[3]. We are interested in monitoring how the current scarp erosion rate (quantified through analysing block falls) is linked to these periodic changes in temperature. The large scale of the region of interest, combined with a growing amount of available satellite data makes automation key for this project. Our goal is to monitor robustly the whole north polar region for ice block falls throughout the entire Mars Reconnaissance Orbiter (MRO) mission. The active scarps of the north polar region contain two main geological units, the older and darker Planum Boreum Cavi unit, also called Basal Unit (BU) and the younger and brighter Planum Boreum 1 unit, which is a part of the so called North Polar Layered Deposits (NPLD)[4]. These geologic units are mapped by Tanaka et al. (2012), however the scale of this map is not sufficient for our work, as it is based on coarse resolution data. For our project it is important to segment the HiRISE images of the steep scarps in NPLD and BU regions with high precision, both to restrict the area where the algorithm will look for fallen blocks and to differentiate between the activity originating in the NPLD[5] from that originating in the BU. Here we present our algorithm for automated scarp mapping – the first completed step towards a fully streamlined monitoring pipeline.
2. Methods and Results
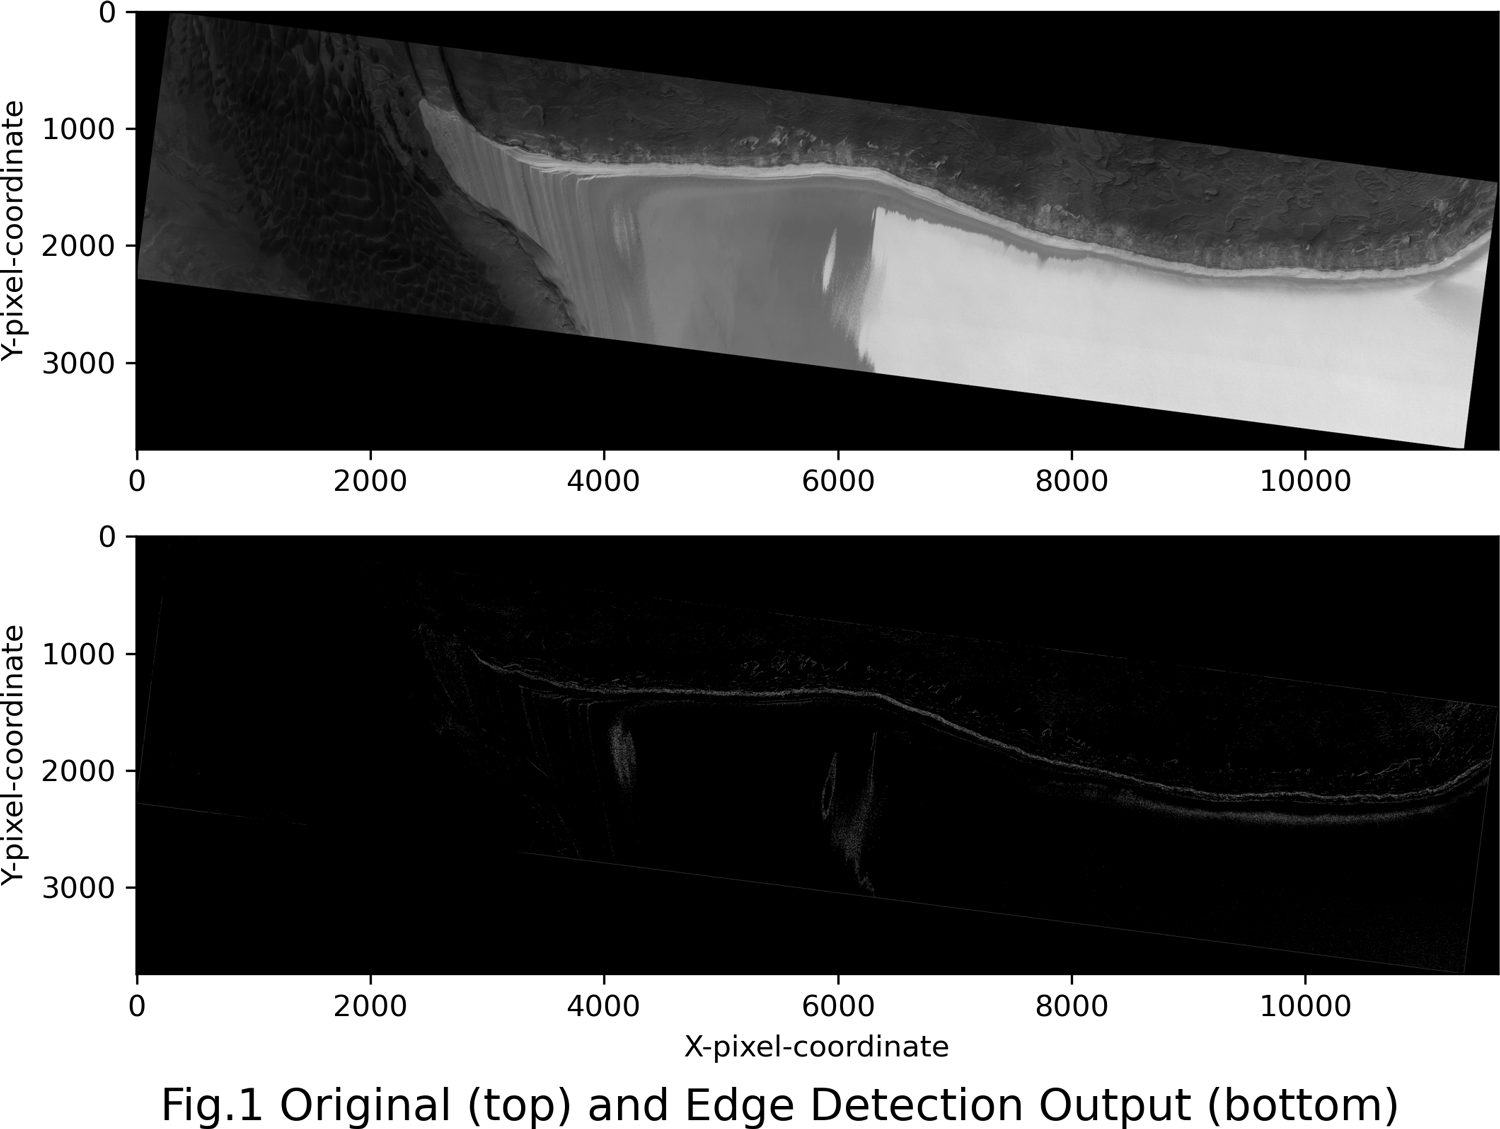
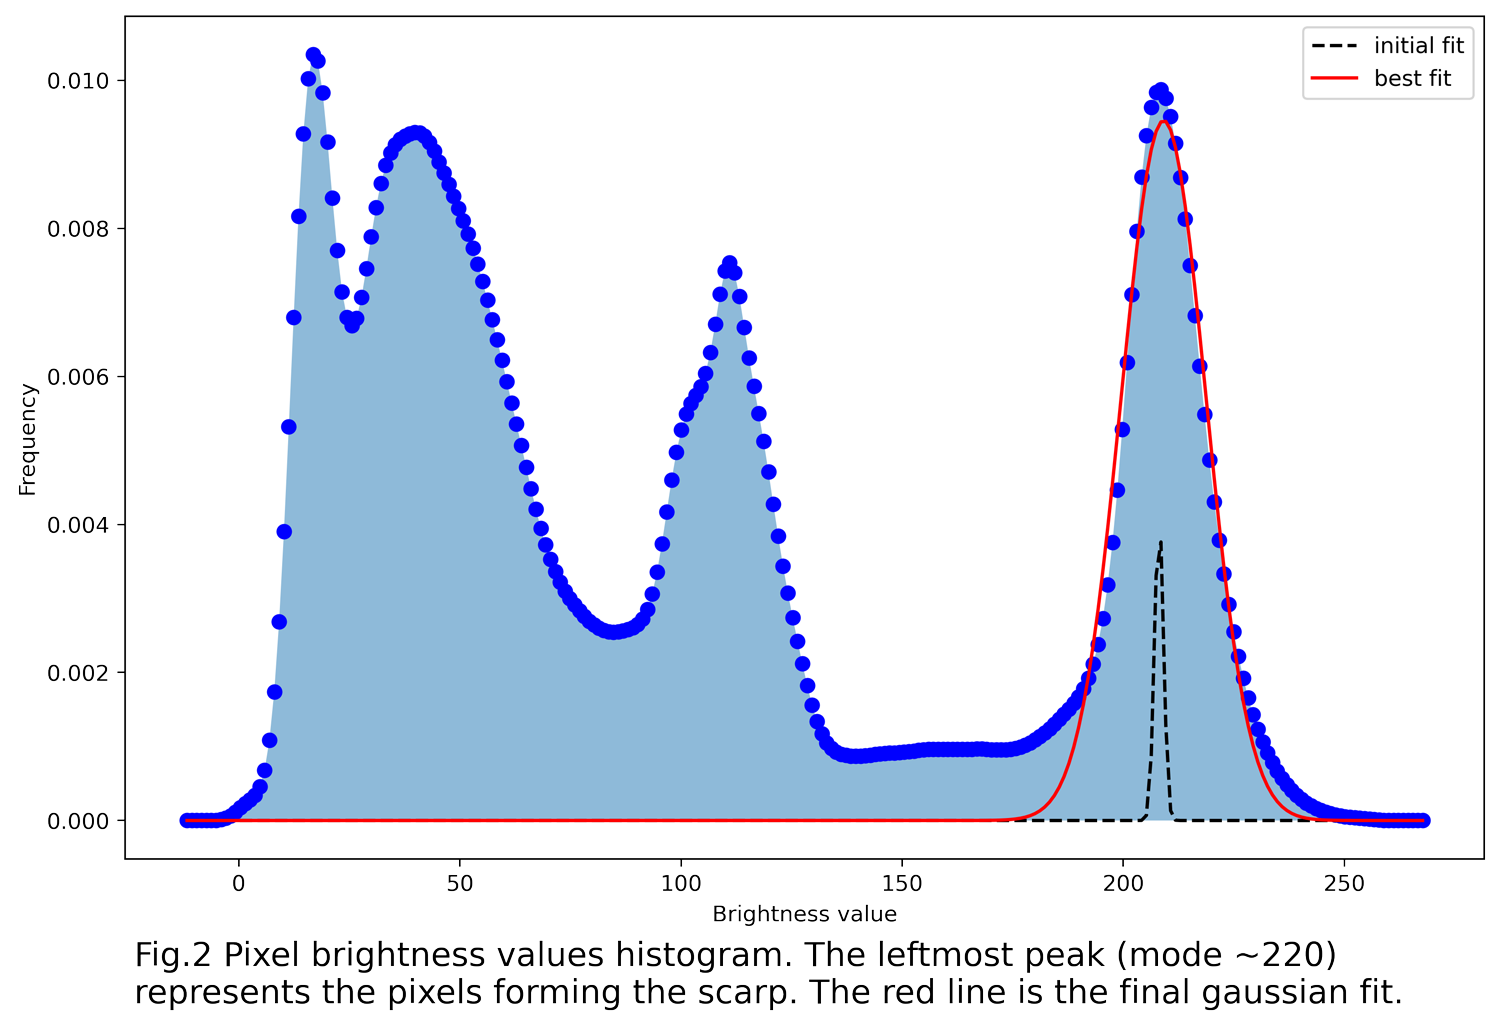
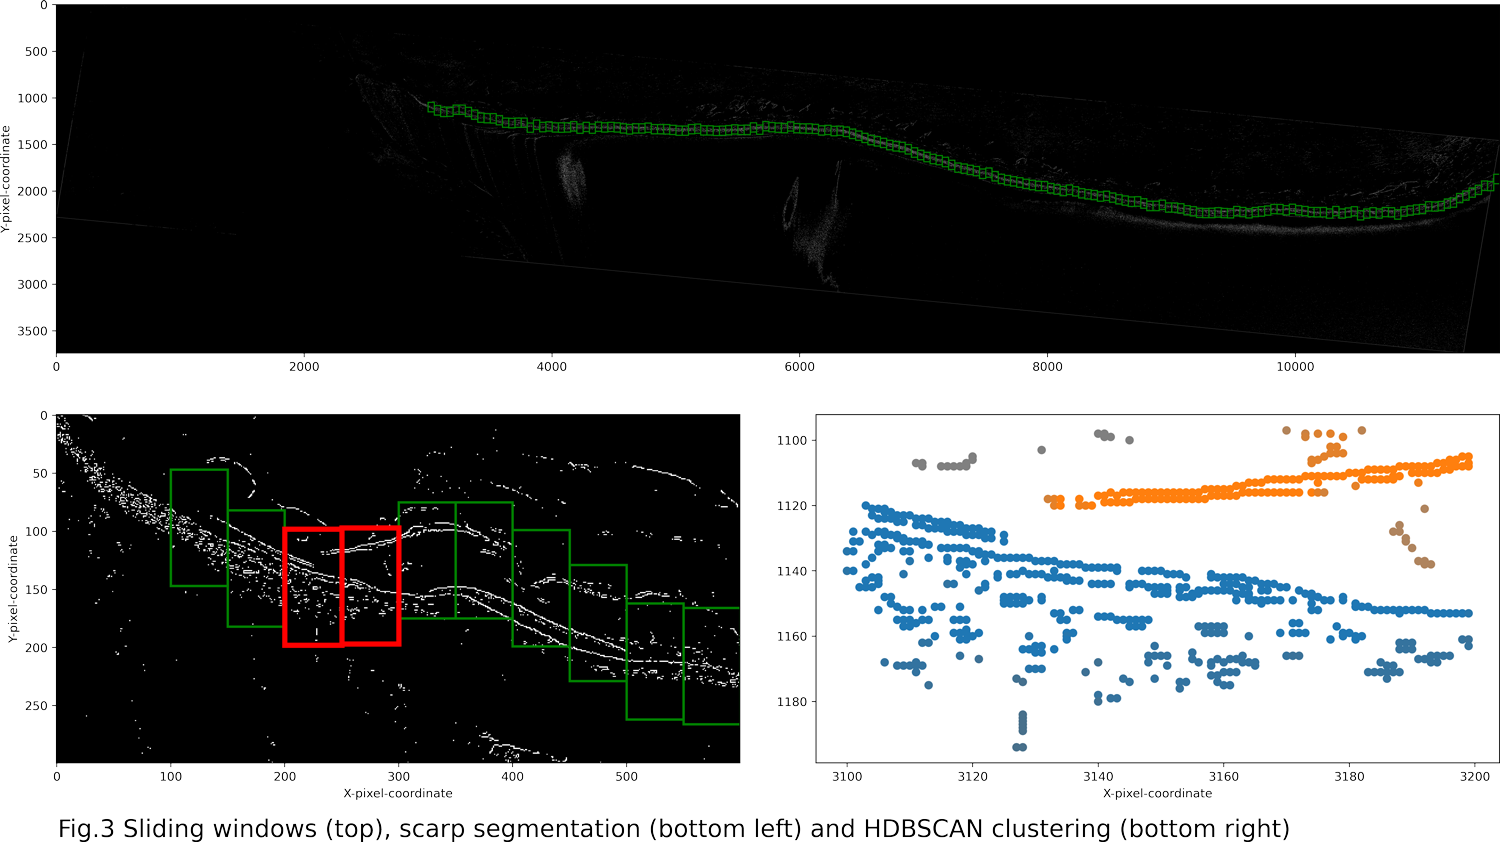
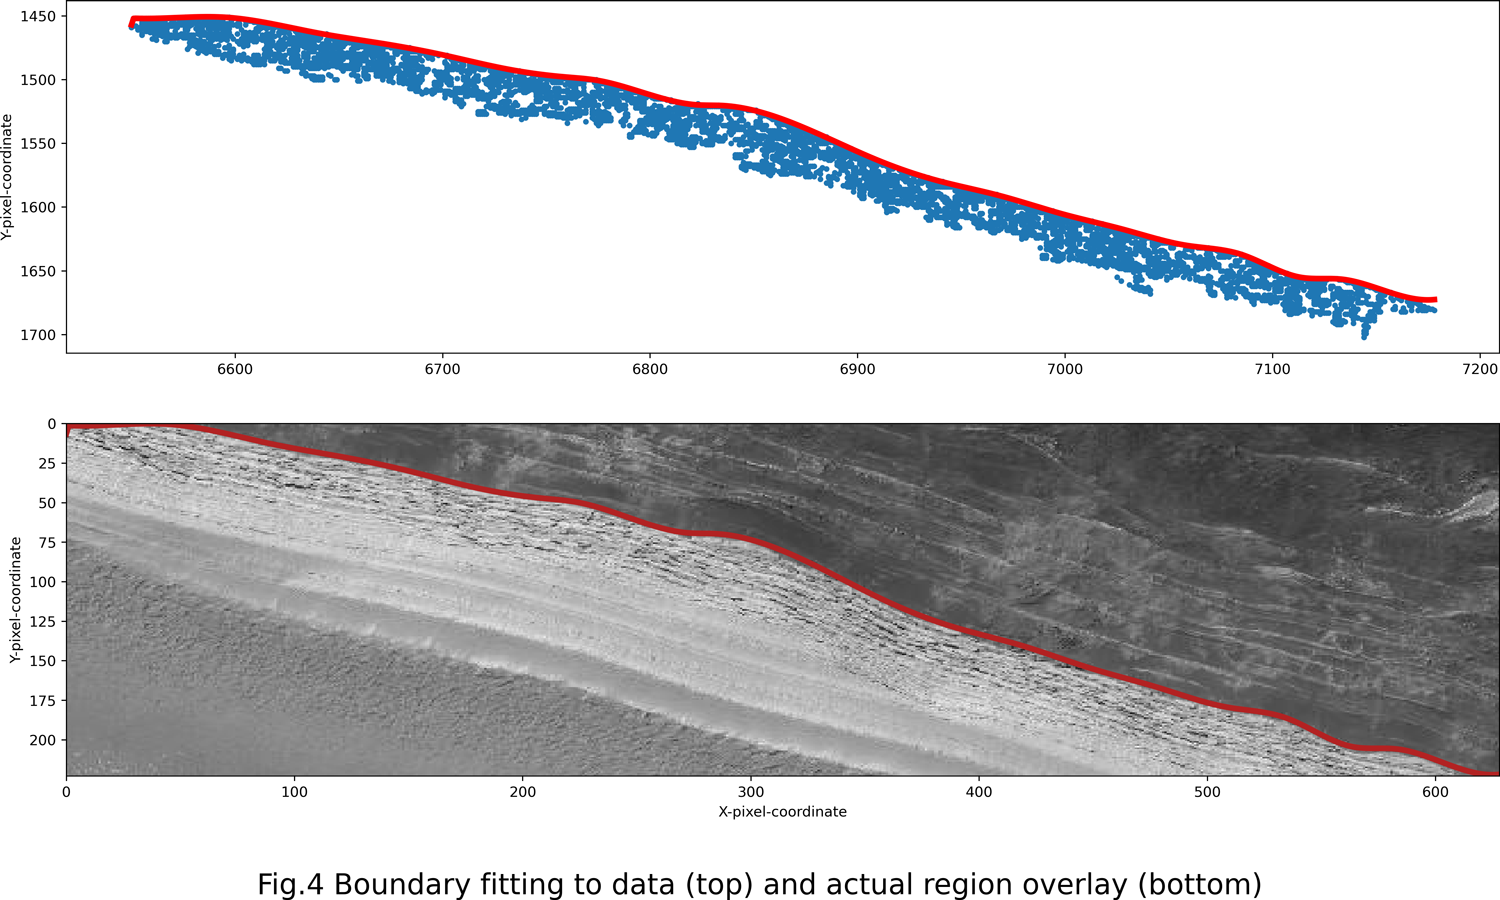
First the original high-resolution images have to be downscaled by 90% in both dimensions. Given the initial 0.3 m/pixel precision, this procedure increases the delineation error margin to about 3 meters. This tradeoff is required to achieve greater computational efficiency during the subsequent pre-processing steps. OpenCV canny edge detection (CED) algorithm can then be applied to the downscaled result, yielding a binary contour map (Fig.1). Two parameters have to be specified when running edge detection, namely: min and max thresholding values. These are used by the algorithm to decide whether an edge is to be kept or to be discarded. We propose a fully automated method for choosing the optimal constraints. Our approach relies on the fact that the exposed scarp produces a spike in the histogram of pixel brightness values. We utilize kernel density estimation (KDE) to fit a gaussian distribution to this area of the histogram and then select its 5th percentile and mode as minVal and maxVal respectively (Fig.2). The CED output contains both the scarp trace and the noise resulting from numerous other objects present in the FOV (Fig.3 bottom left). To filter out the unnecessary detail, we roll a sliding window across the image, tracking areas containing many pixels with high edge responses. The y-coordinate of every new box in a sequence is adjusted to follow the underlying bright pixels as tightly as possible. The longest of the sequences is expected to contain the scarp and therefore only its content is retrieved (Fig.3 top). Since CED struggles to connect all the separate edges at such a large scale, the boundary of the scarp is delineated by a collection of disjointed lines (Fig.3 bottom left). Before we can derive a continuous polynomial that can bridge the gaps in between these lines, an even more rigorous de-noising is required. We propose a two-stage procedure based on density clustering[6]. The whole length of the scarp is first divided into overlapping segments. HDBCSAN is then applied to each segment independently, yielding numerous clusters of varying size (Fig.3 bottom right). We proceed by linking these clusters through sets of shared points located in the overlap areas. As a result, the scarp trace is represented by the largest grouping of pixel co-ordinates and all the smaller clusters are discarded. Upon tightening the parameters of HDBSCAN to filter out the finer noise ignored by the previous crude sweep, we obtain the final scarp outline. This preprocessed contour map is then subjected to a custom data boundary fitting algorithm, which uses cubic splines to connect the adjacent edges[7] (Fig.4). Since the resolution, sliding window sizes and scarp segmentation schemes are kept constant between the images, most of the internal parameters can be set to sensible defaults, thus minimizing the user input.
3. Conclusions and future projects
Our first step towards fully monitoring the activity of the north polar region resulted in a detailed and automatically produced map of the boundary between BU and the NPLD based on the significant difference in intensity between them. Fanara et al. (2020a) already used traditional machine learning techniques to detect newly appeared ice blocks, achieving a good performance and estimating the current erosion rate of a steep scarp[8]. We are now planning to complement this study with our scarp mapping algorithm. This should allow to further extend the training dataset, hopefully generating enough input for a computer vision model based on convolutional neural networks. The NPLD remains our primary area of interest due to its high levels of activity and good image density, yet we also plan to apply our pipeline to different surface changes and Martian regions as well as other celestial objects.
References
1. Russell P., Thomas, N. Byrne, S. Herkenhoff, K. Fishbaugh, K. Bridges, N. Okubo, C. Milazzo, M. Daubar, I. Hansen. Seasonally active frost-dust avalanches on a north polar scarp of Mars captured by HiRISE, Geophys. Res. Lett. 35, L23204, 2008.
2. L. Fanara, K. Gwinner, E. Hauber, J. Oberst. Present-day erosion rate of north polar scarps on Mars due to active mass wasting, Icarus, Volume 342, 2020,113434, ISSN 0019-1035.
3. Smith I.B., Putzig N.E., Holt J.W. and Phillips R.J. An ice age recorded in the polar deposits of Mars, Science, 352, 1075–1078, 2016.
4. Tanaka, K.L., and Fortezzo, C.M., 2012, Geologic map of the north polar region of Mars: U.S. Geological Survey Scientific Investigations Map 3177, pamphlet 11 p., 1 sheet, scale 1:2,000,000.
5. Su, S., Fanara, L., Zhang, X., Gwinner, K., Hauber, E., and Oberst, J.: Sources of ice block falls at the Martian north polar scarps: detection from multi-temporal HiRISE image sets, EGU General Assembly 2021, online, 19–30 Apr 2021, EGU21-7489.
6. Leland McInnes1, John Healy1, and Steve Astels2. HDBSCAN: Hierarchical density-based clustering. (1) Tutte Institute for Mathematics and Computing, (2) Shopify.
7. N. Cardiel. Data boundary fitting using a generalized least-squares method; Mon. Not. R. Astron. Soc. 396, 2009, ISSN 680–695.
8. L. Fanara, K. Gwinner, E. Hauber, J. Oberst. Automated detection of block falls in the north polar region of Mars, Planetary and Space Science, Volume 180, 2020, 104733, ISSN 0032-0633.
How to cite: Martynchuk, O., Fanara, L., Gwinner, K., Hauber, E., and Oberst, J.: Automated NPLD scarp mapping for the block falls monitoring pipeline, European Planetary Science Congress 2021, online, 13–24 Sep 2021, EPSC2021-712, https://doi.org/10.5194/epsc2021-712, 2021.