
Confirmation of the Bailly-Newton Impact Basin

- Aberystwyth University, IMPACS, Physics, Aberystwyth, United Kingdom of Great Britain – England, Scotland, Wales (atc@aber.ac.uk)
Abstract
A highly degraded, pre-Nectarian lunar impact basin was proposed for the region between Bailly and Newton craters in 2000. However, a publication in 2010 suggested that there was no basin there. We utilize a combination of topographic and Bouguer anomaly basin fitting tools to provide evidence that the basin exists. A revised centre and diameter of the basin is given of 77°S, 41°W and 402 km respectively. The basin is in an interesting geological context as it straddles the rim of the South Pole Aitken basin.
1. Introduction
In 2000, whilst examining a Clementine nadir stereo derived digital elevation model (DEMs) of the Moon’s south pole region[1], an impact basin was found in a stereo anaglyph visualization of the topographic dataset (Fig 1), and used to find its location in the DEM and an image mosaic. The original position and dimension were quoted as 73°S, 57°W, and 330 km in diameter.
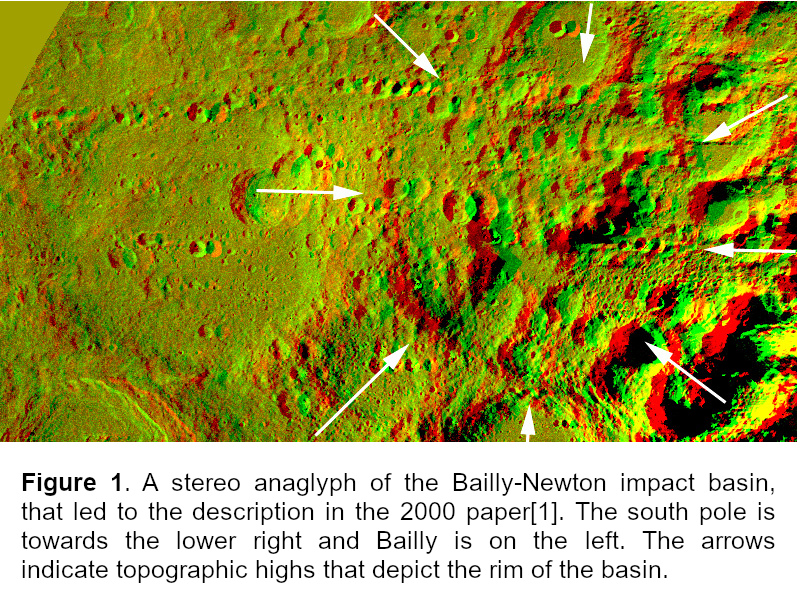
A subsequent study[2] found no evidence for a basin here. This used DEMs, hill shaded views, colour coding, perspective views, and slope maps. Using a variety of existing and new basin measuring tools, we show that there is a basin present after all.
2. Method
Three methods were used to fit a basin floor and rim to a topographic DEM (MoonTopo2600p)[3]: 1) rotational maximum height profile, 2) fitting the rotational topographic profile to three step arc tangent functions, 3) finding prominent peak maxima, ranking these and filtering the less prominent peaks out, leaving just those that should make up the basin rim. Three methods were also used to fit a basin using Bouguer anomaly data (GRGM1200B)[4] using the central mascon and surrounding low annulus: 1) finding prominent peaks maxima and ranking these and filtering out the less prominent peaks which make up the central mascon, 2) fitting the rotational Bouguer anomaly profile, similar to Baker et al.[5] but with two step arc tangent functions, 3) using an annulus method developed by Neumann et al.[6] with the annulus with inner and outer diameters set to 50% and 100% of the basin diameter, and an inner disc of 20% of the basins diameter. The difference between the annulus and the inner circle was a measure of the basin contrast.
These methods were tested out on lists of published basin tables, and found to vary in diameters found by each algorithm, for each basin, if for example the basin was on a slope or was sitting on some other large scale topographic features, this could skew the results. However, a combination of topographic fit and Bouguer peak methods seemed to produce results closest to published values[6]. However, plotting out all the basin ring diameters on the DEM and then using one’s eye to judge which diameter was most appropriate, was a practical solution.
3. Analysis of the Bailly-Newton Basin
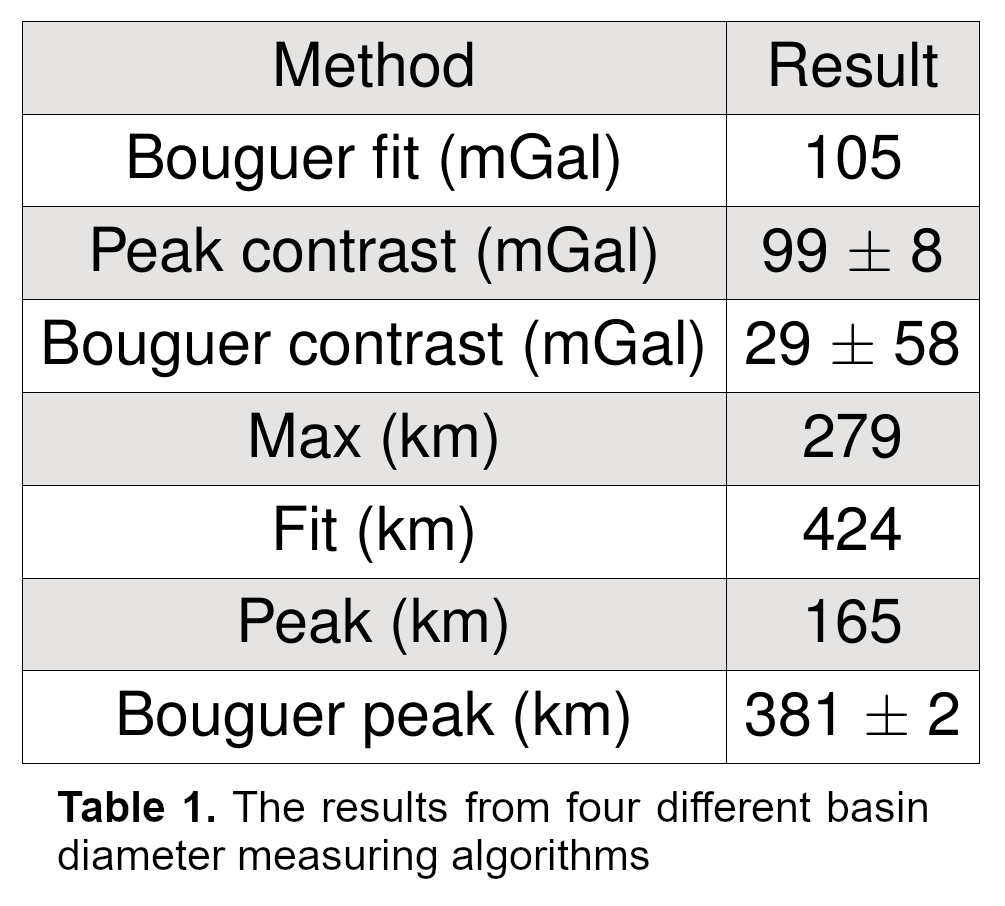
Three different topographic basin measuring algorithms were applied to the DEM (Table 1) and three wildly different diameters were found. The peak method got locked onto the central topography in the basin and yielded an unrealistically small diameter for the basin – see inner blue circle in Fig 2. The rotational maxima algorithm also produced a result, the 2nd largest circle in Fig 2, that clearly does not relate to the true nature of the basin rim. The fitting to three step arc tangent functions though produced the largest diameter circle in Fig 2 and this neatly portrays the outer eroded rim of the basin.
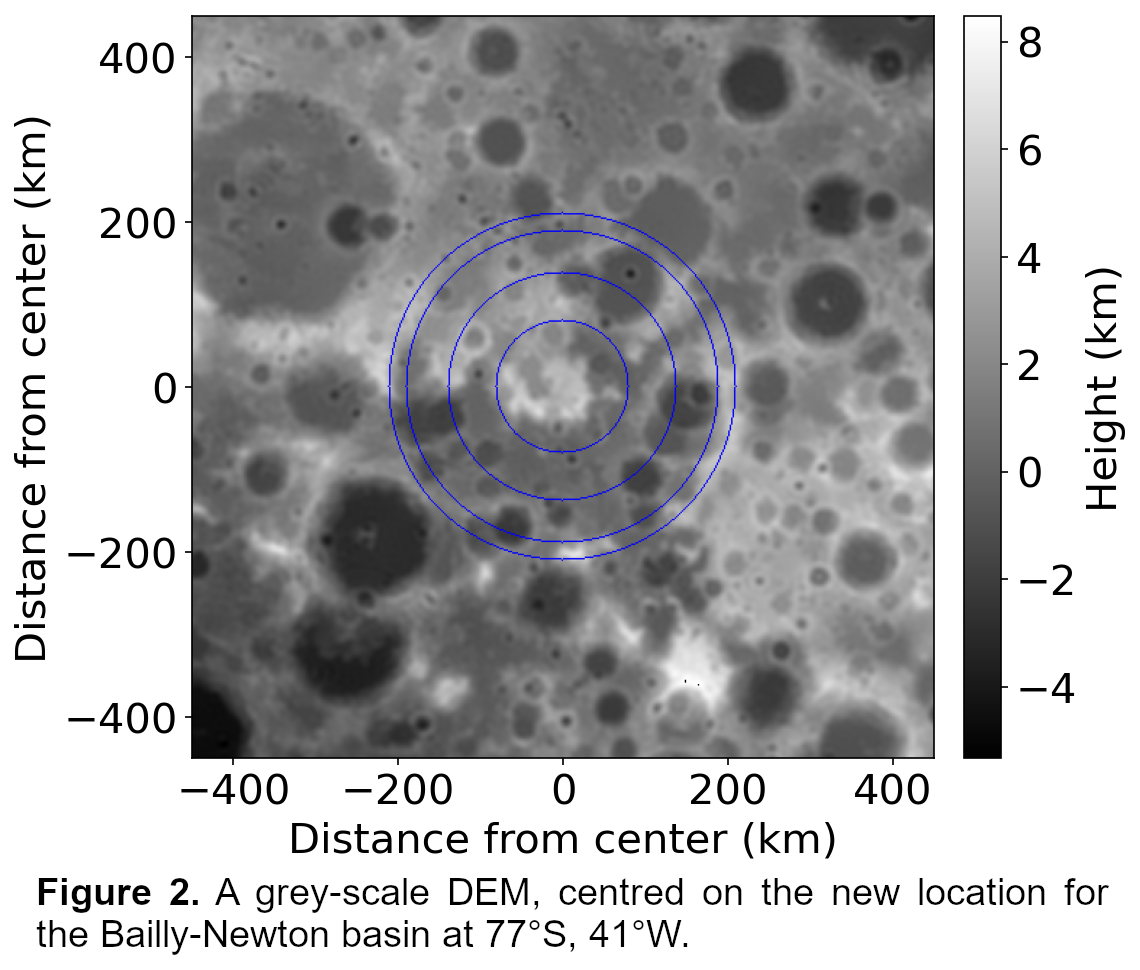
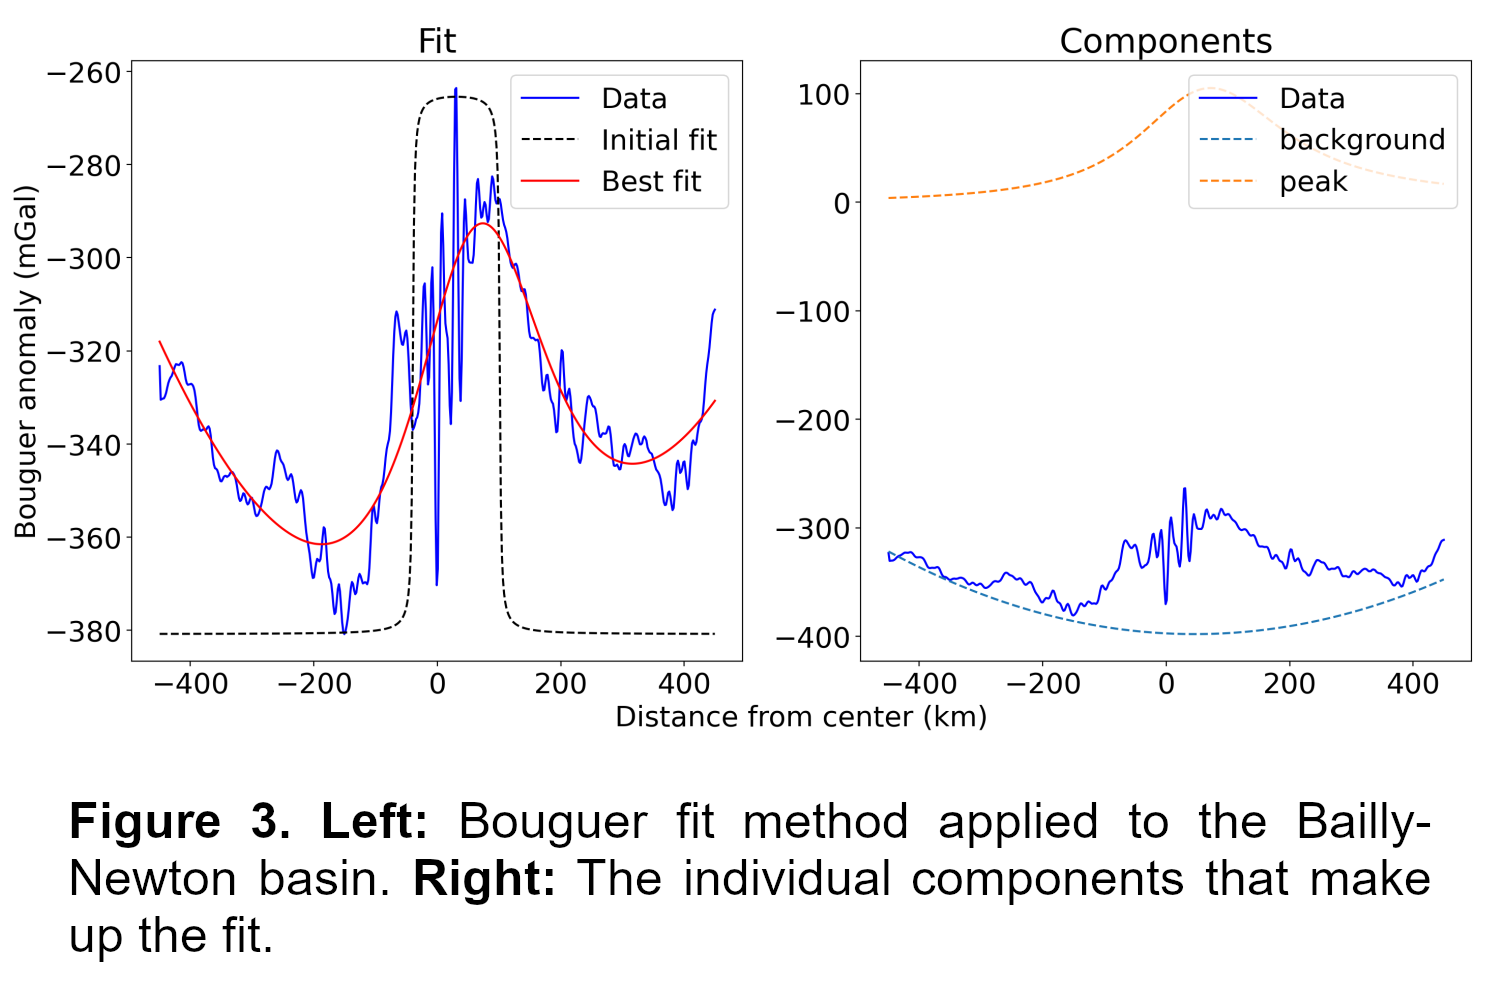
Concerning the Bouguer anomaly map of the same area, there is considerable noise, however once the Bouguer fit method is applied, a central mascon and surrounding annulus can be seen in Fig 3. The basin diameter derived by Bouguer peak algorithm is depicted by the 2nd largest circle in Fig 2. Using the topography in Fig 2 as a guide, the two outer circles appear to best fit the rim of the basin.
4. Discussion
Our analysis show that the Bailly-Newton basin is present and that it is larger than the estimate published in 2000, of 330 km namely, between 381 km and 424 km, depending upon which of the two best basin measuring method was used – with a mean 402 km. Although visual inspection of topographic data, slope maps, visualizations, can pick out obvious basins, a combination of algorithms applied to topographic and Bouguer anomaly data can identify more degraded basins. It is possible that the inclusion of evidence of other basin characteristics such as radial ejecta scour marks, and geological/geomorphological evidence[7] could help identify similar or more extensively degraded ancient basins.
References
[1] Cook et al., (2000) JGR (Planets), 105, p12,023-12,033. [2] Oberst et al., (2010) EPSC2010-827, [3] Wieczorek, (2015) Treratise on Geophysics (second edition), 10, p153-193. [4] Goosens et al. (2019) JGR (Planets), 125, e2019JE006086, [5] Baker et al., Icarus, 292, p54-73, [6] Neumann et al., (2015) Science Advances, 1(9), ISSN: 2375-2548. [7] Liu et al., (2020) 51st LPSC, abstract #1940.
How to cite: Aalhus, S., Cook, A., and Sheward, D.: Confirmation of the Bailly-Newton Impact Basin, European Planetary Science Congress 2021, online, 13–24 Sep 2021, EPSC2021-724, https://doi.org/10.5194/epsc2021-724, 2021.