
3D geological model of Uruk Sulcus on Ganymede: modeling approach and first insights
 1,1,1,2,3,1,1,1,4,
- 1INAF-OAPD, Padova, Italy
- 2University of Padova, Department of Geosciences, Padova, Italy (riccardo.pozzobon@unipd.it)
- 3CISAS, University of Padova, Padova, Italy
- 4Department of Physics and Astronomy, University of Padova, Padova, Italy
The surface of Ganymede has first been observed by the Voyager missions in 1970’s highlighting the presence of a deeply tectonized environment. Galileo Mission in 1996 imaged the Jovian satellites also providing at high-resolution images at targeted places during its flybys. Ganymede's crust is mainly composed of a brittle ice overlying a subsurface ocean, whose depth was constrained to be ~100-150 km [1]. The surface of Ganymede can be subdivided into dark and bright terrains depending on their crater density, differences in albedo and surface morphology. The latter is driven mainly by tectonization, characterized by presence of furrows and grooves. These structures represent the brittle deformation of the icy shell.
We focus on the bright terrain located in the region of Uruk sulcus, a NW-SE terrain ~400 km wide and ~2500 km long located between 150W -180W and 30N-10 S strongly deformed by sets of parallel/sub-parallel (often evenly-spaced) grooves both at a regional and local scale. The presence of such structures in light terrains is hypothesized to be determined by tilt-block normal faulting [2], by crustal necking similar to mid ocean ridges [3], or by major dextral transpression, as in the case of Uruk sulcus [4]. It has been demonstrated that such structures show a fractal spatial clustering, and represent a preferential pathway for fluid from the ~100-150 km-deep ocean [1]. We are testing different 3D geomodelling approaches hence deriving more information on both the volume of the fractured brittle ice crust and the most favored location of actual percolation.
Nowadays 3D geomodelling is approaching the planetary geology framework, as testified by the outcomes of the PLANMAP Horizon 2020 project [5, 6, 7, 8, 9]. With information either derived from direct surface observations and measurements and/or also constrained by geologic interpretation, it is possible to derive a 3D geomodel of the subsurface that represents specific geologic properties or geometries.
We built a preliminary Uruk sulcus model geometry using the global DEM [10] as an initial, low-resolution surface textured with the controlled global mosaic from DLR of Voyager 1, 2 and Galileo images at an average resolution of 359 m/pixel. This served as an upper surface boundary to project the structural mapping from Rossi et al., (2020) and also as an anchor point to reconstruct the major Uruk sulcus structures. As a lower model boundary, the icy crust is constrained at depth by the ocean-ice interface. We used the depth value calculated using the fractal clustering analysis in [1] related to Uruk sulcus.
We were able to reconstruct a preliminary qualitative model of the fault geometries for GUS1 (Grooves of Uruk Sulcus 1) system deformation ([4] as a large-scale structural framework. As a first test we focused on a smaller region in the sigmoidal area named S2 and containing the GUS3 (see white square in figure 1b).
We extracted a voxel-based volume of icy crust comprised between the surface, the lower ocean-ice interface bounded by the major fault lines delimiting GUS3. At this location a major set of high-angle extensional structures at NE-SW arranged in a right-stepping en-echelon geometry are present, together with other two lower in number grooves families with NW-SE and NS orientations. With this voxel-based volume and knowing the scaling laws of the size distributions of these feature and their azimuths, it is possible to simulate a DFN (Digital Fracture Network) for each of the fractures’ families (fig. 2a). With the DFN it is possible to infer possible high-connectivity locations in the fractured ice volumes and their location at the surface (figure 2b). Further quantitative analysis work on the DFN and the volume of ice will allow to simulate the movement along the major structures backwards and forward in time in order and to capture the strain in the ice volume by incorporating its rheological parameters, and also test the transpression vs necking approach.
The 3D geomodelling approach appears as a promising tool not only for scientific analysis but also to identify interesting target of future JUICE observation, where resurfacing or deep fluid expulsions could be more favored.
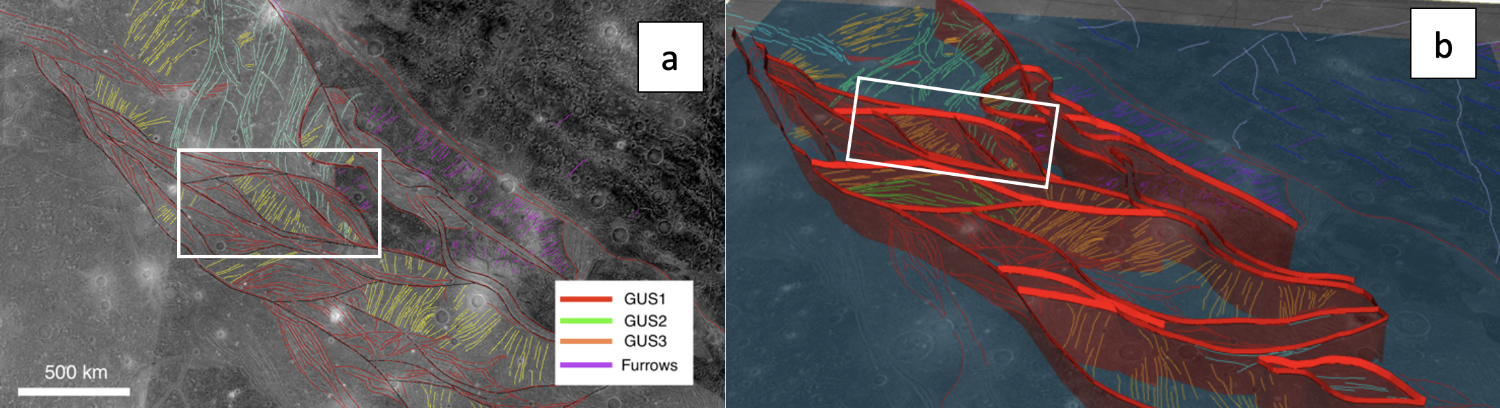
Figure 1: a) The structural map by[4] with the families of grooves (GUS). In b) the 3D geometric reconstruction of the larger GUS1 structures. This analysis is focused in the white box
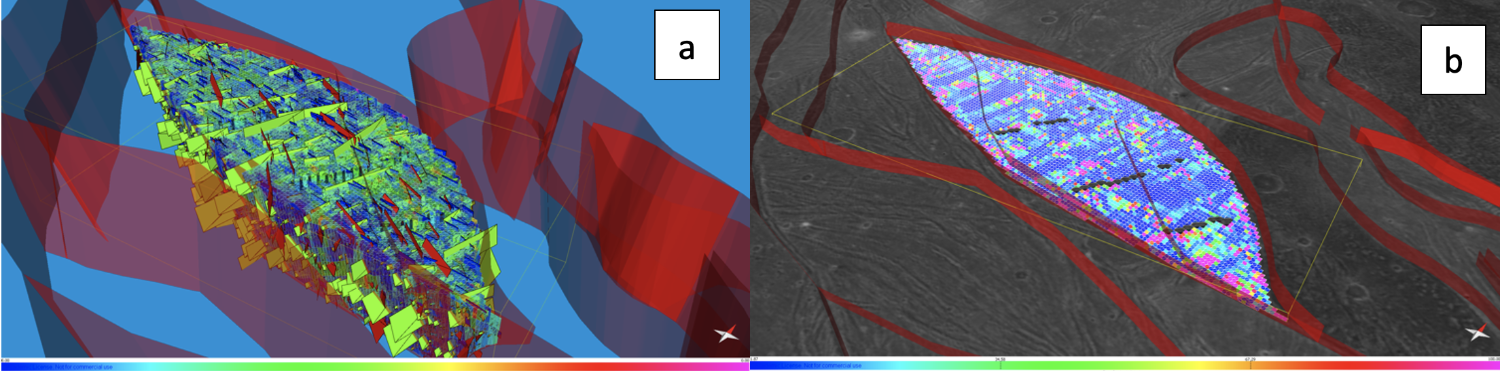
Figure 2: In a) the modelled DFN with the three families of major structures and in b) voxel-based volume showing areas at higher connectivity.
Acknowledgements:
The activity has been realized under the ASI-INAF contract 2018-25-HH.0.
References:
- [3] Pizzi, A., Domenica, A.D., Komatsu, G., Cofano, A., Mitri, G., Bruzzone, L., 2017. Spreading vs. Rifting as modes of extensional tectonics on the globally expanded Ganymede. Icarus 288, 148–159. https://doi.org/10.1016/j.icarus.2017.01.034
- [4] Rossi, C., Cianfarra, P., Salvini, F., Mitri, G., Massé, M., 2018. Evidence of transpressional tectonics on the Uruk Sulcus region, Ganymede. Tectonophysics 749, 72–87. https://doi.org/10.1016/j.tecto.2018.10.026
- [1] Lucchetti, A., Rossi, C., Mazzarini, F., Pajola, M., Pozzobon, R., Massironi, M., Cremonese, G., 2021. Equatorial grooves distribution on Ganymede: Length and self-similar clustering analysis. Planetary and Space Science 195, 105140. https://doi.org/10.1016/j.pss.2020.105140
- [2] Pappalardo, R.T., et al., 1998. Grooved Terrain on Ganymede: First Results from Galileo High-Resolution Imaging. Icarus 135, 276–302. https://doi.org/10.1006/icar.1998.5966
- [7] Pozzobon, R., Penasa, L., De Toffoli, B., Rossi, A. P., & Massironi, M. (2020). 3D geo-models based on multiple datasets on Mars (implicit or explicit modelling) (Public D6.1; Planmap Deliverable).
- [8] Penasa, L., Pozzobon R., Rossi, A. P., Massironi, M., (2020), 3D geo-models based on multiple datasets on the Moon (implicit or explicit modelling) (Public D6.2; Planmap Deliverable).
- [9] Pozzobon, R., Penasa, L., Massironi, M., Ferrari, S., (2021) 3D geo-models based on multiple datasets on Mercury (explicit modelling) (Public D6.3; Planmap Deliverable).
- [6] Massironi, M., Rossi, A. P., and the PLANMAP Consortium, PLANMAP Final report 2021
- [5] Massironi, M. et al., 2018. Towards integrated geological maps and 3D geo-models of planetary surfaces: the H2020 PLANetary MAPping project, in: EGU General Assembly Conference Abstracts, EGU General Assembly Conference Abstracts. p. 18106.
- [10] Zubarev, A., Nadezhdina, I., Brusnikin, E., Giese, B., Oberst, J., 2017. A search for Ganymede stereo images and 3D mapping opportunities. Planetary and Space Science 146, 40–54. https://doi.org/10.1016/j.pss.2017.07.021
How to cite: Pozzobon, R., Rossi, C., Lucchetti, A., Massironi, M., Pajola, M., Penasa, L., Munaretto, G., and Cremonese, G.: 3D geological model of Uruk Sulcus on Ganymede: modeling approach and first insights, European Planetary Science Congress 2021, online, 13–24 Sep 2021, EPSC2021-727, https://doi.org/10.5194/epsc2021-727, 2021.