
Raman spectroscopy investigation of lunar surface endmembers and analogues
 1,2,
1,2,- 1Centre for Terrestrial and Planetary Exploration (C-TAPE), University of Winnipeg, 515 Portage Avenue, Winnipeg R3B 2E9, MB Canada (s.potin-ra@uwinnipeg.ca)
- 2Department of Earth & Space Science & Engineering, Lassonde School of Engineering, York University, Toronto, ON, Canada
- 3MPB Communications, Pointe Claire, QB, Canada
Introduction Raman spectroscopy for planetary rover-based exploration has become a primary tool to investigate in situ geological materials. With the support of the Canadian Space Agency and their Lunar Exploration Accelerator Program (LEAP), a Lunar Raman spectrometer (LunaR [1]) is being developed jointly between the University of Winnipeg, York University and MPB Communications. This instrument is intended to be installed onboard an exploration rover and acquired Raman spectroscopy of the lunar regolith in sunlit and permanently-shadowed regions. Calibration targets are needed in the context of this instrument, each typical of lunar mineralogical endmembers and consistent with the composition of the surface. We thus analysed in Raman spectroscopy a set of 46 samples, consisting of plagioclases, olivines, pyroxenes, oxides and basalts, and the lunar highland breccia meteorite Northwest Africa (NWA) 12593 [2]. In this analysis, we investigate the composition of the meteorite NWA 12593 using Raman signatures detected for our reference samples.
Measurement protocols and spectral modelling Raman spectroscopy was performed in the laboratory using a B&W Tek iRaman Raman spectrometer with a 532 nm excitation laser and covering the spectral range from 175 to 4000 cm-1 with a spectral resolution of about 4cm-1. The size of the laser spot is 1mm, and the area viewed for the measurements covers a spot of 85µm on the sample. The integration time ranges from 500 to 65000 ms per spectrum, and for each sample we average between 1 to 250 spectra. These values are optimized for each sample before the scientific measurement to ensure a signal-to-noise ratio high enough to enable spectroscopic investigation and to avoid saturation of the detector when measuring high intensity peaks. The data are dark corrected during the measurement by the instrument software. Raman spectra are acquired for three spots of each sample.
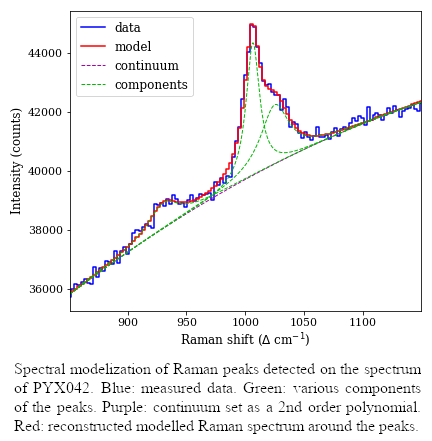
To accommodate the large amount of data to analyse, we developed a spectral deconvolution package in Python called Python Raman Analyzer (PyRANA). This package works with commands sent by the operator and allows the cleaning (i.e. detection and removal of hot pixels) and spectral modelling of the data. The continuum can be set as linear or as a 2nd order polynomial on a local scale. Several profiles are available to model the Raman peaks, such as Cauchy (symmetric and asymmetric), Gaussian (symmetric and asymmetric) and Breit-Wigner-Fano (BWF [3]). The spectral modelling allows the separation of blended features, too close from each other to be fully resolved, and thus the precise determination of the various band parameters. PyRANA, and all spectra presented in this analysis are available in free access in the SALSA database [4] (http://salsa.uwinnipeg.ca) Figure 1 presents the resulting modeling of a group of peaks detected on the Raman spectrum of the orthopyroxene sample PYX042.
We used PyRANA on all samples and the lunar meteorite. All detected peaks are deconvoluted and used as indicators of the composition of the samples.
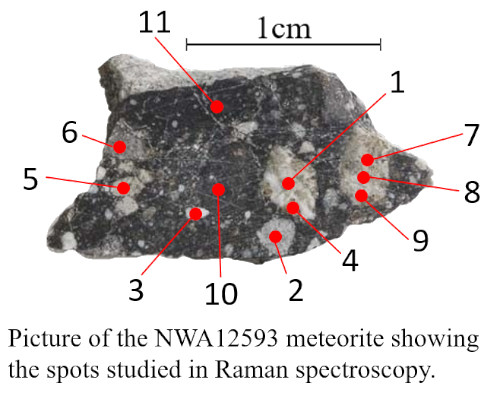
Raman spectroscopy of the lunar meteorite Raman spectroscopy was performed on 11 various areas of the lunar meteorite, on some inclusions and the dark matrix. Figure 2 shows the location of the observed spots during the Raman measurement, and Figure 3 shows the associated spectra.
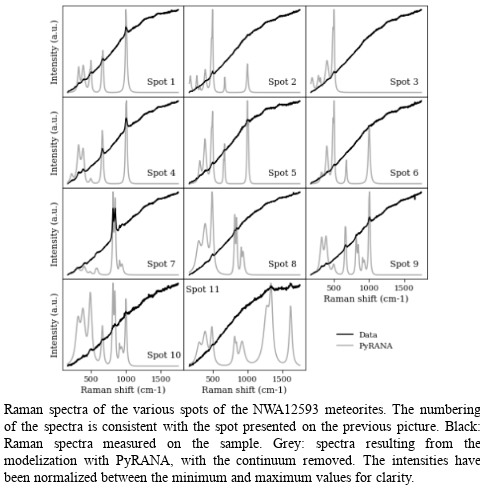
Most of expected Raman signatures are difficult to detected in the raw spectra because of the strong fluorescence (seen here as the increase of the intensity with increasing Raman shift). Beside the capacity to deconvolute the Raman peaks, PyRANA allows the removal of the continuum from the data to better isolate the Raman peaks. It can be seen on the previous figure that we detected several Raman peaks for each location on the meteorite. We now compare the position of the Raman peaks detected on the meteorite with the various signatures resulting from the investigations of the reference surfaces presented above.
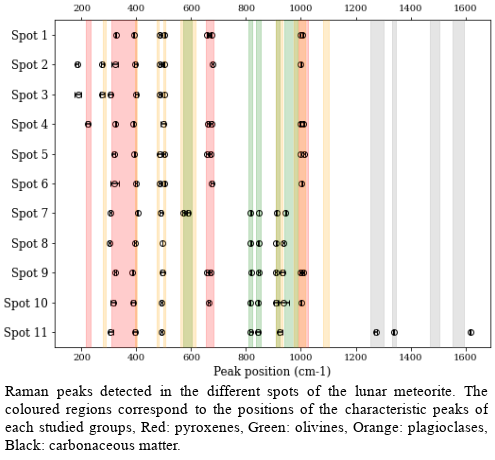
We observe on the previous figure that the Raman signatures detected on the meteorites matched those resulting from the analysis of the reference samples. All studied spots are composed of pyroxenes and plagioclase, spots 7 to 11 also show clear signatures of olivine. Though the work presented here results only in qualitative analysis, the Raman spectroscopy coupled with spectral deconvolution allows a determination of the mineralogical composition of lunar samples [5].
Conclusion We used pure single mineral samples of known compositions consistent with the composition of the lunar surface for the development of LunaR. The Raman spectroscopy analysis coupled with the spectral deconvolution with PyRANA allowed us to generate a Raman peak data base to be used in the future as references for the compositional investigation of lunar materials. We then determined the composition of the matrix and several inclusions of a lunar meteorite using the reference data previously acquired.
Acknowledgments We acknowledge the support provided by the Canadian Space Agency through their Lunar Exploration Accelerator Program (LEAP). This study is also being supported with funding from NSERC, UWinnipeg, CFI, and MRIF. This research has made use of community-developed core Python packages for astronomy and scientific computing including Scipy [6, 7], Numpy [8] and Matplotlib [9].
References [1] Cloutis et al., 52nd LPSC, 2021, 1473. [2] Gattacceca et al. Meteoritics and Planetary Science, 2020, 55, 1146–1150. [3] Eklund & Subbaswamy, Physical Review B, 1979, 20, 5157–5161. [4] Manigand et al., Canadian Lunar Workshop, 2021. [5] Potin et al., in prep. [6] Jones et al., 2001. [7] Virtanen et al., Nature Methods, 2020, 17, 261–272. [8] van der Walt et al. Computing in Science and Engineering, 2011, 13, 22–30. [9] Hunter et al. Computing in Science and Engineering, 2007, 9, 90–95.
How to cite: Manigand Potin, S., Manigand, S., Turenne, N., Sidhu, S., Connell, S., Applin, D., Cloutis, E., Caudill, C., Newmann, J., Lalla, E., Lymer, E., Freemantle, J., Daly, M., and Kruzelecky, R.: Raman spectroscopy investigation of lunar surface endmembers and analogues, European Planetary Science Congress 2021, online, 13–24 Sep 2021, EPSC2021-97, https://doi.org/10.5194/epsc2021-97, 2021.