TP19
Session assets
Please decide on your access
Please use the buttons below to download the presentation materials or to visit the external website where the presentation is linked. Regarding the external link, please note that Copernicus Meetings cannot accept any liability for the content and the website you will visit.
Forward to presentation link
You are going to open an external link to the presentation as indicated by the authors. Copernicus Meetings cannot accept any liability for the content and the website you will visit.
We are sorry, but presentations are only available for users who registered for the conference. Thank you.
Oral and Poster presentations and abstracts
The Earth’s Moon is a cornerstone and keystone in the understanding of the origin and evolution of the terrestrial, Earth-like planets. It is a cornerstone in that most of the other paradigms for the origin, modes of crustal formation (primary, secondary and tertiary), bombardment history, role of impact craters and basins in shaping early planetary surfaces and fracturing and modifying the crust and upper mantle, volcanism and the formation of different types of secondary crust, and petrogenetic models where no samples are available, all have a fundamental foundation in lunar science. The Moon is a keystone in that knowledge of the Moon holds upright the arch of our understand of the terrestrial planets. It is thus imperative to dedicate significant resources to the continued robotic and human exploration of this most accessible of other terrestrial planetary bodies, and to use this cornerstone and keystone as a way to frame critical questions about the Solar System as a whole, and to explore other planetary bodies to modify and strengthen the lunar paradigm.
What is the legacy, the long-term impact of our efforts? The Apollo Lunar Exploration Program revealed the Earth as a planet, showed the inextricable links of the Earth-Moon system, and made the Solar System our neighborhood. We now ask: What are our origins and where are we heading?: We seek to understand the origin and evolution of the Moon, the Moon’s links to the earliest history of Earth, and its lessons for exploration and understanding of Mars and other terrestrial planets. A basis for our motivation is the innate human qualities of curiosity and exploration, and the societal/species-level need to heed Apollo 16 Commander John Young’s warning that “Single-planet species don’t survive!”. These perspectives impel us to learn the lessons of off-Earth, long-term, long-distance resupply and self-sustaining presence, in order to prepare for the exploration of Mars and other Solar System destinations.
Key questions in this lunar exploration endeavor based on a variety of studies and analyses (1-3) include:
-How do planetary systems form and evolve over time and when did major events in our Solar System occur?
How did planetary interiors differentiate and evolve through time, and how are interior processes expressed through surface-atmosphere interactions?
-What processes shape planetary surfaces and how do these surfaces record Solar System history?
-How do worlds become habitable and how is habitability sustained over time?
-Why are the atmospheres and climates of planetary bodies so diverse, and how did they evolve over time?
-Is there life elsewhere in the Solar System?
Specific lunar goals and objectives will be outlined in this broad planetary science context.
References: 1. Carle Pieters et al. (2018) http://www.planetary.brown.edu/pdfs/5480.pdf, 2. Lunar Exploration Analysis Group, https://www.lpi.usra.edu/leag/. 3) Erica Jawin et al. Planetary Science Priorities for the Moon in the Decade 2023-2033: Lunar Science is Planetary Science.
How to cite: Head, J.: Open questions in lunar science (invited talk), Europlanet Science Congress 2021, online, 13–24 Sep 2021, EPSC2021-851, https://doi.org/10.5194/epsc2021-851, 2021.
Chandrayaan-2 Orbiter carries eight experiments for studies, including morphology, surface geology, composition, and exospheric measurements based upon the understanding and information from the previous lunar orbital missions. Orbiter high-resolution camera (OHRC), one of the payloads, has a very high spatial resolution of 0.25 m. It operates in a visible panchromatic (PAN) band with a swath of 3 km from an altitude of 100 km. OHRC will search for hazard-free zones and map the landing site for future human missions. This work presents the initial impressions from the first data release of the OHRC on-board Chandrayaan-2. Here the OHRC image is analyzed for large-scale features like boulders, ridges, and craters on the lunar surface. Classification and visual analysis have been carried out to check the shape (morphology) and location of many impact craters. As seen from OHRC images, the lunar surface near to Hagecius lunar impact crater is dominated by the repetitive and frequent bombardment of small meteorites varying from millimeters to centimeters. The extent of degradation and erosion of a few large craters due to space weathering or the continuous meteorite bombardment is clearly observed. The results provide more clarification towards the ongoing physical processes on the moon. OHRC image provides a much detailed understanding of lunar topography and morphology.
How to cite: Tripathi, P. and Garg, R. D.: Initial results from the Optical High-Resolution camera (OHRC) onboard Chandrayaan-2, Europlanet Science Congress 2021, online, 13–24 Sep 2021, EPSC2021-83, https://doi.org/10.5194/epsc2021-83, 2021.
Hawai`i Island has had a pivotal role in human Lunar Exploration by virtue of its high-fidelity science and technical field sites. The geologic and historically recent volcanic landscape along with the geochemical simularity of Hawaiian basalts with Lunar basalts have made Hawaii a prime location for field test simulations. This presentation will briefly highlight the legacy Apollo astronaut geology training. The post-Shuttle In-Situ Resource Utilization (ISRU) field tests on equipment & techniques for lunar oxygen production will be covered along with mission simulations for NASA’s RESOLVE and VIPER lunar polar missions. Google Lunar X-Prize (GLXP) field trials have also occurred. Finally educational aspects with University level robotic mining competitions (Lunabotics/RMC/PRISM) will be shown.
The geo-technical properties of the tephra (basalt sand) at the field site(s) will be explored, and shown to provide a good lunar simulant for laboratory use and experimentation. Samples are still currently available for researchers.
How to cite: Hamilton, J.: Lunar Science, Resources and Innovation at Field Simulations, Europlanet Science Congress 2021, online, 13–24 Sep 2021, EPSC2021-867, https://doi.org/10.5194/epsc2021-867, 2021.
An expedition EMM-Etna to simulate the Lunar and Martian volcanic and soil environment will be carried out at Mount.Etna’s Cratere del Laghetto in Sicily, near Catania Italy by the EuroMoonMars TUDublin and LEAPS ExoMars groups. This scouting campaign intends to train in using instruments to be used on MoonMars landers and rovers, with a perspective of ARCHES DLR telerobotics campaign to be conducted in June 2022, and in preparation for ExoMars rover instruments (PANCAM, CLUPI and spectrometers) science and operations.
Figure 1: Lunar Lander and REMMI Rover for Sample Analysis
The aim of this EMM-Etna expedition is to investigate and analyse the terrain with the use of different scientific instruments. The topography of the landscape will be photographed using a 360° panoramic camera and drone; it will be processed, and a 3D model developed. The terrain will also be investigated using the REMMI Rover, the abilities of the rover to operate and transport equipment will be monitored. This will further develop the knowledge available of the terrain and help future expeditions to identify different landmarks. The use of a Radio Jove Antenna will permit the team to monitor transmissions from both the Sun and Jupiter. This will allow different cosmic events or changes in the celestial objects to be studied and explored. On site a selection of different samples will also be collected and examined using the REMMI Rover. An Ocean Optics UV-Vis-NIR spectrometer will a be operated in order to evaluate the existence of biological compounds and substances within these samples and in the area itself. It is key to understand the molecular makeup of one’s surroundings when in an unknown environment. By analysing samples collected, spectroscopy can be used to identify and determine a diagnostic for each substance. This process will be monitored by a Logitech camera to ensure it is carried put correctly. A selection of photographs will be captured of each sample using a portable optical microscope. This will allow an in-depth analysis of the microscopic structure of each collected sample. The use of all of the instruments mentioned above is key in the investigation and research into the Moon and Martian-like volcanic environment that is Mount Etna.
We would also like to thank Prof I. Pagano's team from the University of Catania and Dr A.Wedler's team from DLR Deutsches Zentrum für Luft- und Raumfahrt for their support in organising this expedition.
How to cite: Reilly, H., Foing, B., Brady, G., Mohan, C., McGrath, K., Lakomiec, P., Ehreiser, A., De Palma, G., Schlarmann, L., Wedler, A., Schmitz, N., and Pagano, I.: Instruments Operations, Science and Innovation in Expedition Support: EuroMoonMars-Etna campaign 2021, Europlanet Science Congress 2021, online, 13–24 Sep 2021, EPSC2021-848, https://doi.org/10.5194/epsc2021-848, 2021.
In 2017, CNES has enforced its visibility and ambitions in Scientific exploration programs by creating the FOCSE (French Operations Centre for Science and Exploration) center. FOCSE groups all the Science Operations activities, including ground segment development, operations and data valorization for the domains involved in the Scientific exploration including Astrophysics & Fundamental Physics, Planets, Small bodies & Solar Physics and Human Spaceflight (Nutrition, Healthcare, Life Science, …). This gives an advantage increasing synergy and commonalities between the different missions and allowing operational people to focus only on what makes each mission original and specific.
FOCSE integrates the CADMOS Centre created in 1993, the COMS (Planets Mission centers), Astronomy & Solar systems mission in order to implement a synergetic merge of science in astronomy, solar systems, microgravity and space exploration (robotic and manned). As an example of synergy, we will present the FOCSE Moons & small bodies facility that will be set up for Cubesats activities within the frame of ESA’s planetary defense HERA mission and also in support to JAXA’s MMX mission. This effort will capitalize on our expertise based on our contributions to Rosetta/Philae and Hayabusa2/Mascot on Mission Analysis and visualizing tools to support Scientific activities. We will also present the Spaceship project that has started in coordination with ESA to contribute to the development of technologies for exploration.
More recently, CNES proposes to set up a new innovation Lab facility, based on an immersive and open facility for innovation on exploration technologies. Technologies of interests have been identified and will be developed with our partners and also with new actors, in order to allow dynamic spin in and spin off approaches for Exploration technologies. Thanks to this new facility, CNES will provide technical means to create new, innovative, disruptive systems, gather assets from Research, Universities and Industries (from startup to large industrial group) into the same melting-pot, foster collaboration between partners and CNES experts in all space sciences/technologies and operations and join international network of spaceships.
The CNES roadmap on Science is defined, the Technological part of this roadmap will be expanded with new Technological opportunities. The proposed paper will present an overview of the CNES strategy and how we implement it on a kind of “DevOps” approach to accelerate and innovate as much as possible, including also a digital factory platform, with the main idea to federate to the network of French Exploration actors (means and expertise) to enforce synergies with ESA and international partners in order to contribute to future Exploration missions.
How to cite: Jocteur Monrozier, F., Barde, S., Barroso, T., Lorda, L., and Blouvac, J.: FOCSE: CNES Exploration contributions for Operations and Innovation, Europlanet Science Congress 2021, online, 13–24 Sep 2021, EPSC2021-843, https://doi.org/10.5194/epsc2021-843, 2021.
INTRODUCTION
The characterization of the magnetic field and the magnetic properties are useful tools to understand the composition, structure and geological history of the surface rocks. Additionally, this has important implications on the determination of magnetic fields present in the early history of the planets.
Determining the complex magnetic susceptibility (both real and imaginary parts) of rocks is important to obtain their complete magnetic characterization [1]. Real and imaginary susceptibility provide complementary information, such as: how much magnetization can acquire a rock in the presence of an external field, how this magnetization behaves under alternating current (AC) and the magnetic energy losses during the magnetization by different mechanisms (induced currents, hysteresis, etc.), which helps in the identification of minerals, magnetic carriers and their phases. This information could be used in the selection criteria of rocks for sample return missions or for the in-situ scientific studies of the magnetic properties during planetary missions.
SUSCEPTOMETER INSTRUMENT
The Space Magnetism Area at INTA has developed a magnetic instrument, named “NEWTON susceptometer”, for the determination of the complex magnetic susceptibility, to characterize planetary soil and rocks during in situ exploration [2]. The instrument design is based on AC - inductive methods, reaching a resolution of about c = 10−4 (S.I. Vol. Susceptibility) and a dynamic range between c’ = 10−4 S.I. and c’ = 101 S.I. for the real susceptibility, which are representative values for the rocks of the Earth, Moon and Mars [3, 4, 5]. The imaginary susceptibility measurement procedure is currently under calibration, with an expected resolution in the order of c” = 10−6. Such resolution is adequate for most natural rocks characterization and competitive with that of larger and widely proven laboratory instruments (like a Vibrating Sample Magnetometer – VSM). Additionally, the sensor size, power consumption and portability make it suitable to be placed on board rovers, or to be used as a portable device during field campaigns and by astronauts in manned space missions. Furthermore, this sensor provides a great advantage compared to available commercial susceptometers, given that it does not require sample preparation, but only a minimum sample size of 50 x 20 x 20 mm approximately.
The instrument has successfully passed vibration and thermo-vacuum tests representative of interplanetary missions, and is being used in scientific campaigns in terrestrial analogs to characterize in situ the real part of the susceptibility. In particular, the instrument has been used during field campaigns in Cerro Gordo volcano, in Spain
CERRO GORDO VOLCANO – MARTIAN ANALOGUE
Cerro Gordo is a volcano located at 38° 50’ 1.353’’ N, 3° 44’ 20.068’’ W, by Granátula de Calatrava, Ciudad Real (Spain), with a greatest axis of 1000 meters and a relative height of 90 meters. Previous studies date the volcano between 4.7 and 1.75 million years ago, during the Pliocene and Quaternary periods. Throughout its history, it went through several volcanic phases, i.e. strombolian and phreatomagmatic. It has been proposed as a Martian analogue for the similarities of the structure with other volcanoes on the surface of the Red Planet [6]. Cerro Gordo area hosts rocks of different geological origins, from quartzite (box rock) to phreatomagmatic and strombolian phases along a transversal line of the volcano, comprising different minerals with a high range of magnetic susceptibility values. These characteristics make Cerro Gordo an excellent scenario for a demonstration campaign of the susceptometer prototype.
RESULTS AND CONCLUSIONS
In Cerro Gordo, we have determined the magnetic susceptibility in-situ in order to mimic the operation of future exploration missions. The study includes the measurement of ten different outcrops on the volcano, which are representative of the volcanic phases and the field basement (Figure 1). The susceptibility measurements have served successfully to distinguish between the rocks from a spatter deposit and the box rock.
Figure 1A shows the susceptibility, measured in situ, of 13 rocks along a transect of the volcano. Rocks 15_1, 13_1, 13_2, 12_1 and 5_1 corresponds to the box rock and scoria from strombolian eruptions. They cast low values of susceptibility in good correlation with the nature of the quarzites (box rock) and the fast cooling history of the surface scoria. Five other samples (22_1, 10_2, 10_3, 10_4 and 9_1) with heterogeneous composition, show medium susceptibility values, four of them corresponding to non-cohesive rocks of the top of a spatter deposit. The highest susceptibility values of Figure 1A corresponds to the bottom part of the spatter deposit: rocks 23_1 and 24_1: a compact rock associated to a low speed cooling history.
In Figure 1B we study the spatter flow in more detail, dividing this structure into three deposits: a very compact layer (1) with the highest values of susceptibility, friable rocks with some levels of fluidity (2) with low values of the susceptibility, and some cohesive rocks (3) with medium values of susceptibility and supposedly more heterogeneous.
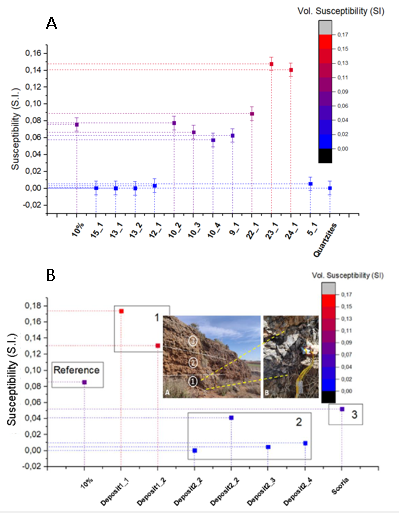
Figure 1. A - Magnetic susceptibility values measured with the susceptometer prototype in April 2021. B - Magnetic susceptibility values measured with the susceptometer prototype. 10% represents the value of the susceptibility for the calibration pattern with 10% content in ferrite.
It has been proved that the susceptometer is a useful tool for the in situ determination of the magnetic susceptibility during field campaigns. This is due to its good performance during the field work and its capability to discern between the different rock units and furthermore, among different deposits. It supposes a novel tool for fast analysis because it is a handheld device and its measurements do not require sample preparation.
Acknowledgements:
This project has received funding from the European Union's Horizon 2020 research and innovation program under grant agreement No 730041 and the Spanish National Plan project ESP2017-88930-R.
References:
[1] Kuipers, B. W. M. et al. Review of Scientific Instruments 79, 013901 (2008).
[2] Díaz Michelena, M. et al. Sensor Actuat A-Phys, vol. 263, pp. 471-479, 2017.
[3] Rochette, P. et al (2005). Meteoritic and Planetary Science, 40 (4): 529–540.
[4] Rochette, P. (2010). Earth and Planetary Science Letters, 292: 383–391.
[5] Hunt C.P., et al (2013). Wiley. Online Library.
[6] O.G. Monasterio et al. Terrestrial Analogs 2021 (LPI Contrib. No. 2595).
How to cite: Mesa, J. L., Díaz Michelena, M., García Monasterio, O., and Oliveira, J. S.: Susceptometer for fast and in-situ determination of the complex magnetic susceptibility. Field demonstration in Cerro Gordo volcano, a Martian analogue., Europlanet Science Congress 2021, online, 13–24 Sep 2021, EPSC2021-844, https://doi.org/10.5194/epsc2021-844, 2021.
Introduction: The Package for Resource Observation and in-Situ Prospecting for Exploration, Commercial exploitation and Transportation (PROSPECT) is a payload in development by ESA for use at the lunar surface. Current development is for flight on the Russian-led Luna-Resource Lander (Luna 27) mission, which will target the south polar region of the Moon.
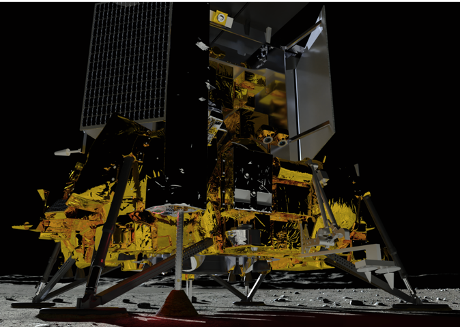
PROSPECT will perform an assessment of the volatile inventory in the near surface regolith (down to a depth of ~ 1 m), and elemental and isotopic analyses to determine the abundance and origin of any volatiles discovered [1] (Fig. 1).
Credit: ESA/ROSCOSMOS/IKI/Lavochkin Association.
Figure 1: Graphical representation of PROSPECT onboard Luna 27 during surface operations.
In addition to the volatile studies, PROSPECT will perform a demonstration of In-Situ Resource Utilization techniques, extracting solar-wind implanted oxygen from lunar minerals. This demonstration will constitute potential science return from anywhere on the Moon, regardless of volatile content.
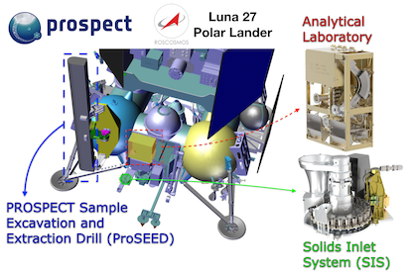
PROSPECT is comprised of the ProSEED drill module (including a permitivity sensor on the drill), and the ProSPA analytical laboratory, plus the Solids Inlet System (SIS) (Fig. 2).
Credit: LDO / NPOL / IKI
Figure 2: Renderings of PROSPECT onboard Luna 27, including the ProSEED drill (left), and ProSPA (right). ProSPA comprises 1) the Solids Inlet System (lower right), with a camera assembly [2] and a carousel of ovens used for volatile extraction, and 2) the analytical laboratory (upper right) containing a gas processing system, and magnetic sector plus ion-trap mass spectrometers.
Development status and current activities: Phase C (detailed definition) began in December 2019. In parallel to the industrial activity, an associated plan of research has been formulated to guide ongoing development, build strategic scientific knowledge, and to prepare for payload operations.
Drill Testing. Tests of the ProSEED Development Model wer carried out in December 2019, including drilling into, and sampling from, well-characterized NU-LHT-2M simulant mixed with anorthosite inclusions of various plausible sizes [3, 4]. The main functionalities of the drill system were successfully demonstrated and required performances were achieved in these tests.
ProSPA Bench Development Model (BDM). The BDM of the ProSPA analytical lab at the Open University has been tested to demonstrate science performance against measurement requirements. Dedicated efforts recently focused on verification of evolved gas analysis (EGA) and demonstration of ISRU capabilities [5, 6], improving our understanding of our sensitivity to volatile abundance and possible contamination [7].
Volatile Preservation: Particular efforts have recently focused on understanding the capability of PROSPECT to sufficiently preserve the volatile content in regolith throughout the sampling-analysis chain for the range of expected volatile contents, e.g. [8]. Detailed modelling and experimental work is ongoing to better understand water sublimation rates in realistic lunar surface operational environments, regolith structures, and geometries [9], and to better constrain the potential effect on measured D/H of sublimation of lunar water ice [10]. Results from this will help ensure that even in a ‘hot operational case’, the original volatile inventory can be determined with sufficiently small uncertainties.
Sample analysis: In 2020, PROSPECT Science Team members successfully requested two samples of lunar regolith (2 g each) from the Apollo collections. Proposed experiments will investigate loss of water ice through sublimation and the effects that the bulk properties and the ice-regolith coupling have on the sublimation process.
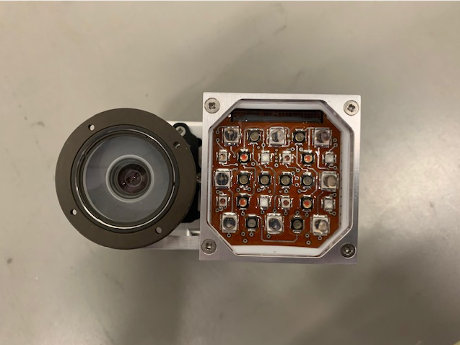
ProSEED Imaging System: ProSEED includes an imaging system (Fig. 3) with LED illumination, which will be used to image the drilling operations, the build-up of the ‘cuttings pile’ as the drill descends, and the samples as they are transferred to the ProSPA laboratory for analyses. The Engineering Model of the imaging system is currently with the science team for testing, and is being fully characterized from a scientific perspective. This will include some dedicated testing to see how the performance of the imager and the LED illumination changes in response to increasing coverage by simulated lunar dust.
Credit: LDO / Kayser Italia
Figure 3: The PROSPECT Imaging System, with LED illumination.
Operational profiling: Work is currently underway to define operational priorities and preferred operational sequences. These are being discussed from a purely scientific perspective for now, and will later be fed into an operational database (Fig. 4) that will allow us to balance the spacecraft resources available against the desired scientific output. This work includes deciding on prospective drilling depths and the ProSPA analyses to be completed, depending on whether we would like to be looking at isotopic abundance, Evolved Gas Analyses, and/or ISRU experiments. There are many factors that need to be considered when defining these sequences, and some of these will be outlined in the presentation.
Figure 4: Operation spreadsheet for measurement prioritization.
PROSPECT Ion-Trap Mass Spectrometer (PITMS): A variant of the ProSPA ion-trap mass spectrometer has been selected for flight on the Astrobotic Peregrine-1 mission, which will fly to Lacus Mortis in 2021. PITMS will monitor the decay in the local exospheric pressure following landing, providing knowledge on lander-sourced contamination by scanning m/z 10 to 150 at 10 Hz, and time-integrating mass spectra in-situ to build S/N.
Summary: Development is now well underway for the PROSPECT package on Luna 27. This presentation will outline the development status, some science team activities, and the propespective scientific analyses to be undertaken once at the lunar surface.
References: [1] Trautner, R. et al., (2018) in Proc. Int. Astronaut. Congr. IAC, Vol. 2018-October. [2] Murray, N. J. et al. (2020) in Lunar Planet. Sci. Conf., LPI, Abs #. 1918. [3] Martin, D. J. P. and Duvet, L., (2019) in Lunar Planet. Sci. Conf., LPI, Abs #. 2663. [4] Hayne, P. O. et al., (2017) J. Geophys. Res. Planets 122 (12), 2371–2400. [5] Sargeant, H. M. et al., (2020) Planet. Space Sci. 180 (104751). [6] Sargeant, H. M. et al., (2020) in Lunar Planet. Sci. Conf. LPI, Abs #. 2058. [7] Abernethy, F. A. J. et al., (2020) Planet. Space Sci. 180 (104784). [8] King, O. et al., (2019) Planet. Space Sci. 104790. [9] Formisano, M. et al., (2019) Planet. Space Sci. 169. [10] Mortimer, J. et al., (2018) Planet. Space Sci. 158, 25–33.
How to cite: Heather, D., Sefton-Nash, E., Fisackerly, R., Trautner, R., Barber, S., Reiss, P., and Houdou, B.: The ESA PROSPECT Payload for LUNA 27: Development Status and Science Activities, Europlanet Science Congress 2021, online, 13–24 Sep 2021, EPSC2021-291, https://doi.org/10.5194/epsc2021-291, 2021.
Lunar Dust is representing both an engineering challenge for future exploration missions due to systems potential contamination (due to regolith mobilization during e.g. traverse phases, landings, scooping, astronauts EVAs..) and a scientific target for e.g. mineralogical and compositional analysis of the Lunar surface. Therefore predicting not only interactions with systems but also payloads landed at the lunar surface is an important part of future missions design. Strong partnerships and synergies between agencies and space industries are now allowing the preparation of new missions with challenging timescales, for a return to the Moon in the next couple of years. In this context, the analysis of re-analysis of some of the Apollo era data and other landed assets is of high interest to perform the calibration of predictive algorithms and simulations tools of regolith transport and interactions with systems.
The present work is organized in two parts: in the first part, we present a modelling study of two experiments included in the Apollo Lunar Surface Experiment Package (ALSEP): the Lunar Ejecta and Meteoroids Experiment (LEAM), which experienced failures linked to thermal control and the Dust Detector Experiment (DDE) which could measure solar cells performance variations due to dust coverage.
In the second part, we present simulation results for the contamination of the Imaging System accommodated on the PROSPECT experiment that will be embarked on the Luna 27 lander, due to land on the Moon in the next couple of years.
We will discuss the quality of our predictions, the uncertainties inherent to the measurements, and the way forward in terms of better representation of lunar dust transport and interactions processes through models.
How to cite: Cipriani, F. and Piette, F.: Simulations of Lunar Dust interaction with exploration systems and instruments, Europlanet Science Congress 2021, online, 13–24 Sep 2021, EPSC2021-729, https://doi.org/10.5194/epsc2021-729, 2021.
Introduction
The Chang’e-5 (CE-5) mission is China’s first lunar sample return mission. CE-5 landed at Northern Oceanus Procellarum (43.06°N, 51.92°W) on December 1, 2020, collected 1731 g of lunar samples, and returned to the Earth on December 17, 2020. The CE-5 landing site is ~170 km ENE of Mons Rümker, on one of the youngest mare basalts (Em4/P58) of the Moon [1,2], which are never sampled by the Apollo or Luna missions. The CE-5 returned samples are currently being analyzed by the Chinese scientists, and the first batch of data have been released by the Lunar Sample Information Database (https://moon.bao.ac.cn/moonSampleMode/index.html). This study describes the provenance of lunar regolith at the CE-5 landing site in order to provide context for the ongoing sample analysis.
Exotic Material Source Craters
Because Em4/P58, where CE-5 landed, has a late-Eratosthenian age [1], all pre-Eratosthenian craters and most Eratosthenian craters nearby are not ejecta source craters. Calling on the initial selection of ejecta source craters by [3] and the local geological backgrounds [4], we proposed Aristarchus, Copernicus, Harding, Harpalus, Kepler, Lichtenberg, Pythagoras, and Sharp B are potential main ejecta source craters. Rümker E is also taken into account because its ray/ejecta is easily distinguished from the mare basalts to the southeast of Mons Rümker.
To determine post-Em4/P58 craters, we conducted a comprehensive literature study of these nine craters to collect their AMAs or relative ages (Table1 in [5]). Aristarchus (280 Ma), Copernicus (779-796 Ma), Harding (881 Ma), and Kepler (625-950 Ma) are Copernican-aged and dramatically younger than ∼1.53Ga, and their ejecta inevitably overlies the Em4/P58. Lichtenberg (>1.68G) and Pythagoras (2.68 Ga) are older than 1.53 Ga, therefore, they are unlikely to be ejecta source craters. To the east of Em4/P58, albedo and compositional data show abundant ejecta with a NE-SW direction; thus, we inferred that the NE-SW orientated ejecta should dominate the ejecta composition because of their extensive areal distribution. Ejecta tracing back to the parent craters indicate an origin either from Harpalus or Sharp B or both. More detailed morphological and compositional investigations of Harpalus and Sharp B craters show that Harpalus has a much younger appearance, with distinct high albedo radial ray/ejecta and boulders. Sharp B crater has a more subdued morphology, without clear radial ejecta and boulders. Based on their morphology and degradation state, Harpalus is likely to be Copernican-aged and Sharp B should be Eratosthenian-aged or even older, while crater counting directly on their rims are NOT reliable [5], which may be contaminated by secondary craters, self-secondary craters, partially buried craters, and the extra slopes.
After we examined the main source craters of ejecta in the mapped region, we conducted a thorough investigation of ejecta in Em4/P58 using their long axis directions (Fig. 1); the ejecta was traced back to one of the nine listed craters. According to the mapping, the eastern part of Em4/P58 is covered by extensive ejecta from Harpalus crater, which can be traced continuously back to its source. Three large Copernican craters to the southeast of Em4/P58 (Aristarchus, Copernicus, and Kepler) also provide a significant amount of ejecta, especially Copernicus crater.
Quantitative Assessment of Exotic Materials
To quantitatively analyze the contribution from different distant ejecta sources, we calculated their thicknesses in the study region using the power-law model modified by [6]. According to this calculation, Harpalus contributes the most ejecta to Em4/P58 (∼10 cm), followed by two Copernican-aged craters Copernicus (∼8 cm) and Aristarchus (∼3 cm). Contributions from Kepler and Rümker E are negligible. The ejecta thickness calculation agrees well with the ejecta distribution tracing, suggesting Harpalus is the main ejecta source, dominating the overall ejecta thickness for Em4/P58. Sharp B crater is OLDER than Em4/P58 based on its morphological characteristics, thus its ejecta does NOT overlie Em4/P58.
The percentage of contributions from each ejecta source crater was calculated to first-order by employing [7]’s regolith gardening model. Considering the CE-5 mare basalts have an age of between 1.6-1.7 Ga, the top ∼74 cm regolith is mixed up. Because the total ejecta thickness from studied source craters is ∼22 cm, we can assume all ejecta layers are mixed into the first ∼74 cm of lunar regolith. This yields the overall exotic components at the CE-5 landing site of ∼9%. Harpalus (∼6%), Copernicus (∼2%), and Aristarchus (∼1%) are the three most important source craters, agreeing with the map results (Fig. 1).
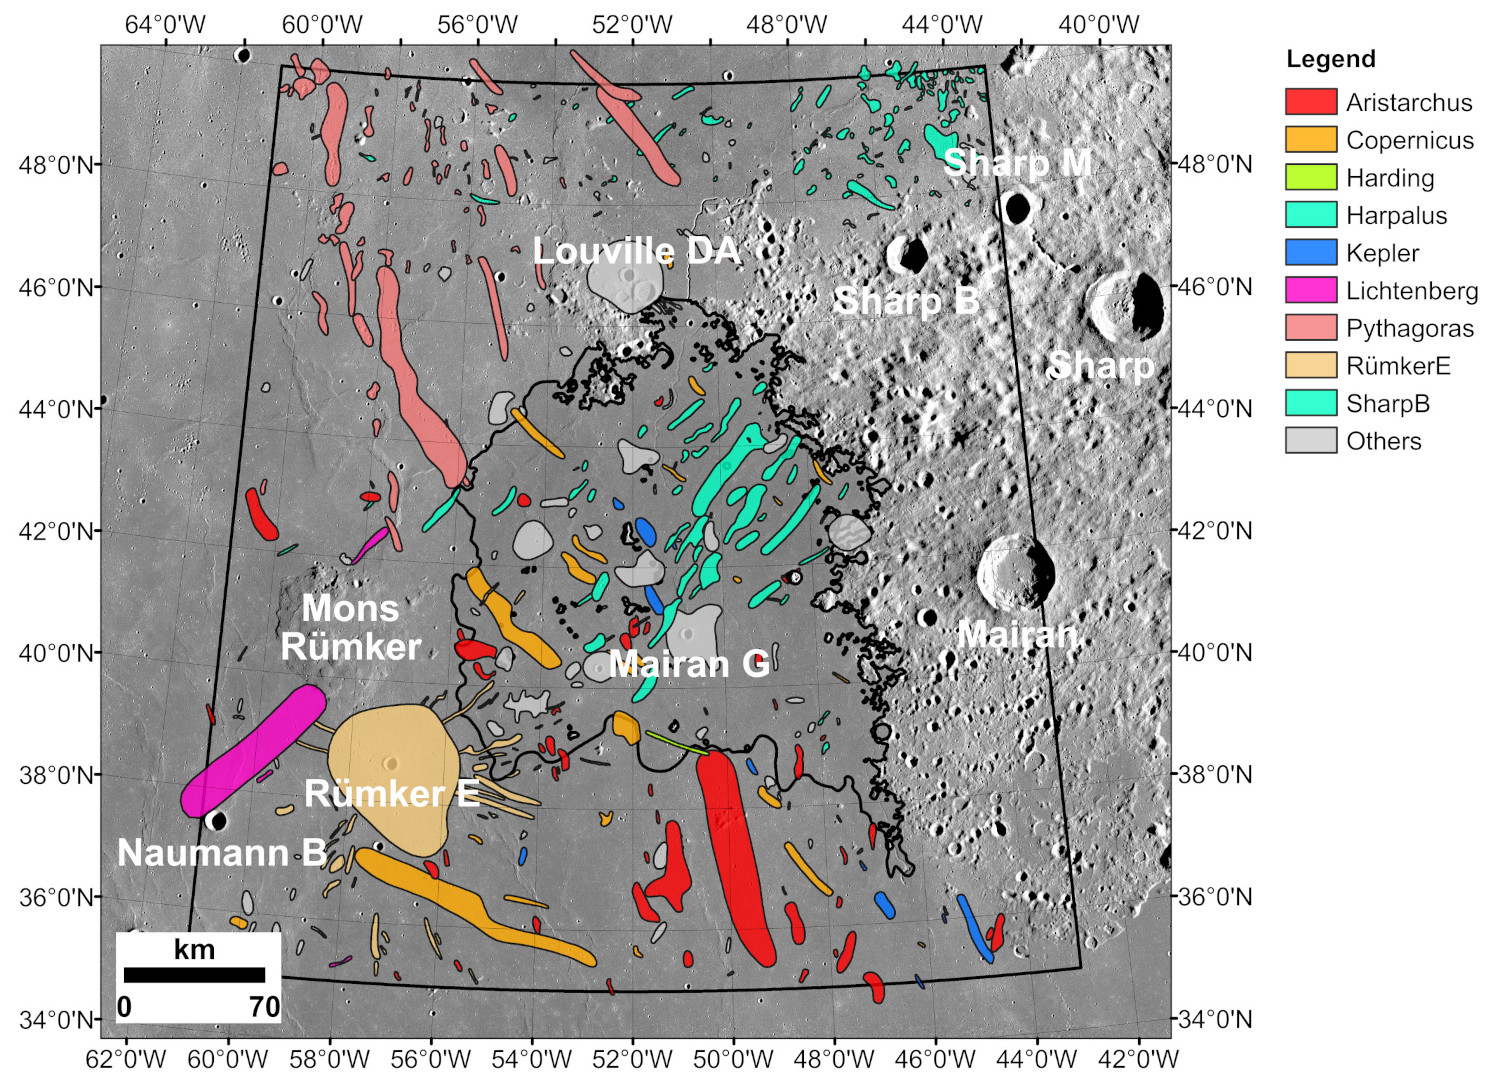
Figure 1. Ejecta distribution of major source craters in the Northern Oceanus Procellarum
Discussion & Conclusion
In addition to exotic materials delivered by the distal impacts (e.g., Harpalus, Copernicus, and Aristarchus), three other types of exotic materials have high scientific significance. The first one is exotic components from subjacent and adjacent highlands by lateral mixing [8], the second type of exotic components may originate from silica-rich domes, and the third one from the meteorites. However, the overall composition of the lunar regolith are from the local (~91%) mare basalts erupted by Rima Sharp (Qian et al., 2021b) with foreign materials from mainly Harpalus, Copernicus, and Aristarchus craters (Qian et al., 2021c). All of the local and exotic materials can be used to answer at least some of the scientific questions listed by Qian et al. (2021c) to deepen our understanding of the Moon.
References
[1] Hiesinger, et al. (2011) Spec. Pap. Geol. Soc. Am., 477, 1–51.
[2] Qian, et al. (2021) EPSL, 555, 116702.
[3] Xie, et al. (2020) JGR-P, 125, e2019JE006112.
[4] Qian, et al. (2018) JGR-P, 123, 1407–1430.
[5] Qian, et al. (2021) EPSL, 561, 116855.
[6] Huang, et al. (2018) JGR-P, 123, 1684–1700.
[7] Costello, et al. (2018) Icarus, 314, 327–344.
[8] Liu, et al. (2021) GRL, 48, e2021GL092434.
[9] Qian, et al. (2021) GRL, 48, e2021GL092663.
How to cite: Qian, Y., Xiao, L., Head, J., van der Bogert, C., and Hiesinger, H.: The Exotic Materials at the Chang’e-5 Landing Site, Europlanet Science Congress 2021, online, 13–24 Sep 2021, EPSC2021-447, https://doi.org/10.5194/epsc2021-447, 2021.
1. Introduction
Numerous large impacts during the early bombardment period resulted in a globally fragmented crust known as lunar megaregolith (Hartmann 2019). Understanding how megaregolith evolved from an initially intact crust is important for the thermal and magmatic evolution of the Moon (Jaeger et al., 2007; Melosh, 2011; Warren & Rasmussen, 1987) and interpretations of lunar samples. In this study, we developed a spatial-resolved numerical model of the formation of the lunar megaregolith characterized by a size-frequency distribution of fragments generated by a continuous impactor flux.
2. Model
2.1 Crater distribution
We use the typical “accretion tail” model of early intense bombardment to calculate the crater distribution (Neukum 1989). The considered minimum crater diameter is assumed to be the diameter of saturated craters of the lunar highlands (>20 km; Head et al 2010) where 100% of the surface is covered by craters larger than this size. Thirty basin-forming events with a model age after Orgel et al. (2018) are included in our simulations.
2.2 Fragment size distribution of individual impacts
2.2.1 Fragment size in ejecta
The size distribution of fragments in ejected materials is simulated by assuming that the distal ejecta deposits contain smaller fragments while ensuring the ejecta thickness, H(r), follows the power-law according to Pike (1974), H(r)=0.033Rt(r/Rt)-3, where r is the distance from the crater center, and Rt is the radius of transient crater diameter.
Crater ejecta deposits are composed of rock fragments of various sizes. The cumulative number N(m) of fragments of mass equal to or greater than mass m is (Melosh 1989): N(m) = C1m-b, where C1 is a constant. The value of b depends upon the fragmentation process, and for multiple fragmentations, b near 1.0 (Melosh 1989; Buhl et al. 2014). The largest fragments are usually near the crater rim. The relation between maximum block size lE and crater diameter (D) (Moore 1971) is: lE = C2 D2/3, where C2 is constant with a value ranging from 0.1 to 0.3.
2.2.2 Fragment size below the crater
Melosh (1979) proposed the so-called Acoustic Fluidisation model to explain the temporary weakening of rocks during crater formation. The simplified variant, the Block model (Melosh & Ivonov 1999) describes the rheology of temporarily weakened rocks by a Bingham viscosity which depends on the average block size (lB0), the viscosity η, the target density ρ, and the average period of the oscillations T. Acoustic wave can only induce shaking of blocks, resulting in acoustically fluidized behavior, if the oscillation wavelength λ (λ=T×cs, where cs is the speed of sound) is comparable to the lB0. For simplicity we assume lB0 = λ.
η=2πρlB02/T (1)
Since the impact of a large projectile leads to larger blocks and higher viscosity than smaller impactors, Wünnemann et al. (2003) proposed a scale dependency of the viscosity according to linear relationship:
η= γη (cs ρ DP⁄2) (2)
where γ_ηis dimensionless scaling parameter and is assumed to be 0.005 (Martellato et al. 2018). Combining eq. 1 & 2 results in:
lB0=(γη DP)⁄4π
In the Block model the block or fragment size (lB0) is usually taken to be constant through space, and the variations of block sizes concerning the distance from the point of impact are neglected. Based on the well-exposed Upheaval Dome crater, Kenkmann et al. (2006) suggested a linear function of the block size (lB) with the distance from the crater center (rB), where the function slope, C3, is ~0.4. Assuming lB0 to be representative for the fragment size close to the crater floor, the block size distribution beneath the crater with the distance from crater center can then be calculated:
lB=lB0+C3 rB
3. Results
3.1 Formation of megaregolith
Figure 1 presents the globally volume-weighted fragment size distribution with depth at different times. Basin-forming events are the dominant factor generating a global megaregolith layer. After the formation of the youngest basin (3.8 Ga), the big picture of the megaregolith was established. In the later period (e.g., 3.7 Ga; black dots in Figure 1), the smaller-scale impacts were predominant and could not significantly alter the megaregolith structure anymore. The generated megaregolith displays two distinct layers: an Upper Megaregolith that mainly consists of ejected fragments with smaller size and a thickness of ~2.5 km; a Lower Megaregolith that mainly consists of autochthonous fragments with a thickness of more than 10s of kilometers. The obtained structure of the megaregolith is consistent with both the lunar seismic and gravity observations.
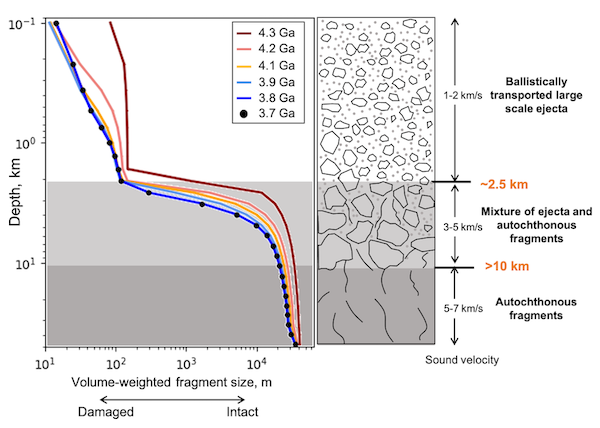
Figure 1 Formation and structure of the megaregolith.
3.2 Presence of SPA ejecta boulders
When the South Pole-Aitken (SPA) was formed, its excavated fragments distributed over the global surface. These fragments suffered further fragmentation altering their size and spatial distribution. When the structure of the megaregolith was formed (3.8 Ga), the majority of the SPA ejecta fragments became very small. Due to subsequent space weathering, almost no boulders < 50 m can survive for 3.8 Ga (Basilevsky et al. 2013). We estimated the distribution of the >50 m SPA ejected fragments in the near-surface shown in Figure 2. Less than 5% of SPA ejected boulders could have survived until the present day and the majority of the survival is distributed near the rim of young and large impact craters.
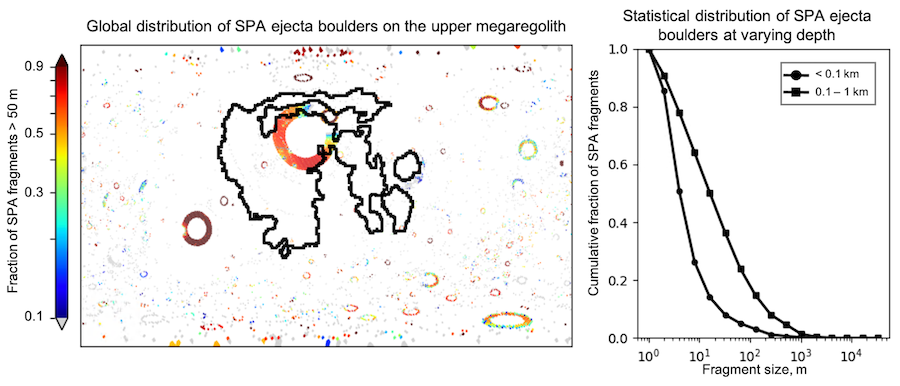
Figure 2 Distribution of SPA ejecta boulders when the megaregolith was formed.
4. Conclusions
A spatial-resolved numerical model was developed to investigate the cumulative fragmentation process on the moon aiming at a quantitative description of the formation of megaregolith. We found that after the cessation time of basin-forming events, the structure of megaregolith was established. The megaregolith possesses a distinct two-layer structure: a more fragmented Upper megaregolith ~2.5 km in thickness that mainly consists of the ejected fragments and a Lower megaregolith >10 km in thickness that mainly consists of autochthonous fragments. The simulation results also suggest that most of the ancient impact fragments, such as boulders ejected upon formation of SPA, cannot survive until the present day.
How to cite: Liu, T. and Wünnemann, K.: Formation of lunar megaregolith: the preservation of ancient impact boulders, Europlanet Science Congress 2021, online, 13–24 Sep 2021, EPSC2021-166, https://doi.org/10.5194/epsc2021-166, 2021.
Introduction
The data collected during the Apollo missions played a decisive role in shaping our knowledge of the Moon and its geological features. Up until today this data collection helps us to understand the ongoing processes occurring on the Moon and throughout the Solar system. The method of gaining absolute model ages (AMAs) of unsampled surfaces through crater size-frequency distribution (CSFD) measurements using the lunar cratering chronology was one of the many innovations of these missions. Recent improvements in the remote sensing data have helped to establish more accurate methods to further comprehend the processes on the Moon, as well as to test previously used methodology.
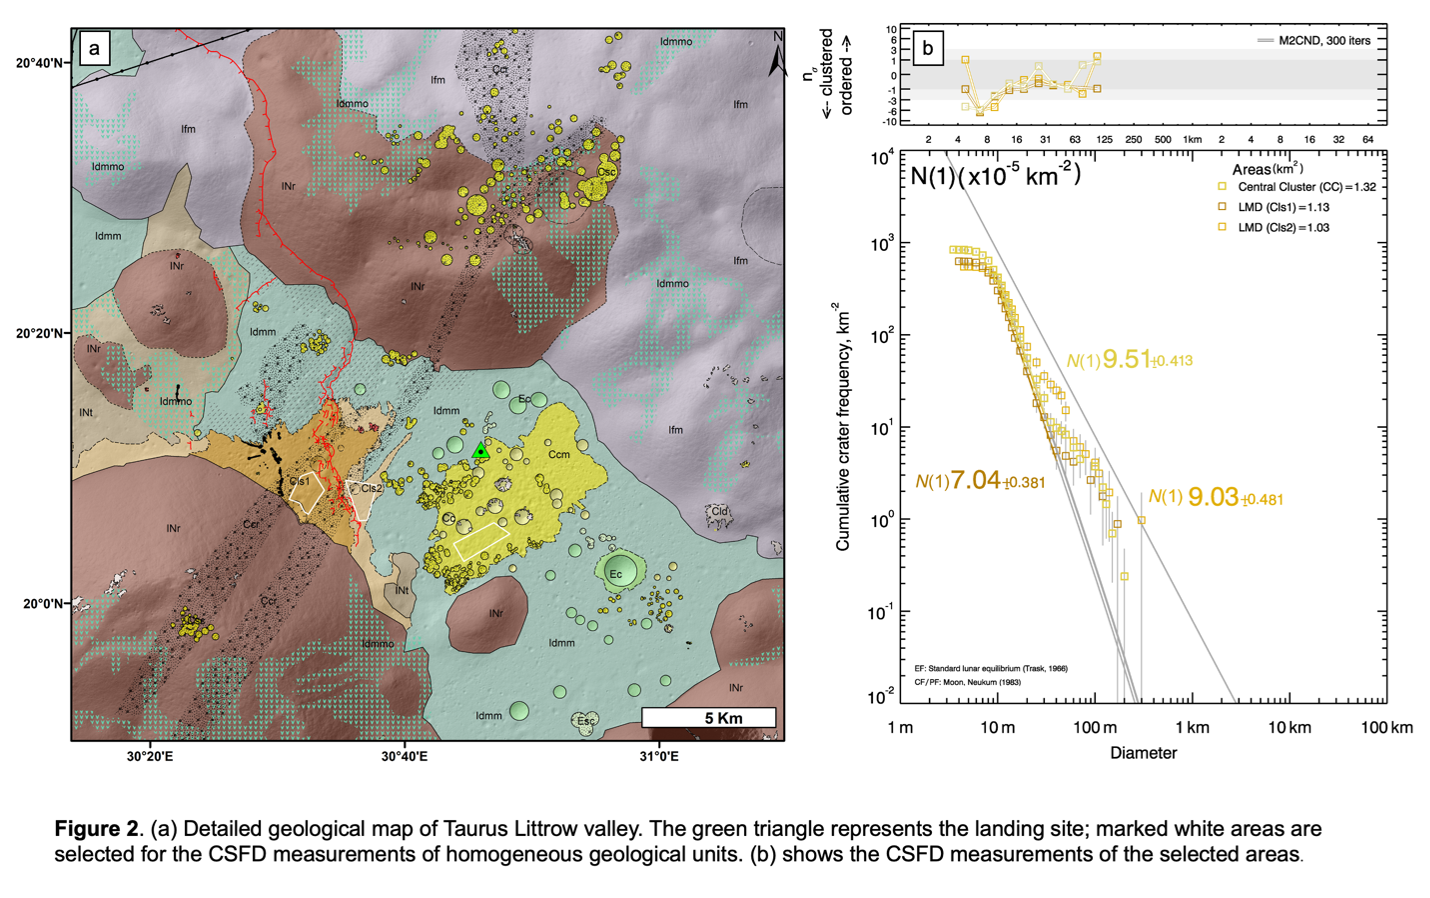
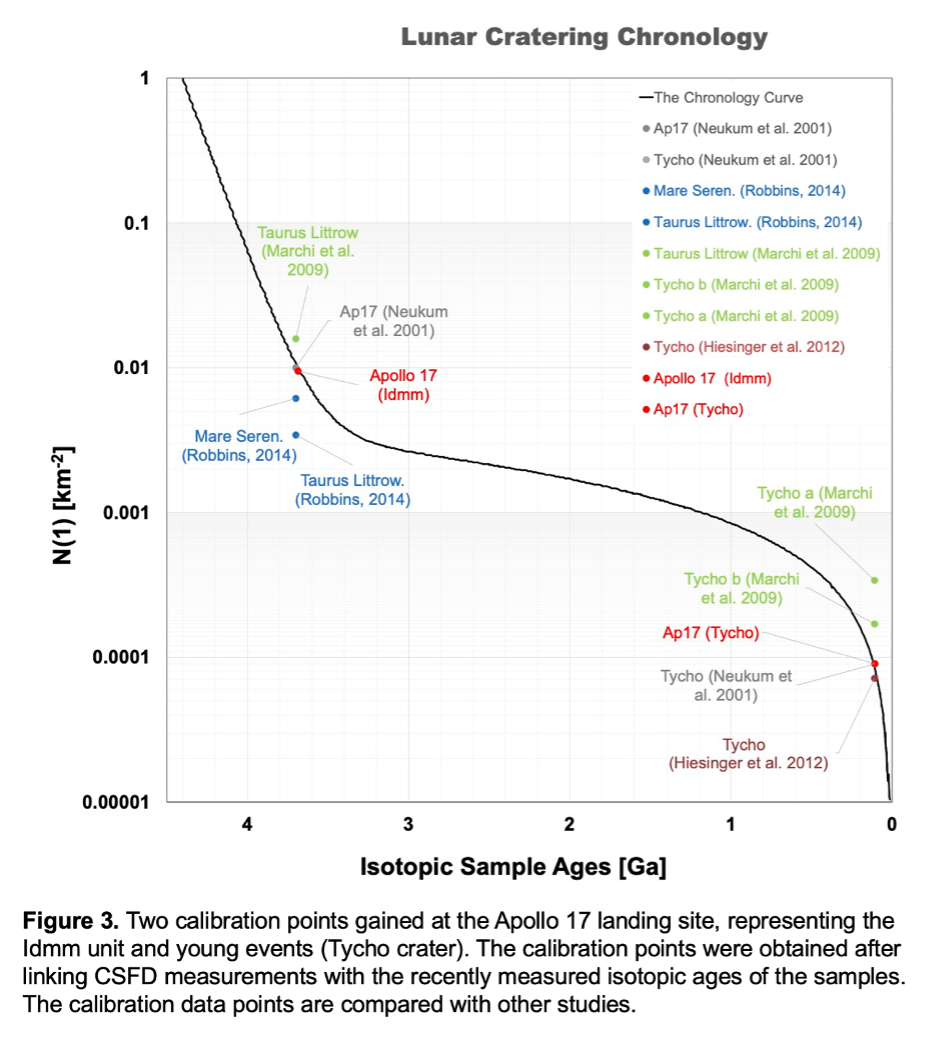
We conducted a series of studies [1-4] to test the validity of the commonly used lunar cratering chronology function [5]. The studies used recent available data to create detailed geological maps and CSFD measurements, which later were correlated with most recently measured sample ages.
Methodology
Lunar Reconnaissance Orbiter Cameras (LROC) Wide Angle (WAC, ~100m/px) and Narrow Angle (NAC, ~0.5m/px) data with incidence angles between 55-80° [6], and SELENE (Kaguya) morning, evening, ortho-image (~10 m/px) data were used to identify albedo variations. Merged LOLA/SELENE (~60 m/px) [7] and NAC-derived digital terrain models (DEMs) (~2.5 m/px) [8] were used to define morphological differences, whereas Clementine [9], Chandrayann-1 Moon Mineralogy Mapper (M3) [10] and Kaguya Multiband Imager (MI) [11] defined spectral variations. CraterTools [12] was used in ArcGIS for the CSFD measurements, and CraterStats [13] was used to plot the CSFDs. Randomness Analysis [14] was used to avoid secondary crater chains and clusters.
For geological mapping we relied on Federal Geographic Data Committee (2006) [15] standards for the symbology, and Gazetteer of Planetary Nomenclature (1999) [16] regarding the nomenclature. Meanwhile, stratigraphic units were identified using the stratigraphic scheme of Wilhelms (1987) [17].
Testing the Lunar Chronology Function
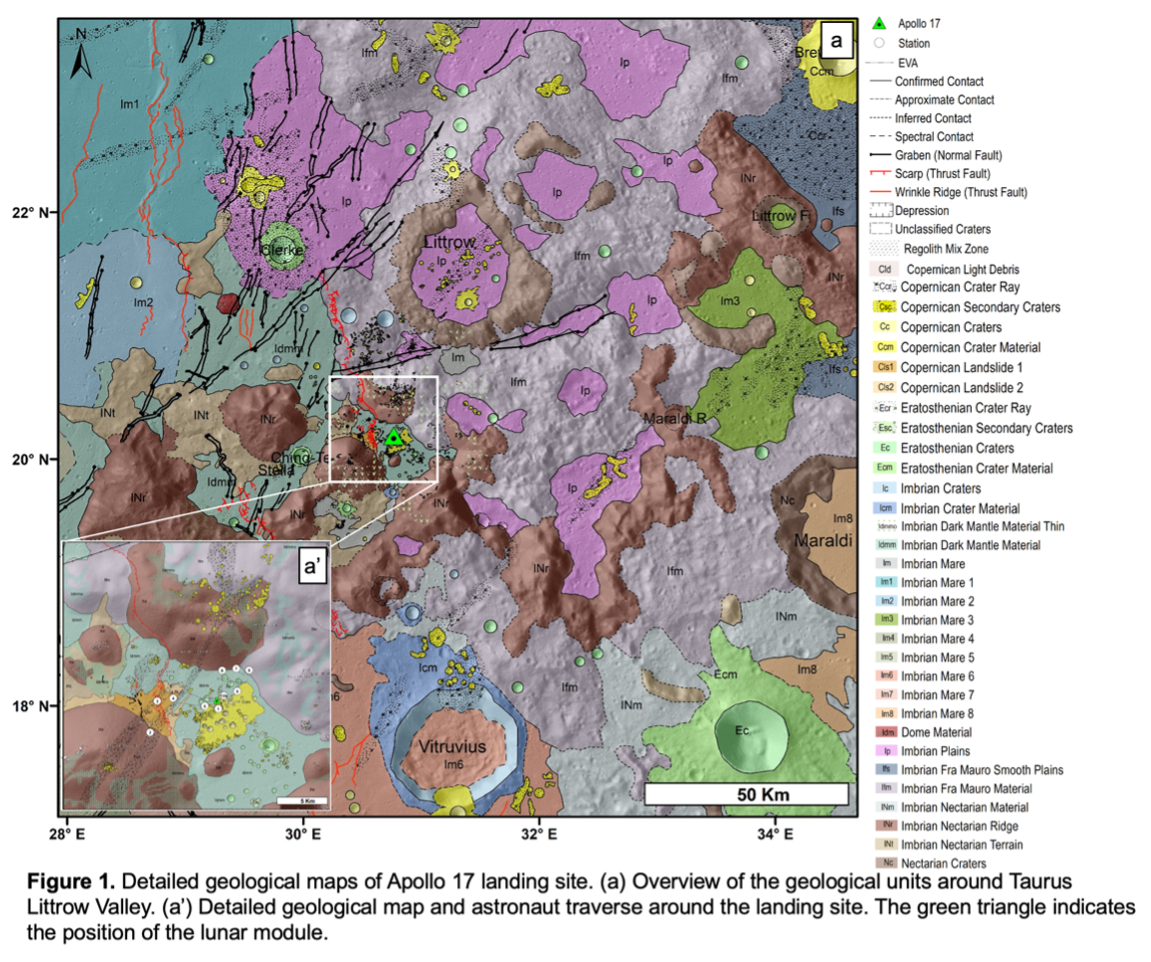
In our series of studies [1-4] we produced several detailed geological maps (e.g., Figure 1) of the Apollo landing sites, which were eventually used to measure CSFDs (e.g., Figure 2) on the defined geologically homogeneous areas. The gained N(1) (cumulative number of the craters ≥1 km in diameter) values were linked with the recently measured isotopic ages of the Apollo samples. The gained calibration points were used to test the calibration of the lunar cratering chronology [5] (Figure 3). The extrapolation of the tested lunar cratering chronology function is used to derive absolute model ages (AMAs) of the unsampled surfaces, which enables us to understand the evolution and ongoing processes of other terrestrial bodies in the solar system.
Other Implications
Our detailed geological maps provide advanced perspectives on the relationship of the samples and the remotely sensed compositional and morphological differences. Therefore, our studies are being used to investigate the exact origin of the collected samples [18].
Furthermore, our studies provide a comprehensive view on the scientific goals behind the landing site selection. Therefore, these studies can be used to assess future landing sites for the demonstration of in situ resource utilization (ISRU) missions [19].
Newly prepared comprehensive geological maps and carefully measured CSFDs will provide key domain knowledge for the development of tools to perform automatic detection of various features (e.g., craters). Such a tool will be integrated into the multi temporal data base (MUTED) [20], which will be able to show temporal differences on the planetary bodies instantaneously. In future, this tool will aid the interpretation of geological processes and help determining AMAs of planetary surfaces, while reducing cognitive bias and systematic errors.
Acknowledgements
WI, TH and NS were funded by German Aerospace Center (Deutsches Zentrum für Luft- und Raumfahrt) Grant #50OO2102. HH was funded by the German Research Foundation (Deutsche Forschungsgemeinschaft SFB-TRR170, subproject A2) and CvdB was supported by EU H2020 project #776276, PLANMAP.
References
[1] Iqbal et al. (2019) Icarus 333, 528-547. [2] Iqbal et al. (2020) Icarus 3352, 113991. [3] Iqbal et al. (2019) LPSC 50, 1005. [4] Iqbal et al (2020) LPSC 49, 1073. [5] Neukum (1983) NASA TM-77558 [6] Robinson et al (2010) Space Sci. Rev. 150, 81-124. [7] Barker et al. (2016) Icarus 273, 346-355. [8] Henriksen, et al. (2017) Icarus 283, 122-137. [9] Pieters et al. (1994) Science 266, 1844-1848. [10] Isaacsom, et al. (2013). JGR Planets. 118, 369-381. [11] Ohtake et al (2013) Icarus 226, 364-374. [12] Kneissl et al. (2011). PSS 59, 1243-1254. [13] Michael et al. (2016) Icarus 277, 279-285. [14] Michael et al. (2012) Icarus 218, 169-177. [15] FGDC (2006). FGDC-STD- 013-2016. [16] Blue, J. (1999) Gazette. of Planet. Nomen. USGS. [17] Wilhelms, (1987) USGS Prof paper: 1348.[18] Haber, et al (2018) AGU, P31G- 3785. [19] van der Bogert, et al. (2020) LPSC 51, 1876. [20] Heyer et al. (2021) LPSC 52, 1124.
How to cite: Iqbal, W., Hiesinger, H., van der Bogert, C., Heyer, T., and Schmedemann, N.: New Geological Studies and Crater Size-Frequency Distributions of Apollo Landing Sites and their Future Implications., Europlanet Science Congress 2021, online, 13–24 Sep 2021, EPSC2021-634, https://doi.org/10.5194/epsc2021-634, 2021.
Introduction: The exploration of the Moon has nowadays gathered a new interest for many scientific purposes [1]. In particular, the detection of lava tubes reveals important for the identification of favorable environments for human activities [2]. Recently, the potentialities of a Ground Penetrating Radar (GPR) for the detection of buried lava tubes on the Moon have been evaluated by different authors, either from ground-based observations (e.g., [3], [4], [5]) or from orbit [6].
Here, an evaluation of the detection potentiality by means of a GPR on small-scale lava tubes is performed, taking into account different frequencies, dielectric properties and lava tube dimensions.
Methodology: A semi-elliptic lava tube geometry is considered, having the horizontal semiaxis () longer than the vertical one (), and placed at a depth d. The dielectric properties of lunar subsoil have been taken from [7] and [8]. The two frequencies of the Lunar Penetrating Radar onboard the Chang’e-3 mission (60 and 500 MHz) have been studied. The parameter space considered in this analysis is reported in Table 1.
|
Parameter |
Values |
|
|
Geometric scenario (m) |
1 |
2 |
|
a = 8, b = 5, d = 15 |
a = 13, b = 8, d = 18 |
|
|
Dielectric scenario |
1 |
2 |
|
[7] εr = 3.00 + 0.03i εb = 5.74 + 0.0805i |
[8] εr = 3.52 + 0.0176i εb = 7.12 + 0.0486i |
|
|
Frequency |
60 MHz |
500 MHz |
Table 1. Parameter space considered for the simulations.
The basaltic lava flow is covered by a 8 m thick regolith layer [7]. A 2 m thick blocky layer is also present above the lava flow, comprising blocks having dimensions up to 1 m. The complex permittivity of the basalt (εb) has been evaluated from the one of the regolith (εr), considering an inverse Bruggeman mixing rule and a porosity of 0.45 [7]. Figure 1 shows the geometry considered for the simulations. Note that, a rough surface has been considered for the lava flow top, and for lava tubes ceil and floor.
Fig. 1. Sketch of the studied subsurface geology.
GPR cross-sections simulations: To simulate a GPR signal propagation in a lunar subsoil, the finite-difference time-domain (FDTD) code developed by [9] is used. The code is capable to study the propagation of a synthetic radar wave considering the most relevant parameters, i.e., the dielectric properties of subsoil (expressed in terms of permittivity and conductivity), and the antenna parameters (central frequency and antenna separation). Regarding the antenna separation, the values of 0.8 m and 0.26 m have been considered for the 60 and 500 MHz antennae, respectively, taking into account the values of [10] for the Lunar Penetrating Radar onboard the Chang’e-3 mission. The mesh has been built in order to be adequate to the wavelength considered for each run.
Results: Figures 2-4 show the radar cross-sections emerging from the simulations in the dielectric scenario 2 [8], and considering the two frequencies and the different lava tube geometries. In Fig. 2, the main reflectors are also highlighted to help the interpretation of radar cross-sections. In all the studied cases, the GPR is capable to clearly detect the reflection coming from the lava tube ceil. Regarding the reflection from the floor, this can be poorly identified in the 60 MHz cross-sections. Note that, even if not reported, results for dielectric scenario 1 are similar to the ones shown.
Fig. 2. Radar cross-section for geometric scenario 1, dielectric scenario 2, and a 60 MHz antenna.
Fig. 3. Radar cross-section for geometric scenario 1, dielectric scenario 2, and a 500 MHz antenna.
Fig. 4. Radar cross-section for geometric scenario 2, dielectric scenario 2, and a 60 MHz antenna.
Fig. 5. Radar cross-section for geometric scenario 2, dielectric scenario 2, and a 500 MHz antenna.
Acknowledgement: We acknowledge support from the research project: “Moon multisEnsor and LabOratory Data analYsis (MELODY)”, selected in November 2020 in the framework of the PrIN INAF (RIC) 2019 call.
References: [1] Crawford I. A. (2015) Prog. Phys. Geogr., 39(2), 137–167. [2] Hörz F. (1985) in Lunar Bases and Space Activities of the 21st Century, 405–412. [3] Esmaeili S. et al. (2020) J. Geophys. Res. Planets, 125(5), e2019JE006138. [4] Miyamoto H. et al. (2002) Japan: Lunar and Planetary Science XXXIII, 1482. [5] Bringeland S. and Braun A. (2021) Lunar and Planetary Science Conference, 2548. [6] Carrer L. et al. (2018) Planet. Space Sci., 152, 1-17. [7] Fa W. et al. (2015) Geophys. Res. Lett., 42, 10,179–10,187. [8] Li C. et al. (2020) Sci. Adv., 6(9), eaay6898. [9] Irving J. and Knight R. (2006) Comput. and Geosci., 32(9), 1247–1258. [10] Fang G. Y. et al. (2014) Res. Astron. Astrophys., 14(12), 1607–1622.
How to cite: Di Paolo, F., Mattei, E., Cosciotti, B., Lauro, S., and Pettinelli, E.: Small-scale lava tube detection on the Moon using Ground Penetrating Radar, Europlanet Science Congress 2021, online, 13–24 Sep 2021, EPSC2021-211, https://doi.org/10.5194/epsc2021-211, 2021.
Introduction: Repeated impact events on the Moon are the main drivers of the degradation of the lunar surface. This process, known as topographic diffusion, is the scattering of the regolith which causes the eventual erasure of impact craters due to overlapping and adjacent impactors [1-6]. Visual results of this can be observed by looking at different rates of degradation among lunar south pole complex craters.
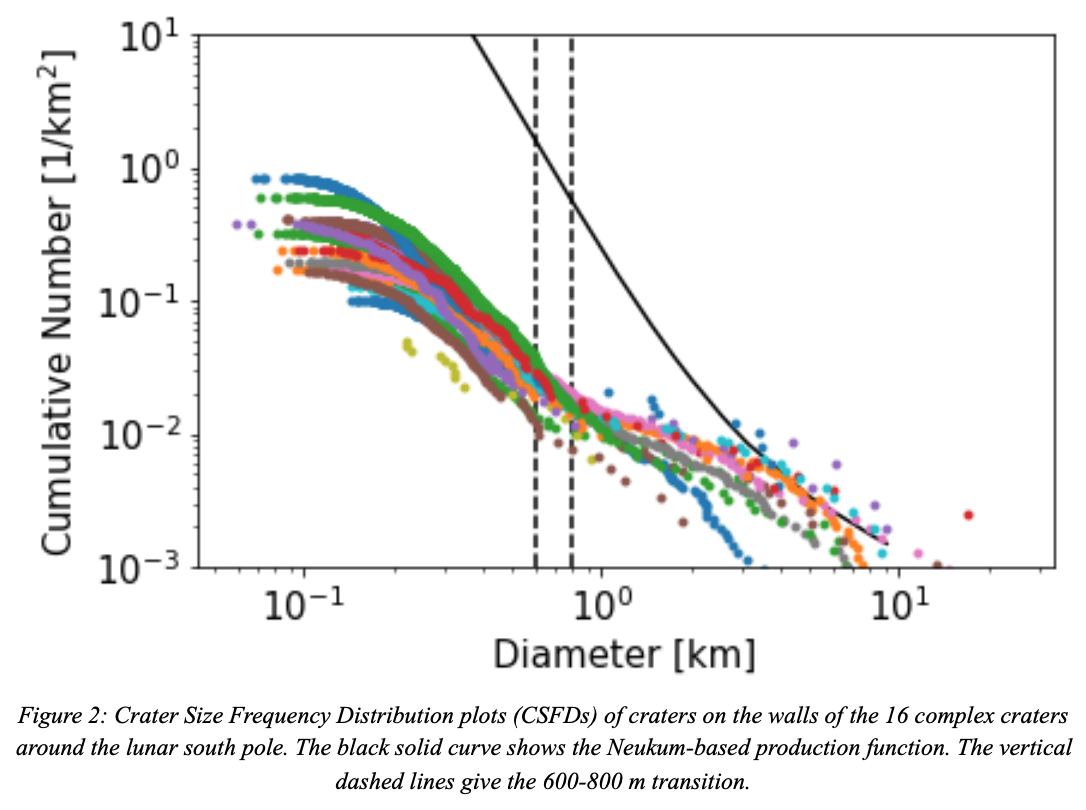
Complex craters exhibit landslide morphologies on their walls over a range of sizes. These events are directly linked to the process of topographic diffusion. Within our study, we analyze 16 complex crater morphologies and degradation states to determine the relative wall strength. We find that there is a crater diameter population transition at 600-800 m with larger populations showing significant reduction. We attribute this finding to the induction of landslide events from larger impactors, while smaller impactors do not have enough energy to do so.
Methods: We first utilize ArcMap 10.7.1 and the CraterTools [7] add in toolset to crater count on the walls of the complex craters. We use available DEM’s from LOLA/LRO data, Hillshade and Slope overlays, Buffer (Analysis) Tool, and Add Surface Information (3D Analyst) Tool. The Hillshade and Slope overlays grant us visibility of the lunar surface down to a 20m/pixel resolution in an otherwise partially permanently shadowed area [8]. For each crater count, we determine the slope conditions for the emplacement by creating a 1-pixel buffer around the rim and calculating the average slope of each overlapping pixel based off of our Slope overlay (Figure 1).
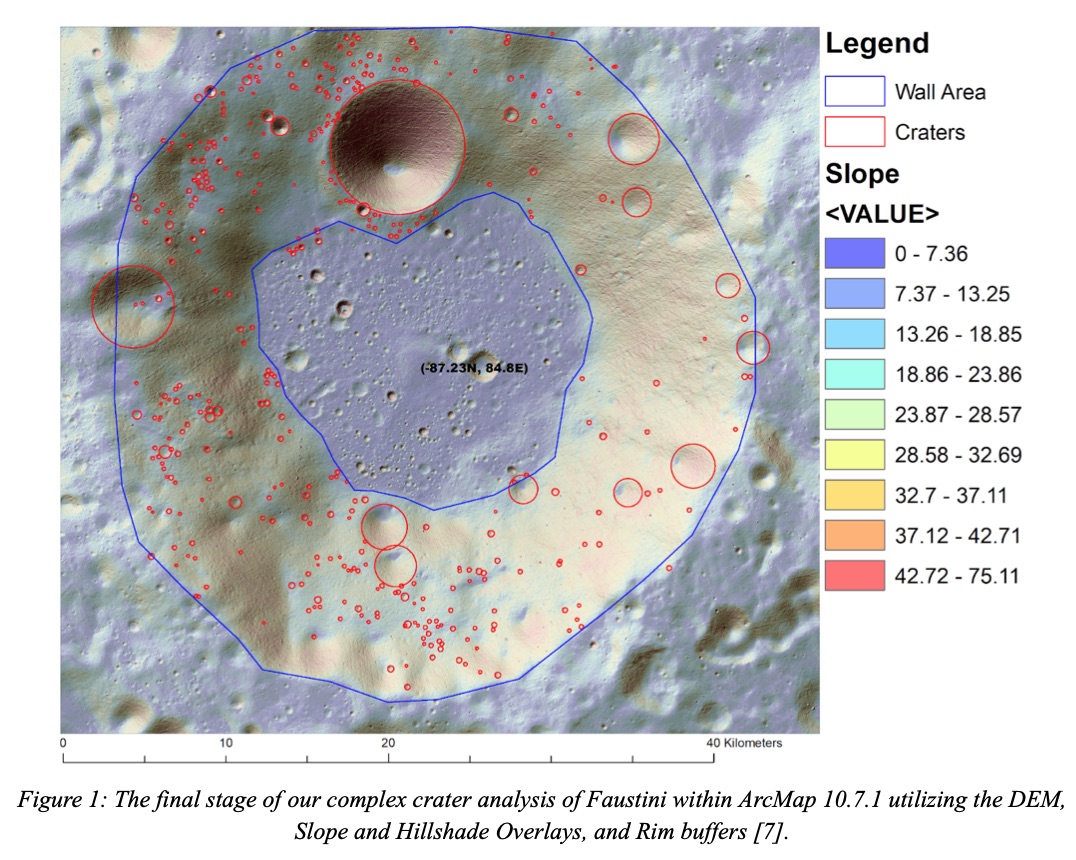
We next apply the π scaling impact-crater scaling relationship, which allows us to relate energy, crater size and material strength (Equation 1) [2].
(1)
where V represents the transient crater volume, mi, ρi, and ai represent the impactor’s mass, density and radius, ρt is the target density, g is the gravity, vi is the impact speed, and μ, K1 and Y are experimentally derived constants of the target material. By relating all of these, we compute the impactor diameter, speed, and bulk density [2].
Results: We created a cumulative size frequency distribution (CSFD) plot (Figure 2) of all of the crater counts across the 16 complex craters and found two distinct slope transitions shown in Figure 2. The results show that the slope power of craters larger than 600-800 m in diameter is much shallower (around -1) than that of the Neukum crater production function (around -3).
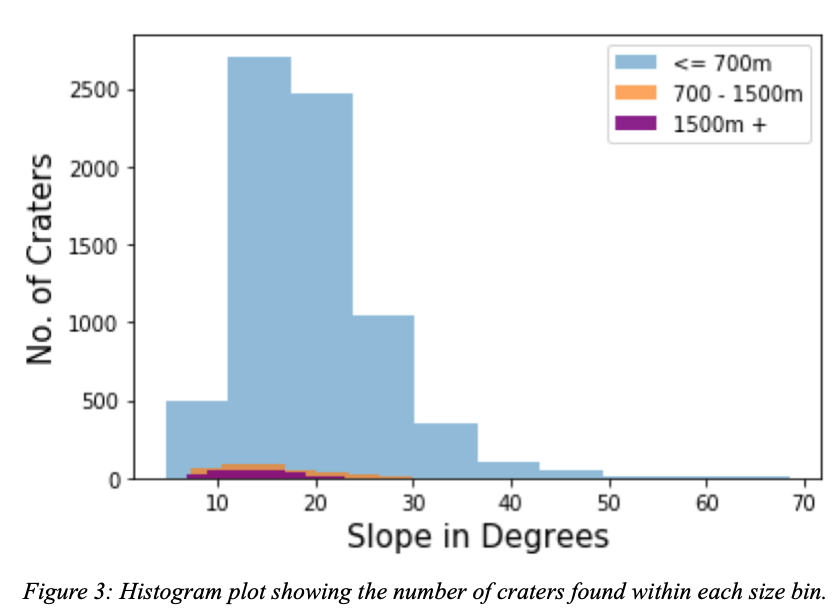
By analyzing crater size distributions in relation to the wall’s slope, we find that the major crater size range is < 700 m. We counted 7251 craters smaller than 700 m in diameter, while the 700-1500 m diameter range has 362, and >1500 m has only 289. This trend can be seen in Figure 3 and exhibits the location dependence on the slope, where smaller craters can be located at higher surface slopes, while larger craters are located at lower surface slopes.
We finally analyze how the crater diameter/impactor diameter ratio depends on the strength when 600-800 m diameter craters induce mass flows that can erase them. Figure 4 exhibits the target strength as a function of the crater size/impactor size ratio, later known as the f ratio. The enclosed region illustrates the strength needed to create crater diameters ~ 600 – 800 m. This area was derived by assuming the impactor speed to be 15 km/sec [9], and the target and impactor densities to be identical. The f ratio ranges to 30~45 within the gravity regime. The red line in the figure denotes the 1 MPa line, indicating the transition between the strength and gravity regimes. If the strength is less than 1 MPa, the crater formation is within the gravity regime. The final morphology and characteristics are driven by gravity. If the strength is greater than 1 MPa, the crater formation is within the strength regime, and the final morphology of the crater is impacted by the strength of the target surface.
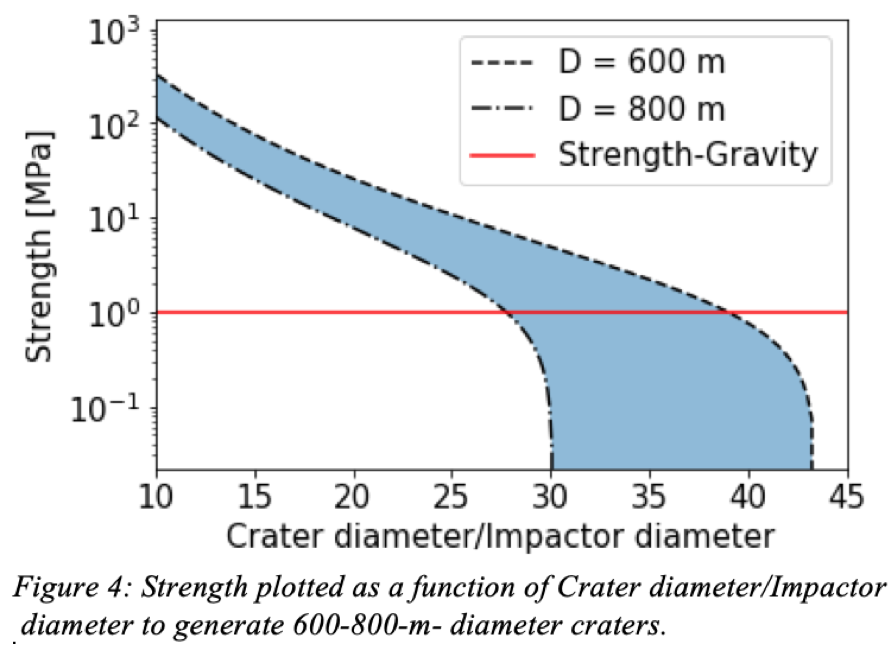
Discussions: We hypothesize that craters larger than 600 – 800 m in diameters experienced landslides and were filled with flowed materials. If this is the case, the surrounding walls should fail structurally. The absence of crater diameters > 600 – 800 m implies landslide events with a thickness of ~180 – 240 m (the transient crater diameters of the craters 600 - 800 m in diameter). The necessary (shear) strength that inhibits this event can be derived from ρghsinθ where ρ = 3000 kg/m3, g is the gravity of the Moon, h is the height at 140-240 m and θ is the slope angle at 30°, which is an upper threshold of the existence of craters larger than 600 – 800 m in diameter, giving a necessary strength of ~0.5-0.7 MPa. Comparing this with Figure 4 leads to the gravity regime of impact processes, implying that the walls are structurally weakened due to the emplacement of the host crater and subsequent smaller impacts. This weakening process likely changes the f ratio, meaning that the surface material property changes the impactor/crater relationship overtime, giving a caution to examine the crater size [10].
Acknowledgements: CLT thanks the Department of Geosciences at Auburn University for their support. Part of this research was completed using LOLA data from the PDS Geosciences Node at WUSTL.
References: [1] Gault (1970), Radio Science 5, 273-291, [2] Richardson (2009), Icarus 204, 172-190, [3] Fassett and Thomson (2014), J. Geophys. Res. Planets, 119, 2255-2271, [4] Minton (2015), Icarus 247, 172-190, [5] Hirabayashi (2017), Icarus 289, 63-87, [6] Minton et al. (2019), Icarus 289, 134-143, [7] Kneissl et al., (2011), [8] Riris et al., (2010), ICSO, [9] Johnson et al., (2016), Icarus 271, 350-259, [10] Holsapple (1993), Annu. Rev. Earth Planet. Sci. 21, 333-337.
How to cite: Talkington, C. L., Hirabayashi, M., Montalvo, P., and King Jr., D.: The absence of crater populations larger than 600-800 m in diameter on the walls of lunar complex craters, Europlanet Science Congress 2021, online, 13–24 Sep 2021, EPSC2021-321, https://doi.org/10.5194/epsc2021-321, 2021.
Introduction: Lunar south polar permanently shadowed regions (PSRs) are known to host water ice [e.g., 1-6]. Moreover, water ice may be widely distributed in micro cold traps [7]. Lunar water transport processes include material mixing [13,14,17] and thermal processes [e.g., 8,9], which leads them to thermally stable regions [e.g., 10-12]. Because PSRs temperatures <110 K, water ice may cold trap, accumulate, and later mixed in the top layer. Impact mixing may have re-distributed water ice in PSRs [13,14,16,17]. Applying this technique constrains the lateral and vertical distribution of water ice in PSRs [13-16]. Water ice is one of key scientific and resource targets on the Moon. The Volatile Investigating Polar Exploration Rover (VIPER) aims to sample volatiles within the top-meter of the lunar south pole in late 2023. Moreover, the NASA Artemis III mission plans to use these volatiles (e.g., water) as in-situ resource utilization (ISRU) for further human exploration. The present study may thus provide valuable information for such ISRU planning, such as sample conditions (e.g., volatile concentrations) and sampling localities within lunar south polar PSRs.
Objectives: Here, our goal is to analyze the spatial distribution of material mixing by impact cratering events in Haworth, Shoemaker and Faustini, where surface water ice resides, and provide water ice deposit thickness and distribution constraints. Such information is valuable for future lunar exploration missions that will sample and use water as a resource.
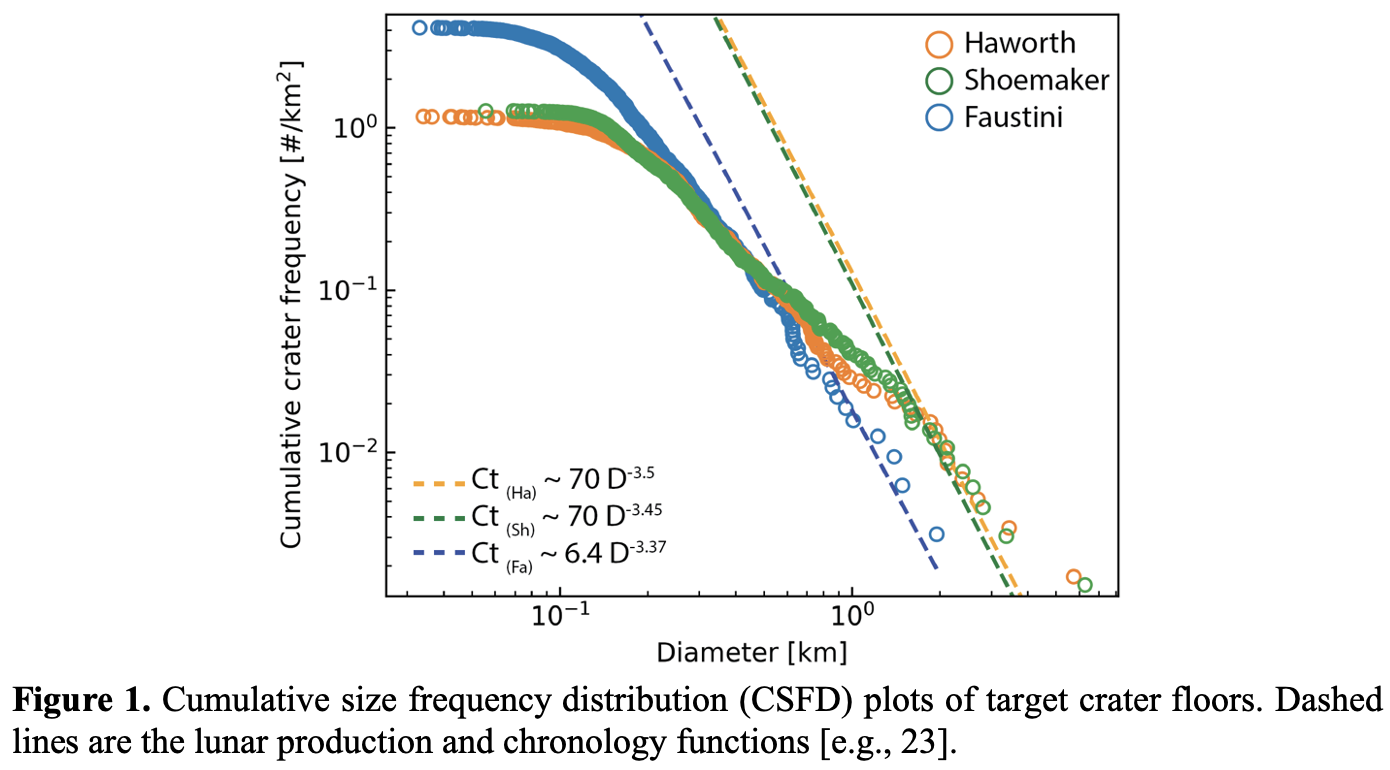
Methods: In this study, we investigate the material mixing depth on the floors of Haworth, Shoemaker and Faustini by obtaining crater distributions and by applying a statistical approach [17]. CraterTools [18] and Lunar Orbiter Laser Altimeter (LOLA) data [19] were used to count craters of diameters larger or equal to 100 m (Fig. 1). Mixing depths were calculated and their lateral distributions were obtained from smaller gridded areas (i.e., 56.25, 25 and 6.25 km2).
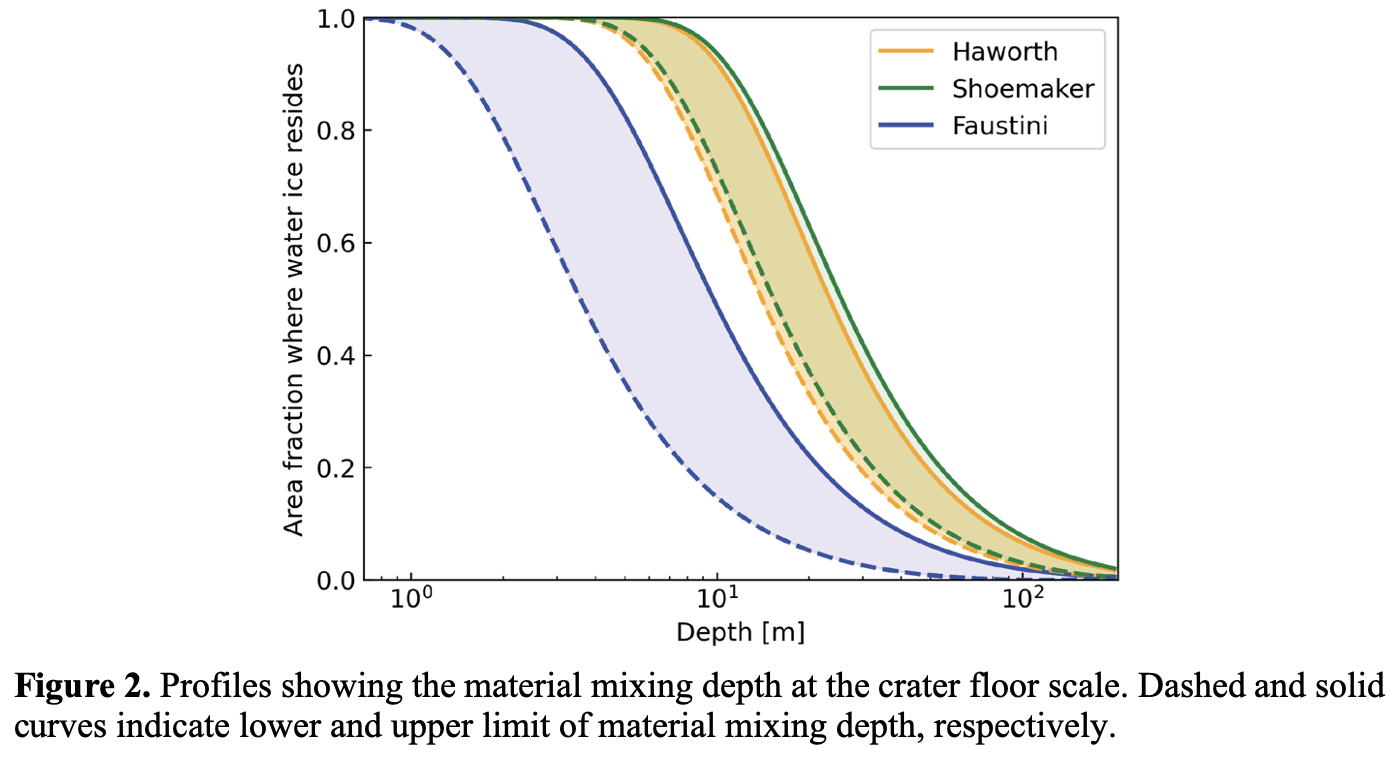
Results: Mixing depth varies between target crater floors and ranges from ~ 0.8 m to ~ 3 m (Fig. 2). Figure 3 shows the upper limit of mixing depth in the defined grids and shows vertical and lateral heterogeneity of material mixing ranging from ~ 7 cm to ~ 13 m. Figure 4 shows the lower limit of mixing depth of the same localities ranging from ~ 4 cm to ~ 7 m. From these maps it is observable that the highest depths are in areas that mostly contain larger craters whereas grids that mostly contain small crater populations show shallower depths, suggesting that the mixing process strongly depends on the crater distribution.
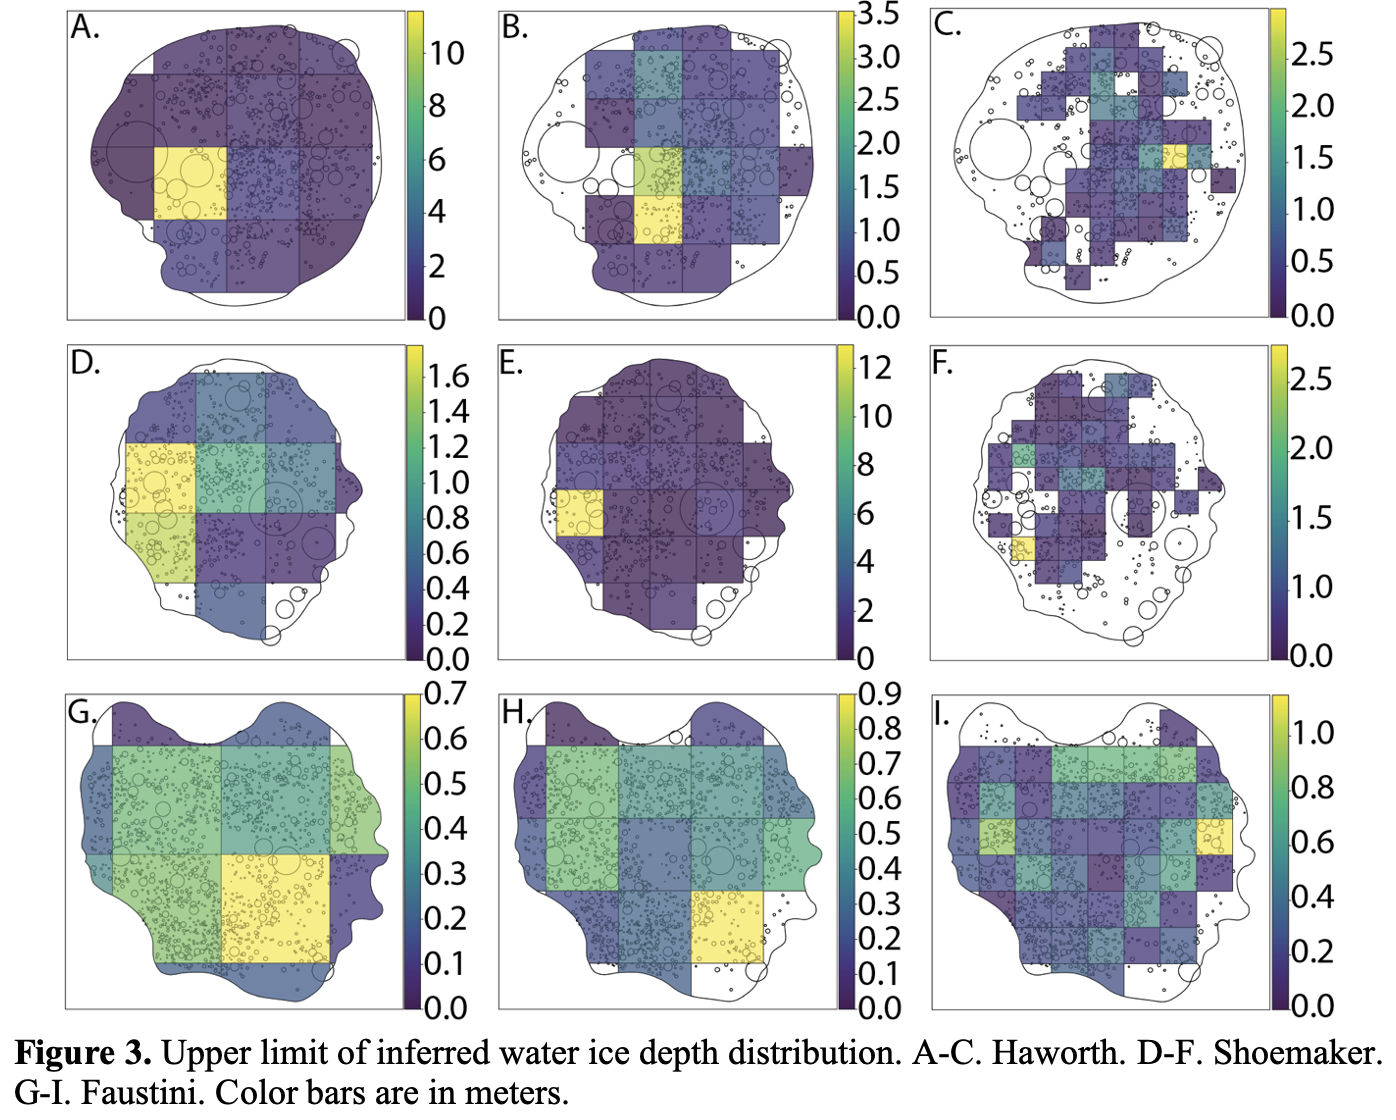
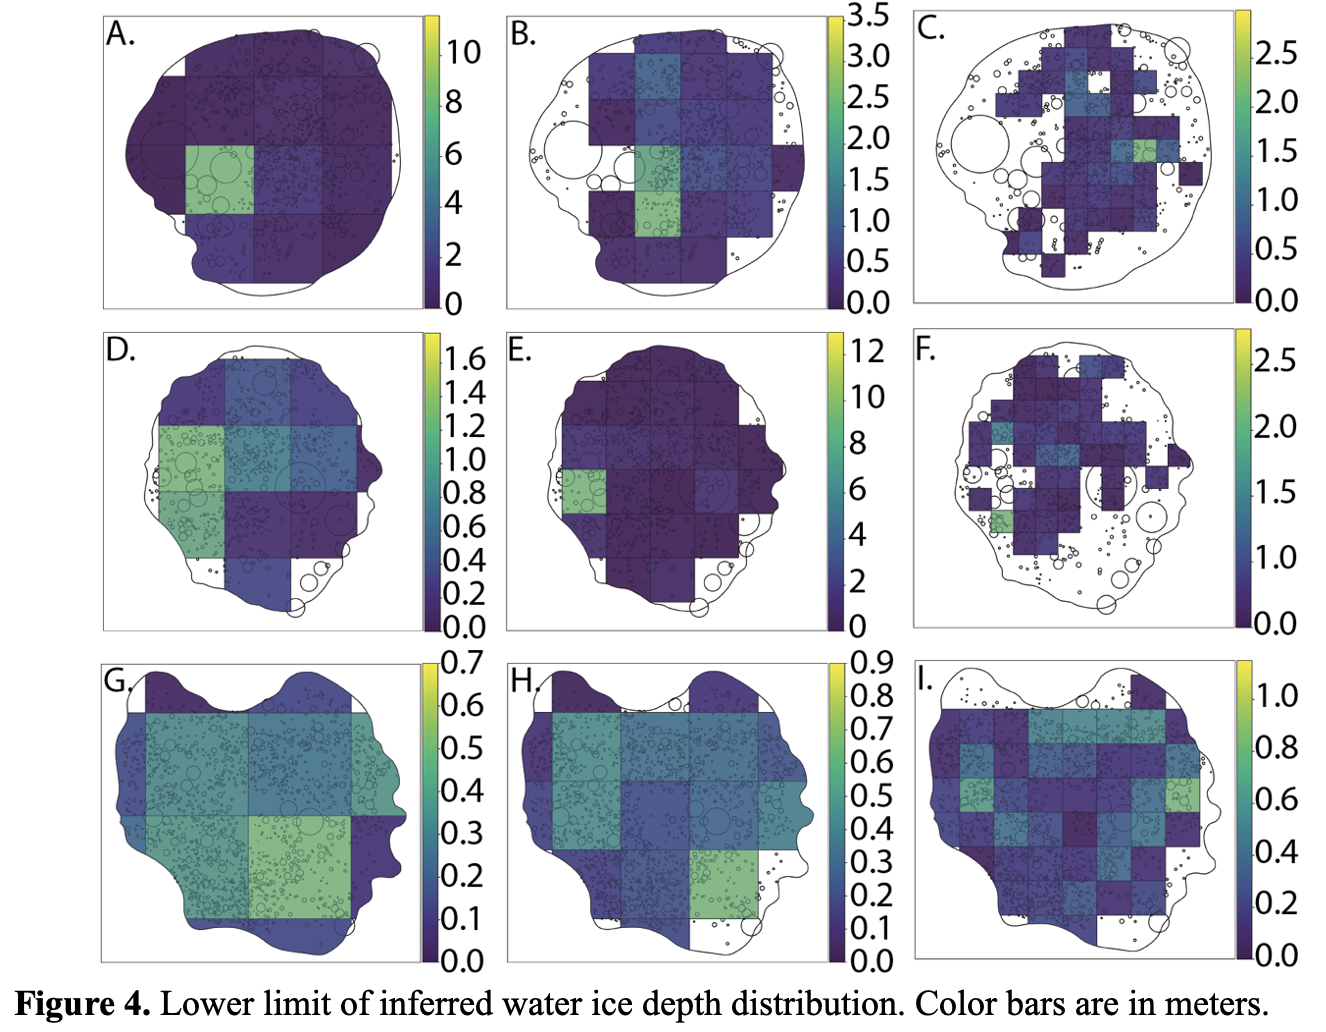
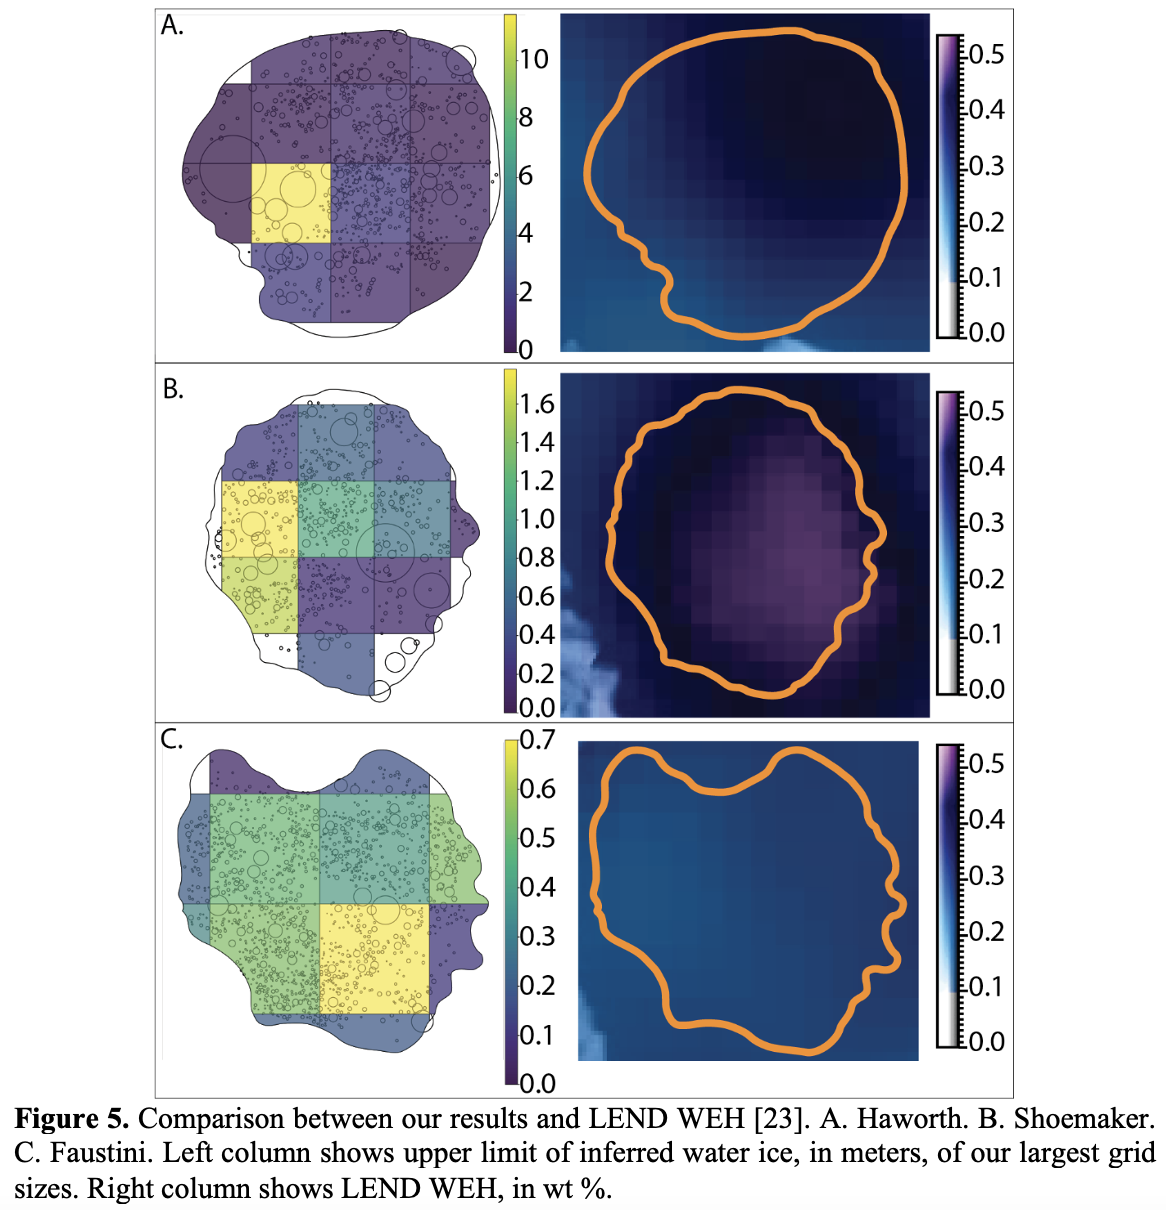
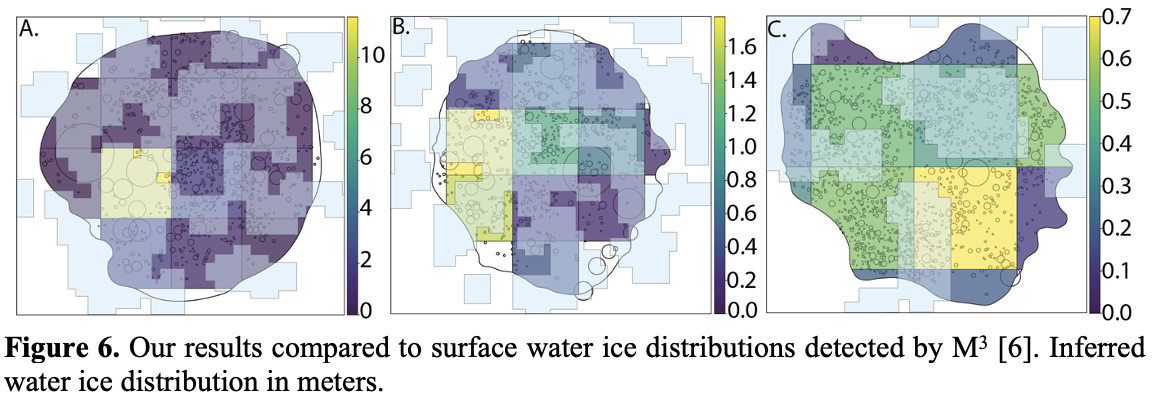
Discussion: From our results, we showed that both water ice mixing depth and concentration depend on the crater distribution and are heterogeneous at the crater floor scale. Water ice is therefore mixed throughout the impact history of these permanently shaded crater floors [20,21]. We find correlations between water equivalent hydrogen (WEH) from Lunar Exploration Neutron Detector (LEND) [23] and our water ice depths (Fig. 5). Both Haworth and Shoemaker show overlapping regions of shallower mixing and high WEH [23]. Faustini shows low WEH [23] possibly due to Malinkin’s ejecta blanket. The mixing process becomes more (less) active when more (less) craters are placed, leading to a higher (lower) material mixing depth and thus low (high) concentration. Our inferred water ice depths do not correlate with surface water ice distributions [6] (Fig. 6); surface ice distributions [6] are observed on large craters in all our target craters. These results imply that impact mixing lowers the surface water ice concentration, inferring short time evolution of water ice and thus recent transport. This is consistent with short timescale processes, such as plasma sputtering, micrometeoroid bombardment, and/or true polar wander, that would cause such short water ice lifetime [22-24].
Acknowledgments: Supported by NASA EPSCoR grant no. 18-EPSCoR R3-0057.
References: [1] Gladstone (2010) Science, 330, 472-476. [2] Hayne et al. (2015) Icarus, 255, 58-69. [3] Mandt et al. (2016) Icarus,273, 114-120. [4] Fisher et al. (2017) Icarus, 292, 74-85. [5] Patterson et al. (2017) Icarus, 283, 2-9. [6] Li et al. (2018) PNAS, 115, 8907-8912. [7] Hayne et al. (2020) Nat Astron. [8] Hayne et al. (2017) JGRP, 122, 2371- 2400. [9] Stopar et al. (2017) Icarus, 298, 34-48. [10] Huang et al. (2017) JGRP, 122, 1158-1180. [11] Moores (2016) JGRP,121,46-60. [12] Prem (2015) Icarus, 255, 148-158. [13] Prem et al. (2018) Icarus, 299, 31-45. [14] Xiao and Werner (2015) JGRP,120, 2277-2292. [15] Hirabayashi et al. (2017) Icarus, 289, 134-143. [16] Costello et al. (2020) JGRP, 125, e2019JE006172. [17] Hirabayashi et al. (2018) JGRP, 123, 527-543. [18] Kneissl et al. (2011) PSS, 59, 1249-1254. [19] Smith et al. (2010) SSR, 150, 209-241. [20] Cannon and Britt (2020) Icarus, 347, 113778. [21] Cannon et al. (2020) GRL 46, e2020GL088920. [22] Farrell et al. (2019) GRL 46, 8680-8688. [23] Sanin et al. (2017) Icarus 283, 20-30. [24] Siegler et al. (2015) Nature 531, 480-484.
How to cite: Montalvo, P. E., Hirabayashi, M., and King Jr., D. T.: Contributions of impact mixing to the spatial distribution of water ice in permanently shadowed lunar south polar complex craters: Haworth, Shoemaker, and Faustini, Europlanet Science Congress 2021, online, 13–24 Sep 2021, EPSC2021-356, https://doi.org/10.5194/epsc2021-356, 2021.
Introduction: The Moon’s bombarded surface acts as a 4 Ga cratering record due to the lack of any significant crustal renewal or erosional processes. This extensive record is analysed by studying the spatial densities of craters on the Moon’s surface across different geological landscapes. These differences in relative cratering densities are quantified and linked to radiometrically dated samples collected during the Apollo and Luna missions. Through all this, one can derive a model age of a cratered surface [1]. This technique is referred to as crater counting. Over the years, this technique has grown to be utilised in dating the surfaces of rocky bodies throughout the solar system [1]. The accuracy of this technique still lies in the ability to detect and measure impact craters. The availability of the Lunar Reconnaissance Orbiter (LRO) Narrow-Angle Camera (NAC) images, with a 0.5-2m/px resolution [2], allows us to see craters at the metre-scale. The leading lunar crater database, consisting of ~1.3 million manually counted craters, is complete down to 1km [3]. To utilise the high-resolution NAC imagery, we need to count ever-smaller craters. The number of smaller craters scale as a power law, meaning there are tens of millions of craters <1km [1]. Machine learning techniques bridges the gap, allowing us to quickly and accurately detect and measure millions of small craters. Our team has developed a Crater Counting Algorithm (CDA), based on a Convolutional Neural Network (CNN), that specialises in impact crater detection. Initially developed for Martian crater counting [4,5], the algorithm has now been adapted to analyse the Moon.
The Crater Counting Algorithm: The CDA is a CNN developed using You Only Look Once version 3 (YOLOv3), a pattern recognition algorithm, as its architecture. YOLO specialises in real-time single-pass object detection over an image, making it perfect for crater detection [6]. The CDA is run using a trained lunar detection model consisting of 25,973 manually marked craters across 188 tiled NAC images (416x416 pixel). These NAC images have incidence angles ranging from 65°-75° (afternoon/morning lighting), producing favourable shadows when identifying craters. The algorithm is run on a directory of input NAC images where it generates a detection output consisting of crater Long/Lat locations and a diameter.
NAC Image Preparation: The NAC images are downloaded in their raw IMG format, where they are georeferenced (a process of linking an images internal coordinate system to a geographical coordinate system) using the USGS’s Integrated Software for Imagers and Spectrometers (ISIS) [7]. ISIS ensures the NAC images have their correct lunar geometry. The images are then exported as GeoTiff files using GDAL, which are used as inputs for the CDA.
Model Evaluation: To evaluate the CDA’s ability in accurate small crater detection (D≤100m), the CDA analysed two ideal NAC images (one of each lunar terrain: highland and mare). Altogether, 4874 Craters within 750m2 subsections of each image, Mare Serenitatis (NAC: M1320016983LE) and Terra Sanitatis (NAC: M1338833866LE), were manually counted to validate against 3852 craters detected by the CDA (Fig. 1). The manual counting included all levels of crater degradation states with a ~5m cut off point. Most size categories boast high True Positive (TP) detection rates (>80%) (Tab. 1). True crater diameters across both terrains were mostly overestimated by the CDA (Tab. 1) but are still within the error margins (±20%) of human manual detections [8]. 18 ‘fresh craters’ (craters with clear and easily identifiable rims), with D≥25m, were chosen across both images (Tab. 1*). The CDA has excellent TP detection rates (100%) and diameter estimations (~±10%) for the fresh craters (Tab. 1*).
Prospects of the Lunar CDA: With further analysis and evaluation of the lunar CDA across broader lunar terrains, we want to create an accurate small crater lunar dataset. This dataset will fill the gap for craters <1km and can be used for fine-scale crater counting chronologies and geological interpretation. Once the process is fully streamlined, we will have the ability to accurately detect millions of small craters across 1000s of NAC images.
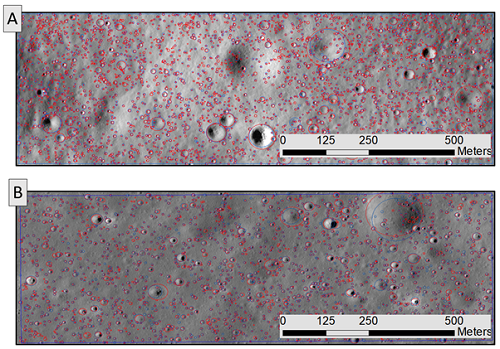
Figure 1: Visual comparison between CDA and manual detection over two 750m2 NAC subsections, manual detections are in red and CDA detections are in blue. Counting was completed across all levels of degradation. A) Highland terrain, Terra Sanitatis (NAC image M1338833866L at 1m/px resolution), counted crater diameter range: 5m-125m; B) Mare terrain, Mare Serenitatis (NAC image M1320016983L at 1m/px resolution), counted crater diameter range: 5m-137m.
Table 1: Confusion matrix of the manual (N=4874) and CDA (N=3852) detections over a 750m2 subsection. A) Highland terrain, Terra Sanitatis (NAC image M1338833866L at 1m/px resolution), counted crater diameter range: 5m-125m; B) Mare terrain, Mare Serenitatis (NAC image M1320016983L at 1m/px resolution), counted crater diameter range: 5m-137m. Note: ‘+’ average diameters indicated the CDA overestimated the true crater diameter, ‘-’ are underestimations.
References: [1] Neukum G., Ivanov B. and Hartmann, W.K. (2001). Chronology and Evolution of Mars, Kluwer. 96, 55–86. https://doi.org/10.1023/A:1011989004263. [2] Robinson, M.S., et al. (2010). Sp. Sci. Rev. 150, 81-124.[3] Robbins, S. J. (2019). Journal of Geophysical Research: Planets. 124, 871– 892. https://doi.org/10.1029/2018JE005592. [4] Lagain, A., et al. (2021). Earth and Space Science. https://doi.org/10.1029/2020EA001598. [5] Benedix, G.K., et al. (2020). Earth and Space Science. https://doi.org/10.1029/2019EA001005. [6] Redmon, J., Farhadi, A. (2018). arXiv :1804.02767. [7] https://isis.astrogeology.usgs.gov/. [8] Robbins, S.J., et al. (2014). Icarus. 234, 109–131. https://doi.org/10.1016/j.icarus.2014.02.022 .
How to cite: Fairweather, J., Lagain, A., Servis, K., Benedix, G., and Bland, P.: High-resolution Automated Crater Detection of Small Lunar Craters on LRO-NAC Images, Europlanet Science Congress 2021, online, 13–24 Sep 2021, EPSC2021-460, https://doi.org/10.5194/epsc2021-460, 2021.
In coordination with ILEWG EuroMoonMars, a number of radio antenna tests have been carried out and analysed for solar observations. The instrument used for this data collection is the radio Jove, connected to a single dipole antenna at a set height. Data is recorded using a software program known as Radio-SkyPipe and the audio from the observations is analysed in person by the operator and recorded using livestreaming platforms for later analysis. Noise is a major factor while trying to operate this device, as such, a quiet location and fine tuning is essential for isolating the favoured frequency range. Solar activity plays a major role in the success of the device. While carrying out solar observations, the sought after transmissions are from solar bursts and flares. These transmissions can be very difficult to capture as a result of low solar activity, up-time of the device and external noise. The device has been tested in a number of locations in Leiden, Netherlands and will be later tested on on lunar volcanic ash analogue in Cratere di Laghetto, in Mount Etna, Catania, Sicily. As a result of observations to date, a solar burst has been isolated for later analysis. In the near future, the device will be used for Jupiter observations. This data will be analysed and compared to data which has been obtained through solar observations in order to see the changes between the two transmissions. We shall learn from this EMM-Etna field tests to prepare the analysis of DLR-ESA ARCHES Etna 2022 tele-robotic campaign that will deploy with rovers an array of 4 radio VLF antennas, among a number of rover science and technical tasks.
Acknowledgements: we thank Chirayu Mohan, Kevin McGrath and Hannah Reilly for their help setting up the device. As well as Fabian Mulder for his hospitality in Leiden Innovation CenterPLNT & "The Field" and the EuroMoonMars ExoMars team along with the ARCHES Etna team for providing support in Sicily.
Fig. Single dipole set-up for solar, jovian and cosmic observations
How to cite: Brady, G. and Foing, B.: Science and innovation from the Moon: Radio antenna precursor observations, Europlanet Science Congress 2021, online, 13–24 Sep 2021, EPSC2021-852, https://doi.org/10.5194/epsc2021-852, 2021.
REMMI, Rover for EuroMoonMars Investigations has been built at EMMIHS campaign in HI-SEAS Hawaii in 2019 and teleoperated locally and from The Netherlands. For EuroMoonMars 2021 projects, a number of scientific experiments were carried out with the REMMI rover. These experiments were based primarily on teleoperation of the REMMI rover and its mobility system. The rover’s mobility system is based on a continuous track system. It was discovered through experimentation that these tracks are suitable for a number of environments but unsuitable for others. When testing was done in the Analog Astronaut Training Center in Poland, the rover showed that it had difficulty getting a grip on metal surfaces. However, through testing in other outdoor facilities, it was observed that the rover had greater grip on sandy surfaces, grass surfaces and rocks. There was, however, a number of issues with these surfaces. On grass and rock surfaces, small debris would often interfere with the gears of the rover and would prevent movement. The solution to this would be to have a covering to shield the mobility system from both smaller debris and in future, lunar regolith. The rover also had issues with large slopes and inclines. Overall, it was discovered that the REMMI rover was more of a support rover than an exploration rover.
The REMMI rover also has a camera on it to allow for remote operation. This camera unlocks a number of future possibilities. Firstly, it will allow the rover to take pictures of samples and areas which the astronaut may want to collect or explore. This is a great feature for the astronaut as they will not have to waste oxygen and resources during an EVA searching for samples. The REMMI rover’s camera also unlocks the possibility to use artificial intelligence to recognise different features of the environment. Similar to self-driving cars, it would theoretically be possible to allow the rover to recognise features of the landscape which would show dangerous terrain for the rover or perhaps a new area to discover. The possibilities will be further tested in July 2021 on Mt Etna, Italy.
Acknowledgements: The authors would like to thank the Analog Astronaut Training Center and Dr. Kołodziejczyk for allowing the REMMI rover to be tested in their facilities and for their support throughout. The authors would also like to thank ILEWG EuroMoonMars for providing the REMMI rover for testing.
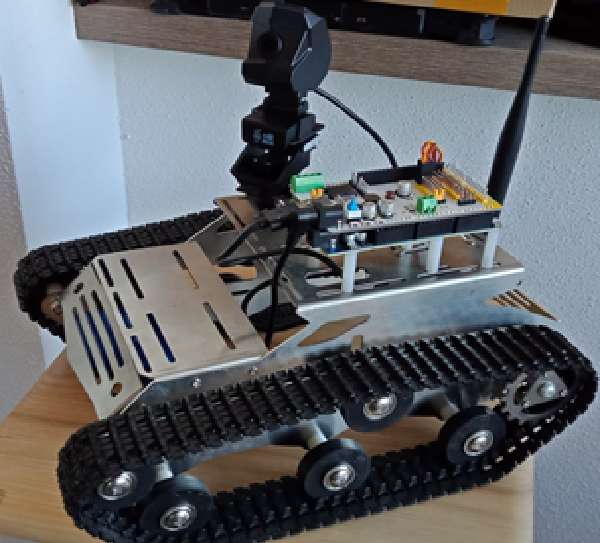
Figure 1: REMMI rover showing continuous track system and manoeuvrable camera.
How to cite: Mohan, C., Foing, B., and Charasse, M.-A.: Rover testing for lunar science and innovation, Europlanet Science Congress 2021, online, 13–24 Sep 2021, EPSC2021-850, https://doi.org/10.5194/epsc2021-850, 2021.
Introduction Raman spectroscopy for planetary rover-based exploration has become a primary tool to investigate in situ geological materials. With the support of the Canadian Space Agency and their Lunar Exploration Accelerator Program (LEAP), a Lunar Raman spectrometer (LunaR [1]) is being developed jointly between the University of Winnipeg, York University and MPB Communications. This instrument is intended to be installed onboard an exploration rover and acquired Raman spectroscopy of the lunar regolith in sunlit and permanently-shadowed regions. Calibration targets are needed in the context of this instrument, each typical of lunar mineralogical endmembers and consistent with the composition of the surface. We thus analysed in Raman spectroscopy a set of 46 samples, consisting of plagioclases, olivines, pyroxenes, oxides and basalts, and the lunar highland breccia meteorite Northwest Africa (NWA) 12593 [2]. In this analysis, we investigate the composition of the meteorite NWA 12593 using Raman signatures detected for our reference samples.
Measurement protocols and spectral modelling Raman spectroscopy was performed in the laboratory using a B&W Tek iRaman Raman spectrometer with a 532 nm excitation laser and covering the spectral range from 175 to 4000 cm-1 with a spectral resolution of about 4cm-1. The size of the laser spot is 1mm, and the area viewed for the measurements covers a spot of 85µm on the sample. The integration time ranges from 500 to 65000 ms per spectrum, and for each sample we average between 1 to 250 spectra. These values are optimized for each sample before the scientific measurement to ensure a signal-to-noise ratio high enough to enable spectroscopic investigation and to avoid saturation of the detector when measuring high intensity peaks. The data are dark corrected during the measurement by the instrument software. Raman spectra are acquired for three spots of each sample.
To accommodate the large amount of data to analyse, we developed a spectral deconvolution package in Python called Python Raman Analyzer (PyRANA). This package works with commands sent by the operator and allows the cleaning (i.e. detection and removal of hot pixels) and spectral modelling of the data. The continuum can be set as linear or as a 2nd order polynomial on a local scale. Several profiles are available to model the Raman peaks, such as Cauchy (symmetric and asymmetric), Gaussian (symmetric and asymmetric) and Breit-Wigner-Fano (BWF [3]). The spectral modelling allows the separation of blended features, too close from each other to be fully resolved, and thus the precise determination of the various band parameters. PyRANA, and all spectra presented in this analysis are available in free access in the SALSA database [4] (http://salsa.uwinnipeg.ca) Figure 1 presents the resulting modeling of a group of peaks detected on the Raman spectrum of the orthopyroxene sample PYX042.
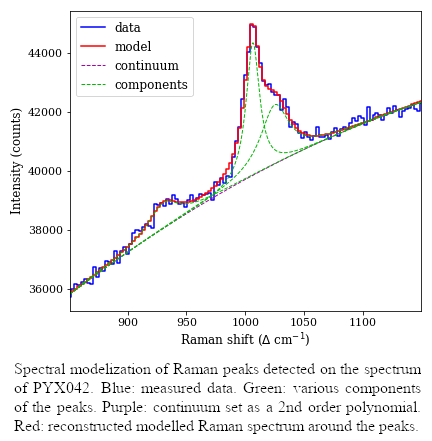
We used PyRANA on all samples and the lunar meteorite. All detected peaks are deconvoluted and used as indicators of the composition of the samples.
Raman spectroscopy of the lunar meteorite Raman spectroscopy was performed on 11 various areas of the lunar meteorite, on some inclusions and the dark matrix. Figure 2 shows the location of the observed spots during the Raman measurement, and Figure 3 shows the associated spectra.
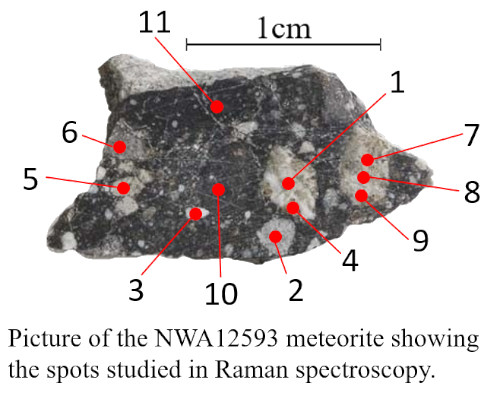
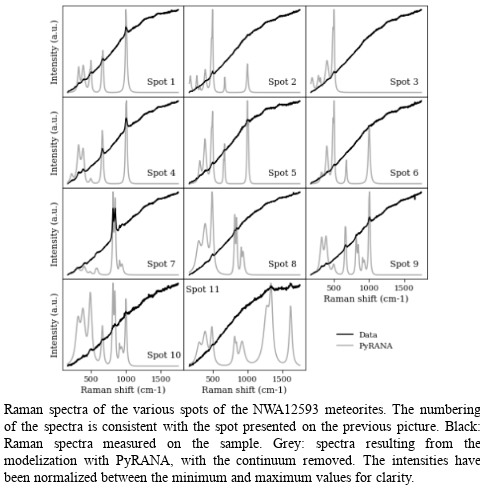
Most of expected Raman signatures are difficult to detected in the raw spectra because of the strong fluorescence (seen here as the increase of the intensity with increasing Raman shift). Beside the capacity to deconvolute the Raman peaks, PyRANA allows the removal of the continuum from the data to better isolate the Raman peaks. It can be seen on the previous figure that we detected several Raman peaks for each location on the meteorite. We now compare the position of the Raman peaks detected on the meteorite with the various signatures resulting from the investigations of the reference surfaces presented above.
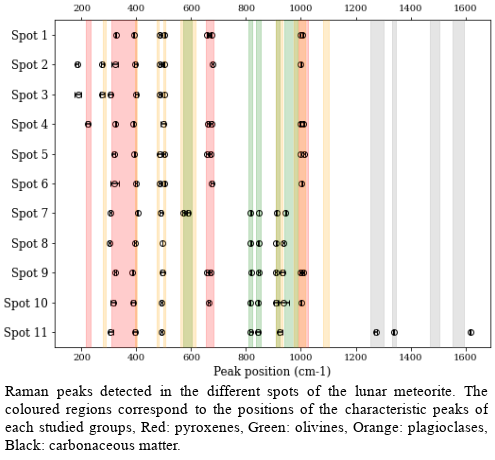
We observe on the previous figure that the Raman signatures detected on the meteorites matched those resulting from the analysis of the reference samples. All studied spots are composed of pyroxenes and plagioclase, spots 7 to 11 also show clear signatures of olivine. Though the work presented here results only in qualitative analysis, the Raman spectroscopy coupled with spectral deconvolution allows a determination of the mineralogical composition of lunar samples [5].
Conclusion We used pure single mineral samples of known compositions consistent with the composition of the lunar surface for the development of LunaR. The Raman spectroscopy analysis coupled with the spectral deconvolution with PyRANA allowed us to generate a Raman peak data base to be used in the future as references for the compositional investigation of lunar materials. We then determined the composition of the matrix and several inclusions of a lunar meteorite using the reference data previously acquired.
Acknowledgments We acknowledge the support provided by the Canadian Space Agency through their Lunar Exploration Accelerator Program (LEAP). This study is also being supported with funding from NSERC, UWinnipeg, CFI, and MRIF. This research has made use of community-developed core Python packages for astronomy and scientific computing including Scipy [6, 7], Numpy [8] and Matplotlib [9].
References [1] Cloutis et al., 52nd LPSC, 2021, 1473. [2] Gattacceca et al. Meteoritics and Planetary Science, 2020, 55, 1146–1150. [3] Eklund & Subbaswamy, Physical Review B, 1979, 20, 5157–5161. [4] Manigand et al., Canadian Lunar Workshop, 2021. [5] Potin et al., in prep. [6] Jones et al., 2001. [7] Virtanen et al., Nature Methods, 2020, 17, 261–272. [8] van der Walt et al. Computing in Science and Engineering, 2011, 13, 22–30. [9] Hunter et al. Computing in Science and Engineering, 2007, 9, 90–95.
How to cite: Manigand Potin, S., Manigand, S., Turenne, N., Sidhu, S., Connell, S., Applin, D., Cloutis, E., Caudill, C., Newmann, J., Lalla, E., Lymer, E., Freemantle, J., Daly, M., and Kruzelecky, R.: Raman spectroscopy investigation of lunar surface endmembers and analogues, Europlanet Science Congress 2021, online, 13–24 Sep 2021, EPSC2021-97, https://doi.org/10.5194/epsc2021-97, 2021.
Please decide on your access
Please use the buttons below to download the presentation materials or to visit the external website where the presentation is linked. Regarding the external link, please note that Copernicus Meetings cannot accept any liability for the content and the website you will visit.
Forward to presentation link
You are going to open an external link to the presentation as indicated by the authors. Copernicus Meetings cannot accept any liability for the content and the website you will visit.
We are sorry, but presentations are only available for users who registered for the conference. Thank you.
Please decide on your access
Please use the buttons below to download the presentation materials or to visit the external website where the presentation is linked. Regarding the external link, please note that Copernicus Meetings cannot accept any liability for the content and the website you will visit.
Forward to session asset
You are going to open an external link to the asset as indicated by the session. Copernicus Meetings cannot accept any liability for the content and the website you will visit.
We are sorry, but presentations are only available for users who registered for the conference. Thank you.

