
Comparison of photometric phase curves resulting from various observation scenes
- 1Centre for Terrestrial and Planetary Exploration (C-TAPE), University of Winnipeg, 515 Portage Avenue, Winnipeg R3B 2E9, MB Canada (s.potin-ra@uwinnipeg.ca)
- 2Université Grenoble Alpes, CNRS, Institut de Planétologie et d’Astrophysique de Grenoble (IPAG)
Introduction Reflectance spectroscopy is a common tool used to retrieve physical and mineralogical information on Solar System planetary bodies. However, the reflectance spectrum of a surface depends on several parameters, including the illumination condition and observing geometry [1]. The observed reflectance of small bodies is generally compared to laboratory measurements of meteoritic samples or terrestrial analogues to assess the composition and alteration history of the target’s surface. Laboratory measurements are performed in a controlled environment, where the composition and texture of the sample are known and the illumination and observing geometry is fixed. However, if the spectroscopic observations of the small body are unresolved, its reflectance is integrated over the whole observed surface, which averages spatial compositional and textural heterogeneities and changes in the illumination and observation geometries due to both the shape of the object and the topography of its surface (slopes, craters, …).
Here we use spectral bidirectional reflectance of terrestrial analogues measured in the laboratory and applied on 3D model of the small body (4)Vesta. We simulate the observation of these bodies by a spacecraft during a spot-pointing manoeuvre and two different fly-bys, and compare them with the spectroscopic results obtained in the laboratory.
Sample, measurements and inversion models We consider a fine powder of howardite as a reference sample for the surface of Vesta. The laboratory Bidirectional Reflectance Distribution Function (BRDF) measurement, and inversion procedure used to model the reflectance of the surface under any triplet of incidence, emergence, and phase angles are described in [2, 3]. Two generic models are considered: parametric RTLSR and physical Hapke.
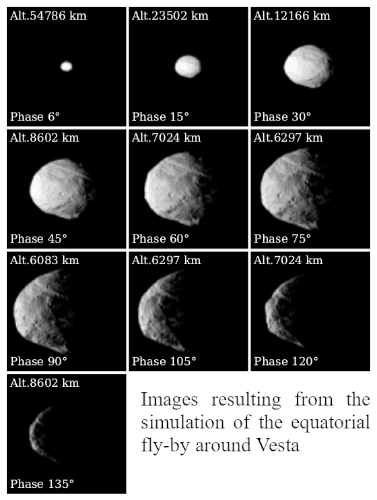
Simulation of the observations We apply the BRDF model of the howardite on each facet of the shape model of Vesta. This results in a simulated body homogeneously covered with the surface studied in the laboratory. We then simulate image acquisition by a simple pinhole camera under various illumination and observation conditions to recreate a spot-pointing manoeuvre and two fly-bys: one following the equator (hereafter called “equatorial fly-by”), the other following a meridian line (hereafter called “polar fly-by”). As an example, Figure 1 presents the images resulting from the simulation of the equatorial fly-by with a phase angle ranging from 6 to 135°. For comparison purposes, the spot-pointing and equatorial fly-by scenarios at phase angle 30° point toward the same spot on the surface and present identical illumination and observation conditions.
Comparison of the phase curves Unresolved reflectance spectroscopy of the simulated Vesta is calculated for each image with comparison to a Lambertian sphere of similar size. We define, as a function of the phase angle, the photometry as the value of reflectance measured at 740 nm. We also compare the spectral parameters derived from the observations to those derived from the laboratory measurements and their RTLSR modeling. Figure 2 presents the evolution of the reflectance, spectral slope and 3µm band depth with increasing phase angle for each simulated observation.
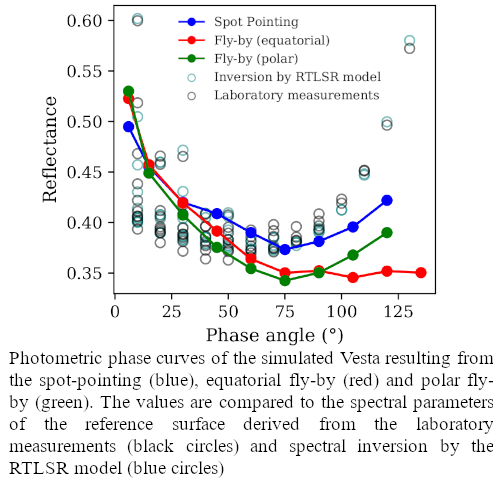
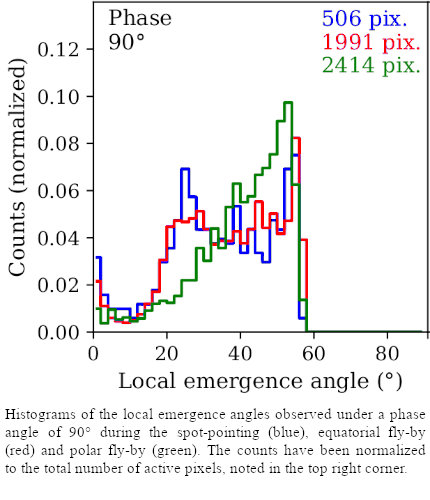
We observe that the photometric phase curve of Vesta strongly depends on the type of observations. The phase curve resulting from the spot-pointing presents roughly the same evolution as what has been measured in the laboratory. The reflectance measured on the spot-pointing differs from the reference for phase angles wider than 90°. The phase curve resulting from the polar fly-by present the same concave evolution with increasing phase angle, but its reflectance value differs from the reference for phase angles wider than 60°. Finally, the phase curve resulting from the equatorial fly-by presents the most differences from the reference surface. With increasing phase angle, the unresolved reflectance of the simulated Vesta only decreases until reaching a plateau around 0.35. The composition of the observed small body being constant between each experiment, the variations detected here on the phase curves are only due to the variation of shape and topography of the surface, resulting in various local incidence and emergence angles on the surface of the simulated Vesta. As an example, Figure 3 presents the distribution of the local emergence angles at phase angle 90° on each simulated observation.
The global shape of the small body and topography of its surface induce variations in local incidence and emergence angles, leading to differences between the observed reflectance and the values measured in the laboratory on the reference surface. Moreover, the different simulations presented here induce a variation of the illumination and observation conditions, observed areas on the surfaces and projected shape of the body. These thus create the differences observed when analysing the photometric phase curves.
Conclusion We compared the photometric phase curves resulting from simulated non-resolved observation of Vesta under various scenarios. We observed that the evolution of the reflectance strongly depends on the illumination and viewing conditions. Moreover, the projected shape and topography of the surface will lead to the observed reflectance differing from the direct measurement on the reference surface.
References [1] Potin et al. (2019) Icarus, 333, 415-428 [2] W. Lucht et al. (2000), IEEE Trans. Geosci. Remote Sens., 38, 977-998. [3] Z. Jiao et al. (2019) Remote Sens. Env., 221, 198-209.
How to cite: Manigand Potin, S. and Douté, S.: Comparison of photometric phase curves resulting from various observation scenes, European Planetary Science Congress 2021, online, 13–24 Sep 2021, EPSC2021-99, https://doi.org/10.5194/epsc2021-99, 2021.