Europlanet Science Congress 2021
Virtual meeting
13 – 24 September 2021
Europlanet Science Congress 2021
Virtual meeting
13 September – 24 September 2021
TP15
Venus Science and Exploration

TP15

Venus Science and Exploration
Convener: Thomas Widemann | Co-conveners: Richard Ghail, Dmitry Gorinov, Anna Gülcher, Yeon Joo Lee, Moa Persson, Colin Wilson
Wed, 22 Sep, 10:40–11:25 (CEST)

Session assets

Discussion on Slack

Oral and Poster presentations and abstracts

Chairpersons: Anna Gülcher, Dmitry Gorinov, Moa Persson
PROLOGUE: The EnVision Mission to Venus
EPSC2021-414
|
solicited
Thomas Widemann, Richard Ghail, Colin Wilson, and Dmitri Titov

EnVision is a proposed orbiter mission aiming at determining the nature and current state of Venus' geological evolution and its relationship with the atmosphere, to understand how and why Venus and Earth evolved so differently. It is is one of two M5 mission concepts in Phase A study with a final down-selection expected in June 2021. EnVision’s overall science goals are

- to characterise the sequence of events that generated the regional and global surface features of Venus, and characterize the geodynamics framework that controls the release of internal heat over Venus history; 

- to search for ongoing geological processes and determine whether the planet is active in the present era;

- to characterise regional and local geological units, to better assess whether Venus once had condensed liquid water on its surface and was thus perhaps hospitable for life in its early history.

EnVision will deliver new insights into geological history through complementary imagery, polarimetry, radiometry and spectroscopy of the surface coupled with subsurface sounding and gravity mapping; it will search for thermal, morphological, and gaseous signs of volcanic and other geological activity; and it will trace the fate of key volatile species from their sources and sinks at the surface through the clouds up to the mesosphere.

EnVision’s science payload consists of VenSAR, a dual polarization S-band radar also operating as microwave radiometer, three spectrometers VenSpec-M, VenSpec-U and VenSpec-H designed to observe the surface and atmosphere of Venus, and the Subsurface Radar Sounder (SRS), a High Frequency (HF) sounding radar to probe the subsurface. These are complemented by a radio science investigation which achieves gravity mapping and radio occultation of the atmosphere, for a comprehensive investigation of the Venusian surface, interior and atmosphere and their interactions.

How to cite: Widemann, T., Ghail, R., Wilson, C., and Titov, D.: EnVision: Understanding why Earth's closest neighbour is so different, Europlanet Science Congress 2021, online, 13–24 Sep 2021, EPSC2021-414, https://doi.org/10.5194/epsc2021-414, 2021.

PART I : INTERIOR & SURFACE
EPSC2021-542
|
ECP
Michaela Walterova, Frank W. Wagner, Ana-Catalina Plesa, and Doris Breuer

Introduction

An invaluable source of information about the present interior structure of Venus is the measurement of surface deflections and disturbances to the planet's gravity field caused by tidal deformation. The planet is mainly loaded by the semidiurnal solar tide that probes the interior at the angular frequency ω ≈ 1.25×10⁻⁶ rad s-1 [e.g., 1]. The tidal response is then determined by the rheological properties of the body.

In this work, we combine interior structure and tidal modeling of Venus to compute and compare measurable quantities, namely the tidal Love numbers k2, the moment of inertia factor MoIF, and the tidal quality factor Q. Our predictions can be tested with future measurements, should current Venus mission proposals (e.g., Veritas and EnVision) be selected.


Interior structure and thermal state models

In order to calculate the tidal parameters (k2 and Q), we first generate 1-D interior structure models of Venus. Our method is similar to that of [2] in which the interior is subdivided into chemically separated layers: an iron core, a rocky mantle, and a basaltic crust.

In addition, steady-state temperature profiles are calculated by applying a mixing-length approach [3], and we vary poorly constrained parameters (crustal density and thickness, iron content in the mantle, reference viscosity of mantle and core, surface and core-mantle heat fluxes).


Tidal deformation models

Tidal deformation modeling is based on the normal mode theory for a radially-stratified nonrotating incompressible viscoelastic sphere [e.g., 4]. In this approach, the deformations, tractions, and additional potential in the planet are expanded into spherical harmonics and the governing equations for the viscoelastic continuum are solved analytically. The resulting deformation state is then described by parametric functions, the parameters of which can be obtained from the boundary conditions.

We compute the potential Love numbers by using two different techniques. In the first approach, the radial profiles of the deformations, tractions, and additional potential are computed by using a matrix propagation method [e.g., 5, 6]. In the second approach, we seek directly the parameters of the aforementioned parametric functions [7].

We use the well-known Maxwell model for the core and adopt an Andrade model to compute the response of the Venusian mantle and crust [8, 9]. In contrast to the Maxwell model, the Andrade rheology accounts not only for the instantaneous elastic deformation and the viscous (steady-state) creep but also for the transient effects governed by the Andrade hereditary terms.


Results

(a) Comparison of Love numbers

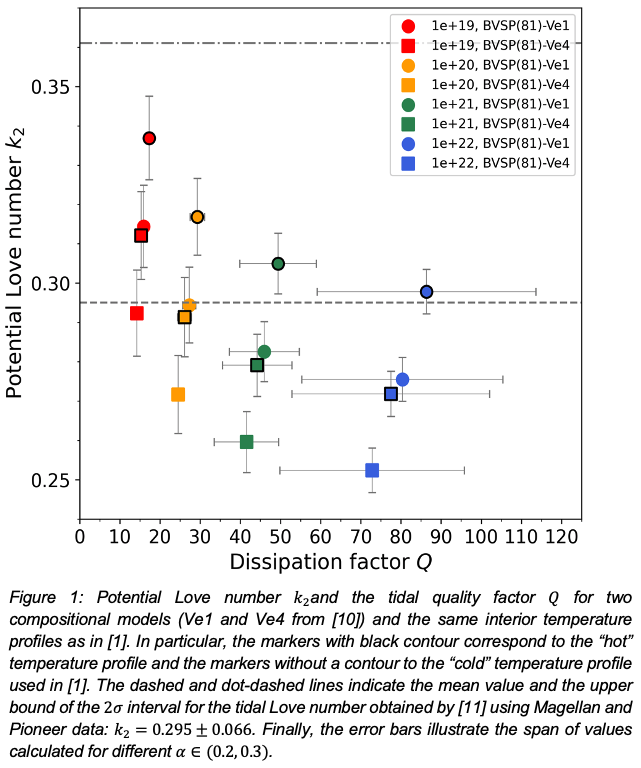
We select representative interior structure models and compute the tidal parameters according to the two methods described above. Both methods provide the same results for various sets of input parameters. Furthermore, we compare our results with published data from [1]. To this end, we used the same interior temperature profiles, core size, and viscosity as in [1], and employed two end-member compositions (i.e., BVSP(81)-Ve1 with a low and BVSP(81)-Ve4 with a high iron content in the Venusian mantle) similar to their models V1 and V4. Our results in Fig. 1, calculated with the tidal model of [7], are in close agreement with the data presented in Fig. 4 of  [1].


(b) Effect of mantle composition

We observe two distinct ranges of MoIF according to the bulk composition used in our interior structure models (Fig. 2). All models corresponding to the mantle mineralogy with a negligible low iron content [BVSP(81)-Ve1] are found at significantly lower MoIF than their iron-rich [BVSP(81)-Ve4] counterparts. Furthermore, it can be seen that an iron-rich mantle leads to smaller core sizes when comparing the two compositional models.
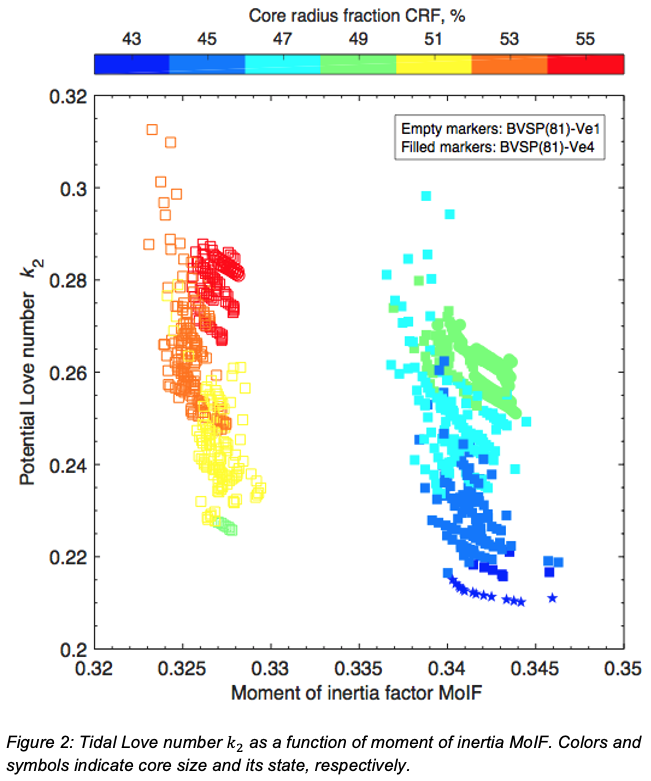


Combining the MoIF and the potential Love number k2 delivers additional information about the state and size of the core. In Figure 2, the models with a completely solid core (stars) have the smallest core size and thus the lowest k2, whereas the models with a completely liquid core (circles) have in general large core sizes and thus high k2. In between these two end-members, we find the models with solid inner and liquid outer cores (squares). These models usually have medium-sized cores and intermediate potential Love numbers k2. However, the highest k2 value is obtained for models with partially liquid iron cores. Their much hotter counterparts with completely liquid cores, which would lead to even higher k2, contain a fully molten mantle layer, and have been excluded here. Thus, the determination of the state and size of the core could be challenging for high potential Love numbers k2 due to a model degeneracy from input parameters.


Conclusions

In this study, we have presented a comparison between two tidal deformation models [6,7] to compute Venusian tides. The results show a close agreement between the two tidal deformation models and the study of [1].

We have applied our interior models to investigate the effects of composition on the tidal parameters and moment of inertia factor. The results indicate two families of models with distinct MoIF that could be constrained by future measurements.

In the next step, we plan to combine the tidal deformation model with thermal evolution calculations to study the secular tidal evolution. To this end, we will couple the tidal model to 1-D parametrized [e.g., 12] and 2-D geodynamical [e.g., 13] models that treat the cooling history and melt production in the interior of Venus. Furthermore, our coupled tidal-thermal evolution model can be applied to study the interior of Venus-like extrasolar planets.


References

[1] Dumoulin, C. et al. (2017): JGR:Planets, 122.

[2] Sohl, F. & Spohn, T. (1997): JGR:Planets, 102(E1).

[3] Wagner, F. W. et al. (2019): GJI, 217(1).

[4] Sabadini, R. & Vermeersen, B. (2004): Springer.

[5] Segatz, M. et al. (1988): ICARUS, 75(2).

[6] Steinbrügge, G. et al. (2018): JGR:Planets, 123(10).

[7] Walterová, M. & Běhounková, M. (2020): ApJ, 900(1).

[8] Jackson, I. & Faul, U. H. (2010): PEPI, 183.

[9] Castillo‐Rogez, J. C. et al. (2011): JGR:Planets, 116(E9).

[10] Basaltic Volcanism Study Project (1981): Pergamon Press.

[11] Konopliv, A. S. & Yoder, C. F. (1996): GJI, 23(14).

[12] Tosi, N. et al. (2017): A&A, 605.

[13] Plesa, A.-C. & Breuer, D. (2021): LPSC, No. 2548.

How to cite: Walterova, M., Wagner, F. W., Plesa, A.-C., and Breuer, D.: Interior structure and tidal response of Venus: Implications for future missions, Europlanet Science Congress 2021, online, 13–24 Sep 2021, EPSC2021-542, https://doi.org/10.5194/epsc2021-542, 2021.

EPSC2021-65
|
ECP
Christelle Saliby, Agnes Fienga, Giorgio Spada, Daniele Melini, and Anthony Memin

Tidal forces acting on a planet cause a deformation and mass redistribution in its interior, involving surface motions and variation in the gravity field, which may be observed in geodetic experiments. The change in the gravitational field of the planet, due to the influence of an external gravity field, described primarily by its tidal Love number k of degree 2 (denoted by k2) can be observed from analysis of a spacecraft radio tracking. The planet’s deformation is linked to its internal structure, most effectively to its density and rigidity. Hence the tidal Love number k2 can be theoretically approximated for different planetary models, which means comparing the observed and theoretical calculation of k2 of a planet is a window to its internal structure.

The terrestrial planet Venus is reminiscent of the Earth twin planet in size and density, which leads to the assumption that the Earth and Venus have similar internal structures. In this work, with a Venus we investigate the structure and elastic parameters of the planet’s major layers to calculate its frequency dependent tidal Love number k2. The calculation of k2 is done with ALMA, a Fortran 90 program by Spada [2008] for computing the tidal and load Love numbers using the Post-Widder Laplace inversion formula. We test the effect of different parameters in the Venus model (as a layer’s density, rigidity, viscosity and thickness) on the tidal Love numbers k2 and different linear and non-linear combinations of k2 andh2 (as the tidal Love number h2 describes the radial displacement due to tidal effects).

How to cite: Saliby, C., Fienga, A., Spada, G., Melini, D., and Memin, A.: Venus internal structure and global deformation, Europlanet Science Congress 2021, online, 13–24 Sep 2021, EPSC2021-65, https://doi.org/10.5194/epsc2021-65, 2021.

EPSC2021-560
|
ECP
Rens Elbertsen, Paul Tackley, and Antoine Rozel

Venus is commonly described as Earth’s slightly smaller twin planet. However, the dynamics of plate tectonics present at Earth are not observed at Venus.  Gravity and topography are key observations to help understand the interior dynamics of a planet. On Earth, the long-wavelength geoid and total surface topography are not well correlated, with the interpretation that total surface topography is mainly due to the ocean-continent dichotomy whereas geoid reflects density anomalies deep in the mantle, mainly caused by subducted slabs. Dynamic surface topography is small compared to the total surface topography. On Venus, in contrast, the geoid and topography are well correlated, indicating a more direct connection between convection and the lithosphere and crust.

For Venus, two end-member origins of geoid and topography variations have been proposed: 1) Deep-seated (i.e. below the lithosphere) density anomalies associated with mantle convection, which may require a recent global lithospheric overturn to be significant [1][2][3]. 2) Variations in lithosphere and crustal thickness that are isostatically compensated - the so-called "isostatic stagnant lid approximation" [4][5], which appears consistent with simple stagnant-lid convection experiments.

Here we analyse 2-D and 3-D dynamical thermo-chemical models of Venus' mantle and crust that include melting and crustal production, multiple composition-dependent phase transitions and strongly variable viscosities to test whether variations in crust and lithosphere thickness explain most of the geoid signal [4][5], or whether it is caused mostly by density variations below the lithosphere, and thus, what we can learn about the crust, lithosphere and deeper interior of Venus from observations, as well as which tectonic mode is most likely to explain the observed geoid signal. Multiple input parameter sets are used to recreate the end-member scenarios of stagnant-lid and episodic-lid tectonics and to investigate the influence of the different rheological parameters. Characteristic snapshots of simulations showing end-member tectonic behaviour are analysed to determine the depth ranges of heterogeneities that are the predominant influence on topography and geoid variations. Findings will also guide future efforts to combine gravity and topography observations to infer lithosphere and crustal thickness and their variations (e.g. [6][7]).

References

[1] Armann, M., and P. J. Tackley (2012), Simulating the thermo-chemical magmatic and tectonic evolution of Venus' mantle and lithosphere: two-dimensional models, J. Geophys. Res., 117, E12003, doi:12010.11029/12012JE004231

[2] King, S. D. (2018), Venus resurfacing constrained by geoid and topography, J. Geophys. Res., 123, doi:10.1002/2017JE005475.

[3] Rolf, T., B. Steinberger, U. Sruthi, and S. C. Werner (2018), Inferences on the mantle viscosity structure and the post-overturn evolutionary state of Venus, Icarus, 313, 107-123, doi:10.1016/j.icarus.2018.05.014.

[4] Orth, C. P., and V. S. Solomatov (2011), The isostatic stagnant lid approximation and global variations in the Venusian lithospheric thickness, Geochem. Geophys. Geosyst., 12(7), Q07018, doi:10.1029/2011gc003582.

[5] Orth, C. P., and V. S. Solomatov (2012), Constraints on the Venusian crustal thickness variations in the isostatic stagnant lid approximation, Geochemistry, Geophysics, Geosystems, 13(11), n/a-n/a, doi:10.1029/2012gc004377

[6] Jiménez-Díaz, A., J. Ruiz, J. F. Kirby, I. Romeo, R. Tejero, and R. Capote (2015), Lithospheric structure of Venus from gravity and topography, Icarus, 260, 215-231, doi:10.1016/j.icarus.2015.07.020.

[7] Yang, A., J. Huang, and D. Wei (2016), Separation of dynamic and isostatic components of the Venusian gravity and topography and determination of the crustal thickness of Venus, Planetary and Space Science, 129, 24-31, doi:10.1016/j.pss.2016.06.001.

How to cite: Elbertsen, R., Tackley, P., and Rozel, A.: Geoid and topography on Venus: Isostatic or dynamic?, Europlanet Science Congress 2021, online, 13–24 Sep 2021, EPSC2021-560, https://doi.org/10.5194/epsc2021-560, 2021.

EPSC2021-484
|
ECP
Jiacheng Tian, Paul Tackley, and Antoine Rozel

Introduction: Although Venus shares many similar characteristics with Earth, like its size, distance to sun, and bulk composition, its surface characteristics significantly differ from those on Earth, especially in the lack of plate tectonics. From a geodynamic perspective, Venus has been proposed to be in an episodic-lid regime with catastrophic resurfacing and episodic overturns for the lithosphere (e.g., Armann & Tackley, 2012). However, these global models assumed that Venus’ crust has the same rheology as olivine and neglect dislocation creep, resulting in negligible deformation between overturn events, whereas in contrast, Venus' crust exhibits substantial tectonic deformation (e.g. Ivanov and Head, 2011; Ghail, 2015) and regional geodynamic models assuming a realistic, laboratory experiment-based crustal rheology and igneous intrusion into the crust, successfully reproduce surface features like coronae (Gerya, 2014; Gülcher et al., 2020). Therefore, in this study, we test the influence of a strain-rate dependent laboratory experiment-based rheology for the crust, as well as intrusive volcanism, in global geodynamic models to evaluate whether these factors could affect Venus’ tectonics and evolution, and help to explain Venus’ surface characteristics. 

Methods: We use the mantle convection code StagYY (Tackley, 2008) in a 2D spherical annulus geometry to model the thermochemical evolution of Venus. The infinite Prandtl number approximation is assumed, and compressibility is included in the model by assuming anelastic approximation.

A composite rheology is assumed, including diffusion creep, dislocation creep, and plastic yielding (using an effective rheology). This rheology depends on composition via the olivine and pyroxene-garnet phase systems, in both solid and molten states. For the basaltic crust, a plagioclase (An75) rheology from (Ranalli, 1995) as used in (Gülcher et al., 2020) is applied to the basalt facies in the pyroxene-garnet system. For other facies in pyroxene-garnet and olivine system, the rheological parameters are based on (Karato & Wu, 1993) for the upper mantle and (Yamazaki & Karato, 2001; Ammann et al., 2010) for the lower mantle. Additionally, we include intrusive magmatism in the model using an approach similar to (Lourenço et al., 2020).

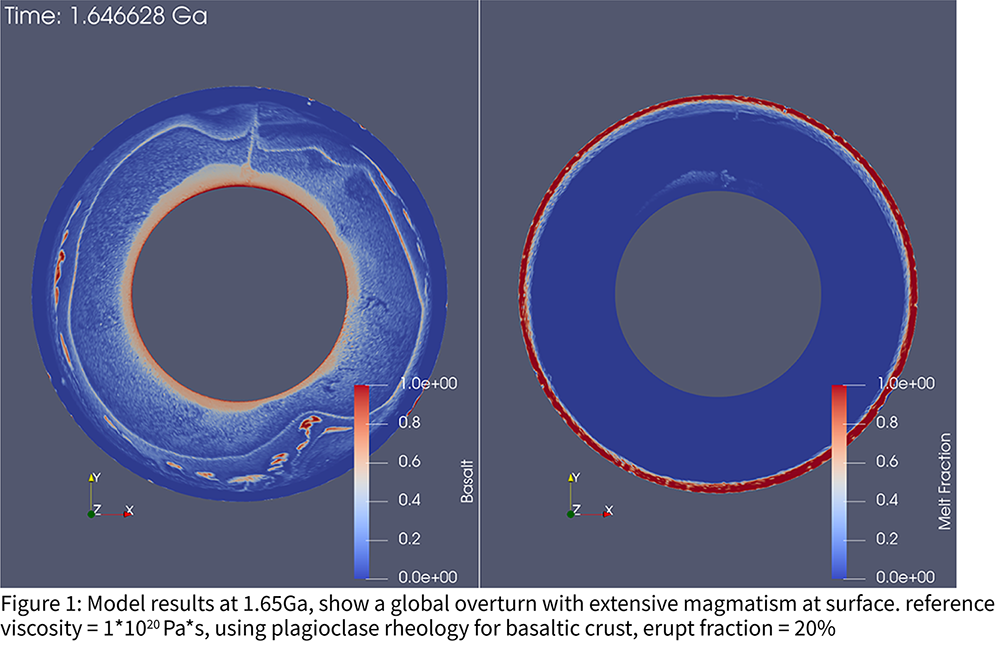
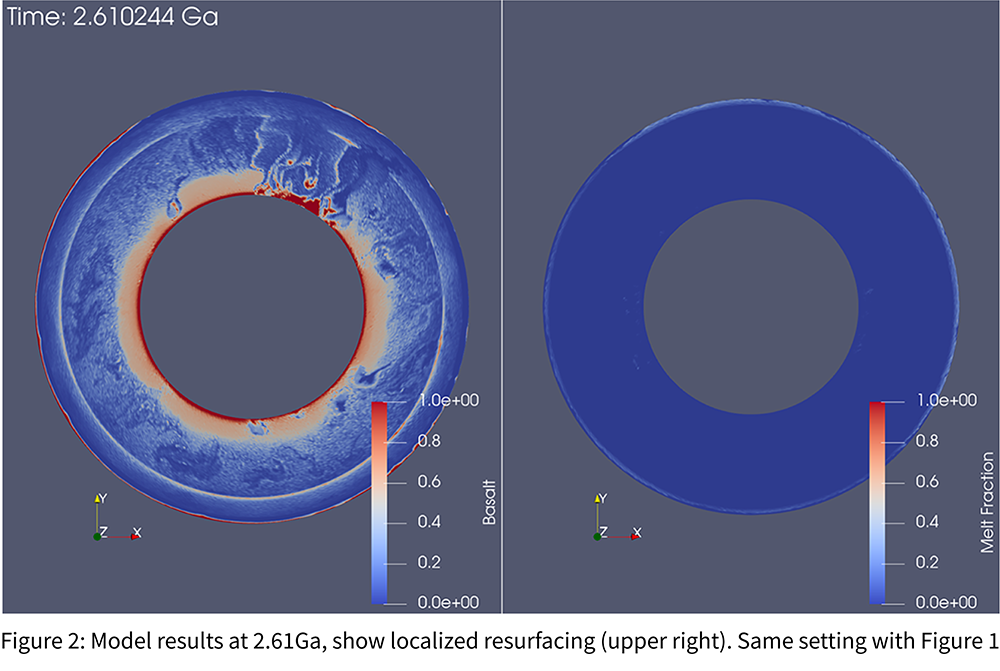
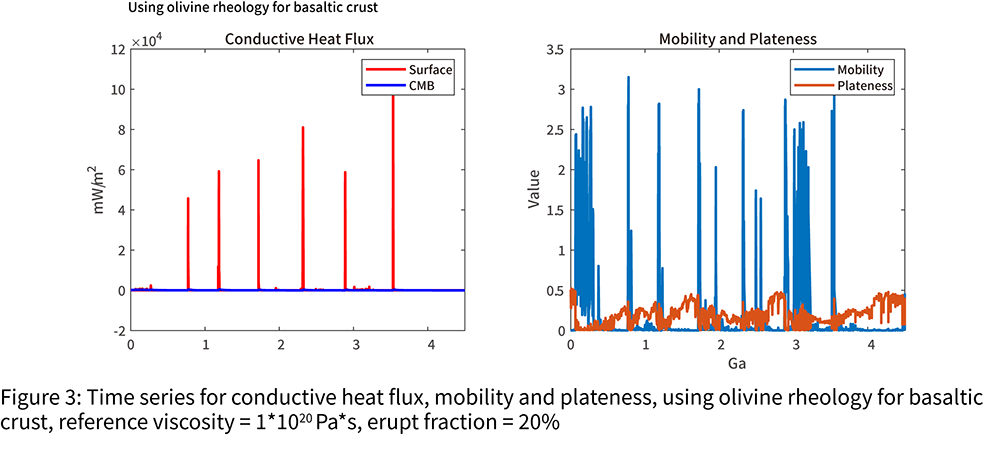
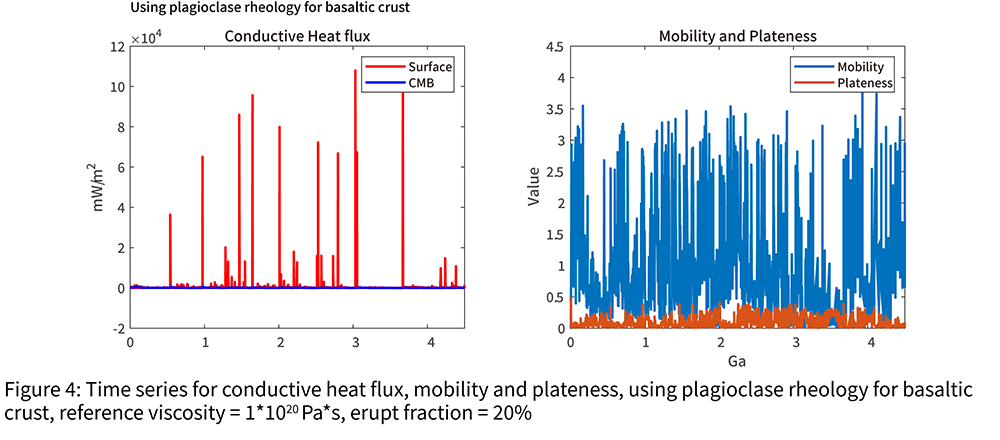
Preliminary results and discussions: For the resurfacing history for Venus, the models show that if both dislocation creep rheology and plastic yielding plus intrusion magmatism are included, there would be both catastrophic global overturns with extensive magmatism (Figure 1) and localized resurfacings (Figure 2) during Venus’ mantle evolution. These two types of resurfacing are also shown in the time series of conductive heat flux (Figure 3 and 4): the conductive heat flux is much larger for global overturn due to extensive intrusive magmatism. Additionally, the surface mobilities in our models (Figure 3 and 4) differ from surface mobilities in olivine-crustal-rheology models, where the global overturns are followed by stagnant-lid phases with near-zero surface mobilities. Applying the realistic rheology (instead of olivine diffusion-creep rheology) to the crust could lead to a transition from near episodic-lid resurfacing (Figure 3) to a scenario with more local resurfacings and generally higher and more continuous surface mobilities (Figure 4).

Contrary to the previous global models (Armann & Tackley, 2012), there are no persistent mantle plumes in our models. Basalt accumulating at the boundary between upper and lower mantle (e.g. in Figure 2) works as a barrier for convective flows and affects mantle upwelling from the core-mantle boundary. Also, even if the intrusion depth is set to be below the basaltic crust (possibly, most of the intrusions solidify to form basaltic crust there), there could still be melt present in the crust (Figure 5). These short-term crustal melting events are in accord with observations of recent magmatic features found on Venus’ surface, and the short-term plumes suggested by coronae formation models (Gerya, 2014; Gülcher et al., 2020)


References:

Ammann, M. W., J. P. Brodholt, J. Wookey, and D. P. Dobson (2010). Nature, 465, 462-465.

Anderson, F. S., & Smrekar, S. E. (2006). Journal of Geophysical Research-Planets, 111(E8)

Armann, M., & Tackley, P. J. (2012). Journal of Geophysical Research: Planets, 117(E12)

Gerya, T. V. (2014). Earth and Planetary Science Letters, 391, 183–192.

Ghail, R. (2015), Planetary and Space Science, 113-114, 2-9

Gülcher, A. J. P. et al. (2020) Nature Geoscience, 13(8), 547–554.

Ivanov, M. A., and J. W. Head (2011). Planetary and Space Science, 59(13), 1559-1600

Karato, S., & Wu, P. (1993). Science, 260(5109), 771–778.

Lourenço, D. L. et al. (2020). Geochemistry, Geophysics, Geosystems, 21(4)

Tackley, P. J. (2008). Phys. Earth Planet. Inter. 171(1-4), 48-54.

Yamazaki, D., & Karato, S. (2001). American Mineralogist, 86(4), 385–391.

How to cite: Tian, J., Tackley, P., and Rozel, A.: Implications of a realistic crustal rheology for Venus’ resurfacing history and global tectonics, Europlanet Science Congress 2021, online, 13–24 Sep 2021, EPSC2021-484, https://doi.org/10.5194/epsc2021-484, 2021.

EPSC2021-122
Michael Way, Richard Ernst, and Jeffrey Scargle

Large scale volcanism has played a critical role in the long-term habitability of Earth and possibly Venus.  We examine the timing of Large Igneous Provinces (LIPs) through Earth’s history [1] to estimate the likelihood of nearly simultaneous events that could drive a planet into an extreme moist or runaway greenhouse, quenching subductive plate tectonics. Such events would end volatile cycling and may have caused the heat-death of Venus. Using the Earth's LIP record a conservative estimate of the rate of LIPs in a random history statistically the same as Earth’s, pairs and triplets of LIPs closer in time than 0.1-1 Myrs are likely. This simultaneity threshold is significant to the extent that it is less than the time over which environmental effects have been shown to persist, for example in the Siberian Traps record [2,3].

[1] Ernst, R.E. et al. (2021). Large Igneous Province Record Through Time and Implications for Secular Environmental Changes and Geological Time-Scale Boundaries. In: Ernst, R.E., Dickson, A.J., Bekker, A. (eds.) Large Igneous Provinces: A Driver of Global Environmental and Biotic Changes. AGU Geophysical Monograph 255 (pp. 3-26).

[2] Burgess, S.D. et al. (2014). High-precision timeline for Earth’s most severe extinction. Proceedings of the National Academy of Sciences, 111:

3316–3321 [correction 2014, 111: 5050]. 

[3] Burgess, S.D. & Bowring, S.A. (2015). High-precision geochronology confirms voluminous magmatism before, during and after Earth's most severe extinction. Sci. Adv. 1 (7), e1500470. http://dx.doi.org/10.1126/sciadv.1500470.

How to cite: Way, M., Ernst, R., and Scargle, J.: Large Scale Volcanism: an explanation for the heat-death of Venus like worlds, Europlanet Science Congress 2021, online, 13–24 Sep 2021, EPSC2021-122, https://doi.org/10.5194/epsc2021-122, 2021.

PART II : The DEEP ATMOSPHERE (0 - 40 km)
EPSC2021-246
|
ECP
Ananyo Bhattacharya

Dust particles and haze formation on the surface of Venus have been observed and studied using several independent techniques onboard Venus lander missions. A possibility of mineral haze formation in highlands is supported by observations of high reflectivity and low emissivity features from Pioneer Venus Orbiter and Magellan radar experiments, while Venera 13 and 14 spectrophotometer analysis yields appreciable aerosol extinction at the same altitudes. In this work, we present threshold parameters for dust lifting from 1 μm to 1 cm sized dust particles over the globe using emissivity and surface topography data provided by Magellan radar. The threshold wind speeds have been derived using theoretical and experimental models and compared with the in-situ measurements reported earlier. Haze formation is less likely to occur solely due to wind shear by micron and submicron sized particles. The entrainment process and properties of the boundary layer also contribute to variation in threshold wind speeds and particle transport.

How to cite: Bhattacharya, A.: Aeolian processes on Venus: Probabilistic study on threshold speeds, Europlanet Science Congress 2021, online, 13–24 Sep 2021, EPSC2021-246, https://doi.org/10.5194/epsc2021-246, 2021.

EPSC2021-649
|
ECP
Maxence Lefèvre

1. Introduction
Below 10 km the atmosphere of Venus virtually unknown, only the VeGa-2 has successfully measure the temperature in that region. At the surface, only Venera 9 and 10 directly measured the wind for respectively 49 min and 90 s, and several other probes like Venera 13 and 14 measured indirectly the wind speed. The amplitude of the measured wind speed is inferior to 2 m/s [4]. The planetary boundary layer has been studied with a global circulation model (GCM) [5], exhibiting a strong effect of the solar heating on the amplitude of the slope wind in the tropics. Additional studies are needed for the understanding of the near-surface dynamics and future landing missions. We propose to use a mesoscale model to study this part of the atmosphere.

2. Model
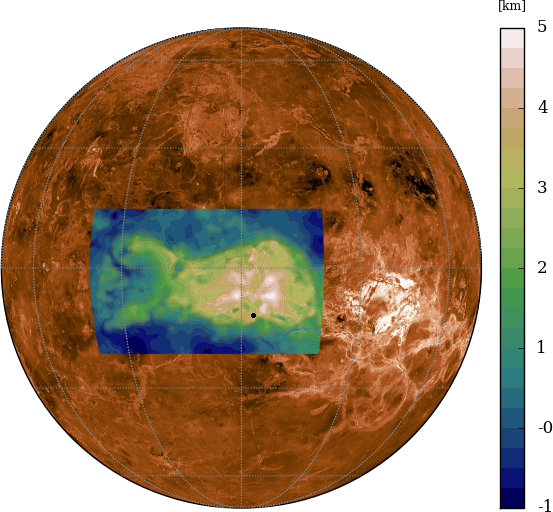
To study the near-surface dynamics, the LMD Venus mesoscale model [1] is used, composed of the Weather-Research Forecast (WRF) non-hydrostatic dynamical core [2] coupled with the IPSL Venus GCM physics package [3]. The domain is centered on Ovda Regio in Aphrodite Terra with a resolution of 20 km (Fig 1). The mesoscale boundary conditions are forced with the IPSL Venus GCM.

Figure 1: Topography (km) of the mesoscale model, centered on Ovda Regio in Aphrodite Terra with a resoltion of 20 km.

3. Results
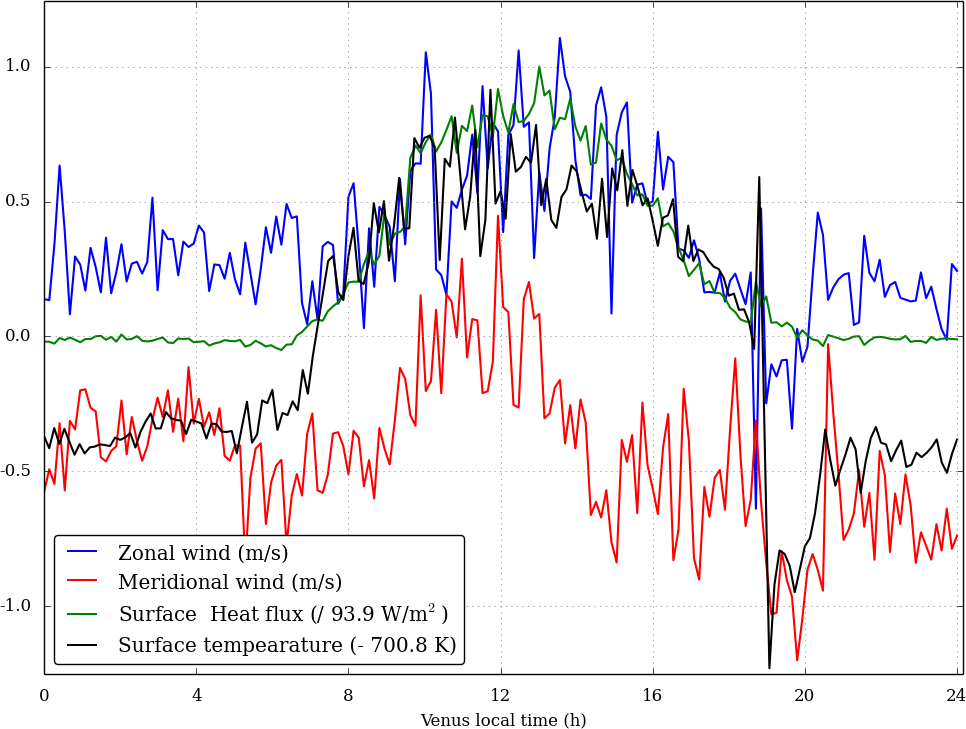
Fig 2 shows the diurnal variation at the specific point for the zonal (blue) and meridional (red) winds, exhibiting a wind direction around noon. The amplitudes of the winds are consistent with in-situ measurements. The surface heat flux reaches a maximum value of 93 W/m 2 at noon. The surface temperature exhibits a diurnal cycle inferior at 2 K. Additional results about the near surface of Venus will be presented.

Figure 2: Diurnal variation of the zonal wind (blue) meridional wind (red), surface heat flux (green) and surface temperature (black) for at the black dot in Fig 1.

References
[1] Lefèvre et al., Icarus, 335, 113376, 2020.
[2] Skamarock, W. C. and J. B. Klemp, J., Comput. Phys., 227, 3465-3485, 2008
[3] Garate-Lopez, I. and Lebonnois., S., Icarus, 314,1-11, 2018.
[4] Lorenz, R., Icarus, 264, 311-315, 2016.
[5] Lebonnois, S. et al., Icarus, 314, 149-158, 2018.

How to cite: Lefèvre, M.: Diurnal cycle of the Venus near-surface dynamics, Europlanet Science Congress 2021, online, 13–24 Sep 2021, EPSC2021-649, https://doi.org/10.5194/epsc2021-649, 2021.

EPSC2021-730
|
ECP
Shubham Kulkarni, Nils Mueller, Daphne Stam, and Sébastien Lebonnois

Introduction: Given the extreme conditions in the lower atmosphere of Venus, various in-situ missions faced instrumental failures. As a result, the thermal structure of the deep atmosphere, particularly below 12 km is not well known. In Venus International Reference Atmosphere (VIRA), the thermal structure of the atmosphere below 12 km altitude was constructed by extrapolating the data recorded in the upper atmosphere. Only VeGa-2 lander provided the high-resolution temperature measurements below 12 km altitude. However, these measurements indicated a region of high instability below 7 km altitude. Due to a lack of physical explanation, these measurements were not included in VIRA.

Methodology: In this study, we use the previous near-IR observations of Venus nightside to investigate the thermal structure of the deep atmosphere. First, a surface temperature map is generated from the near-IR observations. By correlating this map with surface topography a surface temperature vs altitude profile is generated. Assuming that the surface is in thermal equilibrium with the atmosphere [1], the surface temperature vs altitude profile then provides the thermal structure of the deep atmosphere. In the end, we compare the retrieved thermal structure with the VIRA and VeGa-2 temperature profiles.

Data Processing: The near-IR observations from the VIRTIS instrument onboard the Venus Express and the IR1 imager onboard the Akatsuki orbiter are used in our study. The VIRTIS dataset has been already processed by [2] and contains the observations of the southern hemisphere having an altitude range below 4 km. The equatorial and northern highlands on Venus were observed by the IR1 imager. However, the IR1 observations are heavily contaminated by the bright straylight coming from the dayside of Venus. Also, the calibration had an uncertainty of±67%. To make use of the IR1data, we develop a correction procedure that includes (1) starylight correction, (2) limb darkening correction, and (3) cross-calibration using the VIRTIS data.

Radiative Transfer: To retrieve the surface temperatures from the near-IR observations, we develop an atmospheric radiative transfer model based on the radiative transfer code from [3]. The atmosphere is constructed by using VIRA profiles. We use the cloud model from [4] and Mie scattering is treated by using the code from [5]. We model the absorption using the line-by-line code from [6] and considering eight major absorbing species. Appropriate spectral line dataset and lineshapes are used. To simulate the effect of topography on Venus, we generate the results in the form of a look-up table in which we vary the starting altitude of the atmosphere from -3 to 13 km altitude with respect to a 6051 km planetary radius. We validate our model based on the results generated by the model described in [7].

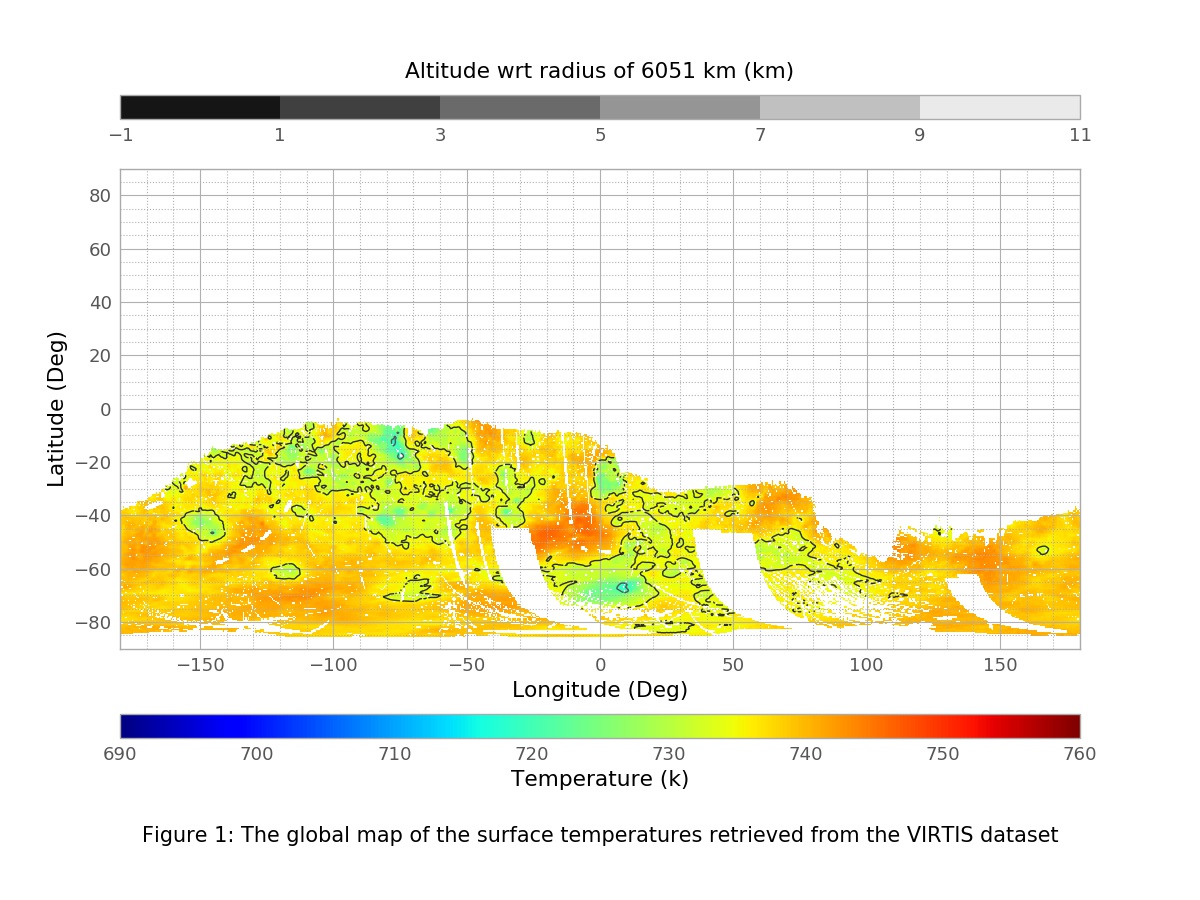
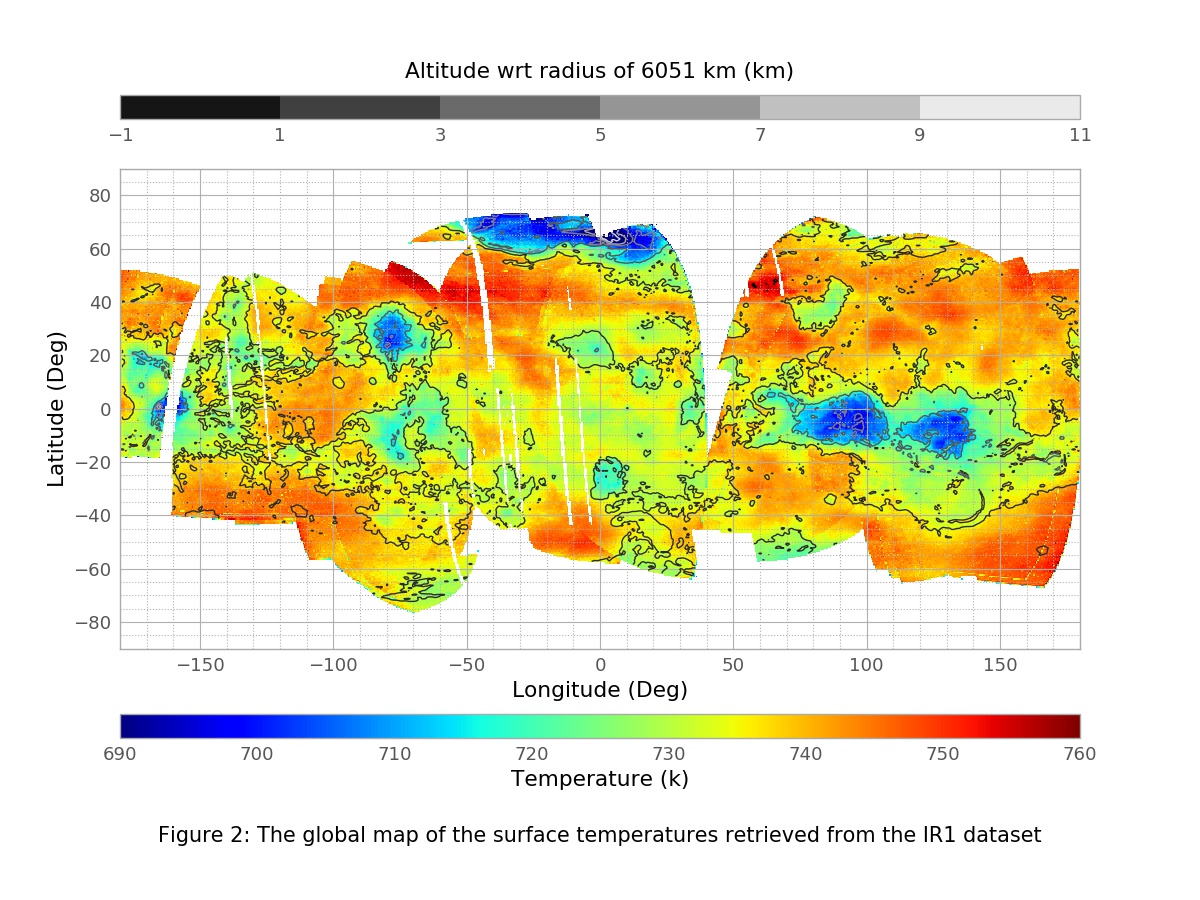
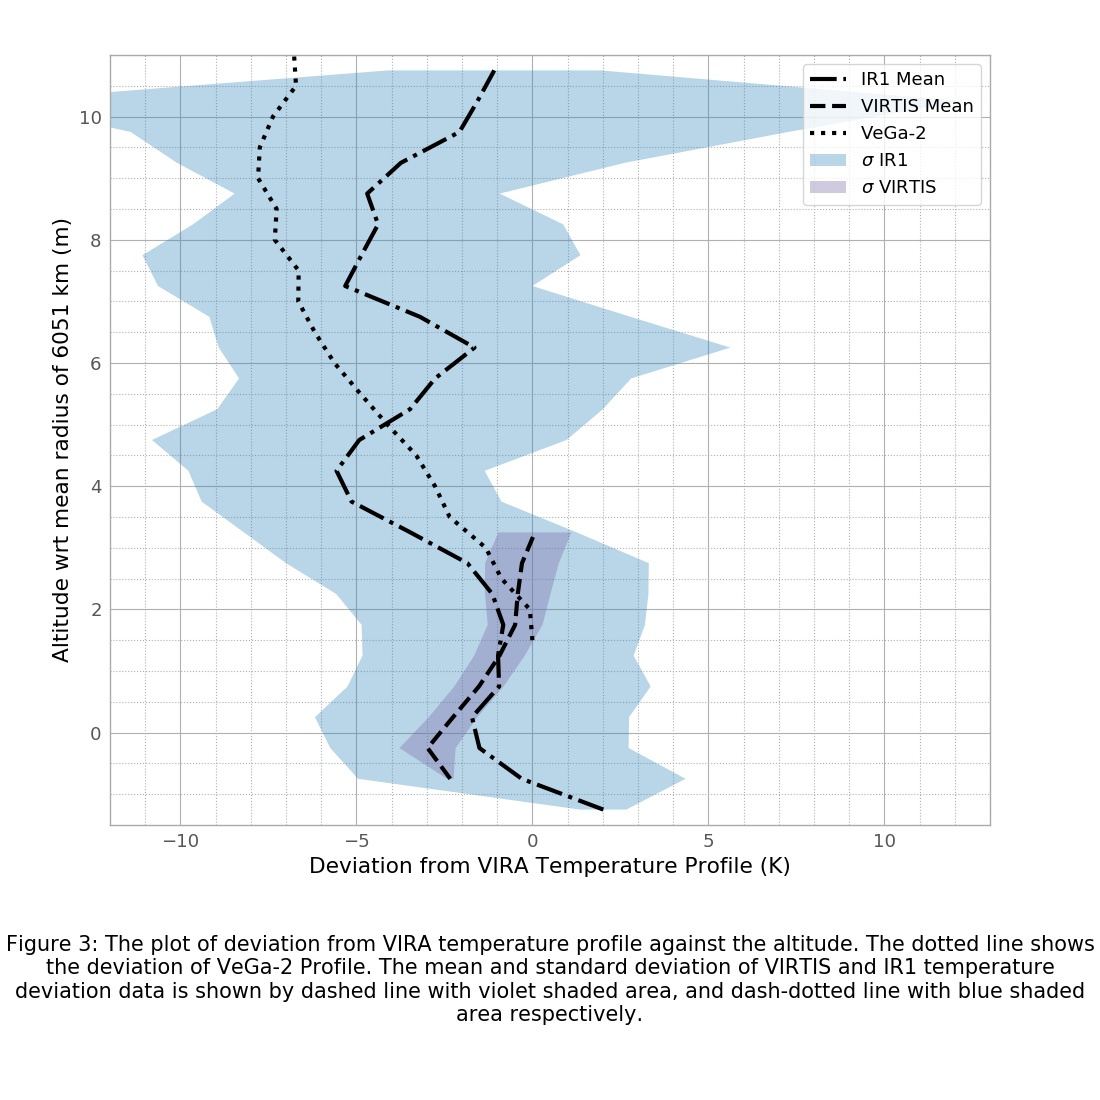
Results and Conclusion: The coverage of the VIRTIS and IR1 datasets can be observed from the maps of retrieved surface temperatures shown in Figure 1 and Figure 2. Figure 3 shows the trendlines of mean values of the deviation of surface temperature with respect to VIRA temperature profile against the altitude for both the dataset. The dotted line shows the deviation of the VeGa-2 profile.

We find that the VIRTIS and IR1 temperature trendlines show a lapse rate lower than VIRA from 0 to 1.5 km altitude, as previously indicated by [8]. Above this altitude VIRTIS trendline follows the VIRA lapse rate, however, the observations are limited up to an altitude of 3.5 km.

Above 2 km altitude, the IR1 temperatures fall even faster than the VeGa-2 profile and achieve a maximum deviation of∼5 K from the VIRA profile between 4-5 km and 7-8 km altitude range. This indicates that the situation could be even more complex than indicated by the VeGa-2 profile. Above 8 km altitude, the IR1 data is less reliable. The reasons behind the differences in the IR1, and VIRA profiles are not clear. Possible reasons could be surface emissivity variations, a near-surface layer of aerosols, or a composition gradient [9].

Thus, we find that both the VIRTIS and IR1 profile do not completely agree with either VIRA or VeGa-2 profile. However, observations from both VIRTIS and IR1 instruments were not ideal for the surface-emission studies. An optimized instrument could provide better coverage and quality of the data which could significantly help near-surface studies. Based on this, we highlight the need for future near-IR observations with an instrument optimized for the surface observing atmospheric windows of Venus.


References:

[1]  Lecacheux, J., Drossart, P., Laques, P., Deladerriére, F., and Colas, F., Planetary and Space Science 41(7), 543–549 (1993).

[2]  Mueller, N., Helbert, J., Hashimoto, G. L., Tsang, C. C., Erard, S., Piccioni, G., and Drossart, P., Journal of GeophysicalResearch E: Planets 114(5), 1–21 (2009).

[3]  Wauben, W. M. F., De Haan, J., and Hovenier, J., Astronomy and Astrophysics -Berlin-282(1), 277–277 (1994).

[4]  Barstow,  J. K.,  Tsang,  C. C.,  Wilson,  C. F.,  Irwin,  P. G.,  Taylor,  F. W.,  McGouldrick,  K.,  Drossart,  P.,  Piccioni,  G.,  andTellmann, S., Icarus 217(2), 542–560 (2012).

[5]  De Rooij, W. and Stap, Van Der, C., Astronomy and astrophysics (Berlin. Print) 131(2), 237–248 (1984).

[6]  Stam,  D.  M.,  De  Haan,  J.  F.,  Hovenier,  J.  W.,  and  Stammes,  P., Journal of Quantitative Spectroscopy and RadiativeTransfer 64(2), 131–149 (2000).

[7]  Tsang, C. C., Irwin, P. G., Taylor, F. W., and Wilson, C. F., Journal of Quantitative Spectroscopy and Radiative Transfer 109(6), 1118–1135 (2008).

[8]  Meadows, V. S. and Crisp, D., Journal of Geophysical Research: Planets 101(E2), 4595–4622 (1996).

[9]  Lebonnois, S. and Schubert, G., Nature Geoscience 10(7), 473–477 (2017).

How to cite: Kulkarni, S., Mueller, N., Stam, D., and Lebonnois, S.: Near-IR Investigation of the Thermal Structure of Venusian Deep Atmosphere, Europlanet Science Congress 2021, online, 13–24 Sep 2021, EPSC2021-730, https://doi.org/10.5194/epsc2021-730, 2021.

EPSC2021-678
Séverine Robert, Caterina Macovenco, Maxence Lefèvre, Colin Wilson, Emmanuel Marcq, Bruno Bézard, Jörn Helbert, and Ann Carine Vandaele

The VenSpec-H instrument is part of the EnVision payload which is currently being evaluated by ESA for mission selection. EnVision is a medium class mission to determine the nature and current state of geological activity on Venus, and its relationship with the atmosphere, to understand how Venus and Earth could have evolved so differently.

VenSpec-H is part of the VenSpec suite [1], including also an IR mapper and a UV spectrometer [2] suite. The science objectives of this suite are to search for temporal variations in surface temperatures and tropospheric concentrations of volcanically emitted gases, indicative of volcanic eruptions; and study surface-atmosphere interactions and weathering by mapping surface emissivity and tropospheric gas abundances. Recent and perhaps ongoing volcanic activity has been inferred in data from both Venus Express and Magellan. Maintenance of the clouds requires a constant input of H2O and SO2. A large eruption would locally alter the composition by increasing abundances of H2O, SO2 and CO and perhaps decreasing D/H ratio. Observations of changes in lower atmospheric SO2, CO and H2O vapour levels, cloud level H2SO4 droplet concentration, and mesospheric SO2, are therefore required to link specific volcanic events with past and ongoing observations of the variable and dynamic mesosphere, to understand both the importance of volatiles in volcanic activity on Venus and their effect on cloud maintenance and dynamics.

To contribute to this investigation, VenSpec-H is designed to measure H2O and HDO contents in the first scale height of Venus’ atmosphere and probe H2O, HDO, CO, OCS, SO2 in the 30 to 40 km altitude range [3-8]. To assess the performances of our instrument at detecting volcanic eruptions, we defined a couple of scenarios of plume releases and simulated the corresponding spectra.

To simulate the vertical transport of the plume and the horizontal advection by the dynamics, the LMD Venus Mesoscale Model [9] is used, based on the WRF dynamical core and the Venus IPSL radiative transfer. The domain is focused on Imdr Regio, where VIRTIS observed a hotspot anomaly possibly linked to volcanic activity [10]. Tracers were added to the model representing H2O, CO and SO2.  The chemistry and photodissociation sources and sinks are modelled by a linear relaxation of the tracer abundance toward a value representative of the deep atmosphere with a characteristic time. The deep atmosphere abundance is set to 130 ppm for SO2, 30 ppm for H2O and 20 ppm for CO. The relaxation time is set to 100 years for SO2, to 1000 years for CO and to 1 week, 1 month and 1 year for H2O representing the uncertainty of the chemistry timescale in that region. Several configurations are considered for the plume, an idealised set-up where the elevation height is fixed and the outgassing abundance is constant inside the plume and in time, and a more realistic set-up where a temperature and outgassing anomalies at the surface are prescribed is ongoing testing.

The radiances of the nightside atmosphere of Venus originate from the thermal emission of the surface and atmosphere. The spectra were simulated from 1 to 2.5 microns, using ASIMUT-ALVL, a line-by-line radiative transfer code developed at BIRA-IASB [11]. CO2, H2O, HDO, CO, SO2, and OCS, as well as aerosols were included.

The performances of the instrument will be described in terms of its capabilities to detect small variations in the atmosphere.


References

[1] J. Helbert et al., “The VenSpec suite on the ESA EnVision mission to Venus”, Proc. SPIE 11128, Infrared Remote Sensing and Instrumentation XXVII, 1112804 (2019).

[2] E. Marcq et al., “Instrumental requirements for the study of Venus’ cloud top using the UV imaging spectrometer VeSUV”, Advances in Space Research, 68 (2021) 275-291.

[3] B. Bézard et al., “Water vapor abundance near the surface of Venus from Venus Express/VIRTIS observations,” Journal of Geophysical Research, Planets, 114 (2009) E00B39.

[4] B. Bézard et al., “The 1.10- and 1.18-μm nightside windows of Venus observed by SPICAV-IR aboard Venus Express,” Icarus, 216 (2011) 173–183.

[5] A. Fedorova et al., “The CO2 continuum absorption in the 1.10-and 1.18-μm windows on Venus from Maxwell Montes transits by SPICAV IR onboard Venus Express,” Planetary and Space Science, 113 (2015) 66-77.

[6] E. Marcq et al., “Remote sensing of Venus’ lower atmosphere from ground-based IR spectroscopy: latitudinal and vertical distribution of minor species,” Planetary and Space Science, 54 (2006) 1360-1370.

[7] E. Marcq et al., “A latitudinal survey of CO, OCS, H2O,and SO2 in the lower atmosphere of Venus: spectroscopic studies using VIRTIS-H,” Journal of Geophysical Research, Planets, 113 (2008) E00B07.

[8] E. Marcq et al., “Evidence for SO2 latitudinal variations below the clouds of Venus”, Astronomy & Astrophysics, 648 (2021) L8.

[9] M. Lefèvre, A. Spiga and S. Lebonnois, “Mesoscale modeling of Venus' bow-shape waves”, Icarus, 335 (2019) 113376.

[10] E. Smrekar, et al., “Recent Hotspot Volcanism on Venus from VIRTIS Emissivity”, Data. Science, 328 (2010) 605.

[11] A.C. Vandaele, M. Kruglanski and M. De Mazière, “Modeling and retrieval of atmospheric spectra using ASIMUT”, Proc. of the First 'Atmospheric Science Conference', ESRIN, Frascati, Italy, 2006.


How to cite: Robert, S., Macovenco, C., Lefèvre, M., Wilson, C., Marcq, E., Bézard, B., Helbert, J., and Vandaele, A. C.: Detecting Venus’ volcanic gas plumes with VenSpec-H, Europlanet Science Congress 2021, online, 13–24 Sep 2021, EPSC2021-678, https://doi.org/10.5194/epsc2021-678, 2021.

PART III: ATMOSPHERIC STRUCTURE & DYNAMICS (40 km+)
EPSC2021-41
Hiroki Ando, Kotaro Takaya, Masahiro Takagi, Norihiko Sugimoto, Takeshi Imamura, Hideo Sagawa, Silvia Tellmann, Martin Pätzold, Yoshihisa Matsuda, Bernd Häusler, Sanjay Limaye, Raj Kumar Choudhary, and Maria Antonita

Distributions of temperature and static stability in the Venus atmosphere consistent with recent radio occultation measurements are reproduced using a general circulation model. A low-stability layer is maintained at low- and mid-latitudes at 50–60 km altitude and is sandwiched by high- and moderate-stability layers extending above 60 and below 50  km, respectively. In the polar region, the low-stability layer is located at 46–63 km altitude and the relatively low-stability layer is also found at 40–46 km altitude. To investigate how these thermal structures form, we examine the dynamical effects of the atmospheric motions on the static stability below 65 km altitude. The results show that the heat transport due to the mean meridional circulation is important at low-latitudes. At mid- and high-latitudes, meanwhile, the baroclinic Rossby-type wave plays an important role in maintaining the thermal structure. In addition, appreciable equatorward heat transport is found to maintain the deep and low-stability layer in the polar region, which might be induced by the interaction between the baroclinic Rossby-type wave in the low-stability layer and the trapped Rossby-type wave below it.

How to cite: Ando, H., Takaya, K., Takagi, M., Sugimoto, N., Imamura, T., Sagawa, H., Tellmann, S., Pätzold, M., Matsuda, Y., Häusler, B., Limaye, S., Choudhary, R. K., and Antonita, M.: Dynamical effect on the Venusian thermal structure simulated by a general circulation model, Europlanet Science Congress 2021, online, 13–24 Sep 2021, EPSC2021-41, https://doi.org/10.5194/epsc2021-41, 2021.

EPSC2021-40
|
ECP
José Silva, Pedro Machado, Javier Peralta, Francisco Brasil, Sebastien Lebonnois, and Maxence Lefèvre

An atmospheric internal gravity wave is a oscillatory disturbance on an atmospheric layer in which buoyancy acts as the restoring force. As such, they can only exist in a continuously stably stratified atmosphere, that is, a fluid in which the static stability is positive and horizontal variations in pressure are negligible when compared to the vertical variations (in altitude) [Gilli et al. 2020; Peralta et al. 2008]. These waves are of particular interest because they represent an effective means of energy and momentum transport across various layers of a planetary atmosphere, as these waves can form on one atmospheric region and travel through the atmosphere, sometimes over great distances, and dump their contained energy upon wave dissipation or breaking [Alexander et al. 2010]. Given these properties, study of atmospheric waves on Venus becomes important as another tool to answer some of the fundamental question surrounding its atmosphere dynamics, mainly the origin and support mechanism of the remarkable superrotation of the atmosphere.
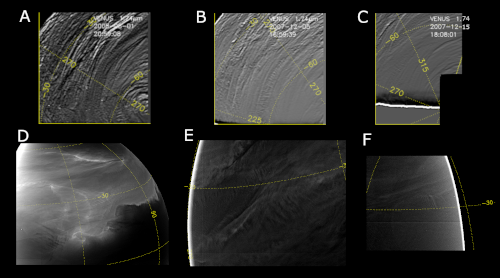
We present here the final results on a study conducted on the nightside lower cloud of Venus to detect and characterise mesoscale waves. This analysis was conducted with infrared imaging data from both the Visible and Infrared Thermal Imaging Spectrometer (VIRTIS) onboard Venus Express (Vex) [Svedhem et al. 2007] and the 2-micron camera (IR2) onboard Akatsuki [Nakamura et al. 2011, Satoh et al. 2016] space missions. We covered the entire VIRTIS-M-IR archive selecting the 1.74- and 2.25-micron wavelengths as well as all available images from the IR2 camera at 2.26 microns to ensure a most comprehensive survey and through image navigation and processing we were able to characterise approximately 300 wave packets across more than 5500 images over a broad range of latitudes on Venus. From these waves we retrieved basic morphological properties such as horizontal wavelength, number of crests and the full extent of the wave. Additionally, we were able to track the evolution of waves as they moved on the atmosphere, enabling some dynamical characterisation. The panel below shows examples of atmospheric waves observed in this study. Figures A-C show VIRTIS-M-IR images while figures D-F show IR2 data. All images have been subject to contrast enhancement techniques to improve observability of waves.

Our goal was to provide a survey on atmospheric waves in the lower cloud as complete as possible, using two different instruments which cover in detail different sections of the globe of Venus over a long-time span, expanding on other studies performed by Peralta et al. (2008), (2019). With the larger data base, we discuss the nature of these waves, possible forcing mechanisms, and their relationship with the background atmosphere. Several questions remain however, such as how much energy do these waves transport in the cloud layer and how much do they contribute to Venus’ superrotation and if there is a dominant source of excitation for these waves. Full details of these results can be found in Silva et al. (2021) and we hope that these updated results can prove useful to recent and future models of Venus atmosphere as well as atmosphere of other slow rotators in the Solar System.


References

  • Alexander M.J. et al, Quarterly Journal of the Royal Meteorological Society, vol. 136, pp. 1103-1124, 2010;
  • Gilli G. et al, Journal of Geophys. Research – Planets, ID. e05873, 2020;
  • Nakamura M. et al, Earth, Planets and Space, vol. 63, pp. 443-457, 2011;
  • Peralta J. et al, Journal of Geophysical Research, vol. 113, ID. E00B18, 2008;
  • Peralta J. et al, Icarus, vol. 333, pp. 177-182, 2019;
  • Satoh T. et al, Earth, Planets and Space, vol. 68, ID. 74, 2016;
  • Silva J. et al, A&A, vol. 649, ID. A34, 2021;
  • Svedhem H. et al, Planetary and Space Science, vol. 55, pp. 1636-1652, 2007;

How to cite: Silva, J., Machado, P., Peralta, J., Brasil, F., Lebonnois, S., and Lefèvre, M.: Final Results on Atmospheric Wave Characterisation on the Nightside Lower Clouds of Venus, Europlanet Science Congress 2021, online, 13–24 Sep 2021, EPSC2021-40, https://doi.org/10.5194/epsc2021-40, 2021.

EPSC2021-552
|
ECP
Pablo Rodriguez-Ovalle and Itziar Garate-Lopez

Venus has one of today’s most unknown atmospheres with one of the unsolved mysteries being the origin and maintenance of its polar vortices. Although the current orbiting espacecraft, the Japanese Akatsuki, cannot adequately observe the planet's poles, the previous European Space Agency’s Venus Express mission studied the south polar vortex for more than 7 years. The VIRTIS-M imaging spectrometer observed this peculiar atmospheric structure and its constantly changing shape day after day from 2006 to 2014. This translates into an immense amount of data, which is still not fully exploited today.

Some time ago we obtained preliminary maps of the Ertel potential vorticity [1], a characteristic magnitude in the study of fluid dynamics as it is conserved following the full three-dimensional motions of an air parcel. However, the number of data-cubes we were able to analyse did not allow us to draw statistically strong conclusions. We now aim to improve these statistics in order to confirm or disprove previously observed trends, such as the annular shape of the potential vorticity at the upper cloud level or the anti-correlation between the structures visible in thermal infrared (the most characteristic structures of the Venus’ polar vortex) and the potential vorticity’s peaks [1].

To this end, here we will present new measurements of the wind field at two atmospheric levels (~42 km above the surface and ~62 km) using images at 1.74 microns and at 3.8 or 5.1 microns obtained by the VIRTIS instrument for about 10 different dates and morphologiess. We measured the wind velocity by cloud tracking in more than one pair of images per date.

We will also present new measurements of three-dimensional distribution of the air temperature. The VIRTIS instrument provides us with spectra for each pixel of the image in the range 1.0 - 5.1 microns. Using radiative transport and inversion techniques [2], we know how to calculate the spatial distribution of the temperature field for several atmospheric layers between 55 and 85 km height [3]. We intend to obtain temperature maps for the lower and upper cloud layers in as many pairs of images as possible, thus studying both the short and long term evolution.

And finally, with wind and temperature fields’ distribution at both cloud layers in our hands, we will try to construct and exhibit Ertel’s potential vorticity maps.


References

[1] I. Garate-Lopez, R. Hueso, A. Sánchez-Lavega, A. García Muñoz. Potential Vorticity of the South Polar Vortex of Venus. Journal of Geophysical Research: Planets 121, 574-593 (2016). https://doi.org/10.1002/2015JE004885

[2] D. Grassi, et al., 2008. Retrieval of air temperature profiles in the venusian mesosphere from VIRTIS-M data: Description and validation of algorithms. Journal of Geophysical Research: Planets 113, 1–12. https://doi.org/10.1029/2008JE003075

[3] I. Garate-Lopez, A. García Muñoz, R. Hueso, A. Sánchez-Lavega. Instantaneous three- dimensional thermal structure of the South Polar Vortex of Venus. Icarus 245, 16-31 (2015). https://doi.org/10.1016/j.icarus.2014.09.030

How to cite: Rodriguez-Ovalle, P. and Garate-Lopez, I.: More on the dynamics of Venus’ South Polar Vortex from VIRTIS-VEx observations, Europlanet Science Congress 2021, online, 13–24 Sep 2021, EPSC2021-552, https://doi.org/10.5194/epsc2021-552, 2021.

EPSC2021-297
|
ECP
Daniela Espadinha, Pedro Machado, Thomas Widemann, Javier Peralta, José Silva, and Francisco Brasil

Introduction

One of the most crucial bases and tools in planetary sciences is the general circulation model of a planet’s atmosphere. These models come as a result of the analysis of great amounts of observations, in order to accurately describe the atmospheric circulation of a planet. For Venus, the better understanding of cloud circulation can yield important results such as the possibility to explain and describe one of its most fascinating characteristics: the superrotation of Venus’ atmosphere.

Methods and Tools

The cloud-tracking method consists of an analysis of a pair of navigated and processed images, provided that we know the time interval between both. It is possible to probe the motion of cloud features between the initial and second image, either by matching specific points or areas in both images.  This matching process allows us to measure displacements and velocities of cloud features and deduct the average velocity for a certain cloud layer of the atmosphere, selected in the wavelength range of the observations (Peralta et al. 2018).

The use of an evolved tool of cloud tracking based on phase correlation between images and other softwares (Hueso et al. 2010) allows to explore Venus' atmospheric dynamics based on coordinated space and ground observations including Akatsuki UVI instrument, TNG/HARPS-N, and data from BepiColombo’s first Venus' flyby. Images used were navigated and processed for optimal identification of cloud features which help with the matching processes described above.

The main goal of this work was to build wind profiles in different wavelengths which allow us to analyse several layers of the Venusian atmosphere. We present some results of this study following the works of Sánchez-Lavega et al. 2008, Hueso et al. 2013 and Horinouchi et al. 2018 and compare them with ground-based Doppler measurements (Machado et al. 2021).

The Doppler velocimetry method mentioned in this work was initially developed by Thomas Widemann (Widemann et al., 2008) and further evolved by Pedro Machado for both long slit and fibre-fed spectrographs, using UVES/VLT and ESPaDOnS/CFHT respectively (Machado et al., 2012, 2014).  This technique is based on solar light scattered on Venus’ dayside to provide instantaneous wind velocities measurements of its atmosphere. The sunlight is absorbed by cloud particles in Venus’ top clouds and then re-emitted in Earth’s direction in a single back-scatter approximation (Machado et al., 2012, 2014, 2017).   

Another goal of this study is connected to the detection and characterisation of atmospheric gravity waves. These waves are oscillatory disturbances on an atmospheric layer in which buoyancy acts as the restoring force. They can only exist in stably stratified atmospheres, that is, a fluid in which density varies mostly vertically (Silva et al. 2021).

Results

With this work we present new results of studies of zonal and meridional winds in both Venus’ hemispheres, using ground- and space-based coordinated observations. The wind velocities retrieved from space used an improved cloud-tracked technique and the results obtained from telescope observations were retrieved with a Doppler velocimetry method, both already described in “Methods and Tools”. There is evidence that the altitude level sensed by the Doppler velocimetry method is approximately four kilometres higher than that using ground-tracked winds which is shown by models which predict wind profiles developed at the Laboratoire de Meteorologie Dynamique (Machado et al. 2021).


References

[1] Hueso et al., The Planetary Laboratory for Image Analysis (PLIA). Advances in Space Research, 46(9):1120–1138, 2010. 

[2] Sánchez-Lavega et al., Variable winds on Venus mapped in three dimensions. Geophysical Research Letters, 35 (13), 2008

[3] Hueso et al., Venus winds from ultraviolet, visible and near infrared images from the VIRTIS instrument on Venus Express.  2013.

[4] Horinouchi et al., Mean winds at the cloud top of venus obtained from two-wavelength UV imaging by Akatsuki. Earth, Planets and Space, 70:10, 2018.

[7] Machado et al., Characterizing the atmospheric dynamics of Venus from ground-based Doppler velocimetry, Icarus, Volume 221, p.248-261, 2012.

[6] Machado et al., Wind circulation regimes at Venus’ cloud tops: Ground-based Doppler velocimetry using CFHT/ESPaDOnS and comparison with simultaneous cloud tracking measurements using VEx/VIRTIS in February 2011, Icarus, 2014.

[7] Machado et al., Venus Atmospheric Dynamics at Two Altitudes: Akatsuki and Venus Express Cloud Tracking, Ground-Based Doppler Observations and Comparison with Modelling. Atmosphere 2021, 12, 506.

[8] Machadoet al., Venus cloud-tracked and Doppler velocimetry winds from CFHT/ESPaDOnS and Venus Express/VIRTIS in April 2014. Icarus, vol. 285, p. 8-26, 2017.

[9] Peralta et al., Nightside Winds at the Lower Clouds of Venus with Akatsuki/IR2: Longitudinal, Local Time, and Decadal Variations from Comparison with Previous Measurements. The American Astronomical Society. The Astrophysical Journal Supplement Series, Volume 239, Number 2, 2018

[10] Widemann et al., Venus Doppler winds at cloud tops observed with ESPaDOnS at CFHT, Planetary and Space Science, Volume 56, p. 1320-1334, 2008.

[11] Silva et al., Characterising atmospheric gravity waves on the nightside lower clouds of Venus: a systematic analysis, A&A 649 A34, 2021.


Acknowledgements

We thank the JAXA’s Akatsuki team for support with coordinated observations. We gratefully acknowledge the collaboration of the TNG staff at La Palma (Canary Islands, Spain) - the observations were made with the Italian Telescopio Nazionale Galileo (TNG) operated on the island of La Palma by the Fundación Galileo Galilei of the INAF (Istituto Nazionale di Astrofisica) at the Observatorio del Roque de los Muchachos of the Instituto de Astrofisica de Canarias. We acknowledge support from the Portuguese Fundação Para a Ciência e a Tecnologia (ref. PTDC/FIS-AST/29942/2017) through national funds and by FEDER through COMPETE 2020 (ref. POCI-01-0145 FEDER-007672) and through a grant of reference 2020.06389.BD.

How to cite: Espadinha, D., Machado, P., Widemann, T., Peralta, J., Silva, J., and Brasil, F.: Venus Dynamics on the framework of Bepicolombo flyby to Venus and Akatsuki UVI coordinated observations with TNG HARPS-N observations, Europlanet Science Congress 2021, online, 13–24 Sep 2021, EPSC2021-297, https://doi.org/10.5194/epsc2021-297, 2021.

PART IV: TRACERS & CHEMISTRY (40 km+)
EPSC2021-631
|
ECP
Maxence Lefèvre, Emmanuel Marcq, Thérèse Encrenaz, and Franck Lefèvre

1. Introduction
Venus is hosting a global sulfuric acid cloud layer between 45 and 70 km which has been investi- gated by the Venus Express and Akatsuki mission as well as its coupling with the surface. One of the main questions that remains unclear about the dynamics of the Venusian atmosphere is how this convective cloud layer mixes momentum, heat, and chemical species and generates gravity waves. Several models have been developed to study these phenomenons. We proposed to use these models to study the impact of this turbulence on the chemical species, focusing on water and sulfuric dioxide.

2. Model
To study the convective layer, a Large Eddy Simulations (LES) model [1] has been developed using the Weather-Research Forecast (WRF) non-hydrostatic dynamical core [2] coupled with the IPSL Venus GCM physics package [3]. The model is able to resolve a realistic convective layer between 47 and 55 km as well as one convective layer at cloud top altitudes (70 km) at the substellar point (Fig 1).

Figure 1: Vertical cross-section of the vertical wind (m/s) at the Equator at noon. Between 47 and 55 km is the main convective layer, between 55 and 67 km are the gravity waves induced by convection and between 67 and 73 is the cloud top convective layer presents only at the substellar point.

Tracers has been included in the model representing H2O and SO2, the chemistry and photodissociation sources and sinks are modeled by a linear relaxation of the tracer abundance toward a prescribed vertical profile with a characteristic time. The relaxation time ranges from 102 to 106 s. The prescribed vertical tracer profiles are constructed using observed abundance visible in Fig 2.

Figure 2: Vertical profile of the tracer abudance relaxation profile. The black represents the value for the deep atmosphre [4], the star is the SO2 ground based observations at 65 km [5] and the circle is the cloud top H2O Venus Express value [6, 7].

3. Results
This simple model is able to determine the vertical mixing for  SO2 and H2O in the cloud layer, and for which chemical timescale the convection plays an important role. The resolution of 500 m allow an estimate of the horizontal turbulent spatial features, induced by the convection and gravity waves, for SO2 and H2O.

References
[1] Lefèvre et al., JGR : Planets, 123, 2773-2789, 2018.
[2] Skamarock, W. C. and J. B. Klemp, J., Comput. Phys., 227, 3465-3485, 2008
[3] Garate-Lopez, I. and Lebonnois., S., Icarus, 314,1-11, 2018.
[4] Bézard, B. and De Bergh, C., JGR : Planets, 112, 2007.
[5] Encrenaz, T. et al., A. & A., 595, 2016.
[6] Fedorova, A. et al., Icarus, 275, 143-162, 2016.
[7] Cottini., V. et al., Icarus, 217, 561-569, 2012.

How to cite: Lefèvre, M., Marcq, E., Encrenaz, T., and Lefèvre, F.: Turbulent vertical mixing of H2O and SO2 in the Venus cloud layer, Europlanet Science Congress 2021, online, 13–24 Sep 2021, EPSC2021-631, https://doi.org/10.5194/epsc2021-631, 2021.

EPSC2021-196
|
ECP
Janusz Oschlisniok, Bernd Häusler, Martin Pätzold, Silvia Tellmann, and Michael Bird

The main cloud deck within Venus' atmosphere, which covers the entire planet between approx. 50 and 70 km altitude, is believed to consist mostly of liquid sulfuric acid. The temperature below the main clouds is high enough to evaporate the H2SO4 droplets into gaseous sulfuric acid forming a haze layer which extends to altitudes as deep as 35 km. Gaseous sulfuric acid in Venus’ lower atmosphere is responsible for a strong absorption of radio waves as seen in Mariner, Pioneer Venus, Magellan and Venera radio science observations. Radio wave absorption measurements can be used to derive the amount of H2SO4 in Venus’ atmosphere. The radio science experiment VeRa onboard Venus Express probed the atmosphere of Venus between 2006 and 2014 with radio signals at 13 cm (S-band) and 3.6 cm (X-band) wavelengths. The orbit of the Venus Express spacecraft allowed to sound the atmosphere over a wide range of latitudes and local times providing a global picture of the sulfuric acid vapor distribution. We present the global H2SO4(g) distribution derived from the X-band radio signal attenuation for the time of the entire Venus Express mission. The observation is compared with results obtained from a 2-D transport model. The VeRa observations were additionally used to estimate the abundance of SO2 near the cloud bottom. The global distribution of SO2 at these altitudes is presented and compared with results obtained from other experiments. Eight years of VEX observation allow to study the long-term evolution of H2SO4 and SO2. The latter is presented for the northern polar region.

How to cite: Oschlisniok, J., Häusler, B., Pätzold, M., Tellmann, S., and Bird, M.: Sulfuric acid vapor and sulfur dioxide in the atmosphere of Venus as observed by the Venus Express Radio Science Experiment VeRa, Europlanet Science Congress 2021, online, 13–24 Sep 2021, EPSC2021-196, https://doi.org/10.5194/epsc2021-196, 2021.

EPSC2021-709
Paul Rimmer

Droplet chemistry in the clouds of Venus may play a role in regulating the depletion of sulfur dioxide and water vapor in and above the clouds. The specific nature of this chemistry is unknown. In this talk, I present three different scenarios for aqueous chemistry in the cloud droplets:

  • Hydroxide salts
  • Reduced sulfites
  • Iron sulfates

I will discuss the effects of these three different aqueous chemistries, some of which may be accessible via remote observation. The iron sulfate chemistry in particular provides a candidate for the unknown UV absorber.

How to cite: Rimmer, P.: Aqueous chemistry in the clouds of Venus, Europlanet Science Congress 2021, online, 13–24 Sep 2021, EPSC2021-709, https://doi.org/10.5194/epsc2021-709, 2021.

EPSC2021-455
|
ECP
hongkun qu, Alian Wang, and Elijah Thimsen

The electrochemical process generated by simulation experiments of Venusian lightning

Hongkun Qu1,3, Alian Wang1, and and Elijah Thimsen2

1Dept. of Earth and Planetary Sciences and the McDonnell Center for the Space Sciences, 2McKelvey School of Engineering, Washington University in St. Louis, One Brookings Drive, St. Louis, MO, 63130, USA. One Brookings Drive, St. Louis, MO, 63130, USA. 3Shandong Key Laboratory of Optical Astronomy and Solar-Terrestrial Environment, School of Space Science and Physics, Institute of Space Sciences, Shandong University, Weihai, Shandong,264209, China. (hongkun.qu@wustl.edu )


Introduction

Lightning (one type of electrostatic discharge), as an important electrical process for planets with atmosphere, which has been detected on many planets in our solar system, e.g., Earth, Jupiter [1], Saturn [2], Uranus [3], and Neptune [3], and might occur on Mars [4], Venus [5], and Tian [6]. The earliest observation of Venus lightning was reported by Ksanfomaliti … mission name [7]. Afterward, many more ground-based [8] and mission observations on electrical and optical evidence of Venus lightning were reported [9]. The Venus Climate Orbiter (VCO) and Planet-C, observed an intense optical flash that was assigned to lightning in 2020 [10].

Electrons with high kinetic energy generated by Venusian lightning would collide with atmospheric gaseous molecules and dissociate, excite these radicals, including atoms and molecules at excited states, have high chemical activity. Electrochemical reactions among these species would create new species that would not be produced in common Venusian chemical reactions.

Experimental results

We conducted a series of simulation experiments on Venusian lightning in a newly designed Venus-ESD-Chamber (VEC). We report here the radicals detected during ESD in VEC under CO2 and gas mixture of N2, O2, CO2, H2O, Ar. Different types of discharges would generate numbers of radical species which indicate that electrochemical reactions take place during and after discharge.

In collected plasma spectra of ESD in gas mixture, the emission lines of N2, N2+, N, N+, NO, OH, O, O+, Ar, and Ha were observed and may be generated by the following reactions:


N2 + e → N2* + e             (1)

N2 + e → N2+ + e             (2)

N2 + e → N + N + e            (3)

N + e → N+ + e               (4)

O2 + e → O + O + e            (5)

O + e → O+ + 2e              (6)

N2 + O → NO + N              (7)

H2O + e → OH + H + e        (8)

Ar + e → Ar* + e                   (9)

Emission lines of CO2+, CO, CO+, C, C2, C+, O, O+, and OH were observed in spectra of CO2 electrostatic discharge, the possible electrochemical reactions are as follows:

CO2 + e → CO2* + e                      (10)

CO2 + e → CO2+ + 2e                     (11)

CO2 + e → CO + O + e                  (12)

CO2 + e → C+ + O2 + 2e                 (13)

CO2 + e → CO+ + O + 2e               (14)


These active radicals would play significant rules in the evolutions of the Venusian atmosphere.

Further Work: For the next step, we will conduct ESD in SO2 gas and in SO2 + CO2 gas with different concentrates for investigations of sulfur species generated in ESD.


Acknowledgments: This work was supported by the CSC scholarship (NO. 201906220244) for HKQ to support his joint-training Ph.D. study at Washington University in St. Louis, and by spectral funding 94351A of WUSTL_MCSS to AW to maintain a collaboration with planetary scientists and students from Shandong University in China.


Reference:

[1]      D. A. Gurnett, R. R. Shaw, R. R. Anderson, W. S. Kurth, and F. L. Scarf, Geophys. Res. Lett., 1979.

[2]      K. H. Baines et al., Planet. Space Sci., 2009.

[3]      K. Aplin, Springer Science & Business Media, 2013.

[4]      W. M. Farrell and M. D. Desch, J. Geophys. Res. Planets, 2001.

[5]      W. W. L. Taylor, F. L. SCARF, C. T. RUSSELL, and L. H. BRACE, Nature, 1979.

[6]      R. Lorenz, J. Phys. IV, 2002.

[7]      L. V Ksanfomaliti, F. L. Scarf, and W. W. L. Taylor, Venus, 1983.

[8]      S. A. Hansell, W. K. Wells, and D. M. Hunten, Icarus, 1995.

[9]      R. D. Lorenz, Prog. Earth Planet. Sci., 2018.

[10]    Y. Takahashi et al., Nat. Portf., 2021.


How to cite: qu, H., Wang, A., and Thimsen, E.: The electrochemical process generated by simulation experiments of Venusian lightning, Europlanet Science Congress 2021, online, 13–24 Sep 2021, EPSC2021-455, https://doi.org/10.5194/epsc2021-455, 2021.

EPSC2021-220
Takao Sato and Hideo Sagawa

The atmosphere of Venus can be vertically divided into three regions with different chemical conditions. High temperature and pressure and the absence of effective photolysis processes are dominant in the lower atmosphere up to 60 km. The middle atmosphere between 60 and 110 km is controlled by photochemistry driven by solar UV radiation. In the upper atmosphere above 110 km, dissociation, ionization, and ionospheric reactions are important processes.

HCl is the primary chlorine reservoir in the Venus’ atmosphere below 110 km. Highly reactive chlorine species (ClOx) is produced by solar UV photolysis of HCl and has been proposed to play an important role in catalysis of CO and O recombination to CO2, thereby stabilizing the CO2 atmosphere. Chlorine chemistry is also linked to sulfur chemistry and its understanding is necessary to explain the observed vertical distribution of SO2.

Interestingly, there is a large inconsistency between the HCl abundances measured by spacecraft and ground-based telescopes. The SOIR instrument onboard Venus Express measured its abundance as less than ~50 ppb at the cloud top (~70 km) increasing with altitude, reaching to 1 ppm in the upper atmosphere (~110 km) [Mahieux et al., 2015]. Such a vertical trend conflicts with the results obtained by sub-mm ground-based observations which inferred a vertically constant profile (up to ~80 km) [Sandor and Clancy, 2012]. Near-infrared ground-based observations also showed the HCl abundance at the cloud top as ~500 ppb [Iwagami et al., 2008; Krasnopolsky, 2010], which are nearly one order of magnitude larger than the SOIR results. The reason for this inconsistency has not been understood yet.

In order to re-examine HCl abundance at the cloud top, we carried out a high-resolution spectroscopy of Venus’ dayside at wavelengths of 3.580-3.934 μm with IRTF/iSHELL on August 5-7, 2018 and August 18-20, 2020 (UT). Venus was near its greatest eastern and western elongations, respectively, in the observation periods. Taking the full advantages of iSHELL’s high spectral resolution of R ~ 75,000, iSHELL resolved individual HCl lines with sufficient separation from terrestrial lines. We analyzed three cross-dispersed echelle orders (orders 141, 142, and 144). For each order, retrievable lines of HCl35, HCl37, and O16C12O18 were included. With using radiative transfer modeling, HCl35 and HCl37 abundances were derived after cloud top altitude was retrieved from several O16C12O18 lines. Our preliminary results showed that HCl abundance at the cloud top is at least larger than 100 ppb and does not vary with the observation period (i.e., no difference between the morning and evening hemispheres).

In this presentation, we show latitudinal distribution of HCl abundance and its isotopic (HCl35/HCl37) ratio at the cloud top, retrieved from the iSHELL spectra and compare them with the previous studies.

How to cite: Sato, T. and Sagawa, H.: Ground-based measurements of HCl abundance at the cloud top of Venus, Europlanet Science Congress 2021, online, 13–24 Sep 2021, EPSC2021-220, https://doi.org/10.5194/epsc2021-220, 2021.

EPSC2021-739
|
ECP
Daria Evdokimova, Anna Fedorova, Denis Belyaev, Franck Montmessin, Oleg Korablev, and Jean-Loup Bertaux

Introduction

Infrared O21Δg) airglow at 1.27 μm on the night side of Venus was for the first time identified during ground-based observations in 1975 (Connes et al., 1979). The airglow reaches its maximal intensity at ~96 km. These altitudes correspond to the transitional region between two regimes of global atmospheric circulation on Venus. Below 70 km, the cloud layer is involved in the zonal super-rotation. At altitudes higher than 110 km, the subsolar to anti-solar (SSAS) circulation transfers atoms and ions produced by photolysis in the sunlit hemisphere to the night side. Here, dowelling oxygen atoms recombine to the exited O21Δg) molecules which radiative relaxation to the ground state results in the IR emission formation. Thus, the O21Δg) airglow is a tracer of the dynamical processes occurring in the 90-100 km range on the night side.

The maximal emission brightness was observed around the anti-solar point by ground-based and orbital measurements; this result demonstrated a domination of the SSAS circulation in the 90-100 km range. The VIRTIS-M infrared spectrometer on board the Venus Express spacecraft studied in detail the morphological features of the emission in 2006-2009 (Gérard et al., 2008; Piccioni et al., 2009; Shakun et al., 2010; Soret et al., 2012). Gérard et al. (2008) and Piccioni et al. (2009) concluded that intensity of the anti-solar emission maximum is ​​equal to 3 МR and 1.2 МR respectively. The work of Shakun et al. (2010) revealed a slight shift of the nightglow's statistical maximum towards the evening terminator and a latitude of ~10° N. However, a simultaneous independent analysis of VIRTIS-M limb and nadir observations (Soret et al., 2012) confirmed the previous conclusions. 

Analysis of the SPICAV IR observations contributes to the O21Δg) airglow study. The instrument dataset extends the long-term and latitudinal coverage of the VIRTIS-M experiment, which poorly observed the Northern Hemisphere of Venus at night. 

Data analysis

The SPICAV IR instrument (0.65-1.7 µm) accumulated a dataset encompassing almost the entire Venus globe by nadir night observations in 2006-2014. The spatial resolution changes in range of 50-1000 km depending on the spacecraft distance to the planet due to the orbit elongation (Korablev et al., 2012). The SPICAV IR spectral range also covers several transparency windows where the thermal emission originating from the Venus deep atmosphere and surface escapes to space. The transparency window at 1.28 μm overlaps the O21Δg) emission band at 1.27 μm. However, the high resolving power of the spectrometer (~1400) allows a robust algorithm to extract the oxygen emission spectrum. For each measurement Venus thermal emission is optimized by a 1-D radiative transfer model with multiple scattering. The direct model is computed by the SHDOMPP program solving the radiative transfer equation by the method of discrete ordinates and spherical harmonics in a plane-parallel atmosphere. This routine developed by Bézard et al. (2011) and Fedorova et al. (2015) is used in this study with a cloud layer model of Haus et al. (2016). The thermal emission model is computed for three atmospheric windows at 1.1, 1.18 and 1.28 μm to increase the accuracy, and it is set by 3 free parameters: a scaling factor applied to mode 2 and 3 particle distributions of the cloud layer model, the H2O mixing ratio in the lower atmosphere of Venus and the surface emissivity.

Result

In total, 605 sessions of nadir observations (~6000 spectra) with chosen emission angle ≤2° were analysed. Based on these observations, the local time and latitude distribution of the O2 (α1Δg) airglow in the night hemisphere was obtained. It has the maximum at the anti-solar point with the intensity value of ~2 MR. An emission tendency to be slightly shifted towards the morning terminator can be suggested. In general, the pattern is fairly symmetrical about the equator. The result is in correspondence with the analysis of VIRTIS data (Shakun et al., 2010; Soret et al., 2012).

References

Bézard, B., et al., 2011. The 1.10-and 1.18-μm nightside windows of Venus observed by SPICAV-IR aboard Venus Express. Icarus, 216(1), 173- 183.

Connes, P. et al., 1979. O2(1Δ) emission in the day and night airglow of Venus. The Astrophysical Journal, 233, L29-L32.

Fedorova, A., et al., 2015. The CO2 continuum absorption in the 1.10-and 1.18-μm windows on Venus from Maxwell Montes transits by SPICAV IR onboard Venus express. Planetary and Space Science, 113, 66-77.

Gérard, J. C., et al., 2008. Distribution of the O2 infrared nightglow observed with VIRTIS on board Venus Express. Geophysical research letters, 35(2).

Haus, R., et al., 2016. Radiative energy balance of Venus based on improved models of the middle and lower atmosphere. Icarus, 272, 178-205.

Piccioni, G., et al., 2009. Near-IR oxygen nightglow observed by VIRTIS in the Venus upper atmosphere. J. Geophys. Res. – Planets, 114.

Shakun, A. V., et al., 2010. Investigation of oxygen O2 (a1Δg) emission on the nightside of Venus: Nadir data of the VIRTIS-M experiment of the Venus Express mission. Cosmic Research, 48(3), 232-239.

Soret, L., et al., 2012. Atomic oxygen on the Venus nightside: Global distribution deduced from airglow mapping. Icarus, 217(2), 849-855.

How to cite: Evdokimova, D., Fedorova, A., Belyaev, D., Montmessin, F., Korablev, O., and Bertaux, J.-L.: Spatial distribution of the infrared O2 (α1Δg) airglow in the night Venus hemisphere based on the SPICAV IR/VEX nadir observations in 2006-2014., Europlanet Science Congress 2021, online, 13–24 Sep 2021, EPSC2021-739, https://doi.org/10.5194/epsc2021-739, 2021.

PART V: the Venus Climate Database
EPSC2021-234
Sebastien Lebonnois, Ehouarn Millour, Antoine Martinez, Thomas Pierron, François Forget, Aymeric Spiga, Jean-Yves Chaufray, Franck Montmessin, and Fabrice Cipriani

Abstract

The Venus Climate Database (VCD) is based on the outputs of our state-of-the-art Venus Global Climate Model (GCM) [1-3]. This tool, in the footsteps and spirit of its Martian equivalent, the Mars Climate Database (MCD) [4], is intended to be useful for engineers and scientists wanting to compare with their models, analyze observations or plan future missions. This project is funded by the European Space Agency, in the frame of preliminary studies for the EnVision mission to Venus.

Overview of the Venus Climate Database

The VCD provides mean values and statistics of the main meteorological variables (atmospheric temperature, density, pressure and winds) as well as atmospheric composition and related physical fields. It extends from the surface up to and including the thermosphere (~250km). The database contains high resolution temporal outputs (using 24 hourly bins) enabling a good representation of the diurnal evolution of quantities over a climatological Venusian day.

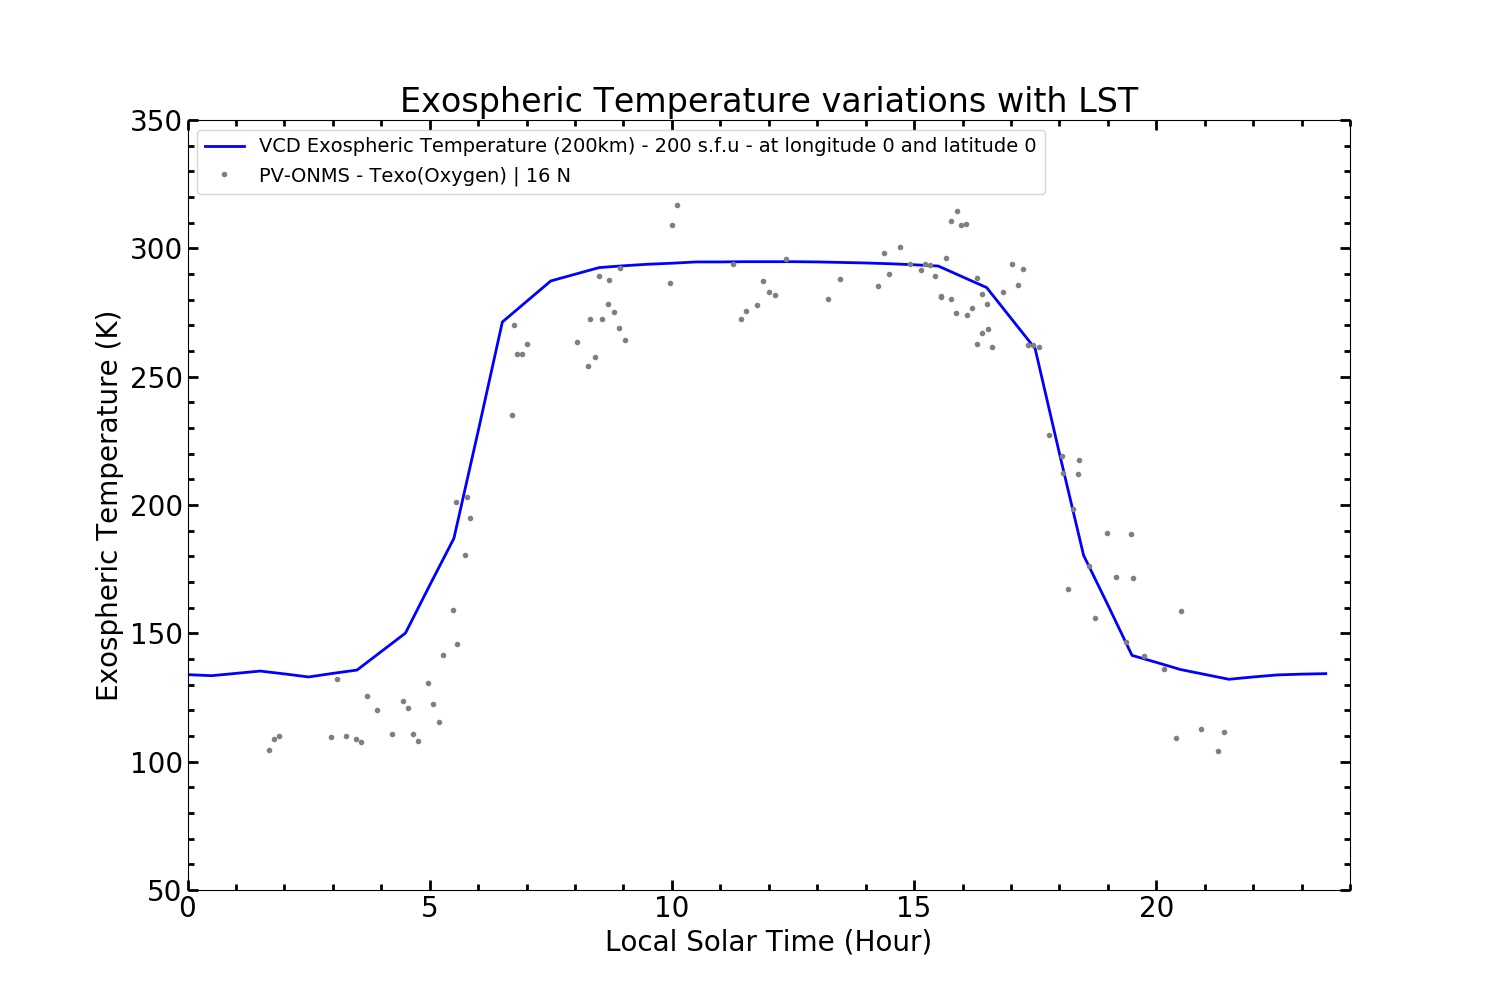
Figure 1: Illustrative example of diurnal variations of the exospheric temperature retrieved from the VCD, compared to PV-ONMS temperature retrievals.

VCD outputs

In addition the main meteorological fields (atmospheric temperature, temperature, density, pressure and winds), the following outputs are available from the VCD:

  • Altitudes with respect to the planet center, the reference sphere or above the surface
  • Topography
  • Astronomical quantities such as Venus Solar Longitude and distance to the Sun at any input Earth date
  • Surface temperature (K) and pressure (Pa)
  • Venusian hourly and day to day variability (RMS) of main meteorological fields
  • Short Wave and Long Wave fluxes at any altitude
  • Atmospheric scale height, mean molar mass, speed of sound, reduced gas constant, heat capacity, specific heat ratios and vicosity
  • Volume mixing ratios and columns of CO2, CO, O2, O, H, H2, H2O, SO2, SO, OCS, O3, HCl, N2 and He
  • An estimation of vertically integrated O2 nightglow
  • VIRA (Venus International Reference Atmosphere) temperature, density and pressure at the same location

VCD scenarios

As the goal of the VCD is to provide information about the state of the Venusian atmosphere, various realistic settings have been used to run a series of baseline GCM simulations, namely:

  • Simulations using various Extreme UltraViolet (EUV) input from the Sun, as this forcing influences significantly the thermosphere (~120km and above). In practice three cases (solar minimum, average and maximum) using fixed E10.7 forcings are provided. The user also has the possibility to obtain outputs corresponding to a chosen E10.7, which may either be specified as a set value or that corresponding to an actual Earth date. In these cases interpolation from the encompassing EUV scenarios is used to estimate the state of the system.
  • To realistically bracket the state of the atmosphere below the thermosphere, which may vary with long-term changes (over time scales of many Venusian days) of the UV cloud albedo [5], along with the baseline case, two supplementary scenarios where that albedo is under and over-estimated are also provided.

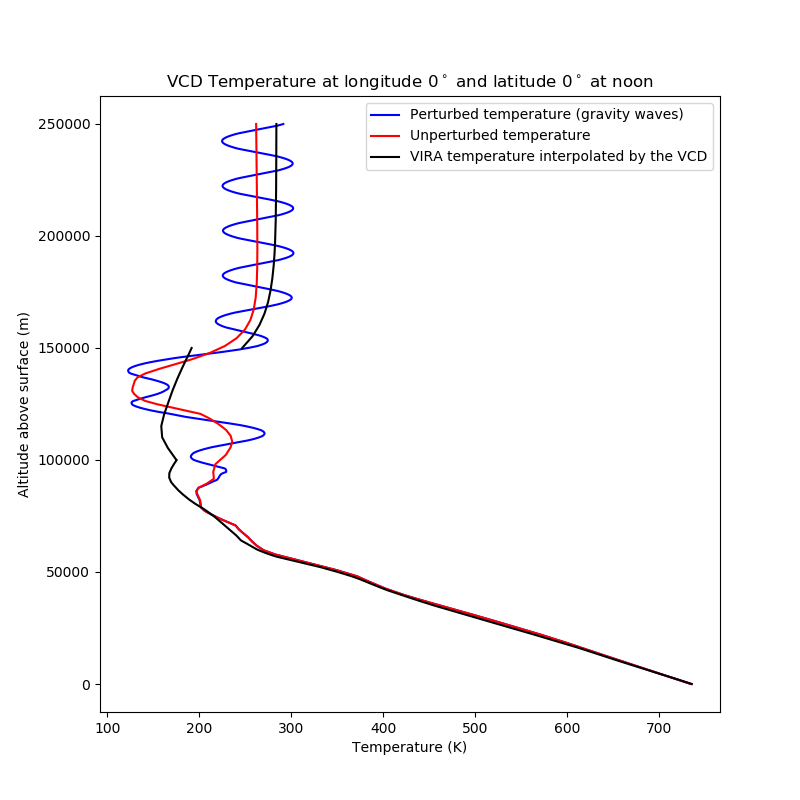
Figure 2: Illustrative example of temperature profiles retrieved from the VCD using the various EUV scenarios.

VCD main features

In addition to the aforementioned VCD scenarios, the following features are available:

  • A “high resolution mode” : although the GCM simulations have been run at the resolution of a few degrees in longitude and latitude (3.75° x 1.875°), using some post-processing and a high resolution topography map (at 23 pixels/degree) to adjust the local pressure (and density).
  • Access to the Venusian intra-hour variability (RMS) of main meteorological variables, as well as the Venusian day-to-day variability thereof, as estimated from the multiple Venus days of GCM simulations.
  • The possibility to add perturbations to the climatological fields as:
    • Small-scale perturbations, representative of gravity waves (which are unresolved in the GCM, but accounted for via adequate parametrizations [3].
    • Large-scale perturbations, representative of actual weather systems present in the GCM simulations.

Figure 3: Illustrative example of wind profiles retrieved from the VCD, compared to Pioneer Venus Night probe observations

Figure 4: Illustrative example of a climatological temperature profile, along with a perturbed one (using the small-scale perturbation scheme) and VIRA reference values.

VCD maccess modes and availability

At the time of writing this abstract, we are finalizing a prototype. We plan to release a first version of the VCD in September 2021. Based on our experience with the MCD, the VCD will be distributed as:

  • A main Fortran subroutine that users can interface and directly call from their own software. Interfaces to call this gateway routine using other programming languages (e.g. C, Python, IDL, Matlab, …) will also be available.
  • A web interface, based on the MCD one (at http://www-mars.lmd.jussieu.fr), for quick looks will be set up and maintained on http://www-venus.lmd.jussieu.fr

Bibliography

[1] S. Lebonnois et al. Wave analysis in the atmosphere of Venus below 100 km altitude, simulated by the LMD Venus GCM, Icarus, 278:38-51, 2016.

[2] G. Gilli et al. Thermal structure of the upper atmosphere of Venus simulated by a ground-to-thermosphere GCM, Icarus, 281:55-72, 2017.

[3] I. Garate-Lopez and S. Lebonnois. Latitudinal variation of clouds’ structure responsible for Venus’ cold collar, Icarus, 314:1-11, 2018.

[4] The Mars Climate Database http://www-mars.lmd.jussieu.fr

[5] Y. J. Lee et al., Long-term variations of Venus’ 365-nm albedo observed by Venus Express, Akatsuki, MESSENGER, and Hubble Space Telescope, Astron. J., 158:126, 2019.


How to cite: Lebonnois, S., Millour, E., Martinez, A., Pierron, T., Forget, F., Spiga, A., Chaufray, J.-Y., Montmessin, F., and Cipriani, F.: The Venus Climate Database, Europlanet Science Congress 2021, online, 13–24 Sep 2021, EPSC2021-234, https://doi.org/10.5194/epsc2021-234, 2021.

Final discussion and concluding remarks