MITM4
Session assets
Please decide on your access
Please use the buttons below to download the presentation materials or to visit the external website where the presentation is linked. Regarding the external link, please note that Copernicus Meetings cannot accept any liability for the content and the website you will visit.
Forward to presentation link
You are going to open an external link to the presentation as indicated by the authors. Copernicus Meetings cannot accept any liability for the content and the website you will visit.
We are sorry, but presentations are only available for users who registered for the conference. Thank you.
Oral and Poster presentations and abstracts
Introduction: SPICE is an information system the purpose of which is to provide scientists the observation geometry needed to plan scientific observations and to analyze the data returned from those observations. SPICE is comprised of a suite of data files, usually called kernels, and software -mostly subroutines [1]. The user incorporates a few of the subroutines into his/her own program that is built to read SPICE data and compute needed geometry parameters for whatever task is at hand. Some examples of geometry parameters typically computed are range or altitude, latitude and longitude, illuminations angles (phase, incidence and emission), instrument pointing and field-of-view calculations, reference frame transformations, and coordinate system conversions. SPICE is also very adept at time conversions.
The ESA SPICE Service: The ESA SPICE Service (ESS) leads the SPICE operations for ESA missions. The group generates the SPICE Kernel Datasets (SKDs) for missions in development (Hera, ExoMars 2022 and JUICE), missions in operations (Mars Express, ExoMars 2016, and BepiColombo) and legacy missions (Venus Express, Rosetta and SMART- 1). ESS is also responsible for the generation of SPICE Kernels for Solar Orbiter. The generation of SKDs includes the development and operation of software to convert ESA orbit, attitude, payload telemetry and spacecraft clock correlation data into the corresponding SPICE format. ESS also provides consultancy and support to the Science Ground Segments of the planetary missions, the Instrument Teams and the science community. The access point for the ESS activities, data and latest news can be found at the following site https://www.cosmos.esa.int/web/spice. ESS works in partnership with NAIF.
Providing the best data: The quality of the data contained on a SKD is paramount. Bad SPICE data can lead to the computation of wrong geometric quantities which can jeopardize science results. ESS, in collaboration with NAIF, is focused on providing the best SKDs possible. Kernels can be classified as Setup Kernels (FK kernels defining Reference Frames of a given S/C, IK kernels describing a given sensor field- of-view and other characteristics, PCK or Planetary Constants Kernels, and LSK or Leapseconds Kernels) and Time-varying Kernels (SPK and CK kernels providing Trajectory and Attitude data, SCLK providing Time Correlation Data, and MK or Meta- kernel). Setup kernels are iterated with the different agents involved in the determination of the data contained in those kernels (Instrument Teams, Science Ground Segments, etc.) while Time-varying kernels are automatically generated by the ESS SPICE Operational Pipeline to produce the Operational kernels that are used in the day-to-day work of the missions in operations (planning and data analysis). These Time-varying kernels are peer-reviewed a posteriori for the consolidation of SKDs that are archived in the PSA and PDS.
Status of the Kernel Datasets: The current status and latest developments of the SKDs for the before mentioned missions will be described in this contribution. In general, the ESS is reviewing the legacy and operational datasets and developing the ones for future missions. DOIs have been incorporated to both operational and archived datasets and shall be used for citing ESA missions SKDs.
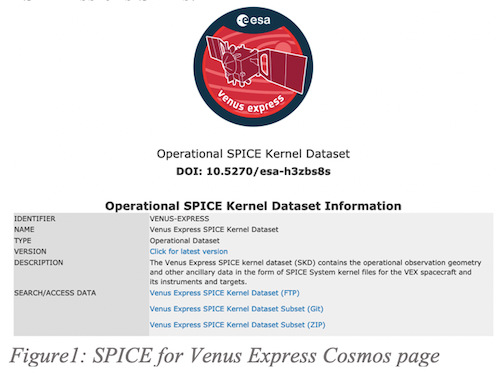
SPICE Kernels Archived in the PSA. ESS is also responsible for the generation of PDS3 and PDS4 formatted SPICE Archives that are published by the PSA. ESS in close collaboration with NAIF, peer- reviews the operational kernels for the PSA [2] in order to publish being compliant with the Planetary Data System (PDS) standards and uses them in the processes that require geometry computations.
Extended Services: ESS offers other services beyond the generation and maintenance of SPICE Kernel Datasets, such as instances and configuration for WebGeocalc and Cosmographia for the ESA missions.
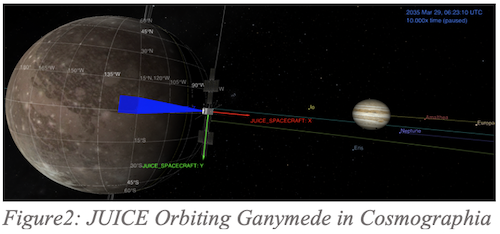
SPICE-Enhanced Cosmographia. NAIF offers for public use a SPICE-enhanced version of the open source visualization tool named Cosmographia. This is an interactive tool devoted to 3D visualizations of celestial bodies ephemerides and shape models, spacecraft trajectories and orientations, movable parts position, and instrument field-of-views and footprints. ESS provides the framework and configuration required to load the ESA missions in Cosmographia, this contribution will demonstrate its usage for the ESA Planetary missions [3].
WebGeocalc. The WebGeocalc tool (WGC) provides a web-based graphical user interface to many of the observation geometry computations available from the SPICE APIs. A WGC user can perform SPICE computations without the need to write a program; just a web browser is required. WGC is provided to the ESS by NAIF. This contribution will outline the WGC instances for ESA missions [3].
References: [1] Acton C. (1996) Planet. And Space Sci., 44, 65-70. [2] Bessel, S. et al., (2017) Planet. And Space Sci. [3] Acton, C. et al., (2017) Planet. And Space Sci.
How to cite: Escalante Lopez, A., Vallés Blanco, R., and Arviset, C.: Updates on SPICE for ESA Missions, Europlanet Science Congress 2021, online, 13–24 Sep 2021, EPSC2021-125, https://doi.org/10.5194/epsc2021-125, 2021.
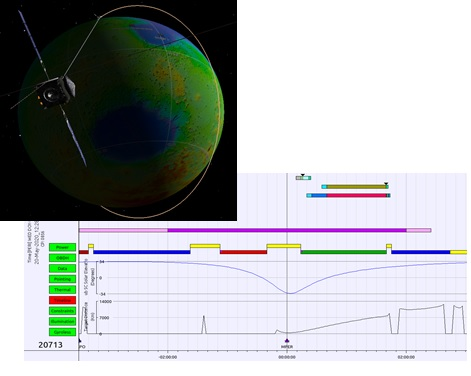
The Mission Analysis and Payload Planning System (MAPPS) is a multi-mission software system developed during the last 20 years to support the science operations planning for the ESA planetary missions.
Developed initially only to visualise the coverage of MEX experiments onto the Martian surface. Progressively, the tool has been extended to provide planning capabilities and to support other missions operationally. In the past: SMART-1, Venus Express and Rosetta. Today and in the coming years: Mars Express, ExoMars2016, BepiColombo, SolarOrbiter, JUICE and EnVision.
The tool main objective is to assist the Science Ground Segment Team (SGS), located at the European Space Astronomy Centre (ESAC) near Madrid, with the complex process of instrument operations scheduling, simulation and validation. The tool receives as inputs the observations requests from the instrument teams, which are merged into a plan that the science operations engineers can run. The instruments are simulated and modelled extensively, allowing to find any possible conflict or constraint violation in the plan. The result of a validated plan is the generation of a multi-instrument operational timeline that is sent to the MOC for uplink to the spacecraft.
Here we present the latest MAPPS features that help the SGS Teams in ESA to achieve their goal of planning scientific operations in an efficient and optimised way.
How to cite: Muñiz, C. and Cardesin, A.: MAPPS: Science Planning and Simulation Tool for ESA Planetary Missions, Europlanet Science Congress 2021, online, 13–24 Sep 2021, EPSC2021-381, https://doi.org/10.5194/epsc2021-381, 2021.
VESPA (Virtual European Solar and Planetary Access) has been focusing for nearly 10 years on adapting Virtual Observatory (VO) techniques to handle Planetary Science data [1] [2]. The objective of this activity is to build a contributive data distribution system where data services are located and maintained in research institutes, as well as in space agencies and observatories. This system is responsive to the new paradigm of Open Science and FAIR access to the data.
During the previous Europlanet-2020 program, VESPA has defined an architecture adapted from the astronomy VO, incorporating concepts and standards from other areas (Earth observation, Heliophysics, etc). The basic system uses the VO infrastructure: data services are installed in any location but are declared in a system of harvested registries with identifiers, end-point (URL), mention of supported access protocols, and rough description of content. Such services are interoperable via clients and tools, which also provide visualization and analysis functions.
The activity in Europlanet-2024 focuses on expanding this environment, enforcing sustainability, and opening new possibilities to improve data processing – such as workflows, cloud-based computation, and readiness for exploitation through Machine Learning techniques.
Data access. VESPA has defined a specific access protocol called EPN-TAP which at the time of writing is a Working Draft of the Internal Virtual Observatory Alliance (IVOA), and expected to become a Recommendation in the coming months [3]. The EPN-TAP metadata system provides uniform description of datasets not only to access data in a VO context, but also for research projects. EPN-TAP is compliant with the general TAP protocol, allowing usage of existing VO tools and communication protocols with data services pertaining to Solar System studies. Some VO tools (TOPCAT, Aladin, CASSIS) were also adapted to improve the handling of such data.
The VESPA portal, intended as a discovery tool to browse the EPN-TAP services, is under study to improve the user experience. ElasticSearch capacities are being implemented, and all interface mechanisms are being evaluated. Other, more specific access modes (via script, web services, VO tools, etc) are also being reviewed.
Data services. There are currently 55 EPN-TAP data services published in the IVOA registry, and about 20 in development phase. Most of them are implemented on DaCHS, a VO data server provided by Heidelberg University. A major upgrade of DaCHS published last year implements recent evolutions of IVOA standards. Existing data services are currently reviewed for compliance, and upgraded to benefit from the latest developments. In many cases, this is also an occasion to extend their content with new data. This upgrade also addresses low-level technical aspects, e.g. related to declaration in the IVOA registry.
Larger data infrastructures with EPN-TAP interface (AMDA, SSHADE, PVOL) also continue to develop their content and capacities, e.g. band lists have been implemented in SSHADE this year.
Sustainability. This major update relies on the VESPA hubs activity: definition files of all services are stored in a unique gitlab for preservation and maintenance by several VESPA teams. Authentication is granted by GÉANT/eduTEAMS. This is a simple and efficient way to share the technical expertise among services and teams, and to improve sustainability.
New environments. VESPA-cloud was a project supported by EOSC-Hub, through its 2nd Early Adopter Program (2020-21). It was an assessment of the deployment of EPN-TAP services on EOSC (the recent European Open Science Cloud) inside Virtual Machines or Docker containers, from the same gitlab installation used to preserve the services. The assessment was successful and opens up new solutions and opportunities for future VESPA service implementations. It will provide a workaround to services temporary unavailability, for performing cloud-based computation on data services, and a solution for data providers who are not able or not willing to host a VESPA server for a long period of time.
New services. Implementation of new services has been going on with internal projects. External ones will restart with an on-line implementation workshop before the end of the year. A VizieR EPN-TAP service will provide access to the data content of articles related to the Solar System and exoplanets (hopefully ready at the time of the conference). An interface with space agency archives will make use of the recent PDS4 dictionary for EPN-TAP (in addition to the existing EPN-TAP interface on ESA’s PSA).
Discussions have started with other WP producing data in Europlanet-2024 to start distributing their results using the VESPA infrastructure: other VAs (SPIDER, GMap, ML), NA2 (telescope network), and TAs (lab experiments and field studies). VESPA is of course also available to distribute data from other H2020 programmes in the field.
Prospects. Detailed examples of recent VESPA developments are provided in this session and related ones. The focus will shift again next year to new data services, with the finalization of several projects, in particular related to the Moon, Mercury, and exoplanets. A workflow platform will also be connected to perform run-on-demand (the OPUS system also used by the ESCAPE H2020 programme) and cloud-based activity will expand.
The Europlanet-2024 Research Infrastructure project has received funding from the European Union's Horizon 2020 research and innovation programme under grant agreements No 871149.
[1] Erard et al 2018, Planet. Space Sci. 150, 65-85. 10.1016/j.pss.2017.05.013. ArXiv 1705.09727
[2] Erard et al. 2020, Data Science Journal 19, 22. doi: 10.5334/dsj-2020-022.
[3] https://ivoa.net/documents/EPNTAP/20201027/index.html (still open for comments)
How to cite: Erard, S. and the VESPA team: Virtual European Solar & Planetary Access (VESPA) 2021: consolidation, Europlanet Science Congress 2021, online, 13–24 Sep 2021, EPSC2021-506, https://doi.org/10.5194/epsc2021-506, 2021.
Introduction
The development of VESPA in the Europlanet 2024 program encompasses the improvement of Virtual Observatory (VO) services to enlarge and update its content.
VESPA services use the EPN-TAP protocol defined for Planetary Science and Heliophysics. As a restriction of the more general TAP protocol, such services benefit from TAP-compliant tools and protocols previously defined in the VO [1].
The development of three Planetary services will be described here. The creation of a service providing outputs of a model of topography of exoplanets called EXOTOPO, and the update of two services providing profiles of various parameters of Mars atmosphere : SPICAM data and MCD simulations. These services are provided with user manuals linked in their description to explain the main search criteria that can be used. The three services are implemented on DaCHS, a commonly used TAP server provided by Heidelberg University.
EXOTOPO Service
Dataset:
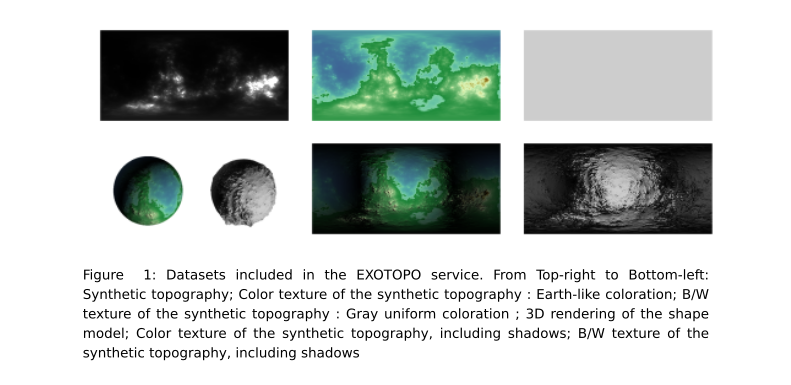
The new service EXOTOPO gives access to simulation results based on a statistical model of topographies of (exo)planet surfaces (3D visualisator : [2]). The model is based on 3 parameters (H : degree of smoothness, C1 : degree of intermittency, alpha : degree of multifractality), see Landais et. al 2018 [3] for more information. A new data set was generated to provide a larger range of parameter variation [4]. For each combination of parameters (H, C1, alpha and the Random Seed identifier), 5 types of data outputs are provided (see Fig. 1): An elevation map ; An earth-like colorized texture with continents and oceans, with and without hill-shading ; A gray texture map, small body-like, with and without hill-shading ; additionally, two spherical plots of altitude in 3D with the hill-shaded textures are provided as thumbnails of elevation maps.
Implementation :
The server hosting DaCHS is deployed on Docker from a VM (Virtual Machine) in ESPRI data center. A reverse-proxy on ESPRI redirects the server address to https://dachs-vo.ipsl.fr for outside. Data files are directly uploaded by ESPRI and linked in the service. The topographic map is provided in fits format with geological referencement and texture maps are provided in png, both are readable by VO tools like Aladin.
MCD and SPICAM services
Datasets :
The MCD (Mars Climate Database [5]) is a database of Mars atmospheric parameters based on a modelization of Mars atmosphere developed in LMD (Laboratoire de Météorologie Dynamique). The database provides various quantities (pressure, temperature, wind, radiative fluxes, composition, ...) for a list of scenarios of dust and storm and for Martian years 24 to 32 (see the user manual [6] for more information). The MCD can be accessed through a web interface, or a full version can be downloaded and interrogated by a Fortran function. The VO service implemented in VESPA provides an alternative access to the MCD which allows the selection of data subsets using various research criteria.
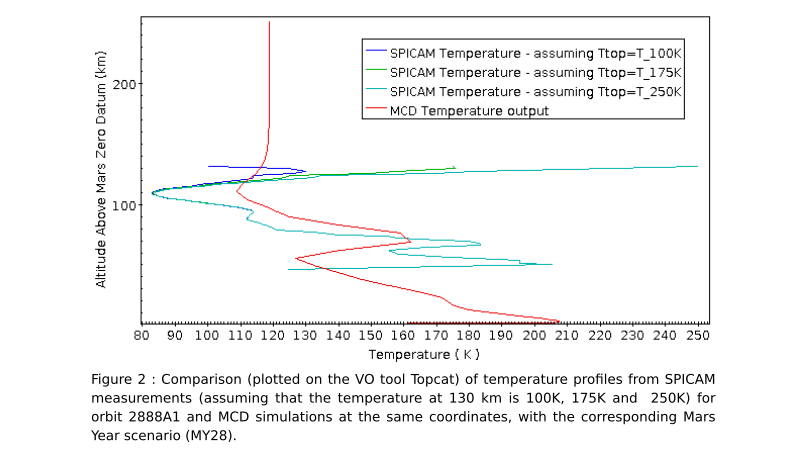
SPICAM (Spectroscopy for Investigation of Characteristics of the Atmosphere of Mars [7]) is an ultra-violet [118-300]nm and infrared [1.0-1.7]µm spectrometer on board Mars Express. It has been observing the Martian atmosphere from January 2004 (Mars Year 27) onwards with nadir, limb and stellar/solar occultation measurements. The UV channel ceased operations in 2014, but the IR channel is still currently collecting data. Four types of data profiles derived from occultations in the UV channel are provided in the VO service SPICAM : aerosol extinction [8] derived from solar occultations, temperature, and densities of CO2 [9] and O3 [10] from stellar occultations. On the VO service, each SPICAM profile is associated with an MCD profile at the same coordinates for the current Mars Year scenario on the service (see Fig. 2). Furthermore, datalinks for each granule link to associated MCD profiles, with the possibility to select any available scenario.
Implementation :
The servers for MCD and SPICAM services are administered directly at the LMD and LATMOS laboratories, on VM that runs on debian 10 and hosting gavodachs2, and Apache configured for cgi (Common Gateway Interface). Data from SPICAM measurements are directly uploaded using Apache whereas MCD profiles are computed on-the-fly using cgi-scripts in python to call mcd and generate queried profiles. Both data from MCD and SPICAM are provided in VOtable format [11] which can be handled by VO tools such as TOPCAT and be clearly referenced.
Conclusion :
The Virtual Observatory (VO) addresses the issue of providing FAIR (findable, accessible, interoperable, reusable) access to scientific data. VESPA services apply this paradigm to resources in Planetary Science and Heliophysics, with uniformed metadata, a powerful query interface to select data, and specialized formats for various data types. Furthermore, the VO provides the SAMP interface, a very simple way to plot and compare data that can be obtained from various services.
The Europlanet-2024 Research Infrastructure project has received funding from the European Union's Horizon 2020 research and innovation programme under grant agreement No 871149.
References:
[1] Erard et al , VESPA: A community-driven Virtual Observatory in Planetary Science, Planetary and Space Science, Volume 150, January 2018, Pages 65-85 10.1016/j.pss.2017.05.013 https://doi.org/10.1016/j.pss.2017.05.013
[2] 3D visualisator of some Exotopo model outputs https://data.ipsl.fr/exotopo/
[3] F Landais, F Schmidt, S Lovejoy, Topography of (exo)planets, Monthly Notices of the Royal Astronomical Society, Volume 484, Issue 1, March 2019, Pages 787–793, https://doi.org/10.1093/mnras/sty3253
[4] EXOTOPO data set (former version http://dx.doi.org/10.14768/20181024001.1 ; new version https://data.ipsl.fr/multifractal-topography/ )
[5] Mars Climate Database : Forget et al. 1999, Improved general circulation models of the Martian atmosphere from the surface to above 80 km ; Millour et al. 2018, The Mars Climate Database (Version 5.3) .
[6] Mars Climate Database parameters v5.3 user manual http://www-mars.lmd.jussieu.fr/mars/info_web/user_manual_5.3.pdf
[7] SPICAM instrument https://mars-express.cnes.fr/en/MEX/spicam.htm
[8] Määttänen et al. (2013), A complete climatology of the aerosol vertical distribution on Mars from MEx/SPICAM UV solar occultations, Icarus, 223, doi:10.1016/j.icarus.2012.12.001
[9] Forget et al. (2009), Density and temperatures of the upper Martian atmosphere measured by stellar occultations with Mars Express SPICAM, J. Geophys. Res., 114, E01004, doi:10.1029/2008JE003086
[10] Lebonnois et al. (2006), Vertical distribution of ozone on Mars as measured by SPICAM/Mars Express using stellar occultations, J. Geophys. Res., 111, E09S05, doi:10.1029/2005JE002643
[11] VOtable format standards (v 1.4) https://www.ivoa.net/documents/VOTable/20191021/REC-VOTable-1.4-20191021.pdf
How to cite: Azria, C., Määttänen, A., Millour, E., Schmidt, F., Andrieu, F., Stéphane, E., Baptiste, C., and Le Sidaner, P.: Planetary VO services on VESPA : MCD, SPICAM and EXOTOPO, Europlanet Science Congress 2021, online, 13–24 Sep 2021, EPSC2021-267, https://doi.org/10.5194/epsc2021-267, 2021.
Introduction
The SSHADE database infrastructure (1) (http://www.sshade.eu) hosts the databases of about 30 experimental research groups in spectroscopy of solids from 15 countries. It currently provides to all researcher over 4000 spectra of many different types of solids (ices, minerals, carbonaceous matters, meteorites…) over a very wide range of wavelengths (mostly X-ray and VUV to sub-mm)
However, although these data are invaluable for the community, one type of information is still critically missing to easily interpret observations: the list of the characteristics of all the absorption bands of a given solid, called its ‘band list’.
This type of database is well developed for gases (see e.g. the VAMDC portal (2)), and it is even frequently the only type of spectral data available. But for solids (and liquids) there is currently almost no database which provide such information (only in some restricted fields, such as Raman spectroscopy of minerals, e.g. the WURM database (3)).
This critical lack triggered us to develop such a band list database containing the characteristics of electronic, vibration and phonon bands of various solids (ices, simple organics, minerals) of astrophysical interest to help:
- identify absorption or emission bands from solids observed in various astrophysical environments or in laboratory simulations
- determine the environment of the molecule or mineral (composition, isotopes, mixing, phase, T, P, …)
- select the best spectra in SSHADE to compare with observation, or to use in models
What is a band list of a solid?
A ‘band list’ is a list of band parameters and vibration modes of a molecule in a simple molecular constituent (3 species maximum), or of a mineral or a ionic/covalent solid, with a well-defined phase and composition (fixed or small range). It includes the bands of all isotopes (sub-bandlists) and can be provided for different environments (T, P, …).
The SSHADE 'band list' database provides the band parameters (position, width, peak and/or integrated intensity, and their accuracy, isotopic species involved, mode assignment, ...) of a progressively increasing number of solids and simple compounds (with different compositions) of astrophysical and planetary interest in various phases (crystallines, amorphous, ...) at different temperatures or pressures.
We are feeding this database through exhaustive compilations and critical reviews of all data published in various journals for pure ices and molecular solids and their simple compounds (solid solution, hydrates, clathrates, ...), including the own works of the SSHADE consortium partners. We will continue in a second step with band lists of minerals. However, this is a tremendous scientific work, expected to last many years… For example, the infrared spectrum of pure solid CO in its cubic α phase has been the subject of more than 35 papers scattered in 25 different journals over the period 1961-2020…
SSHADE band list database and interface
A specific data model, SSDM-BL (Solid Spectroscopy Data Model – Band List), has been first developed in order to accurately describe and link all the parameters necessary to describe both the solid constituent and the band list itself. A structured database storing all these data and metadata, has then be set up based on this data model. A data review tool (excel file), a data convertor to a XML import file, as well as a data import tool have been developed to feed the database.
Then an efficient search tool allows you to search either a band list or a specific band thanks to a combination between a ‘search bar’ and a set of filters on various parameters, such as band position, width and intensity, expected molecular or atomic composition, type of vibration, temperature and pressure. The search result are provided as a table with band list title or the main band parameters allowing the users to select the most relevant ones. He can then display the selected band list graphically, thanks to a simulator of ‘band list spectra’, with various unit and display options. The data can be exported as a table containing the main parameters of all the bands of the band list, as well as detailed metadata of the band list and all its bands. A data reference and a DOI will be associated with each band list.
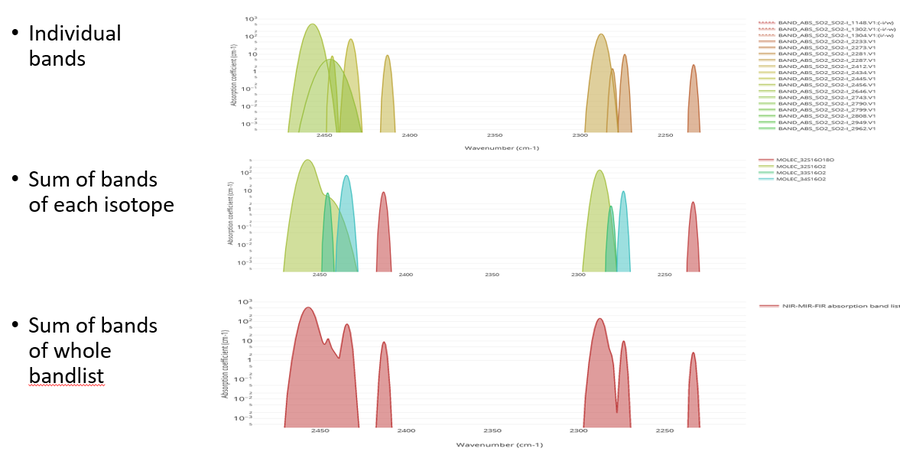
Figure 1: the plotting tool allow to simulate the indivudual bands, the spectrum with all bands of a given isotope, as well as the full spectrum of the band list.
SSHADE in Virtual Observatory
SSHADE-Bandlist will be later a service of the VESPA Virtual Planetary Observatory. It will be accessible via the EPN-TAP protocol, which will allow comparison with observational data and mass processing in the VESPA environment through a series of dedicated spectroscopy plotting and analysing tools.
Conclusion
This band list database should become a key tool for astronomers and planetary scientists to identify unknown absorption bands observed in the spectra of the surface or atmosphere of many astrophysical and solar system objects. Once the best candidate solid found by the user, the tool will link to the most relevant spectral datasets present in the SSHADE databases. These data can then be used for direct comparison with observations, or to model them through radiative transfer codes.
However its feeding will strongly depend on the scientific manpower available, and on the contribution of the SSHADE partners and of the community.
Acknowledgements
The Europlanet 2024 Research Infrastructure project received funding from the European Union's Horizon 2020 research and innovation programme under grant agreement No 871149. We also acknowledge OSUG, and INSU for additional financial supports.
References
- Schmitt, B., et al. (2018) SSHADE: "Solid Spectroscopy Hosting Architecture of Databases and Expertise" and its databases. OSUG Data Center. Service/Database Infrastructure. doi:26302/SSHADE
- Dubernet, M. L., et al. (2016). The Virtual Atomic and Molecular Data Centre (VAMDC) Consortium. Phys. B: At. Mol. Opt. Phys., 49, 074003 [doi:10.1088/0953-4075/49/7/074003]
- WURM project (http://www.wurm.info)
How to cite: Schmitt, B., Furrer, M., Albert, D., Bollard, P., Gorbacheva, M., Bonal, L., and Poch, O.: SSHADE-BandList, the new database of spectroscopy band lists of solids, Europlanet Science Congress 2021, online, 13–24 Sep 2021, EPSC2021-458, https://doi.org/10.5194/epsc2021-458, 2021.
One of the goals of the Small Bodies: Near and Far (SBNAF) H2020 project was to create an easy-to-use database for thermal infrared observations of small bodies. We collected published thermal IR measurements for our selected samples of Solar System targets including data from large missions (e.g. catalogues based on Akari, IRAS and WISE observations) and also data from smaller scale and individual reductions (e.g. the Herschel Space Observatory measurements of near-Earth and main belt asteroids). The primary goal of this database is to help scientists working in the field of modeling the thermal emission of small bodies. However, the database has the option to include more data of Solar System small bodies which have been observed at thermal IR wavelengths from space or with ground-based instruments. The database is online and accessible since March 2019, see the details in Szakáts et al. (2020).
Our database was used, e.g. to help determine the shape and spin properties of (208) Lacrimosa asteroid in the Koronis family, (Vokrouhlický et al., 2021), to model the thermophysical state of two Hilda asteroids (1162) Larissa and (1911) Schubart, (Chavez et al., 2021) and to model the thermal emission of large main belt asteroids (Ali-Lagoa et al., 2020).
In a recent update we added 324 new flux densities for 23 resonant trans-Neptunian and scattered disk objects to the database from Farkas-Takács et al. 2020, and in total we have now 170461 records. For the currently available data, its sources and the distribution of data from observatories and missions see Table 1.
Table 1. List of observatories/missions, observatory codes, instruments, filters, possible observing modes,and the number of measurements with a specific instrument, in the present version of the Infrared Database. Except for WISE, there are no available positions for the low-Earth orbit missions, so they are referred to as geocentric (JPL code ‘500@399’)
In an upcoming update we are planning to extend the database with WISE W2 data, Uranus and Neptune satellite data, with flux densities from Herschel serendipitous asteroid observations, and disk-integrated thermal data of the Moon (Müller et al., 2021).
The WISE W2 data will bring shorter wavelength flux densities to the database for selected asteroids. During the processing special attention will be given to those small bodies, mainly NEAs, for which the reflected light can cause discrepancies when calculating the colour correction factor. A proper warning will be given in the public database for such objects after the update.
With the Herschel serendipitous asteroid observations we will expand the number of flux densities by around 600 records.
How to cite: Szakáts, R., Kiss, C., Müller, T., Marton, G., Alí-Lagoa, V., Farkas-Takács, A., and Bányai, E.: Update on the SBNAF Infrared Database, Europlanet Science Congress 2021, online, 13–24 Sep 2021, EPSC2021-686, https://doi.org/10.5194/epsc2021-686, 2021.
Introduction: In the field of planetary remote sensing, terabytes of data from extraterrestrial planetary bodies are made available to the scientific community today. With the development of new missions, the volume and variety of these data continue to grow.
This development has been largely facilitated through developments leading to higher integrated technology allowing to build compact and efficiently performing platforms and instrumentation. A likely other reason might be an increasing international competitive pressure which motivated new developments in sensor technology and mission designs. Along with the increase of raw data volume, the volume of derived research data continues to grow in parallel, albeit at a slower rate.
While mission data, i.e. primary research data (PRD), as derived from instruments, are commonly well maintained within archives such as the Planetary Data System (PDS) and Planetary Science Archive (PSA), derived research data, i.e., secondary research data (SRD) might not always share the same fate. For an more user and object-oriented usage of mission data first efforts came up in the last years [1-3]. Scientific studies, resulting in further derived data do not often receive the same attention.
In order to accomplish efficient research data management (RDM) for both kind of RD and to provide tools across research domains it is important to develop appropriate and effective structures. In that context, research data infrastructures (RDI) have the primary goal of collecting existing data under uniform guidelines and to make data accessible in defined ways. RDI initiatives supports the establishment of research management practices, including adopted metadata standards, research lifecycle and associated infrastructures. E.g. The European Open Science Cloud (EOSC) as RDI undertaking, "aims to federate existing and future RDI - across disciplines - under a single umbrella, and provides (open) services for the European researcher community." [4] They are targeted to provide faster and more efficient data access in order to pool resources and avoid duplication where redundancy is technically not needed.
A large volume of RD that are derived in the field of planetary research carry an explicit spatial component through an absolute reference, or through relative location information, as inherent characteristics, which can thus be described as spatial data and spatial RD. These spatial (research) data serve as fundamental basis for further cartographic products and maps.
Maps, as one example of SRD, have been an essential part of planetary research since the beginning of observation and they have been constantly refined and improved since then. Planetary maps range from image maps to topographic reference maps, to geologic and to landing-site maps. Their variety, however, is naturally limited due to the lack of anthropogenic overprint and lithologic diversity.
In order to re-integrate these maps into the research-data life cycle [5] and to make them not only available for a sustainable reuse, but also to improve the associated information, further efforts are necessary which are outlined in the following sections.
Aims: The overarching goal here is to develop a practical concept, and to address requirements to enable open, transparent and sustainable access to planetary maps as part of the open planetary spatial research data family. Therefore, approved and established environments serve as blueprint for our concept for an Open Planetary Map repository.
We here refer to maps as conventional cartographic visualization products which contain a classical map layout composed of the main map contents (the topics), map frame, map grid information related to at least one cartographic reference system, map scale information, map title and map legend, as well as other map-related metadata information [6, 7]. These maps can be provided in different formats on various media.
Method and Results: In order to assess the current situation and to find a strategy to close the planetary research-data cycle, we first need to analyze the main elements along its current research path. We here 1. identify how the current situation, including users (actors) and data flows, is constituted and how main processes are characterized. In step 2., additional as well as potentially alternative roles and data paths, respectively, are identified and further developed through user and system requirements. Finally, based on the assessment of the current situation and a requirement analysis, potential solutions are highlighted in step 3. that build upon existing Earth-based Infrastructure developments, especially the INSPIRE framework [8] or demonstrate which additional developments are required.
Especially the adaption of spatial research infrastructure developments shows how the planetary community could benefit from an adaption of existing infrastructure environments in order to
Summary: The aim of this study is to characterize the relationships between different interest groups (stakeholders) and products as well as processes, and to discuss how processes could potentially be optimized and streamlined in order to re-insert planetary maps (and research information) into a healthy and sustainable research cycle. Developments like this could build a thematic bridge to Earth-based RD repositories [9-11] in order to push the reuse of planetary maps forward. One way of realizing an approach targeted at improving the re-use of research data in the planetary sciences is by merging the existing alternatives and to integrate the structural benefits from the INSPIRE (or any other SDI) domain. The creation of an Open Map Repository as part of a Planetary Research Data Infrastructure is described in detail in [12], in particular with respect to the communication and participation, coordination and the technical implementation.
References: [1] Laura, J.R., et al 2017. ISPRS Journal of Geo-Information 6, 181; [2] Laura, J.R. et al 2018. Earth and Space Science 5, doi:10.1029/10702018EA000411; [3] Laura, J.R. and Beyer, R.A., 2021. The Planetary Science Journal 2. doi:10.10663847/PSJ/abcb94;
[4] Latif, A. et al, 2019. Data Science Journal 18. doi:10.5334/dsj-2019-017 [5] Corti, L., et al. 2019. Managing and Sharing Research Data: A Guide to Good Practice. SAGE Publishing [6] Robinson, A.H., et al. 1995. Elements of Cartography. 6 ed., Wiley, New York; [7] Hake, G., et al. 2001. Kartographie, de Gruyter; [8] https://inspire.ec.europa.eu/tags/sdi# [9] www.eosc.eu, [10] https://www.earthcube.org/, [11] https://pangaea.de/, [12] Nass, A. et al. 2021, in print) Facilitating Reuse of Planetary Spatial Research Data. PSS
How to cite: Nass, A., Asch, K., van Gasselt, S., Rossi, A. P., Besse, S., Cecconi, B., Frigeri, A., Hare, T., Hargitai, H., and Manaud, N.: Conceptualizing an Open Map Repository as Part of a Planetary Research Data Infrastructure, Europlanet Science Congress 2021, online, 13–24 Sep 2021, EPSC2021-361, https://doi.org/10.5194/epsc2021-361, 2021.
Introduction: In the recent years, discussions and demands came up to push the sustainability, reusability and, last but not least, the interoperability of research data within different scientific disciplines. In order to provide platforms to a) facilitate use and reuse of data in a transparent and sustainable way and to b) comply with recommendations and guidelines, research initiatives such as [1-3] have been established. Besides this, [4-6] were founded in order to provide the scientific community with platforms to archive sharable, discoverable and citable research data. Furthermore, initiatives like Nationale Forschungsdateninfrastruktur (NFDI) on a German national and the European Open Science Cloud (EOSC) on a European level were established in order to provide a trusted and virtual environment that cuts across borders and scientific disciplines. All these initiatives are based on the FAIR principles in order to create findable, accessible, interoperable and reusable data [7].
Within missions e.g. to Mercury (BepiColombo), the Outer Solar System moons (JUICE), and asteroids (NASA`s Dawn mission) one way of scientific analysis is the systematic surface analyses based on the numeric and visual comparison and combination of different remote sensing data sets, such as optical image data, spectral-/hyperspectral sensor data, radar images, and/or derived products like digital terrain models (here: primary research data). The long-term storage of this mission data is guaranteed through the Planetary Data System (PDS) and Planetary Science Archive (PSA). Conditioned by the spatial component, the analyses mainly result in derived research data such as map(-like) figures, profiles/diagrams as well as models, and finally serve for describing research investigations within scientific publications. Hence, cross-links between different missions, surfaces, bodies and topics are possible and thematical analogies could be extracted by the spatial context. This includes a great potential to create a sustainable reuse of historical, current and future information.
Aim: We here present a project that aims at a prototypical system for the structured storage, accessibility and visualization of planetary data compiled and developed within or with the contribution of Institute for Planetary Research (PF) at German Aerospace Center (DLR). The goal is to enable different user groups (currently limited to DLR) to store and spatially explore derived research data centrally, sustainably across multiple missions and scientific disciplines in planetary science for future investigations.
Method and Implementation: Technically, the prototype is built upon well-established stack of open source software [8-10]. Furthermore, standards like [11] and [12], developed by the Open Geospatial Consortium (OGC), serve as communication between user interface and the server.
This software and standards are already combined within two software frameworks developed at the German Remote Sensing Data Center (DFD): 1. data storage and management capabilities as well as OGC-compliant interfaces for collaborative and web-based data access services (EOC Geoservice) [13]. 2. UKIS (Environmental and Crisis Information Systems), a framework developed at DFD or the implementation of geoscientific web applications [14].
Starting the development of the prototype, as first step a user analysis and inventory of the available data and information diversity in PF is needed (cf. requirement analysis).
The second step will be the data storage and management within EOC Geoservice which combines a PostgreSQL database and a data management via GeoServer. Therefore, a representative and exemplary data collection is used, based on a recent approach developed within PF [15]. Here, an existing database established at Planetary Spectroscopy Laboratory (PSL), handling different kinds of spatial data, meets a vector-based data collection of thematic, mainly geologic and geomorphologic mapping results [e.g. 16, 17], and raster-based global mosaics in different resolutions [18, 19]. This data merging enables a multi-parameterized querying across different data types, multiple missions and scientific disciplines in planetary science.
The third step will be the implementation of a geospatial information system based on UKIS. Within this, the visualization and utilization of the exemplary data package will be realized in an interactive, web-based system that displays all different datasets within the individual spatial reference system. For the already existing framework of UKIS this means an adaptation for planetary usage. With the integration of a user management system, the prototype could also integrate rules for data access restriction, needed for ongoing missions.
The fourth and currently final step is to configure generic interfaces. These will enable a connection to other DLR systems and databases like the electronic library (ELIB) on the one hand. On the other hand, other archives and repositories outside DLR, which are substantially related to the internal stored data, could be linked.
Summary: UKIS, as DFD-developed software framework for web-based geographic information systems, together with a geospatial data access and data management services, such as the DFD-hosted EOC Geoservice, are the ideal basis for such a spatial platform due to their stable architecture. Both can adapt to other spatial reference systems, as well as provide and visualize the planetary data after individual system configuration. A research data information system of this kind is essential to ensure the efficient and sustainable utilization of the information already obtained and published by previous research. This is considered a prerequisite for guaranteeing a continuous and long-term use of scientific information and knowledge within the departments, the institute and potentially also outside of DLR.
References: [1] RDA, www.rda-alliance.org; [2] GoFAIR, www.go-fair.org; [3] CODATA, www.codata.org; [4] figshare, www.figshare.com/; [5] zenodo, www.zenodo.org; [6] pangea www.pangaea.de [7] Wilkinson M. et al. (2015) Scientific Data, 3. 1-9, doi:10.1038/sdata.2016.18, [8] postgresql.org/, [9] geoserver.org/, [10] ecma-international.org/publications/files/ECMA-ST/Ecma-262.pdf, [11] opengeospatial.org/standards/wfs, [12] opengeospatial.org/standards/wms, [13] Dengler, K. et al. (2013) PV 2013, elib.dlr.de/86351/, [14] Muehlbauer, M. (2021) dlr.de/eoc/en/desktopdefault.aspx/tabid-5413/10560_read-21914/, [15] Nass, A. et al. (2017), [16] Nass, A. and the Dawn Science Team (2019)EPSC #1304, [17] Williams D.A. et al. (ed.), 2018, Icarus, 316, 1-204, [18] Roatsch et al, (2016) PSS doi:10.1016/j.pss.2016.05.011, [19] Roatsch et al., (2017) doi:10.1016/j.pss.2017.04.008
How to cite: Nass, A., Mühlbauer, M., d'Amore, M., Heinen, T., Böck, M., Munteanu, R., Riedlinger, T., Roatsch, T., and Strunz, G.: Multi-mission Information System at DLR: A prototype for Planetary Research Data and Publications, Europlanet Science Congress 2021, online, 13–24 Sep 2021, EPSC2021-398, https://doi.org/10.5194/epsc2021-398, 2021.
The Line of Sight (LoS) is one of the latest tools to join the analytics suite of tools for the Solar System Treks (https://trek.nasa.gov) portals. The LoS tool provides a way to compute visibility between the entities in our solar system. More concretely, this utility searches for windows of communication or a “line of sight” between any two entities. Entities include orbiters, rovers, planetary bodies, ground stations, and other topographical locations. In addition to establishing communications between the two entities, the tool also takes into account local terrains of the entities in question.
The software seeks to answer questions about establishing communications between a rover and an orbiter, or an orbiter to a ground station. In mission planning, LoS can be used to determine possible traverses for a rover that must maintain communications with a lander, or find time intervals of communication to an orbiter when a rover or lander are near an obstructing surface feature such as a crater rim or mound. Computations can be even more granular and lines of sight can be computed between mission instruments, thus allowing to ask questions such as “Is the High Gain Antenna on a rover visible from an orbiter?”
The initial release of the software focuses on the lunar surface and the LRO spacecraft. Users can ask whether a topographical location on the moon is visible from the orbiter or a discrete set of ground stations on Earth. The tool uses NAIF SPICE and various mission kernels for computing planetary geometries. LoS also uses high resolution Digital Elevation Model (DEM) to model the terrain surrounding the points of interest. In-house software is used to convert high resolution DEMs into a format compatible with the tool. Users can provide their own DEMs to model the terrain on different topographical locations to use for their own computations.
How to cite: Law, E., Gallegos, N., and Malhotra, S.: Line of Sight Analysis, Europlanet Science Congress 2021, online, 13–24 Sep 2021, EPSC2021-150, https://doi.org/10.5194/epsc2021-150, 2021.
In thirty-one years of observations, the Hubble Space Telescope (HST) has produced a vast archive of thousands of targeted observations. This includes galaxies, clusters of galaxies, and gravitational lenses. Occasionally, closer objects such as Solar System bodies or artificial satellites cross the telescope's field of view during the observations, leaving trails in the images. On one hand, these trails can impact the observations. The standard data processing pipeline (DrizzlePac) cleans cosmic rays artifacts (Hoffmann et al., 2021), also removing asteroid trails, but it leaves residuals in the combined images. On the other hand, this is a great opportunity for the Solar System small bodies science, considering the already existing images from the huge HST Archive, containing more than 100 Tb of data and spanning three decades.
Our project is focused on studying serendipitous asteroid trails appearing in archival HST images. We used images from two instruments, namely the Advanced Camera for Surveys and Wide Field Camera 3, the ultraviolet and visible channels. These images were acquired between 2002 and 2021. We built an online citizen science project on the Zooniverse platform, Hubble Asteroid Hunter (www.asteroidhunter.org), launched on International Asteroid Day 2019, to identify the asteroid trails in the images (Kruk et al., in prep.). This project involved more than 11,000 people in search for asteroids, providing 2 million classifications for 150,000 images over a period of one year. The labels provided by the volunteers were used to train an automated classifier based on a deep learning algorithm, Google Cloud AutoML Vision. We recovered 2,400 trails in the HST images in total.
The asteroid trails appear curved as viewed by HST, because of Hubble’s motion around the Earth every 90 minutes. One example is asteroid 2001 SE101 passing in front of the Crab Nebula in a rare cosmic coincidence, discovered by citizen scientist Melina Thévenot and shown in Figure 1. The project also contributed to other serendipitous discoveries, such as new strong gravitational lenses in the background of some famous HST targets.
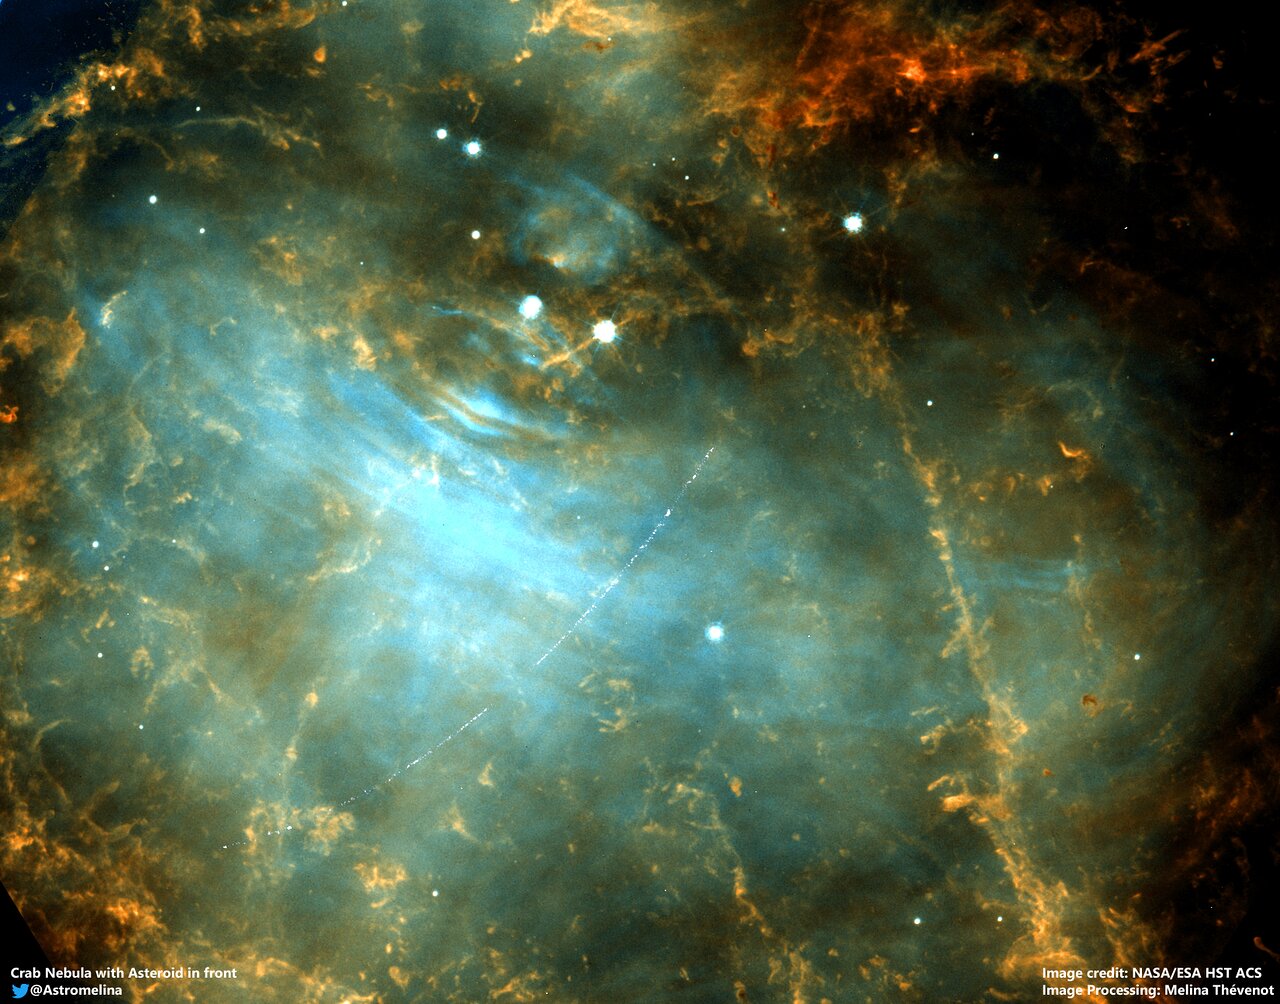
Figure 1: Trail of asteroid 2001 SE101 passing in front of the Crab Nebula, M1 in 2005. The trail appears curved because of the motion of HST around the Earth. ESA Image of the Week: http://www.esa.int/ESA_Multimedia/Images/2019/10/Foreground_asteroid_passing_the_Crab_Nebula. Credit: ESA/Hubble & NASA, M. Thévenot.
We further analysed the asteroid trails in order to obtain their astrometry and photometry with a customised algorithm. We validated the trails visually, finding 1,700 trails presumably of Solar System objects. Their distribution in the sky is shown in Figure 2. We extracted each trail from the images by using a fixed-width aperture, which was moved along the trail. The position and corresponding flux were obtained for each point along the trail. The calibration was performed using the WCS (World Coordinate System) information stored in the header. As a by-product of this algorithm, we were able to derive partial light curves. The apparent magnitude of the corresponding Solar System object was obtained by integrating all the flux along the trail.
We used the SkyBoT service provided by IMCCE/Paris Observatory and the JPL HORIZONS online solar system data and ephemeris for identifying the known objects. We computed the ephemerides taking into account the position of HST. Despite using the largest databases of minor bodies, we only matched 300 trails with already known asteroids, taking into account the orbital uncertainties and their apparent motion. Therefore, our data contains 1,400 unknown objects or objects with very large orbital uncertainties. This is not surprising, since most of the apparent magnitudes of our trails (Figure 3) are fainter than magnitude 22, which is the approximate limit for the asteroid discovery surveys performed with ground-based telescopes. Most of these objects will correspond to main-belt objects with sizes <1 km, thus will help us characterise the distribution of small size asteroids in the Main Belt, a population poorly explored by current studies.
This project demonstrates the power of combining novel tools such as citizen science and artificial intelligence to efficiently explore archival images and obtain important results, with the invaluable help of Zooniverse volunteers, beyond the original scope of the Hubble observations.
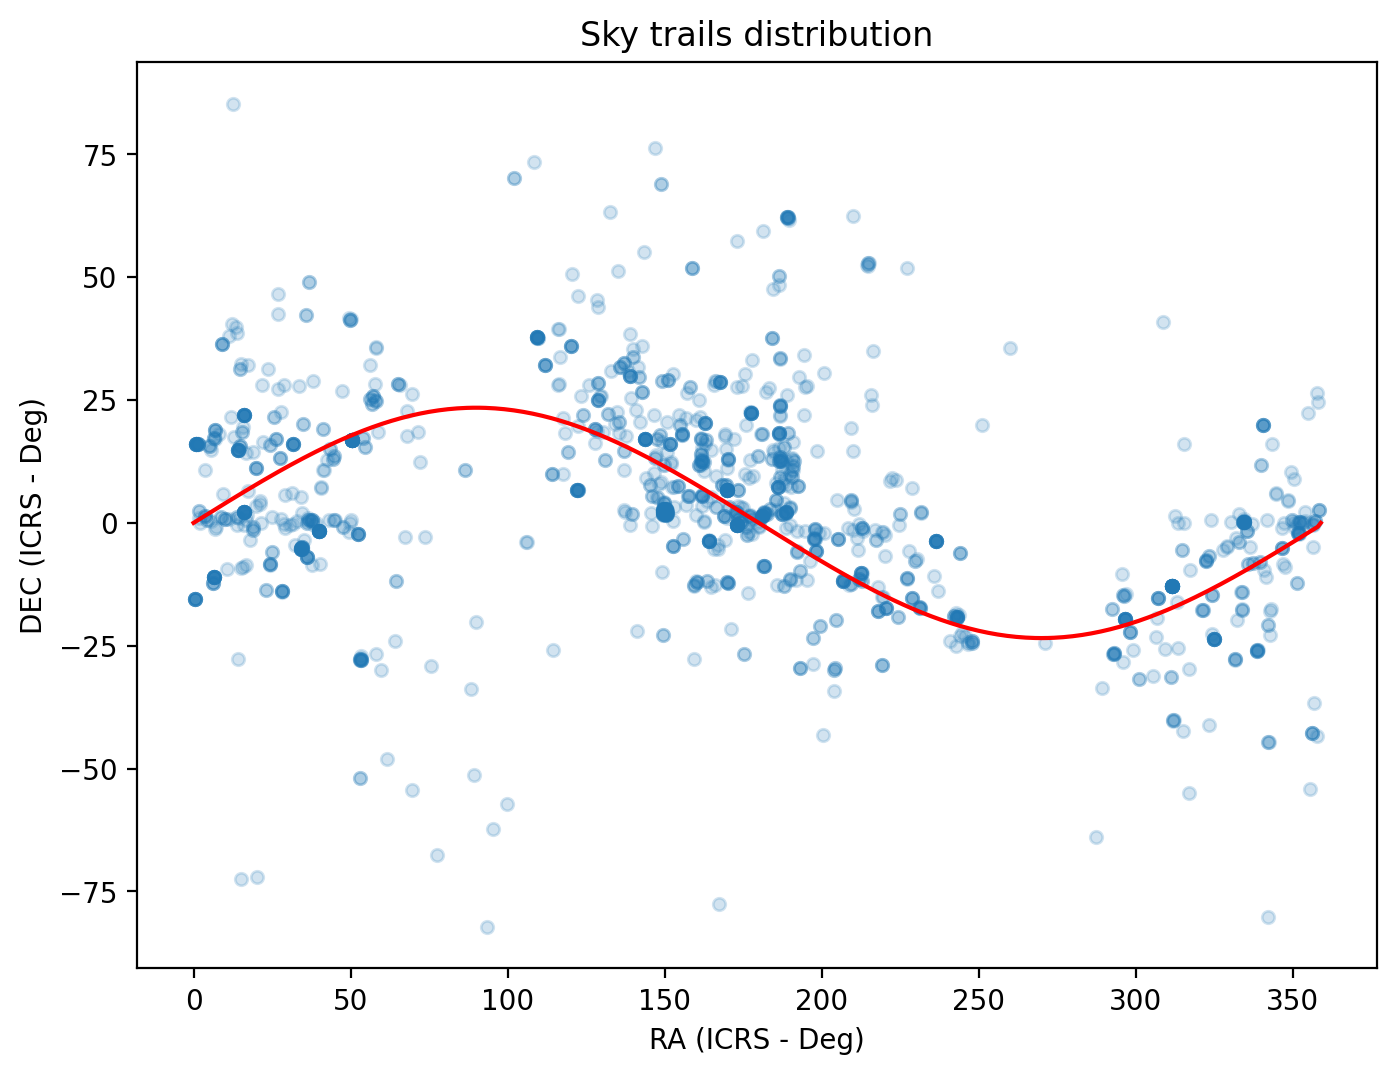
Figure 2: Sky distribution of the asteroids detected in HST observations. The vast majority of asteroids are in the Ecliptic plane (denoted with red). The two gaps are due to the lack of HST images in the Galactic Plane.
Figure 3: The apparent magnitude distribution of the Solar System objects identified in HST observations. The majority of the identified asteroids have magnitudes >22, fainter than the detection capabilities of many ground-based surveys.
References:
Hoffmann, S. L., Mack, J., et al., 2021, “The DrizzlePac Handbook”, Version 2.0, (Baltimore: STScI).
How to cite: Kruk, S., García Martín, P., Popescu, M., Merín, B., Mahlke, M., Carry, B., Karadag, S., Thomson, R., Racero, E., Giordano, F., Baines, D., and de Marchi, G.: Hubble Asteroid Hunter: Identifying Asteroid Trails in Hubble Space Telescope Images, Europlanet Science Congress 2021, online, 13–24 Sep 2021, EPSC2021-669, https://doi.org/10.5194/epsc2021-669, 2021.
The Atacama Desert and the Puna (an ecoregion of the Central Andes that mainly straddles three South American countries, Argentina, Bolivia and Chile, with altitudes ranging from 3500 to 4800 meters above sea level [masl] see. Figure 1) have extreme terrestrial environmental characteristics that make these two geographic locations potential analogs of the conditions that Mars may have experienced during its geological history [1,2].
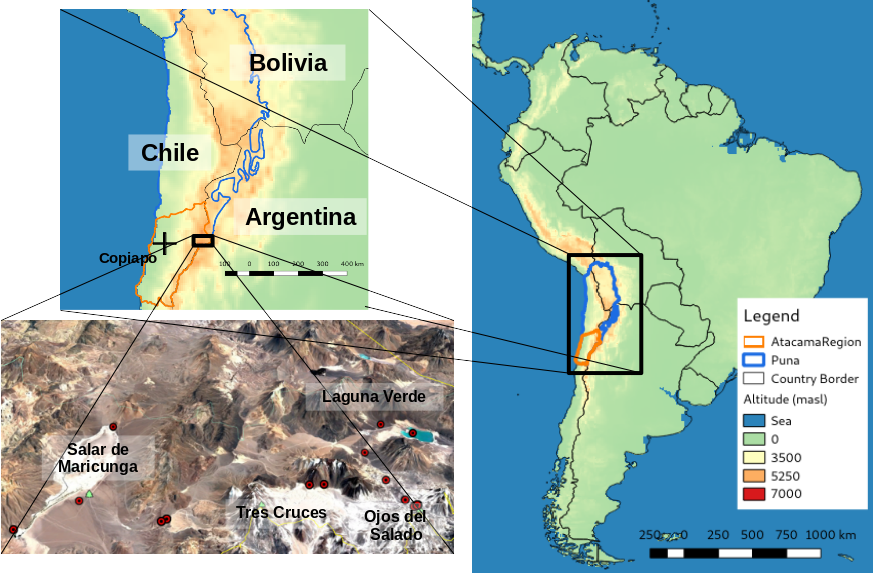
Figure 1 : Geographical landmark / Bottom left, Zoom in on the campaign area with sampling points present (Copyright : Google Earth)
The University of Atacama (UDA) located in Copiapo (27º37S / 70º33W) in Chile, aims to conduct multidisciplinary studies to better characterize the extreme environment of the Puna de Atacama. This project is based, in particular, on the forthcoming implementation of a high-altitude laboratory located at 3800 masl in the vicinity of the Salar de Maricunga (26º92S / 69º08W) [3]. The construction of this high-altitude laboratory should enable the scientific exploration of the region to be strengthened. Moreover, in order to benefit from expertise in the field of planetary analogs, the UDA has approached the EuroMoonMars program [4], which has more than ten years of experience in organizing analog field campaigns. This partnership in the making has taken shape with the setting-up of a first joint expedition at the end of February/beginning of March 2021. This expedition was organized by the Cryosphere and Water laboratory of the UDA (LICA) and has also been supported remotely by members of the EuroMoonMars program. During this high-altitude 10-days campaign (between 3800 and 6500 masl) the geographical extend included the Salar de Maricunga (26º92S / 69º08W), the Tres Cruces (27º07S / 68º79W), the Laguna Verde (28º88S / 68º47W) and finally the Ojos del Salado areas (27º11S / 68º54W) (see. Figure 1), whose potential as a Martian analog has been highlighted in recent publications [5].
To the initial objectives related to environmental sciences, scientific, technical, logistical and medical protocols specific to planetary science and space exploration were added, as the first steps towards for the organization of more complex campaigns involving EuroMoonMars people in the field. According to the multidisciplinary perspective of characterizing the environment of the Puna de Atacama and in addition to geophysical work, soil, water and biological material sampling was carried out along an altitudinal gradient (see. Figure 1).
This study aims to review the preliminary results of these samples, notably via the geochemical analysis of the soils (carried out using Inductively Couple Plasma spectrometry (ICP) and X-fluorescence spectroscopy) contextualized in the perspective of considering the Puna de Atacama as a Martian analog.
Acknowledgments: The authors would like to thank the people involved in the success of this project, which aims to both promote and protect the incredible natural heritage of the Puna de Atacama region.
References: [1] Navarro-González, R. et al. (2003) Science, 302(5647), 1018-1021. [2] Schmidt, S. K. et al. Antonie van Leeuwenhoek, 111(8), 1389-1401. [3] Tavernier, A. et al. (2021) 52nd LPSC conference 15-19 March, 2021. LPI Contribution No. 2548, id.2253.[4] Foing, B. et al. (2020) p. EPSC2020-14. [5] Kereszturi, Á. et al. (2020) Astrobiology, 20(6),677-683.
How to cite: Tavernier, A., Garcia, A., Ulloa, C., Oses, R., Bonnail, E., McGrath, K., Mohan, C., Reilly, H., Brady, G., and Foing, B.: Characterization of the Potential of the Puna de Atacama region in terms of Planetary Analogs : Preliminary results for the Salar de Maricunga, Tres Cruces, Laguna Verde and Ojos del Salado Areas, Europlanet Science Congress 2021, online, 13–24 Sep 2021, EPSC2021-452, https://doi.org/10.5194/epsc2021-452, 2021.
The PTAL Project: Mars2020/Perseverance 1 and ExoMars/Rosalind Franklin 2 rovers will look for traces of present or past life on Mars. To do so, the spectroscopic systems included in their analytical payloads will investigate the geochemistry and mineralogy of Martian rocks and soils to detect geological samples that could potentially host biomarkers. In order to optimize the scientific exploitation of planetary spectroscopic analysis, the PTAL project will provide the scientific community with a novel library of terrestrial analogue materials that have been selected based on their similarity to well-known Martian geological contexts. Funded by the European Union’s Horizon 2020 research and innovation programme under grant agreement Nº 687302, the PTAL online platform will be released to public in October 2021. As further detailed by Werner et al. during this conference, the core of the database are the spectroscopic data collected by means of multiple Raman (University of Valladolid, UVa, Spain), NIR (University of Paris-Sud, UP-Sud, France) and LIBS (French National Centre for Scientific Research, IRAP, France) systems. Spectroscopic results are additionally supported by X-ray diffractograms and thin section observations (University of Oslo, Uio, Norway) to provide an exhaustive geochemical and mineralogical characterization of the samples. The whole set of data, collected by means of both commercial systems and prototypes/flight spares (FS) of analytical instruments validated for Mars exploration (RLS-Sim, MicrOmega-FS, ChemCam-FS), will be available to the public thanks to a dedicated online platform, which main characteristics are detailed below.
The online PTAL platform:
The PTAL database will be accessible to public through the following URL: http://erica.uva.es/PTAL/. After login (credentials will be provided by the PTAL consortium upon request), future users will have access to the whole set of diffractometric and spectroscopic data collected from a total of 102 analogue materials. On one side, clicking on the sample name, the metadata associated to the selected terrestrial analogues are provided (e.g., Sample Name and Lithology, Sampling Campaign and coordinates) together with high quality pictures of the terrestrial analogue sample. On the other side, by clicking on “analytical summary”, the PTAL platform displays the list of NIR, LIBS, Raman and XRD analyses associated to the selected terrestrial analogue, together with a table summarizing and comparing the main results gathered from each technique (Figure 1).
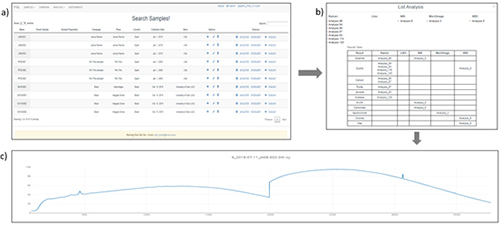
Figure 1: Screenshots collected from the PTAL online database: a) list of samples, b) summary result of a selected analogue, and c) online visualization of a selected Raman spectrum.
At this stage, all NIR, XRD, Raman and LIBS data have been successfully uploaded to the PTAL database 3–5. In detail, the PTAL database provides access to 102 diffractograms (1 per sample), 102 LIBS spectra, 102 NIR spectra collected by means of the commercial spectrometer, and 102 NIR data cubes obtained through the MicrOmega system (of them composed of 62500 spectra collected at steps of 20µm in a field of view of 5x5mm). Regarding Raman results, only the spectra providing the highest mineralogical information were uploaded to the PTAL database. As such, the number of Raman spectra was reduced from over 4500 to 577 (an average of 5-6 spectra per sample). 245 of them were collected by means of the RLS-Sim, while the remaining 332 were obtained with a commercial spectrometer. All data can be either visualized online or downloaded for further data comparison and processing. In this framework, it must be underlined the PTAL platform also gives access to a dedicated software for data treatment. Named SpectPro, the details of this downloadable software are detailed below.
The SpectPro software:
Developed in the framework of the ExoMars mission 6, the PTAL version of the SpectPro software could be downloaded from the PTAL webpage (download section) for both windows and MacOs operating systems. Through the SpectPro software, PTAL users will be able to run individual and multi-spectra operations such as labelling, trimming, shifting, normalization, baseline correction (see Figure 2).
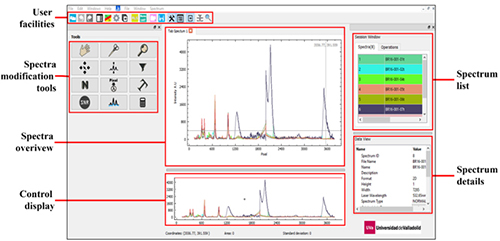
Figure 2: Screenshot of PTAL/SpectPro, in which the main functionalities and characteristics of the software are highlighted.
Among the main functionalities, the software also features a general-purpose spectrum calculator to perform lineal combinations, product and derivative of spectra, among others. The software team has been working to facilitate a direct access from SpectPro to the PTAL database, using the same credentials for access to the PTAL web interface. This connection will boost the capability of the scientist working in a planetary mission (but not only) to perform a fast and comprehensive characterization and identification of the mineral phases present in a sample by comparing the data obtained from the sample with the extensive spectral information included in the PTAL database. This will be possible by profiting from the navigation pane included in SpectPro. In addition, using the peak detection capabilities of SpectPro, it will be possible to perform sample identification based on the acquired spectra.
Acknowledgments: This work is financed through the European Research Council in the H2020- COMPET-2015 programme (grant 687302).
References: 1 Farley, K. A. et al. Space Sci. Rev. 216, 142 (2020); 2 Vago, J. L. et al. Astrobiology 17, 471–510 (2017); 3 Lantz, C. et al. Planet. Space Sci. 189, 104989 (2020); 4 Loizeau, D. et al. Planet. Space Sci. 193, 105087 (2020); 5 Veneranda, M. et al. J. Raman Spectrosc. 1–19 (2019) doi:10.1002/jrs.5652; 6 Lopez-Reyes G. et al. European Planetary Science Congress 2018 vol. 12 1–2 (2018).
How to cite: Veneranda, M., Saiz, J., Lopez-Reyes, G., Sanz-Arranz, A., Manrique, J. A., Medina, J., Loizeau, D., Lantz, C., Poulet, F., Cousin, A., Krzesińska, A. M., Dypvik, H., Werner, S. C., and Rull, F.: Planetary Terrestrial Analogues Library (PTAL): online database platform and spectroscopic tools, Europlanet Science Congress 2021, online, 13–24 Sep 2021, EPSC2021-105, https://doi.org/10.5194/epsc2021-105, 2021.
Please decide on your access
Please use the buttons below to download the presentation materials or to visit the external website where the presentation is linked. Regarding the external link, please note that Copernicus Meetings cannot accept any liability for the content and the website you will visit.
Forward to presentation link
You are going to open an external link to the presentation as indicated by the authors. Copernicus Meetings cannot accept any liability for the content and the website you will visit.
We are sorry, but presentations are only available for users who registered for the conference. Thank you.
Please decide on your access
Please use the buttons below to download the presentation materials or to visit the external website where the presentation is linked. Regarding the external link, please note that Copernicus Meetings cannot accept any liability for the content and the website you will visit.
Forward to session asset
You are going to open an external link to the asset as indicated by the session. Copernicus Meetings cannot accept any liability for the content and the website you will visit.
We are sorry, but presentations are only available for users who registered for the conference. Thank you.

