Europlanet Science Congress 2021
Virtual meeting
13 – 24 September 2021
Europlanet Science Congress 2021
Virtual meeting
13 September – 24 September 2021
MITM5
Geomapping other worlds

MITM5

Geomapping other worlds
Convener: Matteo Massironi | Co-conveners: Valentina Galluzzi, Andrea Nass, Monica Pondrelli, Claudia Pöhler, David Williams, Sébastien Besse
Wed, 22 Sep, 14:20–14:50 (CEST)

Session assets

Discussion on Slack

Oral and Poster presentations and abstracts

Chairpersons: Valentina Galluzzi, Claudia Pöhler, Sébastien Besse
EPSC2021-383
Andrea Nass, Matteo Massironi, Angelo Pio Rossi, Luca Penasa, Riccardo Pozzobon, Carlos Brandt, Giacomo Nodjoumi, Monica Pondrelli, Marco Pantaloni, Vallentina Galluzzi, Francesca Altieri, Alessandro Frigeri, Christian Carli, Lorenza Giacomini, Daniel Mège, Joanna Gurgurewicz, Pierre-Antoine Tesson, Lucia Marinangeli, Carolyn van der Bogert, and Claudia Poehler

Introduction: One essential part of NASA´s planetary geologic mapping program [1] is to coordinate and standardize the geological map process and products in planetary science. This important role is taken by the Astrogeology Team as USGS since the early sixties.

Within the scope of an EU project called PLANetary MAPping (PLANMAP, [2]), which ended this year, initial steps to develop complementary expertise in the EU was done. To continue addressing the major scientific and technological challenges facing modern planetary science and strengthen Europe´s position and the forefront of space exploration a new pan-EU infrastructure, the EUROPLANET 2024 Research Infrastructure (EPN-2024-RI), is coordinating mapping efforts in the EU and with international partners.  

One component of this 4-year-project is the Geologic MApping of Planetary bodies (GMAP). This aims to serve the European planetary community through an infrastructure to foster, support, and sustain the production of planetary geological maps and related products following standard procedures [e.g., 3]). In order to do so, GMAP is directly building on the PLANMAP work [2], and several partners and institutions with previous experience in planetary geologic mapping are involved. That means a planetary scientist can produce a geological map or a derived higher-level product through GMAP Virtual Access (VA) with the help and advice of the GMAP partner institutions, who will provide base-maps and technical aid as part of the Joint Research Activity (JRA). The maps will provide support for ongoing and future planetary missions, training activities, and non-standard science-driven mapping projects, such as space resource mapping.

GMAP – motivation and focus: The primary focus of GMAP is to streamline the processes which are involved in the production of geological and geomorphological maps of planetary surfaces. Here, we are mainly collecting existent approaches and related documents which handle the standardization of GIS-based mapping processes to enable the European community in creating cartographic products. The aim is to describe, develop, store, combine (!), access, update, revise, and finally, visualize scientific cartographic products. As soon as these steps can be handled in well-defined workflow and distributed among researchers and mappers, the highest possible level of homogenization, and thus standardization, is reached. This is the essential step to use these research products as a basis for broader studies. During the first year, coordination activities targeted the planning and the initial setup of digital infrastructure services that will be needed for supporting VA and JRA activities. The domain europlanet-gmap.eu was acquired by GMAP and will serve as the entry point for presenting the GMAP initiative, collecting most notable resources, for users’ access, for providing basic guidance for publishing new maps, request support and contribute to the overall project. The website is built on the same open source Content Management System (WordPress, [4]) already employed for the main Europlanet website, on https://europlanet-society.org. The GMAP data portal (see figure 1, [5]) and additional services and tools are being setup.

GMAP – requirements and developments: In order to extract the requirements to support the European community in streamlining their planetary geological maps, a document was produced during the last year of JRA activities. The document contains state of the art information in this field and addresses the geologic mapping and cartographic aspects of the various Solar System bodies.
Geologic process-specific and body-specific best practice and published case studies are included in [1]. The approaches for two-dimensional mapping and three-dimensional geologic mapping and modelling are introduced, as well as the range of non-standard map types that are envisaged within GMAP activities.
In particular the following main topics are in development: 1) a mapping guide with essential information for the GIS-based mapping process, including CRS symbology, metadata, and naming conventions; 2) mapping templates for GIS-based mapping and for final map layout, as well as instructions about naming conventions [6].
Mapping review directions are indicated, as well data sharing, distribution and discovery. Proposed standards, best practices, and tools are based on those existing, as well as on additional or new developments and adaptations [e.g. 7]. The document will be periodically updated. 

GMAP – summary and outlook: The development of the GMAP data portal [5] was initiated, based on existing developments from PLANMAP. The availability of GMAP products and underlying datasets is going to be FAIR (findable, accessible, interoperable, and reusable [8]), as also recommended by the VA Review Board (see also [9]), and building on the practices of PLANMAP [10], see also e.g. [11]). The use of existing tools by NASA and USGS such as Integrated Software for Imagers and Spectrometers (ISIS, [12]), and Ames Stereo Pipeline (ASP, [13]) will be promoted. Moreover, in addition to the community support by the GMAP VA, interaction with the community via OpenPlanetary [14] is also planned. All further information and current developments are available via [15] and [16].

Acknowledgments: GMAP and Europlanet 2024 RI have received funding from the European Union's Horizon 2020 research and innovation programme under grant agreement No 871149.

References: [1] Astrogeology Team at USGS, https://www.usgs.gov/centers/astrogeology-science-center, [2] https://planmap.eu/, [3] Nass, et al., (2020) Standard definition Document 1st iteration, available online at  https://www.europlanet-gmap.eu/about-gmap/deliverables, [4] https://de.wordpress.org/, [5] GMAP data portal, available online at https://data.europlanet-gmap.eu, [6] GMAP Consortium (2021) GMAP wiki documentation and service pages, available online at https://wiki.europlanet-gmap.eu/, [7] Penasa, L., et al. (2020) Europlanet Science Congress 2020, EPSC2020-1057, doi:10.5194/epsc2020-1057, 2020, [8] Wilkinson, M., et al. (2016) The FAIR Guiding Principles for scientific data management and stewardship. Sci Data 3, 160018, doi:org/10.1038/sdata.2016.18, [9] Raugh et al., (2020), VAs 1st year External Board Review report, available online at https://www.europlanet-society.org/europlanet-2024-ri/europlanet-2024-ri-deliverables/, [10] Brandt, C. H., et a., EGU General Assembly 2020, EGU2020-18839, doi: 10.5194/egusphere-egu2020-18839, [11] Luzzi, E.,  et al. (2020)  JGR-Planets, 125,  doi:10.1029/2019JE006341, [12] Gaddis, L., et al. (1997). An overview of the Integrated Software for Imaging Spectrometers (ISIS), in: Lunar and Planetary Science XXVIII. p. 1997, [13] Beyer, R. A., et al. (2018) Earth and Space Science, 5, 537-548, doi:10.1029/2018EA000409, [14] Manaud et al., (2019) EPSC-DPS Joint Meeting, EPSC Abstracts, Vol. 13, EPSC-DPS2019-1654-1, [15] https://wiki.europlanet-gmap.eu/bin/view/Main/Documentation/, [16] https://wiki.europlanet-gmap.eu/bin/view/Main/Services%20and%20tools/

How to cite: Nass, A., Massironi, M., Rossi, A. P., Penasa, L., Pozzobon, R., Brandt, C., Nodjoumi, G., Pondrelli, M., Pantaloni, M., Galluzzi, V., Altieri, F., Frigeri, A., Carli, C., Giacomini, L., Mège, D., Gurgurewicz, J., Tesson, P.-A., Marinangeli, L., van der Bogert, C., and Poehler, C.: GMAP – European Mapping efforts for Geologic Mapping of Planetary bodies, Europlanet Science Congress 2021, online, 13–24 Sep 2021, EPSC2021-383, https://doi.org/10.5194/epsc2021-383, 2021.

EPSC2021-489
|
ECP
Veronica Camplone, Angelo Zinzi, Matteo Massironi, and Angelo Pio Rossi

Introduction:  The Space Science Data Center (SSDC) developed MATISSE (Multi- purposed Advanced Tool for the Instruments for the Solar System Exploration, [1]) webtool, whose v2.0 update [2] is available at https://tools.ssdc.asi.it/Matisse/, which allows access to data of the planetary exploration missions.

The MATISSE tool uses some protocols provided by the Virtual European Solar & Planetary Access (VESPA), including EPN-TAP, and allows access to a series of services without necessarily having to download the data, but view the maps directly online.

In this context the work here presented points at improving and expanding the functionalities of the MATISSE tool to the planetary geology, by including some already published geological maps. These will be essential in order to make MATISSE a useful tool for the analysis of planetary surfaces.

MATISSE for planetary geology: The geological maps involved in this project will be of fundamental help to the scientific community in the geological characterization of landing sites and to obtain useful information for the study of planetary bodies surface.

The good choice of the landing site, which satisfies both engineering and scientific requirements, represents one of the key points for the success of a space mission.

For example, the identification of landing sites, of particular geological / mineralogical interest, will be carried out thanks to data fusion techniques between visible images and infrared spectroscopic measurements. The tool in question will give the user the opportunity to observe the area in question integrating data of multiple sources.

MATISSE will also be able to carry out geomorphological analysis and morphometric products (e.g. slopes, relief, roughness index) which will allow a complete investigation both from the geological and engineering point of view.

The geological maps will be integrated with mineralogical maps, obtained using infrared spectroscopic data.

In collaboration with PlanMap and GMap teams we are currently working to include Martian, Hermean and Cerean surfaces so that both recently ended missions (e.g., NASA’s Dawn) and missions still not in their scientific phase (e.g., ESA’s BepiColombo) would benefit for this work.


Work methodology: The geological maps of interest will be downloaded in appropriate format, so that every polygon representing a geological unit can be separately inserted into the geospatial database of MATISSE and be easily retrieved by the user.

In particular, the user can choose one or more of the polygonal units as input for the geographical query after selecting the target and the instruments of interest. In this way the MATISSE capabilities can be fully exploited even trough geological oriented requests.

Here are some examples of areas that we have analyzed on the Martian surface, with the collaboration of the PLANMAP team. These sites, Firsoff Crater and Commelin Crater, are located in Arabia Terra region. After a careful geological analysis of the two craters, similar morphological characteristics were identified [3].

After starting the query, the user will see the area with the selected lithologies displayed (figure 1) and can carry out appropriate analyzes.

Expected outcomes: We plan to make available the first release of MATISSE with geological maps in the next months, even if starting with only limited capabilities.

The inclusion of these functionalities in the tool could produce a sensible step forward in the study of planetary geology, with the possibility of better exploiting different datasets and taking also into account the collaboration of different teams already leaders if this field.

Another goal will be to expand the use of the tool, making it similar to the Geographic Information System (GIS). We will expand the possibility of selecting specific areas to be analyzed on the base of the geographical position of the data and the pertinence to specific geological units. It will be also possible to obtain topographic profile and select multiple data to be simultaneously observed. All these analyzes will be performed directly on 3D models.

References: [1] Zinzi A. et al. (2016) Astron. Comput., 15, 16-28. [2] Zinzi A. et al. (2019) EPSC-DPS Joint Meeting 2019, id. EPSC-DPS2019-1272. [3] Pondrelli M. et al. (2010) Earth and Planetary Science Letters, 304, 511-519.


How to cite: Camplone, V., Zinzi, A., Massironi, M., and Rossi, A. P.: Geological Maps in MATISSE tool, Europlanet Science Congress 2021, online, 13–24 Sep 2021, EPSC2021-489, https://doi.org/10.5194/epsc2021-489, 2021.

EPSC2021-429
|
solicited
An update on the Solar System Treks Mosaic Pipeline: public server and new mosaic products
(withdrawn)
Aaron Curtis, Heather Lethcoe, Emily Law, and Brian Day
EPSC2021-646
|
ECP
Claudia Pöhler, Carolyn van der Bogert, Harald Hiesinger, Mikhail Ivanov, and James Head

Introduction:  The South Pole-Aitken (SPA) basin is located on the lunar farside. Centered at ~53° S, 191° E the SPA is the largest observable basin on the Moon [1-5]. The SPA Region in general and  the South Pole in particular are high priority targets for ongoing and future robotic and human missions [e.g., 6–10]. The area potentially includes exposed mantle material [14, 15], sources of volatiles (e.g., pyroclastic deposits [11]), and permanently shadowed regions around the South Pole that may harbor ice or other volatiles [12]. As the oldest lunar basin, the timing of SPA formation gives valuable information on the formation and evolution of the lunar crust [11,13]. These missions make detailed studies of the geological history and setting of the region necessary. Here, we provide a geologic map at a scale of 1:500,000 of the SPA basin region, including the South Pole region which is an extension of a map of the Apollo basin region [13]. Our map provides a comprehensive overview of the geology in the region.

Methods:  We used the Lunar Reconnaissance Orbiter (LRO) Wide-Angle Camera (WAC) basemap (100 m/pixel) for the majority of the mapping. To look at smaller areas and to identify specific features, we then also used Narrow Angle Camera (NAC; 0.5 m/pixel) [14] and Kaguya (10 m/pixel) data. Spectral information was taken from Clementine [15], M3 [16], and Kaguya MI [17] data. We determined the topographic features using Lunar Orbiter Laser Altimeter (LOLA)/Kaguya merged digital elevation models with a resolution of 59 m/pixel [18] where available. For higher latitudes we used LOLA digital elevation products [19, 20]. At the poles we mitigate the effect of low solar illumination angles, which cause significant shadows, by producing hillshade maps with various illumination conditions. 

We worked according to PLANMAP mapping standards [21], an extension of USGS standards [22].

With the available data we identified different units and features based on their morphological appearance, albedo contrasts and, if applicable, spectral signal. We then established a relative stratigraphy for these units using morphological and stratigraphic evidence. Next, we performed crater size-frequency distribution (CSFD) measurements and determined absolute model ages (AMAs) using the production and chronology functions of [23] to put constraints on the chronology. CSFD measurements were made using CraterTools [24] in ArcGIS, and fit with Craterstats [25]. The technique is described in detail by [23, 26]. 

Geology:  In this map, we cover the full extent of the SPA basin. We were able to identify the rim of SPA basin, which presents itself best in the elevation data. Due to its old age, however it remains difficult to identify original rim units. Best preserved in the NE part of SPA basin the rim makes up a two ring structure. While in most of the other segments of the rim, the rim itself is covered by younger geologic units.  

We extended our map to the East from the central SPA basin to include a large part of Orientale basin. Due to the size and proximity to the SPA basin, Orientale basin has had a modifying influence on large parts of SPA basin. The whole area is covered in small, sharp-rim craters some of which form crater chains and clusters. A plausible origin for most of these small sharp-rim craters could be the Orientale basin. The area also exposes extensive light plains of which some might also coincide with the formation of Orientale basin.

Acknowledgments:  This paper is part of a project that has received funding from the European Union's Horizon 2020 research and innovation programme under grant agreement Nº776276 (PLANMAP) and N°871149 (GMAP).

References:   [1] Stuart-Alexander (1978) USGS Map I-1047. [2] Spudis et al. (1994) Science 266, 1835-1839. [3] Hiesinger and Head (2004) PLPSC 35, 1164. [4] Shevchenko et al. (2007) Solar Sys Res 41, 447-462. [5] Garrick-Bethell and Zuber (2009) Icarus 204, 399-408. [6] Flahaut et al. (2020) PSS 180, 104750. [7] Steenstra et al. (2016) Adv Space Res 58, 1050–1065. [8] Allender et al. (2018) Adv Space Res 63, 692–727. [9] Hiesinger et al. (2019) LPSC 50, 1327. [10] Huang et al. (2018) JGR 123, 1684 – 1700. [11] Wilhelms (1987) USGS SP-1348, 302. [12] Nozette et al. (2001) JGR 106, 23253– 23266. [12] Hiesinger et al. (2012) LPSC 43, 2863. [13] Ivanov et al. (2018) JGR 123, 2585–2612. [14] Robinson et al. (2010) Space Sci Rev 150, 81–124. [15] Pieters et al. (1994) Science 266, 1844–1848. [16] Isaacson et al. (2013) JGR 118, 369–381. [17] Ohtake et al (2013) Icarus 226, 364–374. [18] Barker et al. (2016) Icarus 273, 346-355. [19] Smith et al. (2010) Icarus 283, 70-91. [20] Smith et al. (2010) GRL 37, L18204. [21] wiki.planmap.eu/display/public/D2.1-public. [22] FGDC (2006) FGDC-STD-013-2016. [23] Neukum et al. (2001) Space Sci Rev 96, 55–86. [24] Kneissl et al. (2011) PSS 59, 1243–1254. [25] Michael and Neukum (2010) EPSL 294, 223–229. [26] Hiesinger et al. (2000) JGR 105, 29239–29276. 

How to cite: Pöhler, C., van der Bogert, C., Hiesinger, H., Ivanov, M., and Head, J.: Geological Mapping of the South Pole-Aitken Basin Region, Europlanet Science Congress 2021, online, 13–24 Sep 2021, EPSC2021-646, https://doi.org/10.5194/epsc2021-646, 2021.

EPSC2021-749
|
ECP
Riccardo Pozzobon, Matteo Massironi, Luca Penasa, and Sabrina Ferrari

Rembrandt is a 715 km-diameter basin on Mercury centered at 32.89°S latitude and 87.86°E longitude. This crater constitutes a remarkable example of the stratigraphic variability on Mercury. The uppermost smooth plains of volcanic origin, which are temporally unrelated to the impact event, have been distinguished by the surrounding smooth plains utilizing spectral information. The basin is crosscut by a prominent NE-SW thrust system more than 1000 km long, named Enterprise Rupes (Ferrari et al., 2015; Galluzzi et al., 2015; Semenzato et al., 2020), attributed mainly to crustal shortening induced by global contraction (see Semenzato et al., 2020 and references therein). This consists of a set of lobate scarps and wrinkle ridges with inverse to transpressional kinematics (Massironi et al., 2015).


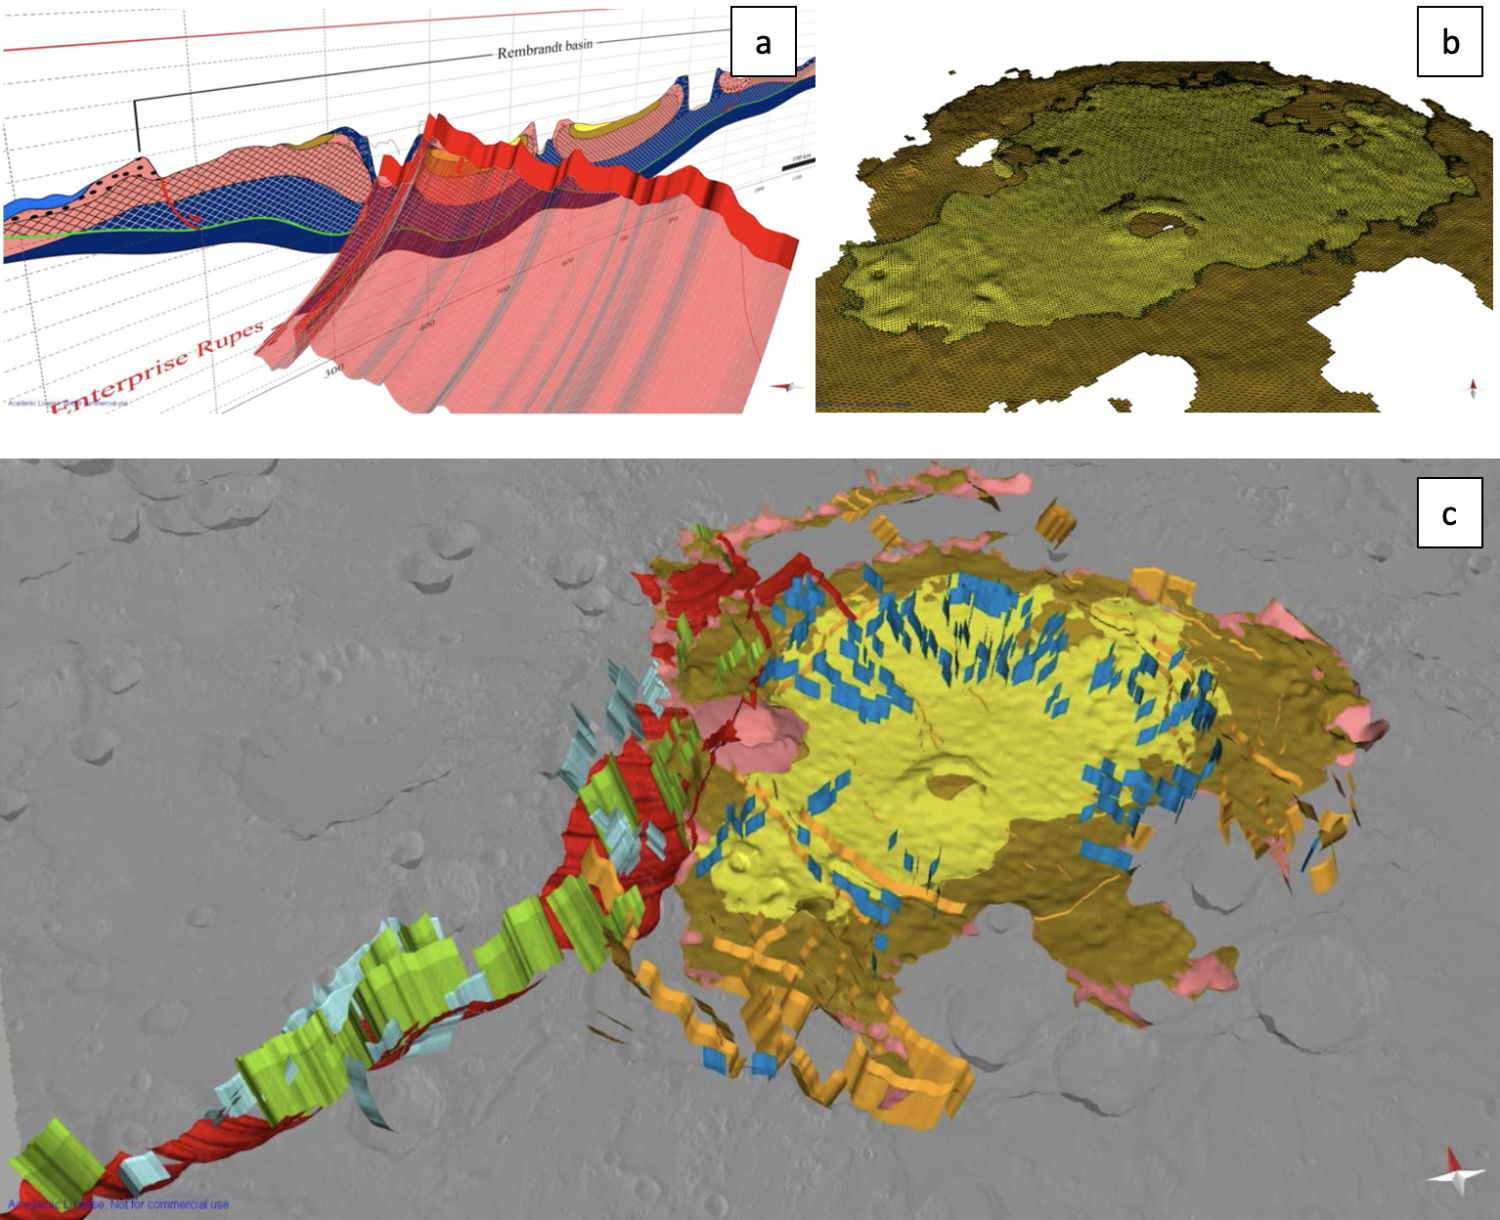
The aim of this work, as part of the PLANMAP Horizon 2020 project, is to use all the available information on the site to provide a comprehensive 3D model of both the structural setting and the thicknesses of the main units of the Rembrandt basin infilling using explicit modeling approach.

The principle of three-dimensional explicit modelling relies on the creation of 3D surfaces based on geologic observations and constraints. While implicit modelling and its effectiveness rely on the amount of available data both on the surface and the subsurface to provide a mathematical solution that satisfies all the constraints, the explicit geological modelling implies a more extended geologic interpretation based on the available data which is subject to the operator’s experience and is essentially based on the construction of several interpreted cross-sections to be then interpolated generating mesh surfaces. The advantage is that such type of geologic modelling can be applied in areas with scarcity of data, especially related to subsurface constraints.


In the case of the Rembrandt basin, we mainly based our reconstruction on the geo-stratigraphic map and geologic cross-section from Semenzato et al. (2020). Additional constraints, regarding fault kinematics and fault plane geometry, were provided by Galluzzi et al. (2015) and Crane (2020). As a basemap, we used the MESSENGER MDIS global mosaic at 166 m/pixel together with the MDIS global DEM (665 m/pixel), both of them available in the USGS repositories, with the same Lambert Conformal Conic (LCC) projection of the geo-stratigraphic map.

In Rembrandt basin two different infillings - the YIP (Young Interior smooth Plains) and OIP (Older Interior smooth Plains) units - overlay the IT (para-autochtonous intracrater plains) base unit. The thickness of these units was estimated with several methods in Semenzato et al., (2020), among which the presence of impact craters excavating and exposing the inner basin stratigraphy. We used such craters for the construction of the interpreted cross-sections in complement to the one by Semenzato et al., (2020). These were subdivided into two intersecting sub-parallel sets. The interpreted subsurface horizons were used for mesh interpolation together with the geologic contacts between the different units on the surface creating meshes representin ghte top of the YIP, OIP and IT basin infilling units. The volume between them was then calculated.

The structural modelling was carried out using the structural mapping from Semenzato et al., (2020) and Ferrari et al., (2015). The faults’ vergence and their angles were extracted both thanks to the illumination conditions on the image mosaic and topography, to the measurements provided by Galluzzi et al., (2015) on displaced impact craters and to the work by Crane (2020) and Massironi et al., (2015). This way we were able to model the Enterprise rupes thrust geometry, its splays and backthrusts as well as contractional lobate scarps and extensional radial features within the basin infilling units.

Although requiring a certain degree of assumptions especially on planetary bodies, the 3D geomodelling proves to be a useful tool in order to check surface interpretations that might change once set into 3D environment and refine volume calculations and 3D shape of geologic units. Follow up investigations will focus on forward and backwards modeling work on the activity of the Enterprise Rupes system.

Figure 1: in a) the mesh construction for the main Enterprise rupes structure, constrained with surface mapped lineaments and anchored on the geologic cross-section. In b) the tetrahedral volumetric mesh representing the two events of Rembrandt basin infilling. In c) the structural and stratigraphic geomodel of Rembrandt basin (https://skfb.ly/6ZqtI).


Acknowlegements:

This research was supported by the European Union’s Horizon 2020 under grant agreement No 776276‐PLANMAP.


References:


  • Crane, K., 2020. Structural interpretation of thrust fault-related landforms on Mercury using Earth analogue fault models. Geomorphology 369, 107366. https://doi.org/10.1016/j.geomorph.2020.107366
  • Ferrari, S., Massironi, M., Marchi, S., Byrne, P. K., Klimczak, C., Martellato, E., & Cremonese, G. (2015). Age relationships of the Rembrandt basin and Enterprise Rupes, Mercury. Geological Society, London, Special Publications, 401(1), 159–172. https://doi.org/10.1144/SP401.20
  • Galluzzi, V., Di Achille, G., Ferranti, L., Popa, C., & Palumbo, P. (2015). Faulted craters as indicators for thrust motions on Mercury. Geological Society, London, Special Publications, 401(1), 313–325. https://doi.org/10.1144/SP401.17
  • Massironi, M., Di Achille, G., Rothery, D. A., Galluzzi, V., Giacomini, L., Ferrari, S., Zusi, M., Cremonese, G., & Palumbo, P. (2015). Lateral ramps and strike-slip kinematics on Mercury. Geological Society, London, Special Publications, 401(1), 269–290. https://doi.org/10.1144/SP401.16
  • Semenzato, A., Massironi, M., Ferrari, S., Galluzzi, V., Rothery, D. A., Pegg, D. L., Pozzobon, R., & Marchi, S. (2020). An Integrated Geologic Map of the Rembrandt Basin, on Mercury, as a Starting Point for Stratigraphic Analysis. Remote Sensing, 12(19), 3213. https://doi.org/10.3390/rs12193213

How to cite: Pozzobon, R., Massironi, M., Penasa, L., and Ferrari, S.: 3D geological model of Rembrandt basin on Mercury and calculation basin infilling volumes, Europlanet Science Congress 2021, online, 13–24 Sep 2021, EPSC2021-749, https://doi.org/10.5194/epsc2021-749, 2021.

EPSC2021-789
|
ECP
Valentina Galluzzi, Luigi Ferranti, Lorenza Giacomini, and Pasquale Palumbo

The Discovery quadrangle of Mercury (H-11) located in the area between 22.5°S–65°S and 270°E–360°E encompasses structures of paramount importance for understanding Mercury’s tectonics. The quadrangle is named after Discovery Rupes, a NE-SW trending lobate scarp, which is one of the longest and highest on Mercury (600 km in length and 2 km high). By examining the existing maps of this area (Trask and Dzurisin, 1984; Byrne et al., 2014), several other oblique trending structures are visible. More mapping detail could be achieved by using the MErcury Surface, Space ENvironment, GEochemistry, and Ranging (MESSENGER) Mercury Dual Imaging System (MDIS) imagery.

We aim at mapping the structures of H-11 at high-resolution by using MESSENGER/MDIS basemaps, in order to understand its regional tectonic history by following the work done in the Victoria quadrangle (H-2) (Galluzzi et al., 2019). Differently from H-2, located in the same longitudinal range but at opposite latitudes, this area lacks in N-S trending scarps, such as the Victoria-Endeavour-Antoniadi fault system, which dominates the northern hemisphere structural framework. The existing tectonic theories predict either an isotropic pattern of faults (global contraction) or an ordered distribution and orientation of faults (tidal despinning) for Mercury. If we expect that the existing tectonic patterns were governed by only one of the two processes or both together, it is difficult to understand how such different trends formed within these two complementary areas. The structural study done for H-2 reveals that the geochemical discontinuities present in Mercury’s crust may have guided and influenced the trend and kinematics of faults in that area (Galluzzi et al., 2019). In particular, the high-magnesium region seems to be associated with fault systems that either follow its boundary or are located within it. These fault systems show distinct kinematics and trends. The south-eastern border of the HMR is located within H-11. Hence, with this study, we aim at complementing the previous one to better describe the tectonics linked to the presence of the HMR. Furthermore, this geostructural map will complement the future geomorphological map of the area and will be part of the 1:3M quadrangle geological map series which are being prepared in view of the BepiColombo mission (Galluzzi, 2019). Acknowledgments: We gratefully acknowledge funding from the Italian Space Agency (ASI) under ASI-INAF agreement 2017-47-H.0.

Byrne et al. (2014). Nature Geoscience, 7(4), 301-307.
Galluzzi, V. (2019). In: Planetary Cartography and GIS, Springer, Cham, 207-218.
Galluzzi et al. (2019). Journal of Geophysical Research: Planets, 124(10), 2543-2562.
Trask and Dzurisin (1984). USGS, IMAP 1658.

How to cite: Galluzzi, V., Ferranti, L., Giacomini, L., and Palumbo, P.: Mapping the regional tectonic asset of the Discovery quadrangle of Mercury, Europlanet Science Congress 2021, online, 13–24 Sep 2021, EPSC2021-789, https://doi.org/10.5194/epsc2021-789, 2021.

Discussion