TP12
Session assets
Please decide on your access
Please use the buttons below to download the presentation materials or to visit the external website where the presentation is linked. Regarding the external link, please note that Copernicus Meetings cannot accept any liability for the content and the website you will visit.
Forward to presentation link
You are going to open an external link to the presentation as indicated by the authors. Copernicus Meetings cannot accept any liability for the content and the website you will visit.
We are sorry, but presentations are only available for users who registered for the conference. Thank you.
Oral and Poster presentations and abstracts
The interaction between reduced gases and the pre-oxygenic photosynthesising microbial population is key to determining the potential methane greenhouse that warmed the Archean. The potential biotic methane flux could have sustained methane concentrations between 100 to 35,000ppm [1]. Looking at the effect of these methane fluxes and concentrations in a 3D atmosphere are crucial to understanding these processes in more detail.
Here, I will present results from a state-of-the-art 3D climate model [2] along with a low dimensional biogeochemical model [3], exploring the potential biotic methane fluxes and subsequent concentrations. From this, we can examine the potential climate conditions during the Archean. We have extended a 1D exploration of methane’s diminished greenhouse potential during the Archean [4] by looking at how methane concentrations affect cloud distribution, atmospheric dynamics and the surface temperature.
We find that global surface temperature peaks at pCH4 ~100 Pa, with this peak shifting at different CO2 concentrations. Equator-to-pole temperature differences also has a peaked response, with the impact strongly dependant on the CO2 concentration. These changes come about from the balance between the effect of methane and carbon dioxide on atmospheric dynamics. This is due to changes in the heating structure of the atmosphere, which also affects the cloud distribution.
[1] Kharecha, Kasting & Siefert (2005) Geobiology 3, 53-76.
[2] Mayne et al. (2014) Geosci. Model Dev. 7, 3059–3087.
[3] Lenton & Daines (2017) Ann. Rev. Mar. Sci. 9:1, 31-58.
[4] Byrne & Goldblatt (2015) Clim. Past 11, 559–570.
How to cite: Eager, J., Mayne, N., and Lenton, T.: Methane’s non-linear effect on climate in a three-dimensional Archean atmosphere, Europlanet Science Congress 2021, online, 13–24 Sep 2021, EPSC2021-541, https://doi.org/10.5194/epsc2021-541, 2021.
Cloud tracking has been used to measure motions of planetary atmospheres remotely without direct observations. Cloud tracking is a method to track the movements of cloud parcels using temporally-continuous cloud images to obtain cloud motion vectors. Since it is considered in most of the cases that clouds move at the same speed and the same direction as the surrounding atmosphere, the wind direction and wind velocity can be obtained by tracking the movement of clouds. This method has been applied to the atmospheres of the planets, such as Venus and Jupiter, where direct observation is difficult as well as that of the Earth's atmosphere.
In the cloud tracking methods developed so far, only the parallel movement of the characteristic pattern is assumed, and the rotation of the pattern is not directly measured. Here we developed a new algorithm to track the parallel movement and the rotation of cloud patterns using the rotation invariant phase-only correlation method. In this method, the tracking region is Fourier-transformed before applying the phase correlation method for measuring parallel movement, and logarithmic polar coordinate conversion is performed to the amplitude spectra so that the rotation and enlargement/reduction motions can be obtained as parallel movements. With this method, not only the parallel movement but also the rotational movement of the characteristic pattern can be detected at the same time.
We first applied the newly-developed method to simulated image pairs. The rotation rate of the cloud pattern and the vorticity derived from the velocity field were compared in three velocity patterns: solid body rotation, irrotational vortex, and sinusoidal velocity field in the latitude and longitude directions. As a result, in the case of a solid body rotation, the wind speed field and the rotation angle were determined correctly. Large-scale rotations can be measured more accurately by the new method than by the calculation of vorticity from the cloud-tracked velocity. When the scale of the velocity structure is decreased, the number of missing cloud tracking vectors increases, and thus the spatial pattern of the vorticity becomes difficult to obtain. Even in such cases, the spatial pattern of the rotation rate can be relatively well retrieved although its amplitude is underestimated.
The new method was applied to Jupiter and Venus images based on the results above. For Jupiter, many small eddies were found to be distributed in the equatorial region. The spatial scales and the strengths of the eddies resemble those seen in numerical simulations. The observed vortex chains can contribute to the formation of Jupiter's equatorial jet. For Venus, though small-scale eddies are less prominent, a planetary-scale distribution of the rotation rate with a north-south reflection symmetry was seen, such that anti-clockwise rotation occurs in the northern hemisphere and clockwise rotation in the southern hemisphere. Since the large-scale rotation pattern is consistent with the latitudinal shear of the mean zonal wind, the result means that the rotation of small-scale clouds is caused by the large-scale wind. This result suggests that the small-scale streaky features at mid-latitudes, whose origin is poorly understood, are created by the deformation of clouds by large-scale winds.
The newly-developed method can extract smaller scale eddies than those observed in the previous studies; the method has enabled investigation of the interaction between different scales in a wider wavelength range. The method would also enable studies of mesoscale weather systems such as deep convection and also studies of upward energy cascade from small-scale convective storms to planetary scale motions in planetary atmospheres.
How to cite: Muto, K. and Imamura, T.: Analysis of planetary cloud images considering local rotation, Europlanet Science Congress 2021, online, 13–24 Sep 2021, EPSC2021-653, https://doi.org/10.5194/epsc2021-653, 2021.
In 2018 a regional dust storm on Mars has evolved to a global scope, becoming one of the largest dust storms ever observed. These rare and unpredictable events are poorly known. A key factor for its evolution is the role played by the Martian winds. Measuring winds on Mars is a real challenge for remote observations but a global dust storm offers to us a unique opportunity thanks to an innovative technique to measure the Doppler effect of solar Fraunhofer lines back-scattered on the Mars dust cloud. A high spectral resolution is required to resolve the solar lines and to allow us to measure with precision the line shifts due to aerosol motion and in this manner retrieve the related wind map.
We used dedicated ground-based observations made with the Ultraviolet and Visual Echelle Spectrograph (UVES) at the European Southern Observatory's Very Large Telescope (VLT) facility in Chile. This instrument's high resolution (R ~100000) allows for the dust cloud velocity to be measured, by computing the Doppler shift induced in the Fraunhofer lines (λ of 420-1100 nm) in the solar radiation that is back-scattered in the dust suspended in the Martian atmosphere, by the motion of that same dust particles, with an average error of approximately 5 ms-1.
The processes that allow for the development of global dust storms are poorly understood. Furthermore, the cut-off mechanisms that spur the end of these storms are also without consensus and may even vary from storm to storm. During such events dust can be lifted to heights above 50 km across all latitudes and longitudes, increasing the optical depth along the dust layer in atmospheric suspension and increasing the heat absorbed at each altitude covered by dust [1,2]. Global dust storms are complex stochastic events that can drastically alter the atmospheric dynamics [3,4]. These storms usually develop in the southern hemisphere during southern Summer and Spring ( Ls ≈ 180º - 360º), however, the 2018 storm started developing in the northern hemisphere on Ls ≈ 185º.
Our understanding of both the initiation and decline of global dust storms is only marginal, nevertheless we do know that such events probably originate from the superimposition of three circulation components: the Hadley cell, thermal tides and topographically controlled circulations. This mechanism was suggested by Leovy (1973) [5] and relies on the seasonally increased insolation and dust loading coupled with the above-mentioned components to allow certain storms to become global at the planetary scale. The decay of dust storms is even more obscure as the cause for the halting of the dust lifting hasn't been unambiguously identified. Either the depletion of surface dust available for lifting shuts off the lifting events (which requires replenishment of the surface dust sources) or the decrease in intensity of the various components allows for the surface wind stress to drop below the required threshold for dust lifting [6,7].
Mars' atmosphere is highly transparent in the visible and ultraviolet ranges and the back-scattered radiation in those wavelength ranges in the atmosphere is negligible which precludes the application of the Doppler velocimetry method that we developed and fine-tuned for the case of Venus [8,9,10,11,12]. However, during global dust storms, the opacity of the atmosphere increases and allows for the scattering of enough light in the suspended dust in the middle atmosphere for the application of our Doppler method in an effective way.
The adaptation of our Doppler velocimetry method took in account the geometry of our observations. Spherical geometry was used to locate the observations within the planet, as seen from Earth at the time of each observation, and to compute the de-projection of the radial Doppler velocities from the observer's line-of-sight, for each point of the slit and for each exposure. The rotation velocity's contribution to the overall Doppler shift was removed by computing and subtracting the rotation velocity at each point on Mars sensed by the spectroscopic slit. Furthermore, the contributions made to the total shift by the Young effect were evaluated and deemed negligible under the specific geometry of our observations.
The scope of this work is to study the dynamical behaviour of Mars’ middle atmosphere during a global dust storm using ground-based observations made with the high-resolution spectrograph UVES at ESO’s Very Large Telescope and Doppler velocimetry methods, for the first time, to complement observations of orbiter instruments.
The success and validation of the application of this method to the atmosphere of Mars may provide a new tool to investigate the Martian atmosphere during dust storms. We intent is to contribute for a better understanding of the atmosphere's dynamics during planet encircling dust events. We measured the wind velocity and its spatial variability, through high resolution spectroscopy and Doppler velocimetry.
The main goal of this research line is therefore, to provide wind measurements using visible Fraunhofer lines scattered at Mars’ dust hazes, which allows spatial wind variability studies and will make possible to obtain a latitudinal profile of the wind along the cited global dust storm and a wind map of the dust storm as a function of the latitude and local time over the planet as seen from Earth.
Acknowledgements: We acknowledge support from the Portuguese Fundação Para a Ciência e a Tecnologia ref. PTDC/FIS-AST/29942/2017
References: [1] Vandaele, et al., Nature, 568, 2019. [2] Stone, S., et al. Science, Vol. 370, 2020. [3] Zurek, R., and Martin, L., JGR, 98, 1993. [4] Haberle, R.M., Science, 234, 1986. [5] Leovy, C. Journal of Atmospheric Sciences, 30, 1973. [6] Kahre, M., et al., Cambridge University Press, 2017. [7] Pollack, J., JGR, 1979. [8] Machado, P., et al., Icarus, 2012. [9] Machado, et al. Icarus, 285, 2014. [10] Machado, et al. Icarus, 2017. [11] Machado P., et al., Atmosphere, 2021. [12] Gonçalves R., et al., Icarus, vol 335, 2020.
How to cite: Machado, P., Valido, H., Cardesin-Moinelo, A., Gilli, G., Brasil, F., and Silva, J. E.: Final Results of Doppler Velocimetry Winds on Mars' Atmosphere, Europlanet Science Congress 2021, online, 13–24 Sep 2021, EPSC2021-295, https://doi.org/10.5194/epsc2021-295, 2021.
We report preliminary result of the systematic detection and characterisation of atmospheric gravity waves on Mars' atmosphere, using observations carried out by the OMEGA (Observatoire pour la Minéralogie, l'Eau, les Glaces et l'Activité) [1] imaging spectrometer on board of the Mars Express (MEx) [2].
Gravity waves are mesoscale atmospheric oscillations in which buoyance acts as the restoring force [3]. The presence of gravity waves is observed in many of the Solar System planets atmospheres, from Venus [4], Earth [5], Jupiter [6], and being a crucial factor in the circulation of planetary atmospheres since they transport momentum and energy, which can dissipate at different altitudes and force the dynamics of several layers of the atmosphere.
The source of these waves can be associated with the topographic features (orographic gravity waves) of surface, or with jet streams and atmospheric convections (non-orographic gravity waves). Recent modelling studies showed the strong role of gravity waves on diurnal tides on Mars atmosphere [7], however their characteristic are still not well constrained by observations.
This work aims to go through the complete OMEGA data set to fully detect and characterise gravity waves observed during the Mars Express space probe. Every image was navigated and processed in order to optimise the detection of the wave packets and accurate characterisation of the wave properties such as the horizontal wavelength, packet width, packet length and orientation.
Due to the longevity of the MEx space mission, acquiring over more than 17 years of observations of the surface and atmosphere of Mars in nadir and limb modes, the OMEGA instrument offers an opportunity to explore the atmosphere dynamics over the years, especially the evolution of gravity waves along the time, due to the time sampling and global coverage of MEx.
The OMEGA images are composed of a hyperspectral cube with a spectral range of 0.38 to 5.1 m, taken with the visible and near-infrared (VNIR) and infrared (SWIR) spectrometers. We retrieved the OMEGA data and its IDL routines through the PSA archive from ESA, to produce OMEGA images which were later navigated and processed individually using ENVI software for optimal detection of wave features and accurate characterisation of wave properties, such as the horizontal wavelengths, packet width, packet length, location and orientation. Since the orbit has a certain resonance with respect to the Martian surface rotation (variable duration along the mission), there will be an overlapping of images taken, allowing the study of the evolution of gravity waves along a period of time and also the study of their activity during dust storms [8].
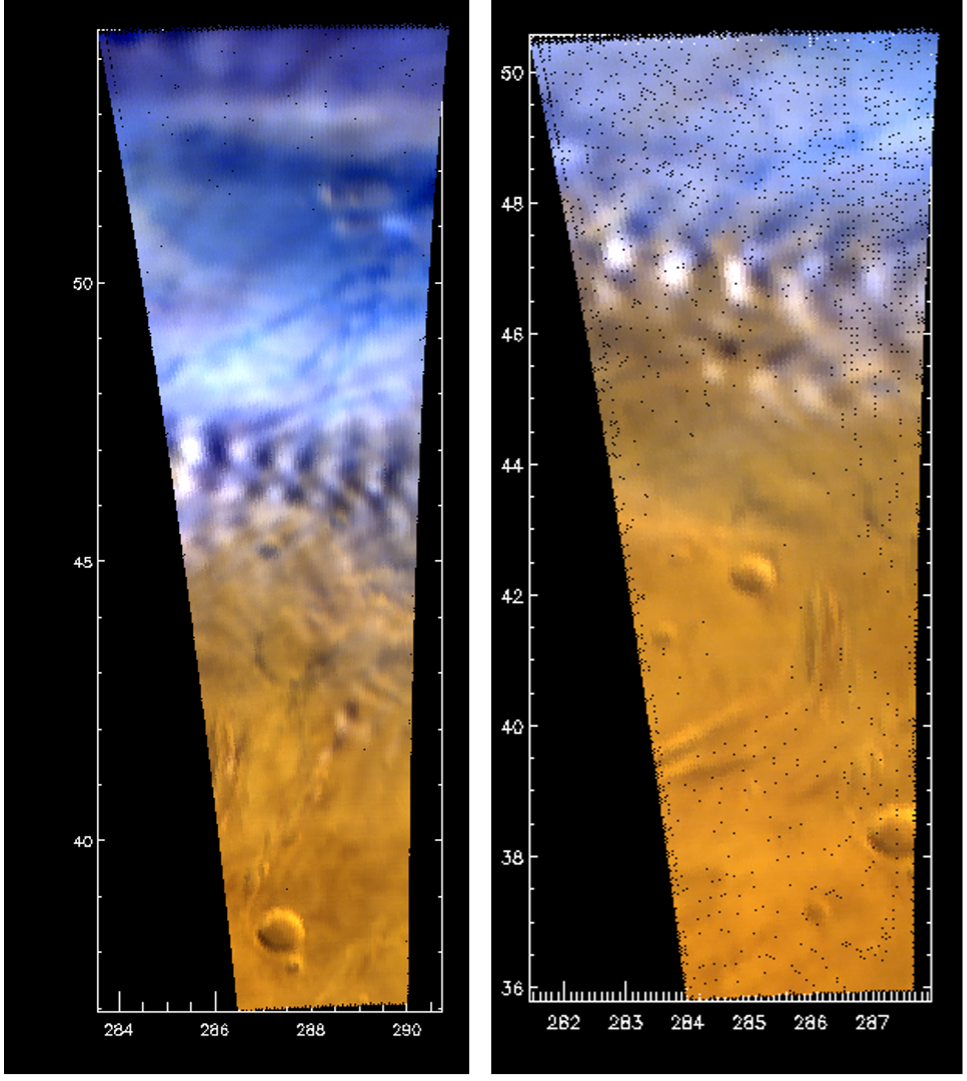
Figure 1 – Evolution of an atmospheric gravity wave packet detected in orbit 43 on Mars atmosphere using the OMEGA instrument on board Mars Express.
Acknowledgments: We acknowledge support from the Portuguese Fundação Para a Ciência e a Tecnologia (ref. PTDC/FIS-AST/29942/2017) through national funds and by FEDER through COMPETE 2020 (ref. POCI-01-0145 FEDER-007672).
References
[1] Bibring, J. P., et al. OMEGA: Observatoire pour la Minéralogie, l'Eau, les Glaces et l'Activité. In: Mars Express: the scientific payload. 2004. p. 37-49.
[2] Chicarro, A.; Martin, P.; Trautner, R. The Mars Express mission: an overview. In: Mars Express: The Scientific Payload. 2004. p. 3-13.
[3] Fritts, D. C.; Alexander, M. J. Gravity wave dynamics and effects in the middle atmosphere. Reviews of geophysics, 2003, 41.1.
[4] Silva, J. E., et al. Characterising atmospheric gravity waves on the nightside lower clouds of Venus: a systematic analysis. Astronomy & Astrophysics, 2021, Volume 649.
[5] Hines, C. O. Gravity waves in the atmosphere. Nature, 1972, 239.5367: 73-78.
[6] Young, A. et al. Gravity waves in Jupiter's stratosphere, as measured by the Galileo ASI experiment, Icarus, 2005, Vol 173, p. 185-199.
[7] GILLI, G., et al. Impact of gravity waves on the middle atmosphere of Mars: A non‐orographic gravity wave parameterization based on global climate modeling and MCS observations. Journal of Geophysical Research: Planets, 2020, 125.3: e2018JE005873.
[8] Gondet, B.; Bibring, J. P. Mars observations by OMEGA/Mex during the dust events from 2004 to 2019. In: EPSC-DPS Joint Meeting 2019. 2019. p. EPSC-DPS2019-94.
How to cite: Brasil, F., Machado, P., Gilli, G., Cardesín-Moinelo, A., E. Silva, J., Espadinha, D., and Gondet, B.: Characterising Atmospheric Gravity Waves on Mars using Mars Express OMEGA images – a preliminary study, Europlanet Science Congress 2021, online, 13–24 Sep 2021, EPSC2021-188, https://doi.org/10.5194/epsc2021-188, 2021.
The wealth of observations now available from multiple spacecraft in orbit around Mars and rovers/landers on the surface provides information on several aspects of the atmosphere, although they are restricted in space and time. Most of the observational datasets are largely complementary, so an efficient method to combine them in a physically consistent way will lead to more constrained studies of the evolution of the global martian atmosphere. Data assimilation is one such method, combining multiple retrievals with a Mars Global Circulation Model (GCM) while accounting for errors in both sources of information and producing an optimal representation of the evolving martian surface and atmosphere. Data assimilation is a powerful tool in that multiple parameters each observed independently by different instruments (e.g. water vapour, ozone, carbon monoxide, dust opacity, temperature) are all realistically constrained and physically consistent at the same time, and unobserved parameters can also be influenced by assimilated data (e.g. water vapour assimilation will impact on the water ice distribution). It also allows for study of atmospheric features that change significantly between observations and identifying processes that lead to the observed changes.
Data assimilation studies are prevalent on Earth and are becoming more mainstream for Mars, with several different Mars GCMs now capable of assimilating retrievals using different assimilation schemes. The Open University (OU) ExoMars modelling group Mars GCM has been combined with several retrieval datasets via data assimilation to study features of the ozone, carbon monoxide, water and dust cycles alongside dynamical features such as the polar vortices, surface warming during a global dust storm and planetary waves. OpenMARS (Open access to Mars Assimilated Remote Soundings), a publicly available global reanalysis dataset from 1999-2015, was also created using the OU assimilation system.
This talk will give a brief overview of the benefits and limitations of data assimilation for Mars, and will demonstrate how combining retrievals of different atmospheric parameters with a Mars GCM via data assimilation leads to a better constrained analysis of the martian atmosphere than is possible with retrievals or GCMs alone.
How to cite: Holmes, J., Lewis, S., Patel, M., Streeter, P., and Rajendran, K.: Synergistic studies enhanced through data assimilation: combining multiple retrievals with a Mars Global Circulation Model, Europlanet Science Congress 2021, online, 13–24 Sep 2021, EPSC2021-375, https://doi.org/10.5194/epsc2021-375, 2021.
Plain language summary
The Modelling of the Martian climate has drastically improved over the last two decades. There are currently several highly sophisticated Mars models being used for research, these have already greatly improved our understanding of Mars’ climate. Here I detail the adaptation of the Met Office Unified Model (UM) to the study of the Martian climate and present the first results. The UM has been adapted to model a wide range of planets, from hot gas giant exoplanets to the Archean Earth, and includes sophisticated treatments of the key physical processes such as dynamics, radiative transfer and dust transport.
Abstract
Mars atmospheric modelling has come far in the past two decades, with increased missions expanding our observational capabilities drastically. These observations are allowing us to develop increasingly accurate Martian Global Climate Models (hereafter; GCMs) (Forget et al., 1999; Read, Lewis and Mulholland, 2015; Martínez et al., 2017). There are currently several well-established GCMs that already model Mars’ atmosphere, including (but not limited to) the LMDs Mars GCM, NASAs AMES Mars model and OpenMARS.
Here we describe the usage and first climate results from our adaptation of the Met Offices Unified Model (hereafter; UM), one of the most sophisticated Earth GCMs already used for modelling exoplanets, for a Martian climate. By adapting established climate schemes used for the study of Earth within the GCM (e.g. atmospheric dust, wind, atmospheric composition, etc.) to Mars’ characteristics, we can create a highly sophisticated Mars model (e.g. high spatial resolution, dynamic dust scheme). Our simulations will be verified by comparison with existing Mars GCMs. The key parameters incorporated into our GCM will include:
- A dynamic dust scheme which includes saltation
- A relevant surface roughness, derived from (Hébrard et al., 2012)
- Martian Orography smoothed extremes (max/min height of 8.2/-8.2km)
- Martian average surface pressure (610 Pa)
- Martian atmospheric composition (simplified to 95% CO2 and 5% N2, omitting Ar)
- An idealised CO2 ice scheme with dynamic pressure shifts caused by freezing/sublimation
- Martian moisture quantities
In this presentation I will detail the different schemes incorporated into the UM key to simulating a Mars climate, then describe the processes used to implement them into the UM. We will then showcase the different scenarios of Mars’ climate we have introduced and their subsequent effects on other climate parameters (e.g. increased pressure and how it changes temperature). I will finish by showing the verification process we used and comparisons to other existing models.
Future of the project:
A verified Mars-UM will then be used to investigate the relationship that key climate variables have to each other. By forcing exaggerated changes in targeted key parameters (e.g. doubling average surface pressure or increasing atmospheric moisture content), we can then investigate the secondary effects these changes have on other parameters in the Martian climate (e.g. change in temperature or dust mixing ratios). This study will help discern the importance and relative influence of Mars’ key parameters, this will in-turn provide insight for future areas of research and development.
This study is part of a Masters-by-research project.
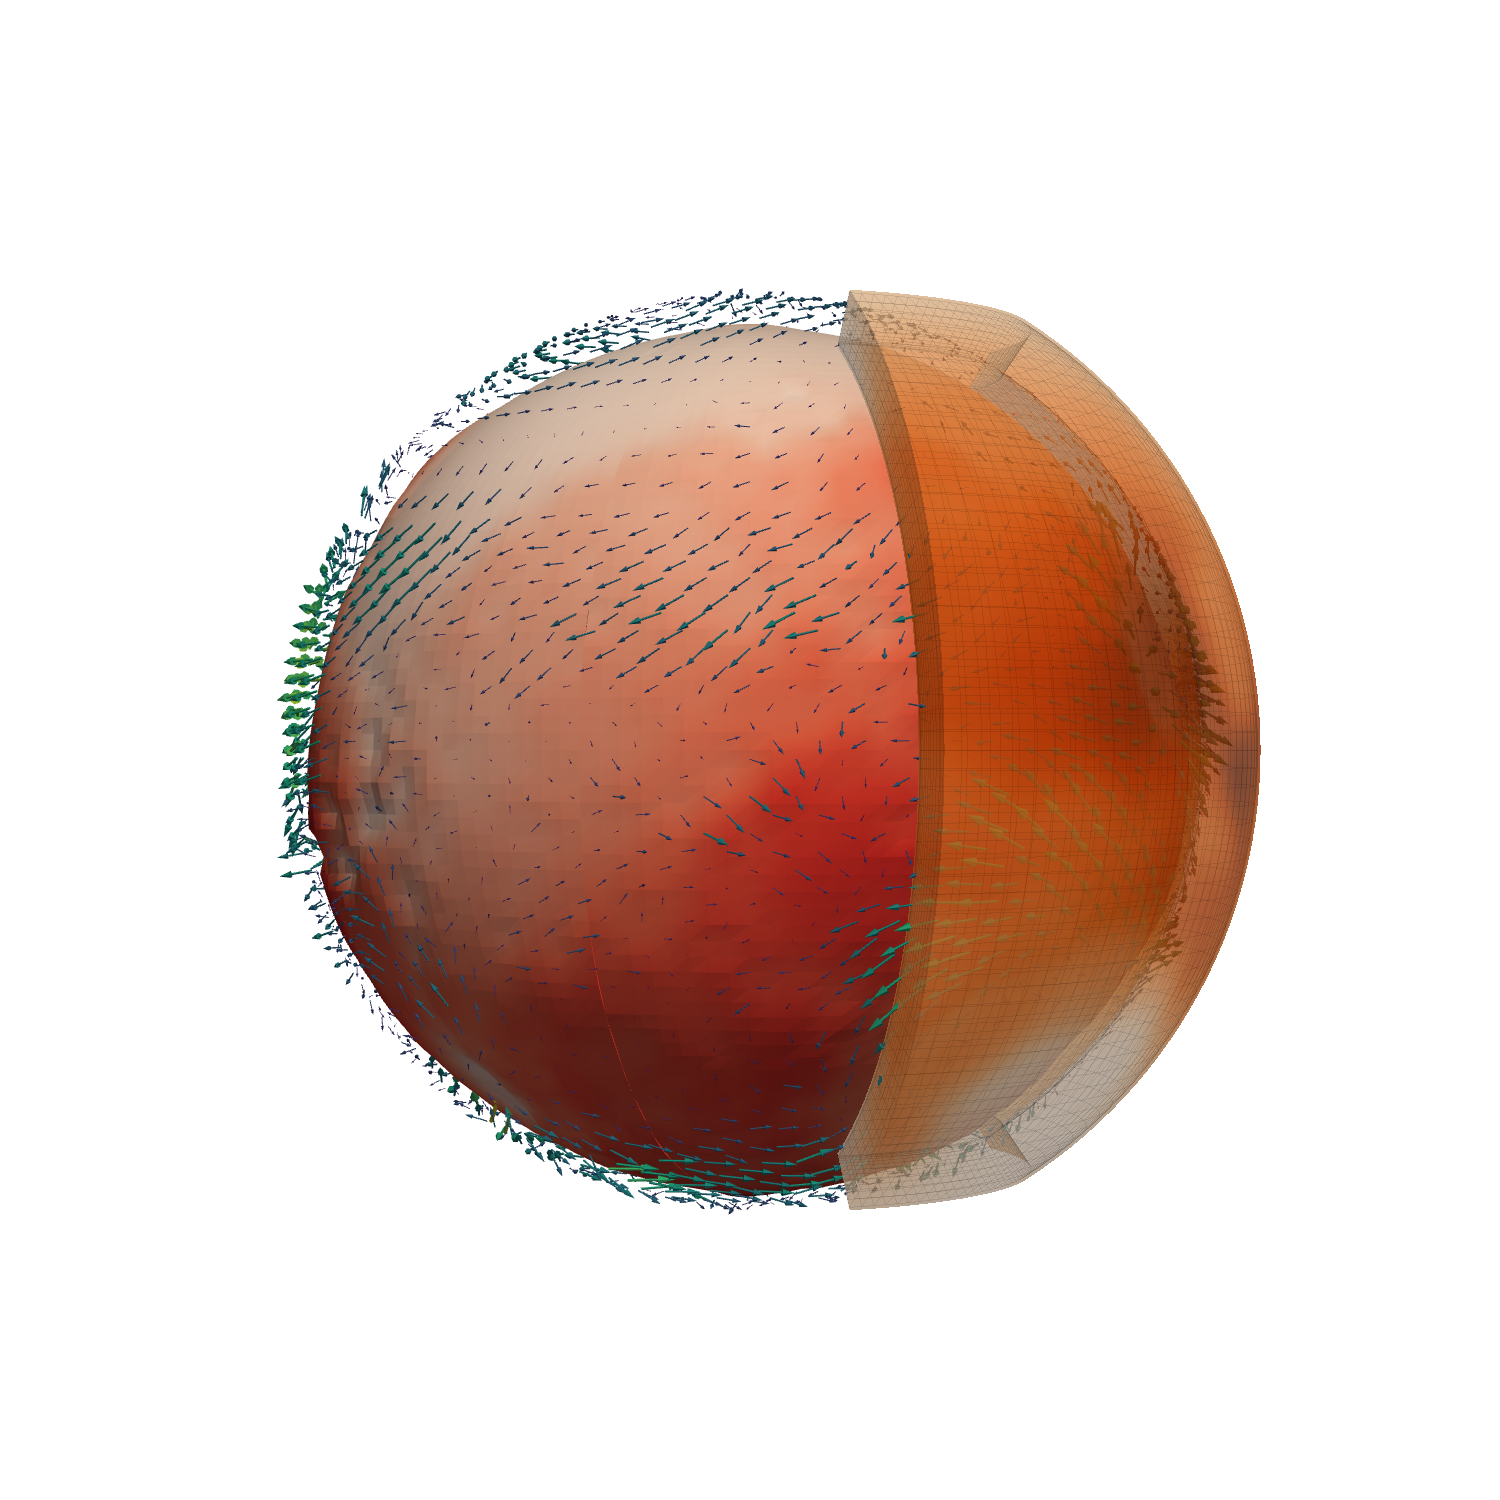
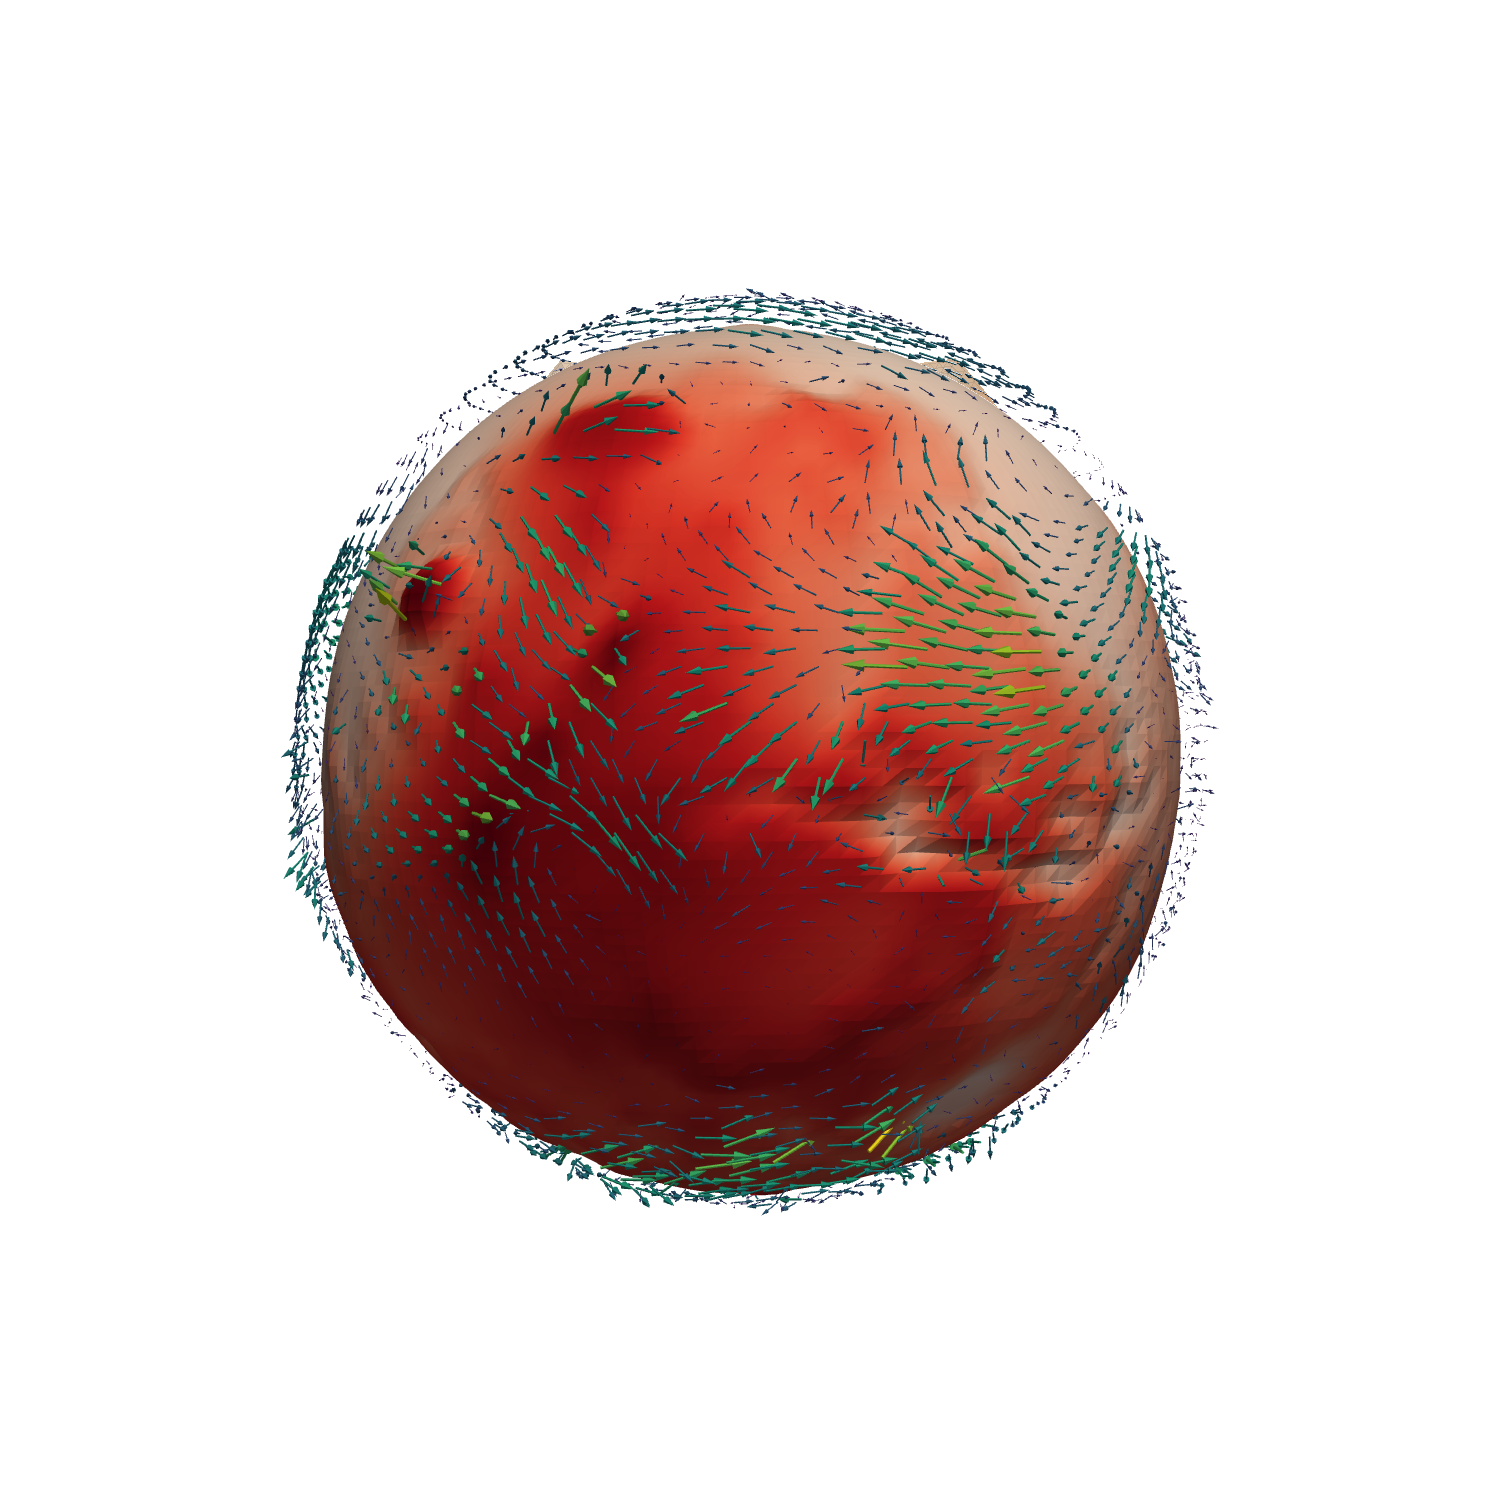
Figure 1: Schematic demonstration of model output (orography is denoted in red, arrows indicate wind direction and speed at 1000m above the relative surface height, dust slab shows rough dust approximations for an extracted segment). Image made using Python, Pyvista and Matplotlib.
Acknowledgements:
This study has required a variety of skillsets due to the many schemes involved, to this the authors would like to thank James Manners and the Met Office team for their assistance. We would also like to thank Ehouarn Millour from the LMD for the assistance with providing technical assistance when using their Mars climate Database. Lastly, we would like to thank the Exeter Exoplanet Theory Group (EETG, exoclimatology.com) & Patrick McGuire (University of Reading) for their technical assistance, acting as a springboard for ideas and for their input and encouragement throughout the project.
References:
Forget, F. et al. (1999) ‘Improved general circulation models of the Martian atmosphere from the surface to above 80 km’, Journal of Geophysical Research E: Planets, 104(E10), pp. 24155–24175. doi: 10.1029/1999JE001025.
Hébrard, E. et al. (2012) ‘An aerodynamic roughness length map derived from extended Martian rock abundance data’, Journal of Geophysical Research E: Planets, 117(4), p. 4008. doi: 10.1029/2011JE003942.
Martínez, G. M. et al. (2017) ‘The Modern Near-Surface Martian Climate: A Review of In-situ Meteorological Data from Viking to Curiosity’, Space Science Reviews, 212(1–2), pp. 295–338. doi: 10.1007/s11214-017-0360-x.
Read, P. L., Lewis, S. R. and Mulholland, D. P. (2015) ‘The physics of Martian weather and climate: A review’, Reports on Progress in Physics, 78(12). doi: 10.1088/0034-4885/78/12/125901.
How to cite: McCulloch, D., Mayne, N., Bate, M., and Sergeev, D.: Modelling an idealised Martian climate with the Unified Model: The next “giant leap” for Mars GCMs., Europlanet Science Congress 2021, online, 13–24 Sep 2021, EPSC2021-232, https://doi.org/10.5194/epsc2021-232, 2021.
Introduction
The possibility of a Martian ocean is a topic of debate with strong implications on the habitability of the Red Planet [1]. Geomorphological arguments in favor and against an ocean have been recently reviewed [2]. There is evidence of Martian paleo-shorelines [3] in Deuteronilus (sometimes noted contact No 2) in a geometry close to the current equipotential height [4]. Deuteronilus shoreline seems to be the latest in the last stage of Tharsis induced true polar wander [5].
Recent interpretation of tsunami deposits near the shorelines [6,7] has provided new clues on the debate. In addition, the potential impact crater, at the origin of the tsunami wave has been possibly identified [8]. These new investigations suggest a long-term stable water body 3 Gy ago in the Northern lowland of Mars.
Various scenarios have been investigated to maintain an ocean [1]. If the climate is cold, the ocean should have been entirely frozen shortly after its formation. If warm, the ice-free ocean should have produced intense fluvial erosion of Hesperian terrains. But there is a lack of observation of such extensive valley networks [1]. A cold and wet Mars scenario has been theoretically proposed [9] but the long term stability of an ocean in such a scenario has seldom been explored in 3D-GCMs
Model
We present a fully coupled ocean/atmosphere 3-D General Circulation Model simulations based on ROCKE-3D [10], which is based upon a parent Earth Climate Model known as ModelE2 [11]. This model allows us to estimate the interaction between atmosphere/ocean circulation but also encompasses a surface hydrological scheme.
We assume the solar luminosity to be ∼79% of its current value [12], hence at 3 Gy, the flux at Mars would be 452.8 W.m−2. The ocean shoreline is set to –3900 meters in all runs. This gives an ocean surface fraction of ∼16% which is small in comparison to Earth at ∼71%. The ocean is also shallower than the mean depth for Earth. For this reason the time to bring our ancient Mars model ocean and atmosphere into equilibrium is much shorter (∼100s of years) than would be the case for an Earth like ocean (∼1000s of years). We assume this equilibrium has been reached when the net radiative balance (the difference between incoming and outgoing fluxes) is less than 0.2 W.m−2.
H2 provides a powerful greenhouse component in combination with CO2 as a background gas, but other gas combinations involving CH4 or H2S may have an equivalent radiative effect even if the motivation for their use is lacking. We run simulations with 10% and 20% H2 in a CO2 dominated atmosphere with 0°, 20°, 40°, 60° obliquity, since obliquity can have large excursions from the mean value in the past [13, 14].
Results
Figures 1, 2, 3 show the simulated fields averaged over 10 Martian years for H2=10% and total pressure of 1 bar. Despite an average temperature below 0°C, the ocean is stable due to its low altitude, low albedo and circulation. On land, there is a clear boundary at an altitude of -2000 meters which corresponds to the dichotomy boundary. In the high altitude domain, the surface is mostly frozen and snow precipitation is observed. The extensive accumulation of snow in the highlands can lead to the formation of significant ice sheets that may flow down to the ocean. In the lowest altitude domain, liquid water rain is observed and surface runoff is possible. The rain mainly occurs over the ocean, meaning that annually ocean evaporation is almost fully compensated by rain.
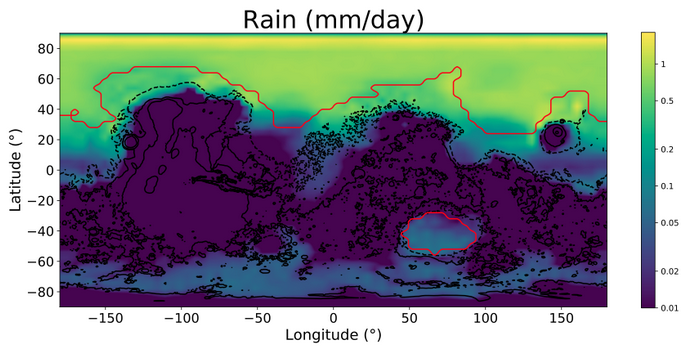
Figure 1: 3D GCM output at 40° obliquity for the rain precipitation. Black contour lines represent altitude level and the red contour line is the paleo-shoreline
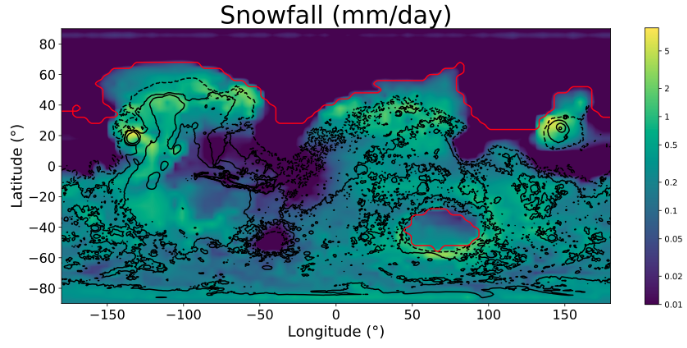
Figure 2: same as Fig. 1 for snowfall
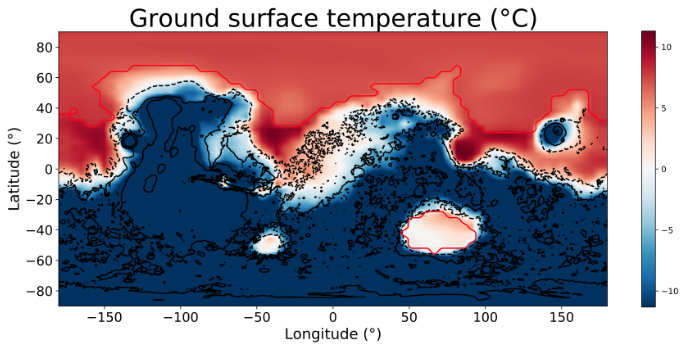
Figure 3: same as Fig. 1 for sea/ground surface temperature
Discussion and conclusion
We propose here a fully coupled ocean/atmosphere to investigate the Martian climate 3 Gy ago. It seems that this coupling significantly increases the stability of the ocean due to its circulation [15]. Comparison with observed geological features of the same epoch shall be done in order to validate or invalidate this scenario.
References
[1] Martin Turbet and François Forget, Scientific Reports, 9(1), apr 2019. [2] Zachary I Dickeson and Joel, Astronomy & Geophysics, 61(3):311–317, jun 2020. [3] Timothy J. Parker, et al., Journal of Geophysical Research, 98(E6):11061, 1993. [4] James W. Head et al., Science, 286 (5447):2134–2137, 1999.[5] Robert I. Citron, et al,, Nature, mar 2018. [6] Alexis P. Rodriguez, et al., Scientific Reports, 6:25106–, May2016. [7] Francois Costard, et al., Journal of Geophysical Research: Planets, 122(3):633–649, mar2017. [8] F. Costard, et al., Journal of Geophysical Research:Planets, jul 2019. [9] Alberto G. Fairen, Icarus, 208(1):165–175, July 2010 [10] Michael. Way et al., Astrophysical Journal Supplement Series, 231:12, July 2017 [11] Gavin A. Schmidt et al., Journal of Advances in Modeling Earth Systems, 6(1):141–184, 2014 [12] D. O. Gough et al., SolarPhysics, 74(1):21–34, November 1981, [13] J. Laskar, et al., .Icarus, 170:343–364, August 2004. [14] John C. Armstrong, et al., Icarus, 171(2):255–271, October 2004. [15] Schmidt et al., Nature Geoscience, under review
How to cite: Schmidt, F., Way, M., Costard, F., Bouley, S., Sejourné, A., and Aleinov, I.: Cold late Hesperian Climate, Europlanet Science Congress 2021, online, 13–24 Sep 2021, EPSC2021-717, https://doi.org/10.5194/epsc2021-717, 2021.
The climate of Mars during its first billion years is one of the most intriguing question in our understanding of the Solar System. The planet was host of a large amount of liquid water flowing on the surface throughout the Noachian era, approximatively 4Gya. Geomorphological observations is the main evidence for liquid water since valley networks and lakes are still visible on the surface, although dry nowadays.
Different studies have tried to reproduce the conditions that may have occured on the planet, trying to find an atmospheric process or composition that could solve the Faint Young Sun Paradox. Theses modeling studies, through the use of 3-dimensional Global Climate Models struggled to warm sufficiently the past climate of Mars, even considering different greenhouse gases, the role of clouds, meteoritic impact or even volcanism (XXX). However, the presence of H2 could be an interesting solution for a sustainable warming as some recent studies suggest (Turbet and Forget, 2021). Another recent study (Ito et al. 2020) suggested that H2O2 might be a convincing candidate but has to be in high supersaturation ratio in the atmosphere, even though it only used a simplified 1D model and relatively high supersaturation levels.
We try here to explore more in detail the scenario of supersaturated H2O2 and H2O, that also might be a specy able to provide a sufficient global warming under supersaturated conditions or through the formation of high altitude clouds. Since H2O is the major source of H2O2 in the atmosphere, it is important to assess whether the H2O content in the atmosphere is enough to provide high quantities of H2O2. We also try to constrain the theoritical supersaturation level of H2O/H2O2 that will allow the warming of the climate above 273K, but with a detailled 3D GCM simulation. Even if we do not tackle the question whether the supersaturation hypothesis is realistic or not, these results give a better understanding of what would be Early Mars' climate under such conditions.
How to cite: Delavois, A., Forget, F., Turbet, M., and Millour, E.: 3D Modeling of Supersaturated H2O/H2O2 on Early Mars Climate during the Noachia, Europlanet Science Congress 2021, online, 13–24 Sep 2021, EPSC2021-302, https://doi.org/10.5194/epsc2021-302, 2021.
The recent discovery of HCl on Mars (Korablev et al. 2021, Olsen et al. 2021) indicates its strong seasonal variations and correlation with dust. To study this idea, we develop photochemical models for summer midlatitudes at aphelion and perihelion. We assume that HCl is formed in heterogeneous reactions of FeCl3 and/or NaCl in the dust with H, and the reaction probability is γ≈0.03 expected for FeCl3. NaCl is more abundant than FeCl3, while the energy yield is 2.01 eV for FeCl3 and 0.18 eV for NaCl, so that the reaction probability may be much greater for FeCl3. HCl is lost from the atmosphere in our model in a reaction with ice, and γ=3×10⁻⁵. Temperature profiles, column H2O and dust are based on the MGS/TES observations and our calculations (Smith 2004, Fig. 1, 2).
Fig. 1. Temperature profiles using the TES nadir(red) and limb (blue) observations
Fig. 2. Density, H2O, dust and H2O ice profiles in aphelion (blue) and perihelion (red)
Our models involve 35 reactions of the standard CO2-H2O-NO chemistry, 38 reactions for 9 chlorine gases, heterogeneous loss of OH, HO2, and H2O2 on ice, and five heterogeneous reactions of chlorine species. Calculated chemical compositions at aphelion and perihelion are shown in Figures 3 and 4. The calculated abundances of ozone, peroxide, and the O2 dayglow at 1.27 μm agree with observations and other models.
Fig. 3. Chemical composition of mars' atmosphere near aphelion
Fig. 4. Chemical composition of Mars' atmosphere near perihelion
The probabilities of the two major processes of formation and removal of the gaseous chlorine species are chosen to fit the observed HCl mixing ratio of 0.5-5 ppb at 5-35 km in perihelion (Figure 5). The predicted increase in HCl to ≈10 ppb above 55 km in perihelion can be reduced and eliminated, if the dust is significantly reduced above 40 km. However, the model cannot simulate the observed cutoff in HCl above 40 km.
Fig. 5. Vertical profiles of HCl in aphelion and perihelion on Mars in our models and the ACS observations in perihelion. The dashed plot is for no dust above 40 km.
Lifetime of HCl is 70 days in our model for perihelion and explains the lag between the onset of the dust storm at LS = 190º and the first HCl detections at LS = 230º. (This interval is 75 days.) The annual cycle of gaseous chlorine can be approximated by its production at LS =200 to 300º with a mean abundance of 2 ppb and loss beyond this period with the calculated lifetime. Then the expected abundance at aphelion is 0.06 ppb, in accord with the upper limit of 0.1-0.2 ppb, but greater than ≈1.5 ppt calculated at the equilibrium (Figure 5). Our model at two seasons is not aimed to reproduce the complicated dynamics in the HCl observations, including two HCl detections at LS ≈ 110º. Number densities of the major chlorine species near perihelion and at equilibrium in aphelion are shown in Figure 6. HCl dominates among those.
Fig. 6. Chlorine species on Mars in perihelion (solid lines) and at equilibrium in aphelion (dashed lines)
Chlorine species participate in photochemical cycles that stimulate production of O2 and net reactions of CO with O and O2. However, their column rates even at perihelion are smaller than those of the odd hydrogen cycles by four orders of magnitude. Therefore we conclude that the chlorine chemistry on Mars does not significantly affect abundances of the major photochemical products.
References
Korablev, O.I., et al., 2021. Transient HCl in the atmosphere of Mars. Sci. Adv. 7, eabe4386.
Olsen, K.S., et al., 2021. Seasonal reappearance of HCl in the atmosphere of Mars during the Mars year 35 dusty season. Astron. Astrophys. 647, A161.
Smith, M.D., 2004. Interannual variability in TES atmospheric observations of Mars during 1999-2003. Icarus 167, 148-165.
How to cite: Krasnopolsky, V.: Photochemistry of HCl in the Martian atmosphere, Europlanet Science Congress 2021, online, 13–24 Sep 2021, EPSC2021-56, https://doi.org/10.5194/epsc2021-56, 2021.
Introduction
The D/H ratio observed in a planetary atmosphere is a proxy for the ratio of the current water reservoir over the initial water reservoir of the planet. The current D/H ratio measured in the Martian atmosphere is at least five that of the Vienna Standard Mean Ocean Water (SMOW) (Owen et al. 1988, Encrenaz et al. 2018, Krasnopolsky 2015, Villanueva et al. 2015). This high value of the martian D/H ratio, derived from the HDO/H2O abundance ratio, is a precious indicator of the large escape of water from the martian atmosphere over time. Apart from the mass difference between both isotopes, the differential escape of H and D comes from the preferential photolysis of H2O over HDO (Cheng et al. 1999) and the Vapor Pressure Isotope Effect (VPIE) that produces an isotopic fractionation at condensation (Krasnopolsky, 2000, Bertaux et al. 2001, Fouchet et al. 2000).
Modelling the HDO cycle
Rossi et al. 2021 have implemented the HDO cycle, adapted from Montmessin et al. 2005, within the current version of the LMD Martian GCM (Forget et al. 1999). The fractionation effect caused by the condensation is taken into account with the calculation of a fractionation factor depending on the temperature, according to the empirical formulation of Lamb et al. 2017. In Rossi et al. (2021)’s study, clouds are produced and evolve according to simplified physics consisting in turning water vapour into ice if any supersaturation of water. In the study presented here, the HDO cycle is upgraded to the last version of the water cycle of the model, including the activation of the radiative effect of clouds and their microphysics (referring to the parametrization of the different processes of formation of the clouds, as nucleation of the ice particles on dust particles, water ice growth, dust scavenging and supersaturation), implemented in the model by Navarro et al. 2014. The calculation of the fractionation has also been improved by implementing the effect of kinetics impacting the condensation process. Indeed, the slower diffusion of the heavier HDO molecule in comparison to that of H2O reduces condensation flux, and an expression has been established by Jouzel and Merlivat 1984 to include this effect in the overall fractionation of water isotopologues during condensation into ice.
Results and perspectives
Our results, on the basis of these recent improvements, will be presented at the conference. Reinforcement of the Hadley circulation by the radiative effect of clouds which is now taken into account, as well as the role of nuclei played by dust in the cloud formation, do affect the transport of HDO and its vertical distribution, which directly impacts the HDO/H2O ratio in the low-to-mid atmosphere (see Figure 1). Kinetics of condensation reduces the fractionation effect whenever saturation occurs and increases with supersaturation, which means mainly at the poles (see Figure 2). Further aspects of this upgraded modelling of the HDO cycle and its sensitivity to different parameters will be explored and presented at the conference. The comparison of the model results with observations from TGO/ACS are presented by Loïc Rossi in session TP16.
For now, the here-presented simulations extend to an altitude of around 120 km, and do not include the parametrizations of the thermosphere (Angelats i Coll et al. 2005, Gonzalez-Galindo et al. 2009), the photochemistry (Lefèvre et al. 2004, 2008) and the escape (Chaufray et al. 2015a), which have been recently extended to deuterated species. The ultimate goal of this work is the development of a complete representation of the deuterium cycle, from its source as HDO in the lower atmosphere, to its photodissociation and escape from the upper atmosphere.
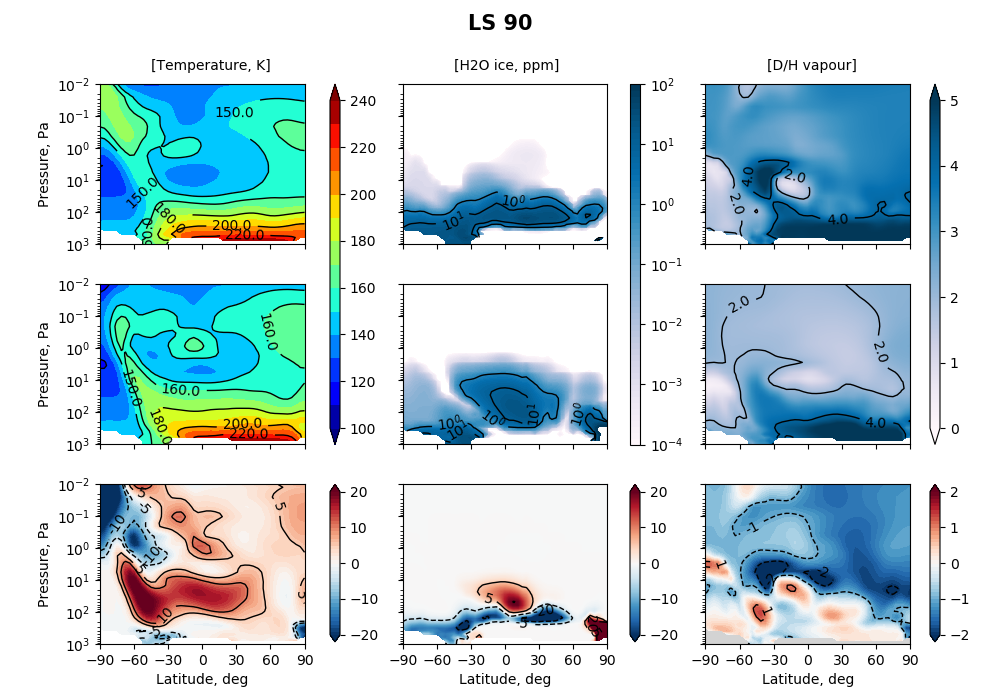
Figure 1: Meteorological variables as output of the model zonally averaged at LT=14:00 around Ls=90°. (Up) Results for the GCM simulation run with the simple physics of clouds (1). (Middle) Results for the GCM simulation run with the microphysics and the radiative effect of clouds (2). (Down) Difference between the two simulations (2) - (1). (Left) Temperature (K). (Middle) H2O ice mixing ratio (ppm). (Right) D/H ratio of the vapour phase.
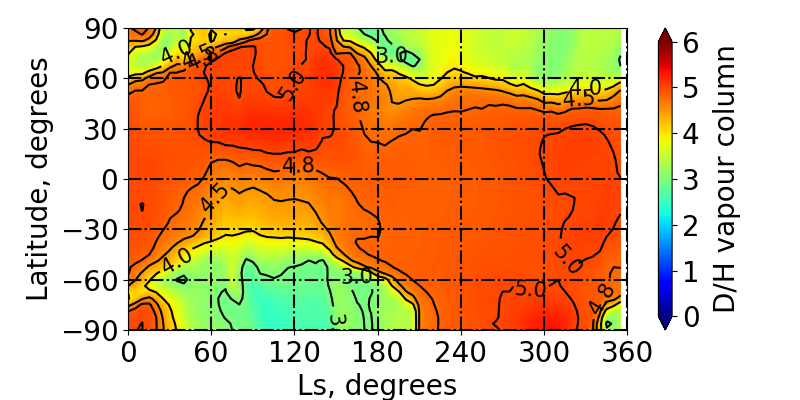
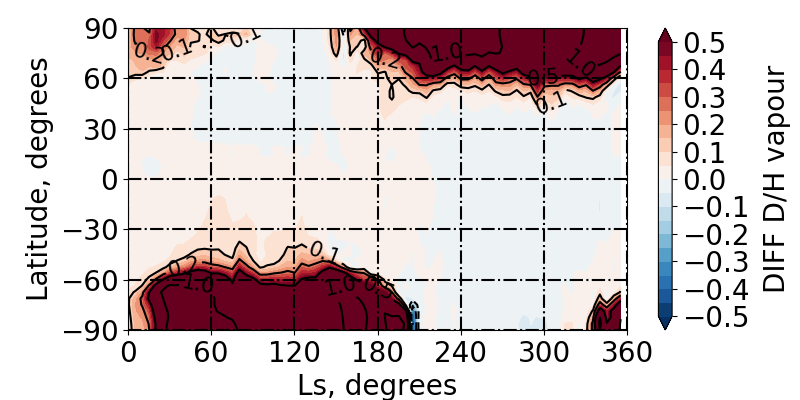
Figure 2: (Left) Zonal average of the integrated column of the D/H ratio of the vapour phase for a GCM simulation run with microphysics and radiative effect of clouds, and taking into account the effect of kinetics in the fractionation process. (Right) Difference between simulation with and without taking into account the effect of kinetics.
Acknowledgements
ExoMars is the space mission of ESA and Roscosmos. The ACS experiment is led by IKI Space Research Institute in Moscow. The project acknowledges funding by Roscosmos and CNES. Science operations of ACS are funded by Roscosmos and ESA. Science support in IKI is funded by Federal agency of science organizations (FANO). M.V. acknowledges support from the DIM ACAV labelled by the Ile-de-France region in support for the research (Domaine d’Intérêt Majeur, Astrophysique et Conditions d’Apparition de la Vie)".
How to cite: Vals, M., Rossi, L., Montmessin, F., Forget, F., Millour, E., Gonzalez-Galindo, F., Lefèvre, F., and Chaufray, J.-Y.: Modelling the HDO cycle of the Martian atmosphere with the LMD Global Climate Model, Europlanet Science Congress 2021, online, 13–24 Sep 2021, EPSC2021-296, https://doi.org/10.5194/epsc2021-296, 2021.
Here we report a global model of meteoric metals including Mg, Fe and Na in the Laboratoire de Météorologie Dynamique (LMD) Mars global circulation model (termed as LMD-Mars-Metals), following on similar work as we have done for the Earth’s atmosphere. The model has been developed by combining three components: the state-of-the-art LMD-Mars model covering the whole atmosphere from the surface to the upper thermosphere (up to ~ 2 x10⁻⁸ Pa or 240 km), a description of the neutral and ion-molecule chemistry of Mg, Fe and Na in the Martian atmosphere (where the high CO2 abundance produces a rather different chemistry from the terrestrial atmosphere), and a treatment of injection of the metals into the atmosphere as a result of the ablation of cosmic dust particles. The LMD-Mars model contains a detailed treatment of atmospheric physics, dynamics and chemistry from the lower atmosphere to the ionosphere. The model also includes molecular diffusion and considers the chemistry of the C, O, H and N families and major photochemical ion species in the upper atmosphere, as well as improved treatments of the day-to-day variability of the UV solar flux and 15 mm CO2 cooling under non-local thermodynamic equilibrium conditions. So far, we have incorporated the chemistries of Mg, Fe and Na into LMD-Mars because these metals have different chemistries which control the characteristic features of their ionized and neutral layers in the Martian atmosphere. The Mg chemistry has 4 neutral and 6 ionized Mg-containing species, connected by 25 neutral and ion-molecule reactions. The corresponding Fe chemistry has 39 reactions with 14 Fe-containing species. Na chemistry has 7 neutral and only 2 ionized Na-containing species, with 32 reactions. The injection rate of these metals as a function of height is pre-calculated from the Leeds Chemical Ablation Model (CABMOD) combined with an astronomical model which predicts the dust from Jupiter Family and Long Period comets, as well as the asteroid belt, in the inner solar system. The LMD-Mars-Metals model has been run for several full Martian years under different surface dust scenarios to investigate the impact of high atmospheric dust loadings on the modelled metal layers. The model has been evaluated against Mg+ observations from IUVS (Imaging UV Spectrometer) and NGIMS (Neutral Gas Ion Mass Spectrometer) instruments on NASA’s Mars Atmosphere and Volatile Evolution Mission (MAVEN) spacecraft. We have also carried out other sensitivity experiments with different seasonality/altitude/latitudinal varying of Meteoric Input Function (MIF) of these metals in the model. These sensitivity results will be discussed.
How to cite: Feng, W., Plane, J., González-Galindo, F., Marsh, D., Welch, A., Carrillo-Sánchez, J. D., Janches, D., Chaufray, J.-Y., Forget, F., Millour, E., Crismani, M., Schneider, N., and Benna, M.: A global model of meteoric metals in the atmosphere of Mars, Europlanet Science Congress 2021, online, 13–24 Sep 2021, EPSC2021-692, https://doi.org/10.5194/epsc2021-692, 2021.
In the Martian atmosphere, carbon dioxide (CO2) clouds have been revealed by numerous instruments around Mars from the beginning of the XXI century. These observed clouds can be distinguished by two kinds involving different formation processes: those formed during the winter in polar regions located in the troposphere, and those formed during the Martian year at low- and mid-northern latitudes located in the mesosphere (Määattänen et al, 2013). Microphysical processes of formation of theses clouds are still not fully understood. However, modeling studies revealed processes necessary for their formation: the requirement of waves that perturb the atmosphere leading to a temperature below the condensation of CO2 (transient planetary waves for tropospheric clouds (Kuroda et al., 20123), thermal tides (Gonzalez-Galindo et al., 2011) and gravity waves for mesospheric clouds (Spiga et al., 2012)). In the last decade, a state-of-the-art microphysical column (1D) model for CO2 clouds in a Martian atmosphere was developed at Laboratoire Atmosphères, Observations Spatiales (LATMOS) (Listowski et al., 2013, 2014). We use our full microphysical model of CO2 clouds formation to investigate the occurrence of these CO2 clouds by coupling it with the Global Climate Model (GCM) of the Laboratoire de Météorologie Dynamique (LMD) (Forget et al., 1999). Last modeling results on Martian CO2 clouds properties and their impacts on the atmosphere will be presented and be compared to observational data.
How to cite: Mathé, C., Määttänen, A., Audouard, J., Listowski, C., Millour, E., Forget, F., Spiga, A., Bardet, D., Teinturier, L., Falletti, L., Vals, M., González-Galindo, F., and Montmessin, F.: Global 3D modelling of Martian CO2 clouds, Europlanet Science Congress 2021, online, 13–24 Sep 2021, EPSC2021-324, https://doi.org/10.5194/epsc2021-324, 2021.
The dust cycle drives the present-day Mars climate, but many questions regarding the mechanisms of its evolution remain. In particular, despite new sets of observations for the 2018 global dust storm and new modeling efforts, climate models do not realistically capture: (1) The change in day/night surface temperatures, measured locally by REMS/MSL in Gale crater during the 2018 global storm (e.g. Montabone et al., 2020); (2) the 7 and 23-micron brightness temperatures, measured globally by the Thermal Emission Spectrometer (TES) on-board Mars Global Surveyor (MGS), and the 32-micron brightness temperatures, measured globally by the Mars Climate Sounder (MCS) on-board Mars Reconnaissance Orbiter (MRO), that depend on the actual surface temperatures and on the optical properties of dust at 7, 23 and 32 microns respectively; (3) The thermal tides, as seen in the pressure signal by REMS/MSL (Wilson et al., 2019); (4) The column dust opacities, as observed by MCS (2007, 2018 GDS) and TES (2001 GDS), with a significant degree of dispersion during the onset and decay phases of the GDSs (c.f. Fig 2, Bertrand et al., 2020); (5) The vertical dust distribution in the atmosphere, as observed by MCS during storm and non-storm conditions (Wang et al., 2018, Bertrand et al., 2020, Kleinböhl et al., 2020). These discrepancies are connected to each other and are complexly related to evolving dust particle size distributions, dust optical properties and the vertical distribution of dust.
Here we focus on the dust particle size distribution, which is challenging to realistically simulate in climate models, but which could explain some of the discrepancies above. In particular, the particle size distribution greatly influences the surface temperatures and atmospheric opacities (Bertrand et al., 2020, Wilson et al., 2019). We will employ the 3D NASA Ames Mars Global Climate Model (MGCM) to investigate the impact of dust particle sizes on the Martian climate. This model now has the capability to simulate the Martian climate with more complex dust particle size distributions lifted from the surface (with the size now evolving with time and space in the model), thus allowing multi-modal dust populations to be represented in the atmosphere that are tied to consistent radiative transfer calculations, microphysics, sedimentation, and dust coagulation. We will present MGCM simulations performed with a time and space-evolving lifted dust particle size, including bi-modal dust distributions (see Fig. 1). We will show how these processes impact the Martian climate and dust storm evolution, and compare MGCM results with observational datasets to better understand the discrepancies listed above and further constrain the dust particle sizes, sources and vertical distribution.
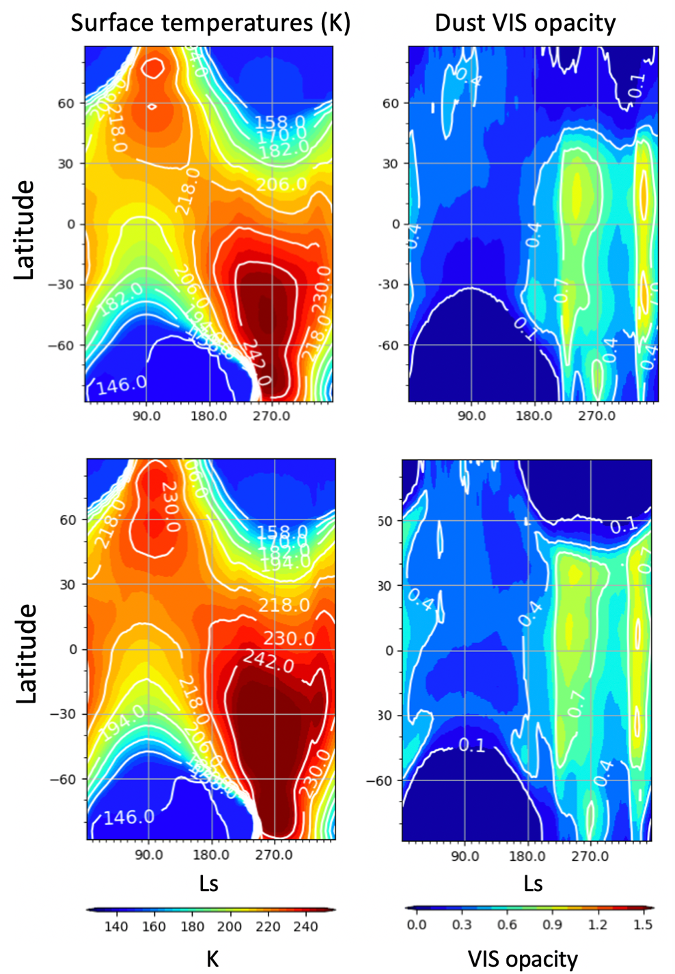
Figure 1: Comparison between two MGCM simulations (monomodal vs bimodal dust distribution) of present-day Mars climate. The simulations are run with only explicit dust injection (based on MCS-derived column dust opacity maps of Martian Year 33), while removal is via sedimentation and transport. Top: with a monomodal lognormal lifted dust particle size distribution having an effective radius of 2 µm. Bottom: with a bi-modal lognormal lifted dust particle size distribution having an effective radius of 1 and 3 µm (both modes correspond to 50% of the total lifted dust). Left: zonal diurnal mean surface temperatures vs time (in solar longitude). Right: zonal mean column dust VIS opacity, as simulated by the MGCM. The simulation with the bi-modal dust distribution leads to higher mean surface temperature and a slightly slower decay phase of the dust storms.
References:
Bertrand, T., Wilson, R. J., Kahre, M. A., Urata, R., & Kling, A. (2020). Simulation of the 2018 Global Dust Storm on Mars Using the NASA Ames Mars GCM: A Multitracer Approach, Journal of Geophysical Research (Planets), 125, e06122.
Heavens, N. G., Kass, D. M., Shirley, J. H (2019), Dusty Deep Convection in the Mars Year 34 Planet-Encircling Dust Event, Journal of Geophysical Research (Planets) Volume 124, Issue 11, pp. 2863-2892.
Kleinböhl, A., et al. (2020), Diurnal Variations of Dust During the 2018 Global Dust Storm Observed by the Mars Climate Sounder. Journal of Geophysical Research (Planets), Volume 125, Issue 1.
Montabone, L., Spiga, A., Kass, D. M., Kleinböhl, A., Forget, F., & Millour, E. (2020). Martian Year 34 Column Dust Climatology from Mars Climate Sounder Observations: Reconstructed Maps and Model Simulations, Journal of Geophysical Research (Planets), 125, e06111.
Spiga, A., Faure, J., Madeleine, J.-B., Määttänen, A., Forget, F. (2013), Rocket dust storms and detached dust layers in the Martian atmosphere, Journal of Geophysical Research: Planets, Volume 118, Issue 4, pp. 746-767
Wang, C., Forget, F., Bertrand, T., Spiga, A., Millour, E., & Navarro, T., 2018. Parameterization of Rocket Dust Storms on Mars in the LMD Martian GCM: Modeling Details and Validation. Journal of Geophysical Research (Planets), 123, 982.
Wilson, R. J., Bertrand, T. and Kahre, M. A. (2019), Assessing Martian Thermal Forcing from Surface Pressure Data: The MY34 Major Dust Storm, Ninth International Conference on Mars, held 22-25 July 2019 in Pasadena, California.
How to cite: Bertrand, T., Kahre, M., Urata, R., Wilson, J., Kling, A., and Wolff, M.: Exploring the impact of bi-modal dust particle size distributions on the present-day Martian climate with the 3D NASA Ames Mars Global Climate Model, Europlanet Science Congress 2021, online, 13–24 Sep 2021, EPSC2021-585, https://doi.org/10.5194/epsc2021-585, 2021.
Abstract
Martian dust storms can obscure the lower reaches of the atmosphere from orbiting spacecraft and at the same time obscure the upper atmosphere from landed spacecraft. Inferring the paths of wind-blown particles and their spatial distributions in the atmosphere may help understand the role of the winds in distributing the dust in the atmosphere and on the surface. We describe a simple but useful transport model that calculates the paths of multiple particles using wind data imported from a Mars climate model. We plan to use our model to help understand the role of the winds in the transport of dust around Mars and how the vertical distribution of dust above a landing site may change over time during a dust storm, e.g. to help with our column modelling work.
Background
Two great dust storms of a planetary scale occurred during the first year of the Viking lander missions [1] one starting at Ls=205° (1977a) and the other at Ls=275° (1977b). They are both thought to have originated somewhere in Thaumasia Fossae and Solis Planum in the southern hemisphere about 2000 km southwest of Valles Marineris. The 2018 global dust storm started unusually for a planet-wide dust storm in Acidalia Planitia in the northern hemisphere [2] and started early in the dust storm season at Ls=185°. The dust from this storm is thought to have reached the Curiosity site about Ls=192°.
Method
We use global wind fields from the Mars Climate Database to trace the path of virtual dust particles using a simple transport model based on [3]. The global wind fields are imported into our transport model up to an altitude of 20 km and we interpolate vertically between these fields. In this study we initialise the model by placing 100 particles at altitudes ranging from 200 m to 20000 m at the coordinates of the dust storm origin. The particles are added to the atmosphere at midnight of the first sol and then travel with the winds, i.e. they act like tracers. The vertical velocity of the particles are set to zero in the current version of the transport model.
Results
Figure 1 shows a simulation for the 2018 global dust storm using MCD wind fields. These results indicate the distance a particle would travel after 10 sols given the horizontal wind speeds and directions given in the MCD for an average solar climate. The general trend of the transport of the particles in figures 1 and 2 is that the lower winds transport particles to the south and the upper winds keep particles in a narrow east-west band.
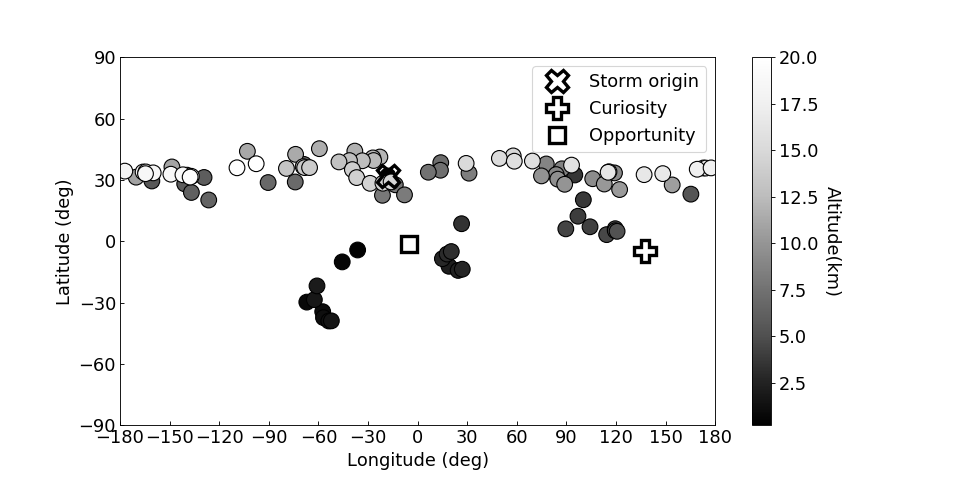
Figure 1 : Particle end points after 10 sols (Ls=185°).
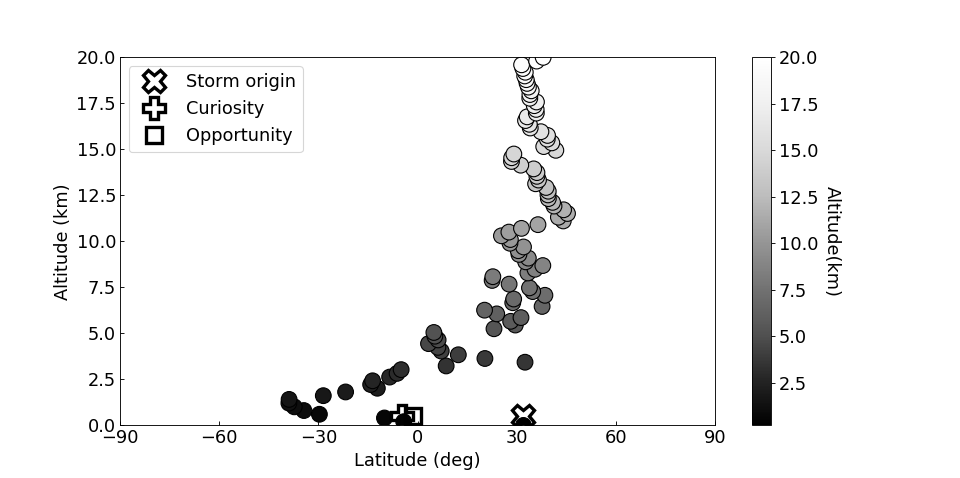
Figure 2 : Vertical profile of the figure 1 particles.
Summary
A simple transport model was used in conjunction with wind fields from the Mars Climate Database to explore dust transport on Mars. It was found that the winds below 10 km could transport dust to the vicinity of Curiosity within 10-15 sols from the start of the 2018 dust storm which is consistent with observations.
The evolution of the 1977A dusts storm was also modelled. As the origin and evolution of the storm is less well known [1] we tried various longitudes and latitudes within the regions of Thaumasia Fossae and Solis Planum. The model inidcates the dust arrived at the Viking lander 1 site at a higher altitude than indicated for Curiosity in figure 2.
The next steps will be to incorperate a vertical velocity component to the particle motion that will involve using MCD vertical velocity fields and the correct physics for modelling the particle's motion in a fluid. The transport model will then be better suited for comparisons with observations at different lander locations and more useful for our analyses of lander meteorological observations using the column model. The transport model could also be useful for understanding the transport of water vapour in the Martian atmosphere.
References
[1] Zurek, Z.W.: Martian great dust storms: An update, Icarus, 50, 288-310, 1982.
[2] Guzewich, S., Lemmon, M. T., Martinez, G., Vicente-Retortillo, Á., Newman, C. E., Baker, M. M., Campbell, C., Cooper, B., Crisp, J., Gomez-Elvira, J., Harri, A. M., Hassler, D., Martin-Torres, F. J., McConnochie, T. H., Moores, J., Kahanpää, H., Khayat, A. S. J., Smith, C. L., Smith, M. D. and Sullivan, R. J., Jr.: Mars Science Laboratory Observations of the 2018/Mars Year 34 Global Dust Storm, Geophysical Research Letters, 46, 71-79, 2019.
[3] Paton, M. D., Harri, A.-M. and Savijärvi, H.: Measurement of Martian boundary layer winds by the displacement of jettisoned lander hardware, Icarus, 309, 345-362, 2018.
How to cite: Paton, M., Leino, J., Harri, A.-M., and Savijärvi, H.: Modelling trajectories of wind-blown particles in the Martian atmosphere, Europlanet Science Congress 2021, online, 13–24 Sep 2021, EPSC2021-384, https://doi.org/10.5194/epsc2021-384, 2021.
We present a study of the morphology, patterns, and dynamics of dust storms on Mars observed at the edge of the North Polar cap during the Northern Hemisphere Spring Equinox from May to June 2019 (MY35) [1] and of the onset of the Global Dust Storm in May to June 2018 (MY34) [2]. The analysis is based on images obtained by the Visual Monitoring Camera (VMC) [3] and the High Resolution Stereo Camera (HRSC) [4] onboard Mars Express, and MARCI camera onboard Mars Reconnaissance Orbiter (MRO) [5-6]. VMC images were analyzed with tools described in previous works [7-8], HRSC images were analyzed from map-projections, and MARCI were processed and projected using the Integrated Software for Imagers and Spectrometers (ISIS) of the USGS [9].
The dust activity at the edge on the North Polar cap in MY35 (Ls = 28°-35°) took place around latitude 60°N in the longitude range 140°E -240°E (along Acidalia, Arcadia and Amazonis planitias). These features exhibited a rich phenomenology typical of this season with different morphologies in form of filaments and fronts, flushing storms (large arc-shaped features), compact textured storms and well developed spiral systems, sometimes mixed with water-ice clouds [1]. Here we concentrate in these last two types of features.
The textured and spiral storms are of local type (areas < 1.6x10⁶ km2)and contained cellular patterns suggestive of organized active updrafts within the storms. The cells varied in size from one storm to other: 50x20 km, 135x60 km and 70x40 km. In all cases, the cell texture is anisotropic in the horizontal size (length/width, l/w~ 2) with values well above the atmospheric scale height (H ~ 8 km). Measured local winds reached velocities from 20 to 45 ms-1. The presence of storms with such different overall structure, for example in the form of compact areas on the one hand and spiral systems on the other, indicates that the underlying mechanisms are different but that above a threshold velocity, all of them generate the dust storms. We explore the action of dry convection in the formation of these patterns driven by buoyancy generated by the radiative heating of atmospheric dust.
The onset of the last Global Dust Storm (GDS 2018) took place on 30 May 2018 (Ls = 182°) at latitude ~ 33°N and longitude 342°E, following a precursor storm on 26-27 May 2018 at latitude ~ 58°N and longitude 325°E [2]. The MARCI high-resolution images reveal again the presence of cellular patterns at different scales (typically 40x20 km) with a well defined frontal line marking the storm advance. The storm morphology rapidly evolved in one day showing patterns of long wave trains with wavelengths ranging from 10 to 20 km. We interpret these as gravity waves formed by intense winds flowing over craters and other topographic structures.
References:
[1] Sánchez-Lavega A. et al., Patterns in textured dust storms in Mars North Pole, Europlanet Science Congress 2020, EPSC Abstracts Vol., EPSC2020-141 (2020)
[2] Sánchez-Lavega A., T. del Río-Gaztelurrutia, J. Hernández-Bernal,M. Delcroix, The onset and growth of the 2018 Martian Global Dust Storm, Geophys. Res. Lett., 46, 6101-6108 (2019). doi.org/10.1029/2019GL083207.
[3] Ormston, T., Denis, M., Scuka, D., & Griebel, H., An ordinary camera in an extraordinary location: Outreach with the Mars Webcam. Acta Astronautica, 69, 703-713 (2011)
[4] Jaumann, R., Neukum, G., Behnke, T., Duxbury, T. C., Eichentopf, K., Flohrer, et al., The high-resolution stereo camera (HRSC) experiment on Mars Express: Instrument aspects and experiment conduct from interplanetary cruise through the nominal mission. Planetary and Space Science, 55, 928-952 (2007)
[5] Malin, M.C., Bell, J.F., Calvin, W., Clancy, R.T., Haberle, R.M., James, P.B., Lee, S.W., Thomas, P.C., Caplinger, M.A., Mars Color Imager (MARCI) on the Mars Climate Orbiter. J. Geophys. Res. 106 (E8), 17651–17672 (2001)
[6] Bell, J.F., et al., Mars Reconnaissance Orbiter Mars Color Imager (MARCI): instrument, description, calibration, and performance. J. Geophys. Res. E 114 (8), E08S92 (2009). https://doi.org/10.1029/2008JE003315.
[7] Sánchez-Lavega, A., Chen-Chen, H., Ordonez-Etxeberria, I., Hueso, R., del Rio-Gaztelurrutia, T., Garro, A., & Wood, S., Limb clouds and dust on Mars from images obtained by the Visual Monitoring Camera (VMC) onboard Mars Express. Icarus, 299, 194-205 (2018)
[8] Hernández‐Bernal, J., Sánchez‐Lavega, A., del Río‐Gaztelurrutia, T., Hueso, R., Cardesín‐Moinelo, A., Ravanis, E. M., Tivov, D., & Wood, S., The 2018 Martian Global Dust Storm over the South Polar Region studied with MEx/VMC. Geophys. Research Lett., 46, 10330-10337 (2019)
[9] ISIS. Integrated Software for Imagers and Spectrometers (accessed 2021). https://isis.astrogeology.usgs.gov/
How to cite: Sanchez-Lavega, A., Leyva, J. M., Erkoreka, A., García-Morales, J., Hernández-Bernal, J., del Rio-Gaztelurrutia, T., Ordoñez-Etxeberria, I., Cardesin, A., Hueso, R., Titov, D., Wood, S., Tirsch, D., Hauber, E., and Matz, K.-D.: Dynamical Phenomena in Martian dust storms, Europlanet Science Congress 2021, online, 13–24 Sep 2021, EPSC2021-251, https://doi.org/10.5194/epsc2021-251, 2021.
Introduction: Like Earth, Mars possesses dynamical atmospheric features known as polar vortices. These are regions of cold, isolated polar air surrounded by powerful westerly wind jets which can create barriers to transport of atmospheric dust, water, and chemical species. They have a complex and asymmetrical (north/south) relationship with atmospheric dust loading [1]. Regional and global dust events have been shown to cause rapid vortex displacement [2,3] in the northern vortex, while the southern vortex appears more robust.
Unlike Earth, Mars also experiences planet-encircling Global Dust Storms: spectacular, planet-spanning events which dramatically increase atmospheric dust loading. The most recent such event in 2018 (beginning at northern autumn equinox) [4] was observed by multiple spacecraft, including the ExoMars Trace Gas Orbiter (TGO) and the Mars Reconnaissance Orbiter (MRO), enabling the opportunity to study its effects on the polar vortices in detail.
We do this by assimilating [5] spacecraft data from TGO’s Atmospheric Chemistry Suite (ACS) [6,7] and MRO’s Mars Climate Sounder (MCS) [8,9] into the LMD-UK Mars Global Climate Model [10], a 4D numerical model of the martian atmosphere.
Results: We present our recently published results [11], where we find that the 2018 GDS had asymmetrical impacts in each hemisphere: the northern polar vortex remained relatively robust, while the southern polar vortex was significantly disrupted. This asymmetry was due to both the storm’s latitudinal extent, which was greater in the south than in the north, and its timing, occurring as the southern vortex was already decaying after equinox. Both polar vortices and especially the northern showed reductions in their ellipticity, and this correlated with a reduction in high-latitude stationary wave activity in both hemispheres. We show that the characteristic elliptical shape of Mars’ polar vortices is the pattern of the stationary waves; this was suppressed during the storm by the shifting of the polar jet away from regions of high mechanical forcing in the north, and by the reduced polar jet due to the decreased meridional temperature gradient in the south. These asymmetric effects suggest enhanced transport into the southern, but not northern, polar region during GDS around northern autumn equinox, as well as more longitudinally symmetric transport around both poles.
References: [1] Waugh, D. W. et al (2016) J. Geophys. Res. Planets, 121, 1770-1785. [2] Guzewich, S. D. et al (2016) Icarus, 278, 100-118. [3] Mitchell, D. M. et al (2015) Q.J.R. Meteorol. Soc., 141, 550-562. [4] Kass, D. M et al (2019) GRL, 47(23). [5] Lewis, S. R. et al (2007) Icarus, 192(2). [6] Korablev, O. et al (2018) Space Sci. Rev., 214(7). [7] Fedorova, A. A. et al (2020) Science, 367(6475). [8] McCleese, D. J. et al (2007) JGR (Planets), 112(E5). [9] Kleinböhl, A. et al (2009) JGR (Planets), 114(E10). [10] Forget, F. et al (1999) JGR (Planets), 104(E10). [11] Streeter, P. M. et al (2021) JGR (Planets), e2020JE006774.
How to cite: Streeter, P., Lewis, S., Patel, M., Holmes, J., Fedorova, A., Kass, D., and Kleinböhl, A.: Asymmetric impacts on Mars' polar vortices from the 2018 Global Dust Storm, Europlanet Science Congress 2021, online, 13–24 Sep 2021, EPSC2021-702, https://doi.org/10.5194/epsc2021-702, 2021.
The presence of an equatorial westerly jet in a planetary atmosphere is often referred to as super-rotation. On Mars, super-rotation affects – and is affected by – the distribution of dust in the atmosphere. We used data assimilation to study the interaction between dust and the equatorial jet during the MY34 Mars global dust storm (GDS). The data assimilation scheme integrated temperature and dust retrievals from the Mars Climate Sounder aboard the Mars Reconnaissance Orbiter and the Atmospheric Chemistry Suite aboard the ExoMars Trace Gas Orbiter into a numerical model of the Martian atmosphere. This created a better representation of the atmospheric state than could be achieved from the observations or the model alone.
We found that super-rotation increased by a factor of two at the peak of the GDS, as compared to the same period in the previous year which did not feature a GDS. A strong westerly jet formed in the tropical lower atmosphere, and easterlies were strengthened above 60 km, as a result of momentum transport by dust-driven thermal tides. We found that the atmosphere was in a state of enhanced super-rotation even before the onset of the GDS, as a result of equatorward advection of dust from the southern mid-latitudes into the tropics. The redistribution of dust across the hemispheres resulted in a more uniform dust distribution across the tropics, leading to a symmetric Hadley cell with a tropical upwelling branch that was closely aligned to the vertical. We argue that the symmetrical circulation and enhanced super-rotation were important environmental factors that encouraged the rapid development of the MY34 GDS.
How to cite: Rajendran, K., Lewis, S. R., Holmes, J. A., Streeter, P. M., Fedorova, A. A., and Patel, M. R.: Enhanced Super-rotation before and during the MY34 Martian Global Dust Storm, Europlanet Science Congress 2021, online, 13–24 Sep 2021, EPSC2021-82, https://doi.org/10.5194/epsc2021-82, 2021.
Observations of the vertical distribution of water vapour provide a unique snapshot of the vertical transport processes that contribute to the global martian hydrological cycle. While previous datasets have largely been seasonally and spatially sparse, vertical profiles of water retrieved from the Nadir and Occultation for MArs Discovery (NOMAD) and Atmospheric Chemistry Suite (ACS) instruments on the ExoMars Trace Gas Orbiter (TGO) provide the most complete dataset so far. These data are now capable of providing robust constraints on the 4-D distribution of water, especially when also combined with retrievals of additional atmospheric properties (e.g. temperature profiles, dust column) that exert an influence on the evolving global water distribution.
A key limitation though is the fact that observations of water profiles are still relatively limited in coverage, in the global sense, and the vertical distribution of water at latitudes and times not regularly probed by NOMAD and ACS remains poorly understood.
To address this, we have created a global reference climatology of water vertical distribution for Mars Year (MY) 34 through a multi-spacecraft data assimilation combining several retrieval datasets with a Mars Global Circulation Model. Retrievals of dust column and temperature profiles from Mars Climate Sounder on the Mars Reconnaissance Orbiter and water vapour and temperature profiles from multiple instruments on the ExoMars TGO during the primary science phase covering the latter half of MY34 are combined through assimilation to create one unified physically consistent global dataset.
The vertical water vapour distribution is investigated globally. During the initial coverage of TGO observation that covers the dusty season in MY34, northern polar latitudes are largely absent of water vapour below 20 km with variations in abundance above this altitude throughout the dusty season linked to transport from mid-latitudes during a global dust storm, perihelion season and the intense MY34 C storm. The atmosphere is in a supersaturated state above 60 km for most of the time period investigated, with lower altitudes showing more diurnal variation in the saturation state of the atmosphere. A key benefit of the data assimilation technique is that constraints on dynamical transport imposed by the assimilated water vapour and temperature profiles leads to improvements in the simulated water ice distribution even though it is not altered directly by the assimilation process.
The climatology created, which will become publicly available for wider use by the martian scientific community, has also been independently validated against water vapour profiles from the SPICAM instrument.
How to cite: Holmes, J., Lewis, S., Patel, M., Aoki, S., Liuzzi, G., Villanueva, G., Crismani, M., Fedorova, A., Alday, J., Kass, D., Vandaele, A. C., and Korablev, O.: Global variations in the vertical distribution of water during Mars Year 34 from multiple spacecraft observations, Europlanet Science Congress 2021, online, 13–24 Sep 2021, EPSC2021-368, https://doi.org/10.5194/epsc2021-368, 2021.
Introduction: For many years we have been working on the modeling of the martian water cycle in the Laboratoire de Météorologie Dynamique martian Global Climate Model [1,2,3,4]. This has been challenging because of destabilizing feedbacks such as the coupling between temperatures, water vapour, clouds, and temperature changes induced by radiatively active water clouds [2].
It is interesting to accurately model Mars’s water cycle not only to understand present day Mars but also to simulate past climate changes induced by obliquity and orbital variations. This study is partly motivated by the ERC Mars Through Time project which notably aims at modeling recent (<10 Myrs) martian paleoclimates. We have run control simulations using the set of water-cycle related parameters from [2] which show good agreement with satellite measurements. However, we have recently discovered that the coupling between the microphysics and other physical processes such as turbulent and convective mixing induce a non-negligible sensitivity to the GCM physical timestep. Of course it is better to use the shortest timestep but this causes an significant drying of the modeled climate system. This motivated us to implement more realistic physical processes which, in addition to being prominent for paleoclimatic studies, allow for an improved agreement with atmospheric water-related data measured by the Thermal Emission Spectrometer (TES) and Spectroscopy for the Investigation of the Characteristics of the Atmosphere of Mars (SPICAM) instruments [5,6,7] The improved physics include a temperature-dependant water contact parameter, latent heat of ground-ice sublimation and distinct albedo for water frost and perennial ground ice.
Sensitivity to the physical timestep: The standard physical timestep used in [1] was 15 martian minutes, subsequently reduced to 7.5 minutes. The water cycle shows a significant sensitivity to the physical timestep. This is because the dust and water physics and transport are strongly coupled with boundary layer parametrization radiative transfert, and cloud microphysics. Cloud microphysics uses a dedicated subtimestep for computing efficiency, but the diversity of processes involved bind us to increase physical resolution altogether. We will discuss the influence of an even smaller physical timestep to the water cycle, and the distinct effect of the dynamical timestep.
Temperature-dependant water contact parameter: The water “contact parameter” controls the effective fraction of nuclei activated for water condensation. The higher it is, the more water ice nucleation is favored and water-ice clouds form. Experimental data and literature [8] tend to show a strong dependence of the contact parameter with temperature. However, GCMs usually use constant water contact parameter. We find that using a simple linear fit from [8], albeit oversimplifying the bimodal behavior between low and high temperatures, attenuates the thickness of the northern polar hood during the second part of the year while allowing for a thick aphelion cloud belt, which was a key modeling issue in the LMD GCM (Navarro et al. 2014).
Latent heat of ground ice sublimation: The latent heat of ground water ice sublimation had been neglected in our climate model, because of the low amount of water and thus energy flux involved. The sublimation of water was hitherto simply computed using surface temperature and water vapor equilibrium. Preliminary studies of martian climates at higher obliquities have shown that the energy fluxes involved may become of prime importance, as accounting for the latent heat of ground ice strongly inhibits the summer sublimation of the polar caps. Its calculation in a GCM requires an implicit numerical scheme to properly account for the coupling between temperature and sublimation during the GCM timestep. We show that the latent heat of ground ice sublimation has a minor influence on the global present-day water-cycle but may be considered for specific phenomenons such as the perenniality of crater-induced water ice ejectas [8].
Differentiation of perennial ice albedo and water frost albedo: Through sublimation, the northern polar cap around summer solstice is the dominant atmospheric source of water vapor in our GCM. It shows a strong dependence of summer surface temperature with albedo and thus sublimation [2]. While acceptable water ice albedos range from 0.3 to 0.5 on Mars [9], monitoring the northern polar cap show that the start and end of sublimation phases are correlated with albedo variations [10]. The outlier region of the polar cap is actually the main source of sublimation in the GCM, while the central cap is a cold trap where water vapor condenses into frost. The albedo of perennial water ice and frost, previously identical, are now separated in our GCM to take into account the fact that fresh frosts can exhibit higher albedos which tend to slow down their sublimation . Future enhancements may include a time-varying frost albedo, as it changes with the evolution of ice particules size (metamorphism) and dust accumulation, and thus represent more accurately the insolation on the northern polar cap during summer. These processes may play a key role in paleoclimate studies.
Conclusion: Because of the intricate complexity of the feedbacks between dynamics, dust and water transport and cloud microphysics, increasing the temporal resolution in the GCM is mandatory. We have addressed the disruptions it causes to our reference water cycle simulation by taking into account previously neglected physical processes, which allow for a satisfying agreement with TES and SPICAM datasets (figure 1).
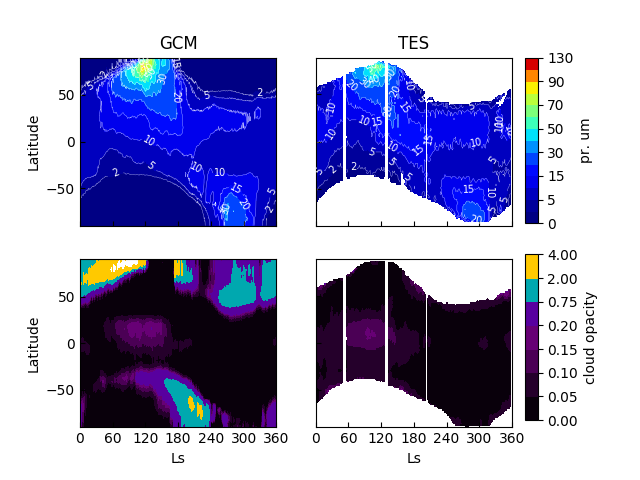
Figure 1: Reference simulation (MY26) compared to TES data for water vapor column and cloud opacity at 2 PM.
References:
[1] Montmessin et al. (2004), Journal of Geophysical Research: Planets, 109(E10). [2] Navarro et al. (2014), Journal of Geophysical Research: Planets, 119(7), 1479-1495. [3] Pottier et al. (2017), Icarus, 291, 82-106. [4] Vals (2019), Doctoral dissertation, UPMC. [5] Smith (2004), Icarus, 167(1), 148-165. [6] Maltagliati et al. (2011), Science, 333(6051), 1868-1871. [7] Fedorova et al. (2020), Journal of Geophysical Research: Planets, e2020JE006616. [7] Määttänen et al. (2014), GeoResJ, 3, 46-55. [8] Byrne et al. (2009), Science, 325(5948), 1674-1676. [9] Wilson et al. (2007), Geophysical Research Letters, 34(2). [10] Hale, A. S. et al. (2005), Icarus, 174(2), 502-512.
How to cite: Naar, J., Forget, F., Vals, M., Millour, E., Bierjon, A., González-Galindo, F., and Richard, B.: Modeling the global water cycle on Mars with improved physical parametrization, Europlanet Science Congress 2021, online, 13–24 Sep 2021, EPSC2021-559, https://doi.org/10.5194/epsc2021-559, 2021.
The thermal escape of hydrogen from Mars is recognized as one of the major drivers of the long-term climatic evolution of the planet. Recent works have shown that, contrary to what was previously believed, water is not trapped in the lower atmosphere of Mars. Instead, it can be transported to the middle/upper atmosphere, producing layers of supersaturated water (Fedorova et al., 2018, 2021). Upper atmospheric water can then be converted to hydrogen by photolysis or chemical reactions with ions, boosting the rate of hydrogen escape (Chaffin et al., 2017; Stone et al., 2020). Strong seasonal variations in the escape rate, and significant increases of both the water abundance in the mesosphere and the hydrogen escape rate during dust storms, evidence the strong coupling between the hydrogen escape and the water cycle (Chaffin et al., 2014; Fedorova et al., 2018, 2020). A global model able to simulate all the processes related to water, from the ice sublimation to the transport to the upper atmosphere and its atmospheric escape, is needed in order to help interpreting the observations. This model can also be used to explore also the water cycle and hydrogen escape on past Mars conditions characterized by different orbital parameters, allowing for a better estimation of the accumulated escape rate.
Previous simulations with the LMD-Mars Global Climate Model (LMD-MGCM), and their comparison with observational results by SPICAM/Mars Express showed that the simulated escape rate was underestimated, in particular during the second half of the Martian year (Chaufray et al., 2021). However, those simulations did not take into account the microphysical processes producing water supersaturation, and thus underestimated the role of water transport in the escape rate. In addition, the model did not include the photochemistry of water-derived ions, which can play an important role in converting water into hydrogen (Stone et al., 2020).
New simulations with an improved version of the LMD-MGCM have been produced that overcome those previous limitations. The water cloud microphysics has now been fully considered in the simulations, using the model by Navarro et al. (2014). The photochemical model has been updated to include water-derived ions (H2O+, H3O+, OH+). Also, the deuterium fractionation model has been improved (Rossi et al., 2021), and deuterated species have been included in the photochemical model. While this last modification is not expected to modify the hydrogen escape rate, the inclusion of deuterated species can provide important diagnostics on the hydrogen escape and its accumulation over Mars history.
In this presentation we will show the results of the improved version of the LMD-MGCM, comparing with available observations. The focus will be on the predicted hydrogen escape rate, and how it is affected by the inclusion of different physical processes. We find that including the possibility of water supersaturation increases the Hydrogen escape rate in more than one order of magnitude at most seasons, taking the simulated rate to better agreement with SPICAM observations during the second half of the year. This confirms previous observational results indicating the importance of water supersaturation (Fedorova et al. 2020). We also find that the inclusion of water-derived ions in the photochemistry also increases the escape rate, in particular during the first part of the year. We will also compare the predicted water abundance in the mesosphere with Mars Express and ExoMars TGO observations, and the abundances of water-derived ions with NGIMS/MAVEN measurements.
References:
Chaffin, M. et al., Unexpected variability of Martian hydrogen escape, Geophysical Research Letters, Volume 41, pp. 314-320 (2014)
Chaffin, M. et al., Elevated atmospheric escape of atomic hydrogen from Mars induced by high-altitude water, Nature Geoscience, 10, pp. 174-178 (2017)
Fedorova, A. et al., Water vapor in the middle atmosphere of Mars during the 2007 global dust storm, Icarus, 300, pp. 440-457 (2018)
Fedorova, A. et al., Stormy water on Mars: The distribution and saturation of atmospheric water during the dusty season, Science, 367, pp. 297-300 (2020)
Fedorova, A. et al., Multi-Annual Monitoring of the Water Vapor Vertical Distribution on Mars by SPICAM on Mars Express, Journal of Geophysical Research: Planets, 126, e06616 (2021)
Navarro, T. et al., Global climate modeling of the Martian water cycle with improved microphysics and radiatively active water ice clouds, Journal of Geophysical Research: Planets, 119, pp. 1479-1495 (2014)
Rossi, L. et al., The Effect of the Martian 2018 Global Dust Storm on HDO as Predicted by a Mars Global Climate Model, Geophysical Research Letters, 48, e90962 (2021)
Stone, S. et al., Hydrogen escape from Mars is driven by seasonal and dust storm transport of water,Science, 370, pp. 824-831 (2020)
How to cite: González-Galindo, F., Chaufray, J.-Y., Lefèvre, F., Montmessin, F., Vals, M., Rossi, L., Forget, F., and Millour, E.: Escape of water from Mars: study with a ground-to-exosphere global model, Europlanet Science Congress 2021, online, 13–24 Sep 2021, EPSC2021-395, https://doi.org/10.5194/epsc2021-395, 2021.
Mars likely had a denser atmosphere during the Noachian eon about 3.6 to 4.0 billion years ago (Ga). How dense this atmosphere might have been, and which escape mechanisms dominated its loss are yet not entirely clear. However, non-thermal escape processes and potential sequestration into the ground are believed to be the main drivers for atmospheric loss from the present to about 4.1 Ga.
To evaluate non-thermal escape over the last ~4.1 billion years, we simulated the ion escape of Mars' CO2 atmosphere caused by its dissociation products C and O atoms with numerical models of the upper atmosphere and its interaction with the solar wind (see Lichtenegger et al. 2021; https://arxiv.org/abs/2105.09789). We use the planetward-scattered pick-up ions for sputtering estimates of exospheric particles including 36Ar and 38Ar isotopes, and compare ion escape, with sputtering and photochemical escape rates. For solar EUV fluxes ≥3 times the present-day Sun (earlier than ~2.6 Ga) ion escape becomes the dominant atmospheric non-thermal loss process until thermal escape takes over during the pre-Noachian eon (earlier than ~4.0 - 4.1 Ga). If we extrapolate the total escape of CO2-related dissociation products back in time until ~4.1 Ga, we obtain a theoretical equivalent to CO2 partial pressure of more than ~3 bar, but this amount did not necessarily have to be present and represents a maximum that could have been lost to space within the last ~4.1 Ga.
Argon isotopes can give an additional insight into the evolution of the Martian atmosphere. The fractionation of 36Ar/38Ar isotopes through sputtering and volcanic outgassing from its initial chondritic value of 5.3, as measured in the 4.1 billion years old Mars meteorite ALH 84001, until the present day can be reproduced for assumed CO2 partial pressures between ~0.2-3.0 bar, depending on the cessation time of the Martian dynamo (assumed between 3.6-4.0 Ga) - if atmospheric sputtering of Ar started afterwards. The later the dynamo ceased away, the lower the pressure could have been to reproduce 36Ar/38Ar.
Prior to ~4.1 Ga (i.e., during the pre-Noachian eon), thermal escape should have been the most important driver of atmospheric escape at Mars, and together with non-thermal losses, might have prevented a stable and dense CO2 atmosphere during the first ~400 million years. Our results indicate that, while Mars could have been warm and wet at least sporadically between ~3.6-4.1 Ga, it likely has been cold and dry during the pre-Noachian eon (see also Scherf and Lammer 2021; https://arxiv.org/abs/2102.05976).
How to cite: Scherf, M., Lichtenegger, H., Dyadechkin, S., Lammer, H., Adam, R., Kallio, E., Amerstorfer, U., and Järvinen, R.: How atmospheric escape sculped the evolution of the Martian CO2 atmosphere over time, Europlanet Science Congress 2021, online, 13–24 Sep 2021, EPSC2021-599, https://doi.org/10.5194/epsc2021-599, 2021.
Abstract
In 1997 Pathfinder descended on its parachute through the nocturnal boundary layer of Mars. Pathfinder descended early in the morning a few hours before the possible formation of a low level jet [1]. We use an EDL trajectory model to simulate the landing of Pathfinder and its jettisoned hardware and together with HiRISE images of the landing site we are able to constrain the wind speeds and directions during its descent.
Background
Pathfinder parachute deployment occured at an altitude of around 10 km. The heat shield was jettisoned 15 s later. Shortly afterwards Pathfinder enveloped in its deflated airbags was lowered down on a bridle. The airbags were then inflated at an altitude of a few hundred metres. High powered rockets, attached to the back shell, were fired at an altitude of about 80 m reducing the vertical velocity to nearly zero at an altitude of 20 m above the surface. The lander was then released and dropped to the surface while the rockets used the remaining propellant to shoot the backshell and parachute upwards and away from the lander. The lander proceeded to bounce about 1 km towards the northeast coming to rest after about two minutes [2].
Method
We numerically integrate the equations of motion to model the trajectories of the Pathfinder spacecraft and its heat shield. The relative distance between the heat shield and the lander in HiRISE images is compared to that in the model using a similar method used in [3]. The first impact point of the airbags, which we require to help constrain the trajectory of the lander, is not visible in the HiRISE image so we reconstruct the likely impact point based on information in [2]. To infer wind speeds and directions we vary the wind speeds in the EDL model using a Hill climbing algorithm until the predicted impact points match those of the heat shield in the HiRISE image and the reconstructed impact point of the airbags. There are two levels of winds between 0 and 9.6 km in the EDL model an upper and a lower one. The division line between the two levels is a free parameter. In figure 1 the division line is set to 1 km altitude.
Results
Figure 1 shows the ground track of Pathfinder starting from parachute deployment at 9.6 km. The dots on the tracks are intervals of 1 km. The predicted impact points from the EDL model have been fitted to the locations of the jettisoned Pathfinder heat shield in the HiRISE image and the inferred first bounce location.
Figure 1 : Ground track of Pathfinder and the heat shield.
Summary
We varied the line dividing the upper and lower wind levels in the EDL model from 500 m to 2000 m. We also varied the distance between the first bounce and the lander at rest from 400 and 1000 m. We found the wind directions can be fairly well constrained even if these two parameters are varied. Above 500-2000 m the upper level wind was inferred to be coming from the west (240-310°) and below 500-2000 m the lower level wind was inferred to be coming from the southeast (120-150°). To obtain fits between the model and observations the upper level wind speed was required to be between 15 and 30 m s-1 while the lower level wind speed in the model was found to be in a similar range.
References
[1] Savijärvi, H., Määttänen, A., Kauhanen, J. and Harri, A.-M.: Mars pathfinder: New data and new model simulations, Quarterly Journal of the Royal Meteorological Society, 130, 669-683, 2004.
[2] Golombek, M.P., Anderson, Robert, Barnes, Jeffrey, Bell, J.F., Bridges, Nathan, Britt, Daniel, Brückner, J., Cook, R.A., Crisp, David, Crisp, J.A., Economou, Thanasis, Folkner, W., Greeley, R., Haberle, R., Hargraves, R.B., Harris, J.A., Haldemann, A., Herkenhoff, K., Hviid, S.F., Wilson, G.R.: Overview of the Mars Pathfinder Mission: Launch through Landing, Surface Operations, Data Sets, and Science Results, Journal of Geophysical Research, 104, 8523-8554, 1999.
[3] Paton, M. D., Harri, A.-M. and Savijärvi, H.: Measurement of Martian boundary layer winds by the displacement of jettisoned lander hardware, Icarus, 309, 345-362, 2018.
How to cite: Paton, M., Savijärvi, H., Harri, A.-M., and Leino, J.: The winds in the Martian nocturnal boundary layer at the time of the Pathfinder landing, Europlanet Science Congress 2021, online, 13–24 Sep 2021, EPSC2021-666, https://doi.org/10.5194/epsc2021-666, 2021.
I- Introduction
The Martian surface is prone to atmospheric turbulence. Its thin atmosphere allows strong near-surface temperature gradients, especially during daytime, which result in conductive and convective instabilities in the Planetary Boundary Layer1. Atmospheric turbulence have different forms: convection cells during daytime and possibly convection rolls during the night, vortexes, waves or local turbulence. These phenomena induce high-frequency variations in the atmospheric pressure, wind and temperature, with different time scales. Most processes happen during the day, and are sensitive to seasons. On the opposite, nighttime conditions at the surface of Mars are usually highly-stable, though not much studied.
The InSight NASA mission, arrived on Mars in November 2018, recently brought new knowledge on surface atmospheric turbulence. InSight is the first lander operating an advanced geophysical station on Mars. It also has many accurate meteorological sensors and acts as a fixed weather station. Previous studies on the first 400 sols of the mission2,3 observed a high vortex activity during the day, though no detection of dust devils, detected nigttime gravity waves, and discovered the presence of a quiet regime 2 to 4 hours after sunset, which they attributed to the development time of the nocturnal low-level jet.
The aim of this work is to complete the study the atmospheric turbulence measured by the InSight mission over more than one Martian year and investigate its diurnal and seasonal variations. We observe many unexpected events with the arrival of autumn, with a burst of daytime vortexes, the apparition of nighttime vortexes and the development of a nighttime local turbulence nearly as intense as during daytime. Observational results are afterwards compared to Large Eddy Simulation (LES) outputs to bring new insights on the origin of the turbulent phenomena observed.
II- Investigation of the atmospheric turbulence with InSight pressure data
II.1- Vortexes
Previous studies4,5 observed vortexes during the first 400 sols of the mission, corresponding to a half year, spanning from the end of northern winter to midsummer. We extended their study to more than a complete Martian year. Vortexes are detected in the pressure data as sudden pressure drops of 0.1 to 10 Pa amplitude. We used the same detection algorithm as described in 4.
II.2- Local and non-local turbulence
Aside from vortexes, atmospheric turbulence can be observed through high-frequency pressure variations. We classified the turbulent phenomena in two groups depending on their timescales. ‘Local turbulence’ is due to small scale and high frequency phenomena (<100s), while ‘non-local turbulence’ is linked to larger structures (e.g. convection cells), which have longer timescales (100-500s). The typical frequency of non-local turbulence is similar to the one of peculiar structures such as gravity waves3, which are therefore included in our definition of non-local turbulence. Fig.1 and 2 are examples of investigation of local turbulence on two seasons, computed from a moving mean on 100s and a moving standard deviation on 500s.
III- InSight results
The comparison of the results given by vortexes and the two turbulences are given in Fig.3-4-5.
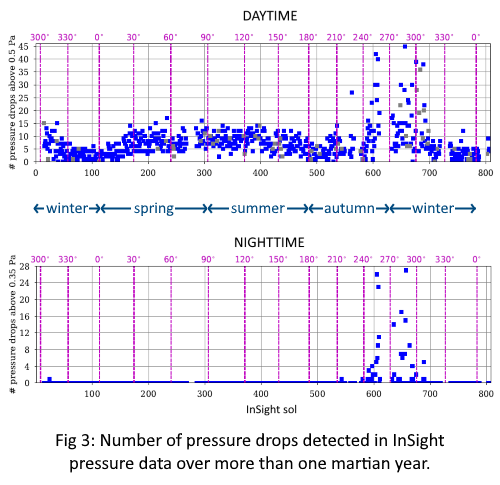
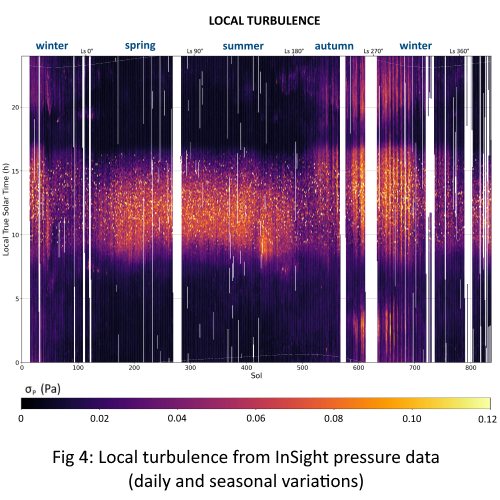
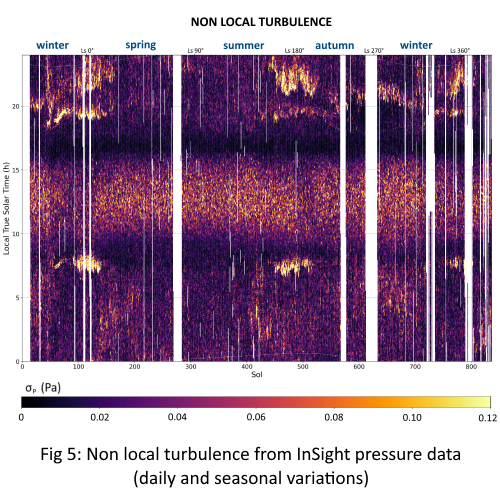
We observe that northern spring and summer define a very calm season. There is nearly no change from one day to another, very few non local turbulence at night and absolutely no nighttime vortexes and local turbulence.
On the opposite, the northern autumn brings a lot of turbulences, which continue into winter. We observe two different trends:
(T1) In early autumn and late winter a 50% decrease is observed in the daytime local turbulence and a small nighttime local turbulence appears. These are attributed to a solar flux decrease as many storms load the atmosphere with dust. The day surface temperature decreases, which inhibits the atmospheric turbulence. On the opposite, the night surface temperature increases and induces a strong increase of the low-level jet in the evening, which could trigger the apparition of nighttime turbulence. During this period, strong nighttime signals are also present in the non local turbulence, around 8h, 20h and 22h. They are attributed to gravity waves or bores3.
(T2) In between, from sols 530 to 710, a very different pattern is observed. The daytime local turbulence increases back, and the nighttime local turbulence increases up to values similar to the daytime signal, along with the formation of nighttime vortexes. We suspect the strong nocturnal low-level jet to be at the origin of an enhanced nighttime turbulence and the formation of nighttime vortexes. Pseudo-regular extinction patterns of 3 to 12 sols are present, and are perfectly correlated to high wind periods defined by baroclinic waves3.
IV- Large Eddy Simulations
We performed Large Eddy Simulations (LES) in different seasonal and wind conditions to investigate further the turbulent processes observed by InSight (see Fig.6). We used the model described in 6, and previously adapted to InSight landing site conditions in 4.
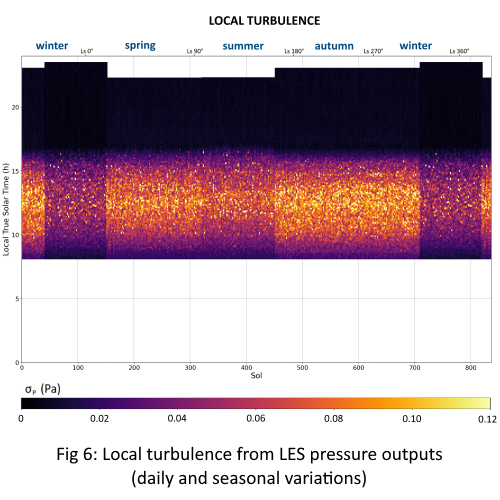
Turbulence results obtained with the LES in spring-summer conditions reproduce very well the observations by InSight. A major conclusion is that the model succeeded in creating daytime local turbulence, even with 25 m-large mesh grids. We observed that local turbulence increases with wind velocity, while wind has only minor effects on non local turbulence.
On the opposite, nighttime vortexes and local turbulence during the autumn-winter season are not reproduced by LES in the case of a constant altitude wind forced to 10 or 20 m/s. We will investigate further the possible effect of a wind profile. Nevertheless, we know that even for the study of Earth, LES have intrinsic difficulties simulating stable boundary layers, existing especially at night (due to mesh size limitation).
References
1Tillman J.Atm.Sc. 1994
2Spiga Space Sc.Rev. 2018
3 Banfield Nature Geoscience 2020
4 Spiga JGR 2021
5 Lorenz Icarus 2021
6 Spiga Q.J.R.Meteorol.Soc. 2010
How to cite: Chatain, A. and Spiga, A. and the InSight team: Seasonal variability of Mars atmospheric turbulence studied from InSight high-frequency pressure measurements, Europlanet Science Congress 2021, online, 13–24 Sep 2021, EPSC2021-290, https://doi.org/10.5194/epsc2021-290, 2021.
Please decide on your access
Please use the buttons below to download the presentation materials or to visit the external website where the presentation is linked. Regarding the external link, please note that Copernicus Meetings cannot accept any liability for the content and the website you will visit.
Forward to presentation link
You are going to open an external link to the presentation as indicated by the authors. Copernicus Meetings cannot accept any liability for the content and the website you will visit.
We are sorry, but presentations are only available for users who registered for the conference. Thank you.
Please decide on your access
Please use the buttons below to download the presentation materials or to visit the external website where the presentation is linked. Regarding the external link, please note that Copernicus Meetings cannot accept any liability for the content and the website you will visit.
Forward to session asset
You are going to open an external link to the asset as indicated by the session. Copernicus Meetings cannot accept any liability for the content and the website you will visit.
We are sorry, but presentations are only available for users who registered for the conference. Thank you.

