
Observation of Mercury's Exopshere with the Visible Channels of PHEBUS during BEPICOLOMBO First Mercury's Flyby
 ,,
,,- LATMOS-OVSQ, Université Versailles Saint-Quentin, Guyancourt, France (rozenn.robidel@latmos.ipsl.fr)
The first flyby of Mercury with BepiColombo (ESA/JAXA joint mission) took place on October 1, 2021. PHEBUS (Probing of Hermean Exosphere By UltraViolet Spectroscopy) was able to observe during this flyby with its EUV detector (Extreme UltraViolet, spectral range 55-155 nm) and its visible channels, one centered on 404 nm (K emission line) and the other centered on 422 nm (Ca emission line). We will refer to the channel dedicated to potassium as c404 and the channel dedicated to calcium as c422. The observation started 30 minutes before the Closest Approach (CA) and lasted one hour, with the line of sight directed to the North and slightly anti-sunwards (Fig1). The slit was removed and the acquisitions were made every 10 seconds with an exposure time of 8 seconds.
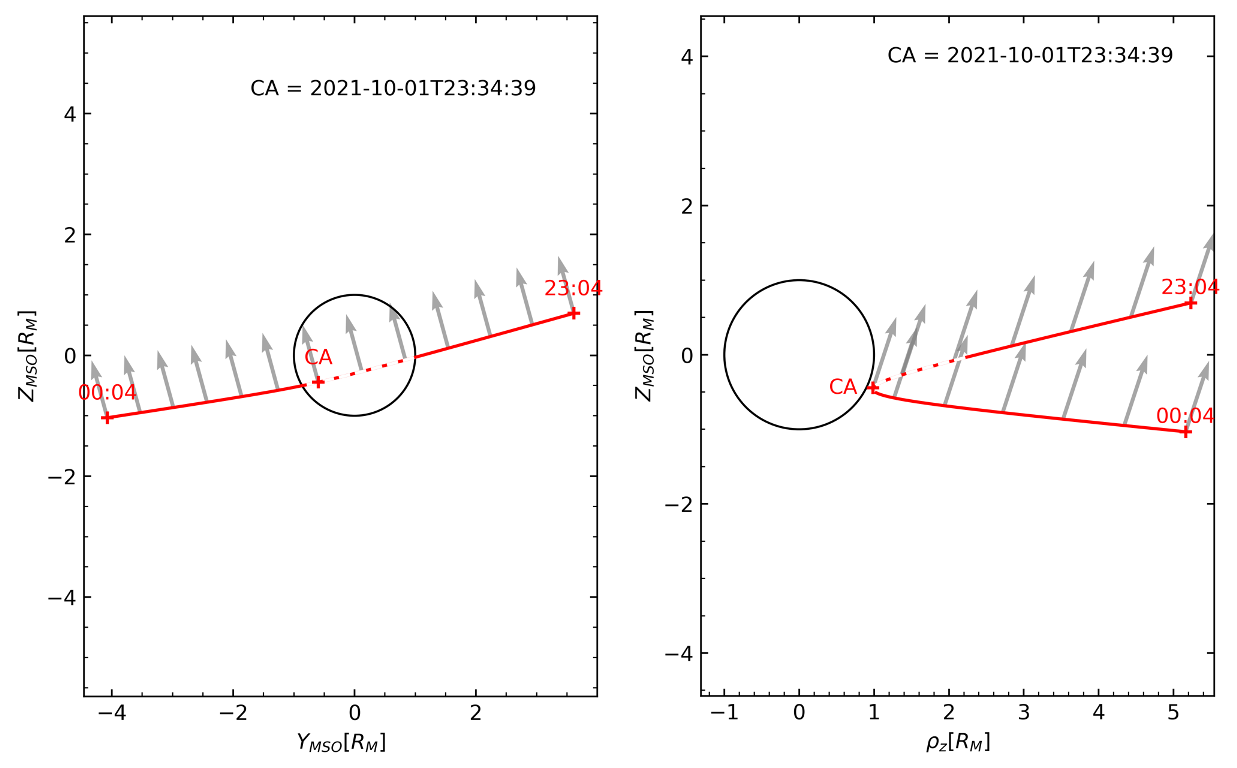
Fig1: BepiColombo first Mercury's flyby as seen from the Sun (left panel) and in a Z-ρz plane in the MSO frame (right panel), where ![]() . The black circle represents the planet, the red line represents BepiColombo’s trajectory (the shadow transit part is the dotted part) and the grey arrows represent PHEBUS pointing direction.
. The black circle represents the planet, the red line represents BepiColombo’s trajectory (the shadow transit part is the dotted part) and the grey arrows represent PHEBUS pointing direction.
The count rate as a function of time from the visible detectors clearly indicate the observation geometry of the flyby, the transit in the shadow of Mercury in particular, and the maximum of the emission on the dayside after the CA (Fig2). We also notice peaks on top of the general emission profile that take place on the morning side. These peaks occur on both detectors over the same period of 8 seconds. They may be related to dust particles or the crossing of magnetospheric structures. We can also note a different level of dark at the beginning and the end of the observation on c404. We cannot affirm the same for c422, since the observation did not last long enough and we still observe exospheric calcium at the end. However, the two signals seem similar: c404 signal could be due to Ca contamination or could be the detection of Mn (emission line at 403.1 nm). As a reminder, potassium has not been observed by Messenger at this wavelength (Vervack et al., 2016).

Fig. 2 c422 (blue) and c404 (orange) count rate as a function of time. The gray dashed area corresponds to BepiColombo being in the shadow of Mercury, the solid grey line represents the CA time and the red dotted line corresponds to the level of dark on c404 at the beginning of the observation.
We correct the data for different contributions: dark current, zodiacal light and stars present in PHEBUS Field of View (FoV). We then model the c422 signal by removing the peaks and applying a median filter. The corrected signal is then converted to radiance, units of Rayleigh (Fig3). One Rayleigh corresponds to 106/4π photons.cm-2.s-1.sr-1. We consider the solid angle (units of sr) related to the pre-slit computed on ground and the effective area (units of cm2), calibrated in flight.
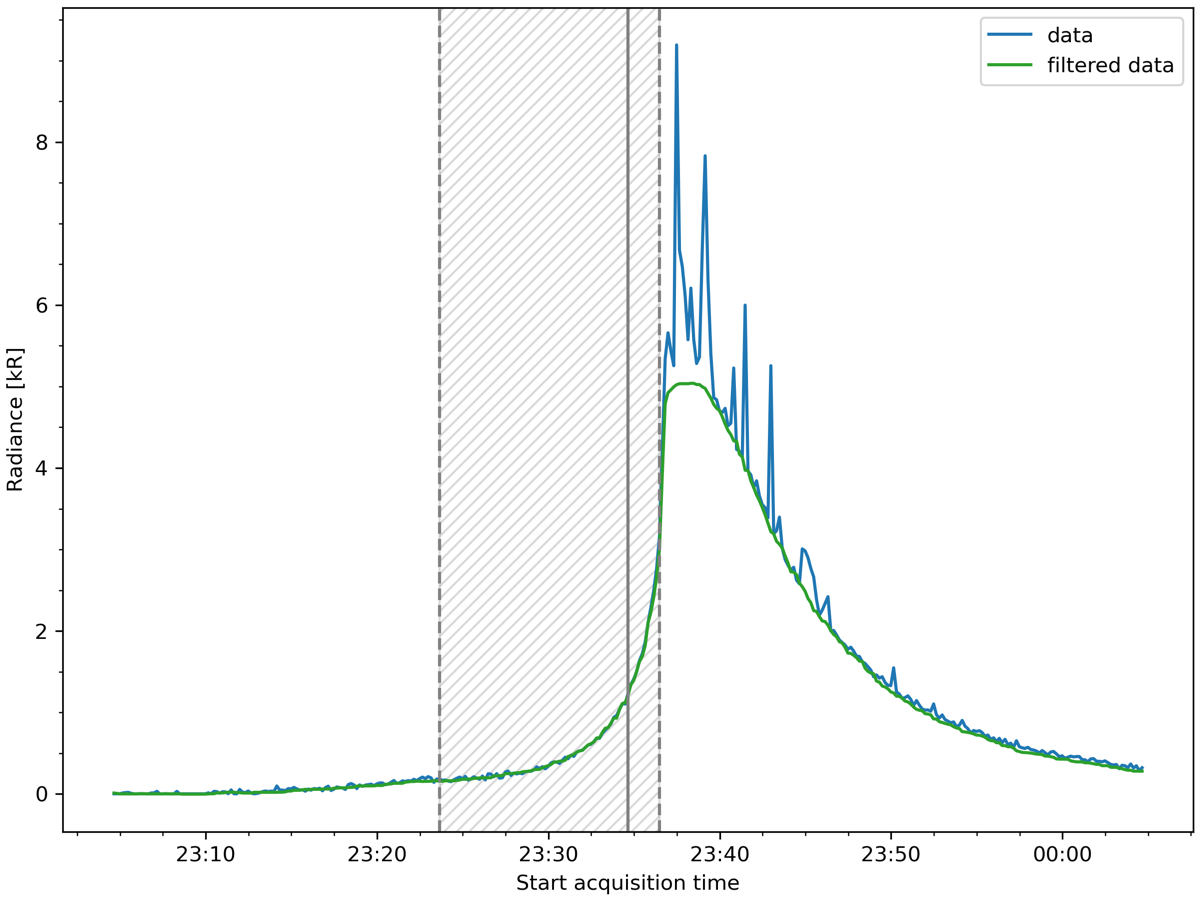
Fig. 3 Ca radiance as a function of time, the blue curve represents the data while the green curve represents the filtered data.
We then consider the data on the dawn side and apply an exponential fit I = I0 e-z/h, where r is the tangent altitude of PHEBUS line of sight above the surface, I0 the radiance at the surface and h is the e-folding scale height (Fig4). The best fit found indicates two different populations with two scale heights: 2 180 km when close to the surface and 8 300 km when farther from the surface of Mercury. Our results differ slightly from those of Burger et al. (2012) (1 840 ±140 km and 1 700 ± 200 km at the north and south poles, respectively) but the observation geometries were different.
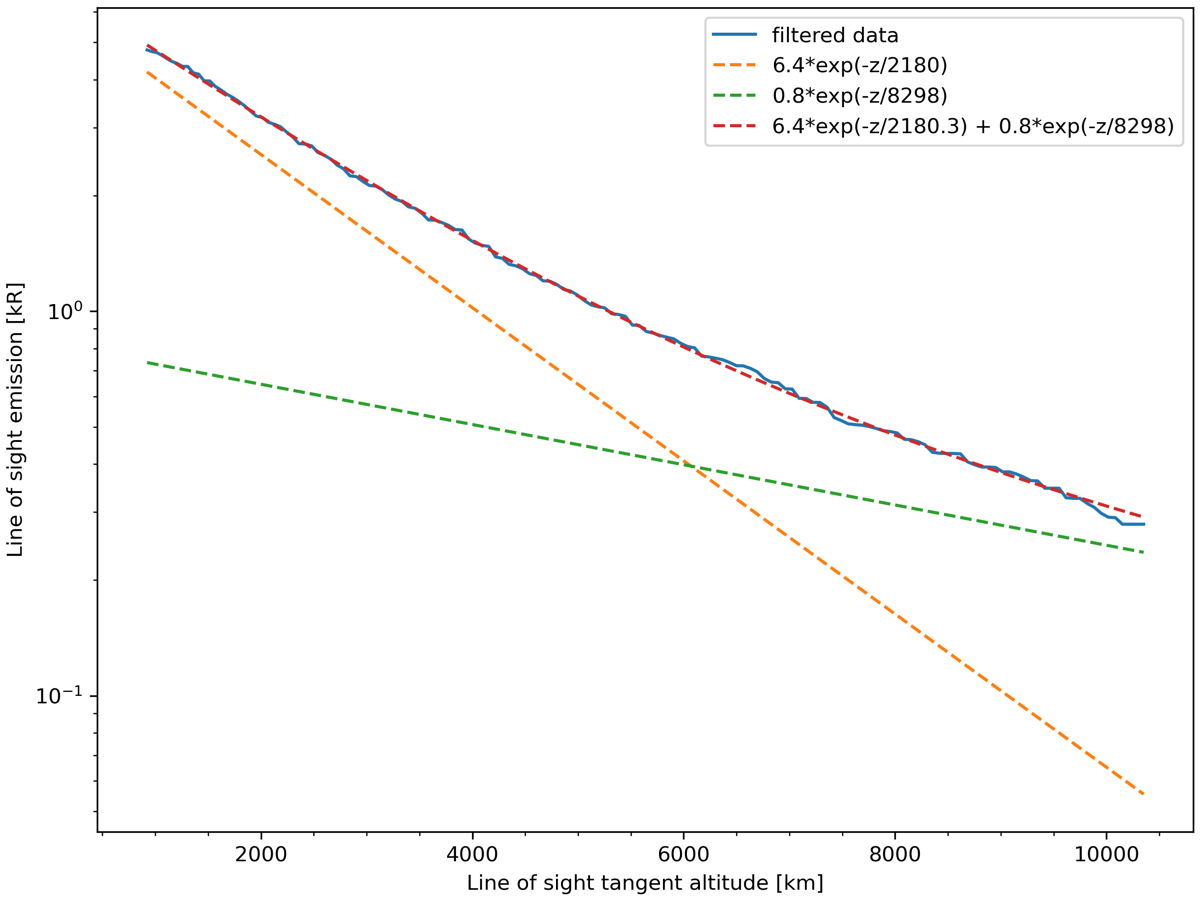
Fig. 4 Emission of Ca on dawn side. Exponential fits to the data are shown by the dashed lines. In the exponential fits, z=r-RM where r is the distance from Mercury's center and RM is Mercury's radius.
Finally, we compare our results with a 3D exospheric model (Chaufray et al., 2022) which comes from simulations that reproduce the MESSENGER observations on the morning side (Burger et al., 2012, 2014; Merkel et al., 2017, 2018). We computed the g-value corresponding to the geometry of this flyby (i.e. true anomaly angle q = 263° and heliocentric distance r = 0.281 AU) from the solar flux of Killen et al. (2009). The difference between the model and the data (Fig5) is also observed for other species (e.g., He).
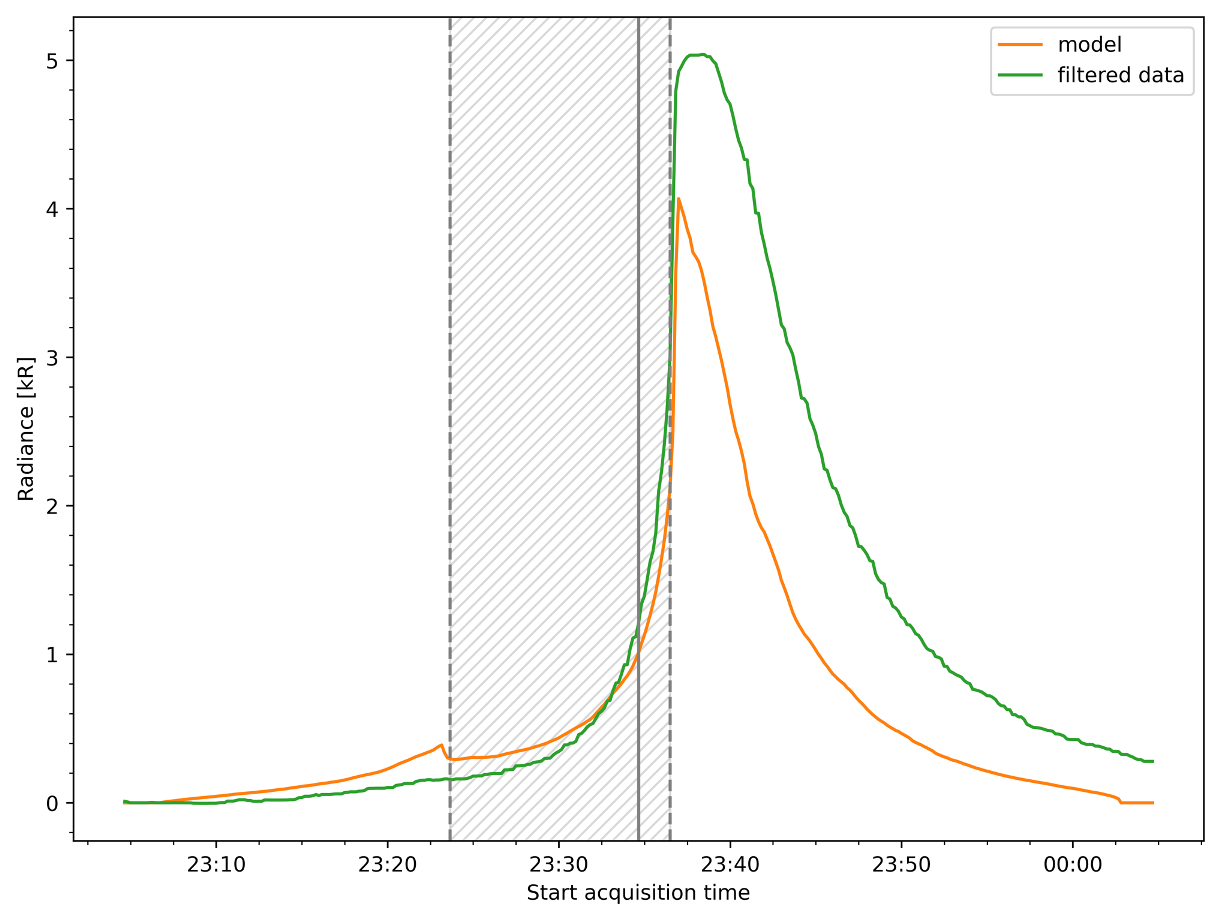
Fig. 5 Comparison of the filtered data (green) and an exospheric model (orange) for the Ca radiance as a function of time.
To conclude, the first flyby has allowed the detection of calcium and potentially manganese. Two different high energy source processes seem to be at the origin of the calcium. The difference with the 3D exospheric model is to be explained. Finally, the origin of the surprising emission bursts on the morning side is still under investigation.
References:
- Burger et al., Icarus 238, 51–58, 2012;
- Burger et al., JGR Planets 117, 2012;
- Chaufray et al., Icarus 115081, 2022;
- Killen et al., ApJS 181, 351-359, 2009;
- Merkel et al., Icarus 281, 46-54, 2017;
- Merkel et al. GRL 45, 6790-6797, 2018;
- Vervack et al., GRL 43, 11-545, 2016.
How to cite: Robidel, R., Quemerais, E., Koutroumpa, D., Chaufray, J.-Y., and Leblanc, F.: Observation of Mercury's Exopshere with the Visible Channels of PHEBUS during BEPICOLOMBO First Mercury's Flyby, Europlanet Science Congress 2022, Granada, Spain, 18–23 Sep 2022, EPSC2022-123, https://doi.org/10.5194/epsc2022-123, 2022.