Europlanet Science Congress 2022
Palacio de Congresos de Granada, Spain
18 – 23 September 2022
Europlanet Science Congress 2022
Palacio de Congresos de Granada, Spain
18 September – 23 September 2022
TP1
Mercury Science and Exploration

TP1

Mercury Science and Exploration
Co-organized by MITM
Convener: Jack Wright | Co-conveners: Joe Zender, Johannes Benkhoff, Go Murakami, Lina Hadid, Noah Jäggi, Beatriz Sanchez-Cano, Willi Exner, Joana S. Oliveira, Alice Lucchetti, Anna Milillo, Valeria Mangano
Orals
| Mon, 19 Sep, 10:00–11:30 (CEST), 15:30–18:30 (CEST)|Room Machado
Posters
| Attendance Mon, 19 Sep, 18:45–20:15 (CEST) | Display Mon, 19 Sep, 08:30–Wed, 21 Sep, 11:00|Poster area Level 1

Session assets

Discussion on Slack

Orals: Mon, 19 Sep | Room Machado

Chairpersons: Joana S. Oliveira, Joe Zender
BepiColombo
10:00–10:10
|
EPSC2022-78
Johannes Benkhoff and Go Murakami

BepiColombo has finished more than 50% of its about seven year-long cruise-phase. Launched on 20 October 2018 from the European spaceport Kourou in French Guyana it has successfully performed several flybys ( at Earth, twice at Venus and Mercury). BepiColombo with its state of the art and very comprehensive payload will perform measurements to increase our knowledge on the fundamental questions about Mercury’s evolution, composition, interior, magnetosphere, and exosphere. BepiColombo consists of two orbiters, the Mercury Planetary Orbiter (MPO) and the Mercury Magnetospheric Orbiter (Mio) and is a joint project between the European Space Agency (ESA) and the Japanese Aerospace Exploration Agency (JAXA).

Since the two spacecraft are in a stacked configuration during the cruise only some of the instruments will perform scientific observations. Mio and MPO are connected to each on-top of the Mercury Transfer Module (MTM). The MTM contains a solar electric propulsion engine and will bring the two spacecraft to Mercury. In late 2025, this ‘stack’ configuration is abandoned, the MTM will be jettisoned, and the individual elements spacecraft are brought into their final Mercury orbit: 480x1500km for MPO, and 590x11640km for Mio.  

Despite the reduced instrument availability, scientific and engineering operations has been scheduled during the cruise phase, especially during the swing-bys. A status of the mission and instruments, science operations plan during cruise, and first results of measurements taken in the first four years since launch will be given.

How to cite: Benkhoff, J. and Murakami, G.: BepiColombo on its cruise to Mercury – first results and mission status, Europlanet Science Congress 2022, Granada, Spain, 18–23 Sep 2022, EPSC2022-78, https://doi.org/10.5194/epsc2022-78, 2022.

10:10–10:25
|
EPSC2022-1260
|
ECP
|
solicited
|
MI
Umberto De Filippis, Carlo Lefevre, David Lucchesi, Marco Lucente, Carmelo Magnafico, Roberto Peron, and Francesco Santoli

ISA (Italian Spring Accelerometer) is a scientific payload of the Mercury Planetary Orbiter (MPO) module of the ESA/JAXA BepiColombo mission to planet Mercury and it is the first high-sensitivity accelerometer on-board an interplanetary spacecraft. It will be one of the key instruments to perform Radio Science Experiments during the orbital phase. The instrument is sensitive to any acceleration, greater than 10-8 ms-2Hz-1/2, perturbing the free fall of the spacecraft in the overall gravity field. The main goal of ISA is indeed to measure the so-called Non Gravitational Perturbations (NGP) allowing to reconstruct, a posteriori, the motion of the spacecraft on a geodesic of spacetime. During the first Mercury flyby, performed in October 2021, the spacecraft approached the target planet reaching an altitude above its surface of only 200 km. Thanks to this very low altitude and to the ISA on-board position in cruise configuration, far away from the center of mass of the overall composite spacecraft, the accelerometer has been able to clearly detect the gravity gradient accelerations. Indeed, this is the first direct measurement of the gravity gradient acceleration induced on a spacecraft by the gravity field of a celestial object different from the Earth. Near the closest approach to the planet, the spacecraft entered in eclipse, losing the effect of the solar radiation pressure acting on its surfaces exposed to the Sun. As a consequence, a sudden change of the acceleration was clearly detected by the accelerometer; the measured signal has a magnitude aligned with the expectations, computed considering optical coefficients and spacecraft attitude. In June 2022, BepiColombo will carry out a second flyby that will be very similar, in terms of altitude, attitude and B-plane coordinates, to the first one, representing an almost unique opportunity to compare two similar measurements.

How to cite: De Filippis, U., Lefevre, C., Lucchesi, D., Lucente, M., Magnafico, C., Peron, R., and Santoli, F.: First NGP measurements at Mercury, Europlanet Science Congress 2022, Granada, Spain, 18–23 Sep 2022, EPSC2022-1260, https://doi.org/10.5194/epsc2022-1260, 2022.

10:25–10:35
|
EPSC2022-353
Giovanni Munaretto, Gabriele Cremonese, Emanuele Simioni, Alice Lucchetti, Maurizio Pajola, and Matteo Massironi

Introduction: The physical properties of a particulate surface, like roughness, grain size, shape and transparency affect how it reflects the incoming light. This concept is used in planetary photometry to infer the surface properties of a celestial object from multiple observations taken from different directions and solar illumination (Hapke et al. 2012). Models linking the observed surface brightness with parameters related to physical properties of the surface have been established. The estimation of such parameters is referred as photometric modelling (Domingue et al., 2016). On Mercury, this technique has been employed to construct monochrome and color global mosaics, but it was never applied to investigate local surface features (Domingue et al., 2016). Therefore, the photometric modelling of Mercury’s surface features represents a novel and useful tool to investigate their nature. In addition, the identification of high-performance photometric models of any given surface material over multiple wavelengths enables to accurately predict the amount of reflected sunlight that will be observed through remote cameras and spectrometers.

In this abstract, we first describe our modelling approach, discuss its improvement with respect to current available photometric models of Mercury, and present a few science cases in which it has been applied. Then, we will also show how this methodology is being applied for the calibration of SIMBIO-SYS observations that will be acquired during the Mercury Orbit Insertion (MOI) phase of the mission.

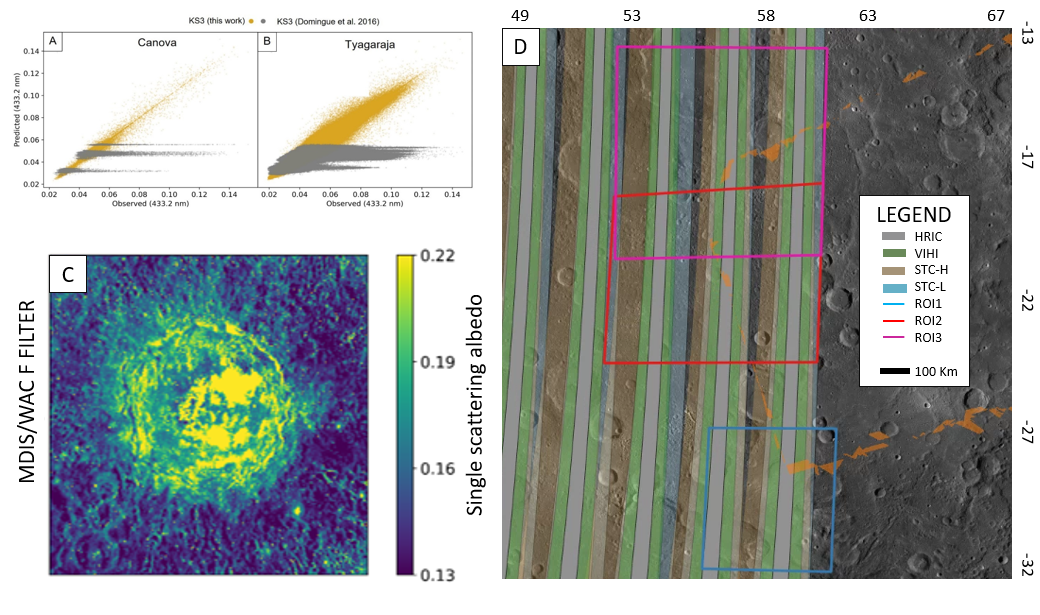
Methodology: we first analyze the Tyagaraja and Canova craters hollows (i.e., tens meters to several km-sized shallow, irregular, flat‐floored depressions characterized by bright interiors and haloes, Blewett et al., 2011), which are covered by multiple overlapping 8 filter MDIS/WAC (Hawkins et al., 2007) images with resolution higher than 665 m/px and phase angles from 30° to > 100°.  Over this region, we construct a latitude-longitude sampling grid with 665 m spacing. For each point we retrieve the surface reflectance and the solar illumination and observation angles using the 3D information of the global USGS DTM and the spacecraft and Sun position information within the observation SPICE kernels. This dataset is fitted with the Hapke and Kaasalainen-Shkuratov photometric models and estimates of their parameter are obtained for each point of the grid (see for example Fig 1C).

Results

Modelling performance: Our results suggest that photometric models derived from the inversion of multiple, overlapping observations are more accurate, especially for bright targets, rather than global photometric models of Mercury (Fig 1A,B). Overall, we estimate a modelling accuracy of better than 10% at 3σ, comparable with the radiometric noise level of the observations.

Hollows results: Our results suggest that hollows are more backscattering than the floor of the crater in which they form. This is consistent with hollows being made of a material rich in holes and/or vescicles, in agreement with a formation by devolatilization. In addition, we find that they are smoother than the crater floor, consistently with the emplacement of a fine particles halo during hollow growth.

Figure 1. Modeled vs Observed reflectance obtained with our KS3 model (gold) and the global one for Mercury for Canova (A) and Tyagaraja (B) craters. C) Example of Hapke single scattering albedo map of Tyagaraja crater. D) MOI SIMBIO-SYS footprints and the Regions of Interests (ROI) that are being analyzed for the cross-calibration of the three channels.

Cross calibration of the SIMBIO-SYS channels: SIMBIO-SYS is a suite of three instruments, a high-resolution imager (HRIC), a stereocamera (STC) and a spectrometer (VIHI). Because of the dual-spacecraft configuration of BepiColombo, standard star observations with SIMBIO-SYS are not feasible until the satellite will be in its nominal orbit around Mercury. It is therefore pivotal to identify regions on the surface of Mercury with well-defined spectrophotometric properties that can be used as ground truth for the initial cross calibration of the three channels, prior to standard stars observations. Such regions will be also used to verify the integration times before the planning of the Global Mapping phase and to characterize the instrument straylight and pixel response non uniformity. The ROI will be observed during the Mercury Orbit Insertion (MOI) orbits where no standard stars pointing are still allowed. Therefore, we applied our methodology to identify ROIs within these orbits that currently have at least 5 MDIS/WAC observations, phase angles > 110° and resolutions higher than 665 m/px (Fig 1D). The retrieved photometric models for these regions will be used to determine accurate spectra (at the MDIS/WAC wavelengths) that will be interpolated within the SIMBIO-SYS photometric system and used to cross-calibrate the three channels of the instrument.

Discussion

Our analysis shows that overlapping multiangular MDIS/WAC observations can be used to invert local photometric models of the surface. This approach allowed us to initially study and characterize the scattering properties of hollows, finding that they are smoother and more back-scattering than the crater floors. This is consistent with hollows being formed by a volatile-release mechanism and emplacement of a halo of fine particles. We also found that this modelling approach is more accurate, in particular for high reflectance, than current global photometric models of Mercury. This led us to apply our methodology to selected locations that will be observed by SIMBIO-SYS during the MOI phase, and that will be used for absolute calibration of its three channels. More details will be presented at the conference.

Acknowledgments and Data

We gratefully acknowledge funding from the Italian Space Agency (ASI) under ASI-INAF agreement 2017- 47-H.0.


How to cite: Munaretto, G., Cremonese, G., Simioni, E., Lucchetti, A., Pajola, M., and Massironi, M.: Photometric modelling of MESSENGER/MDIS observations: science results and implications for the calibration of SIMBIO-SYS on BepiColombo, Europlanet Science Congress 2022, Granada, Spain, 18–23 Sep 2022, EPSC2022-353, https://doi.org/10.5194/epsc2022-353, 2022.

10:35–10:45
|
EPSC2022-123
|
ECP
Rozenn Robidel, Eric Quemerais, Dimitra Koutroumpa, Jean-Yves Chaufray, and François Leblanc

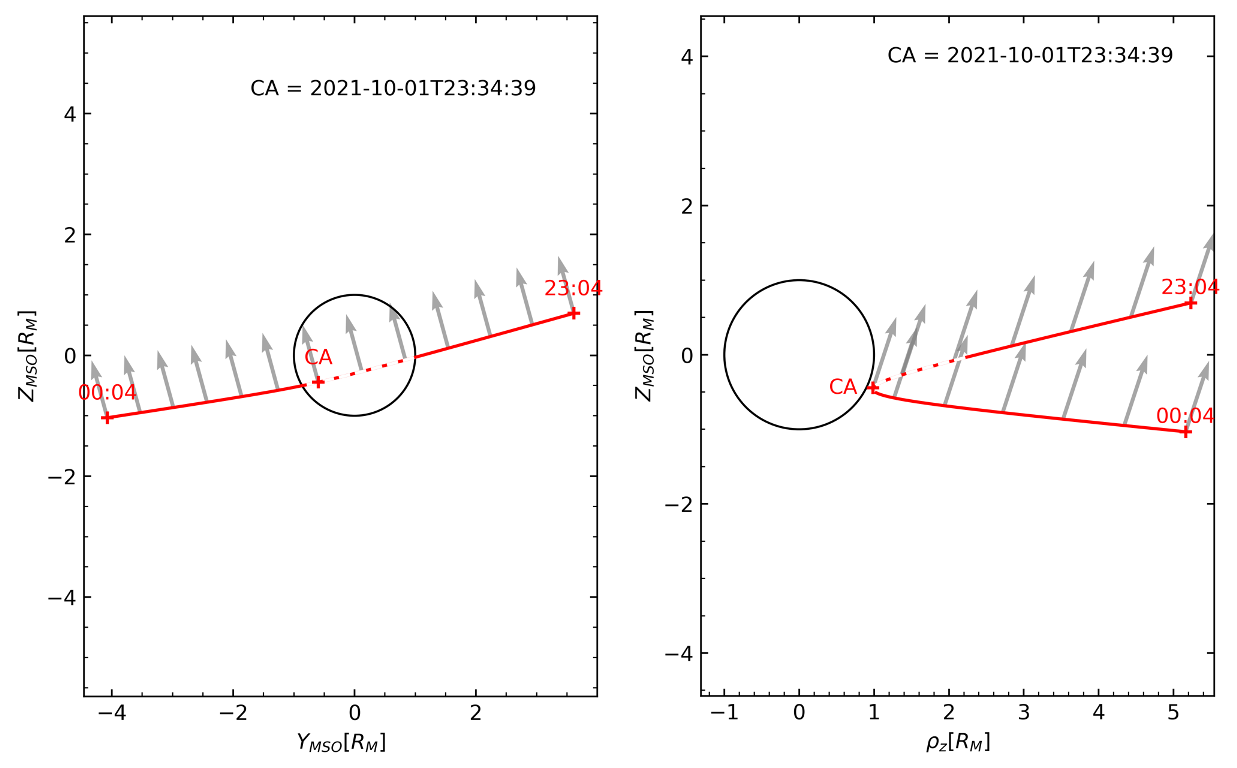
The first flyby of Mercury with BepiColombo (ESA/JAXA joint mission) took place on October 1, 2021. PHEBUS (Probing of Hermean Exosphere By UltraViolet Spectroscopy) was able to observe during this flyby with its EUV detector (Extreme UltraViolet, spectral range 55-155 nm) and its visible channels, one centered on 404 nm (K emission line) and the other centered on 422 nm (Ca emission line). We will refer to the channel dedicated to potassium as c404 and the channel dedicated to calcium as c422. The observation started 30 minutes before the Closest Approach (CA) and lasted one hour, with the line of sight directed to the North and slightly anti-sunwards (Fig1). The slit was removed and the acquisitions were made every 10 seconds with an exposure time of 8 seconds.

Fig1: BepiColombo first Mercury's flyby as seen from the Sun (left panel) and in a Z-ρz plane in the MSO frame (right panel), where . The black circle represents the planet, the red line represents BepiColombo’s trajectory (the shadow transit part is the dotted part) and the grey arrows represent PHEBUS pointing direction.


The count rate as a function of time from the visible detectors clearly indicate the observation geometry of the flyby, the transit in the shadow of Mercury in particular, and the maximum of the emission on the dayside after the CA (Fig2). We also notice peaks on top of the general emission profile that take place on the morning side. These peaks occur on both detectors over the same period of 8 seconds.  They may be related to dust particles or the crossing of magnetospheric structures. We can also note a different level of dark at the beginning and the end of the observation on c404. We cannot affirm the same for c422, since the observation did not last long enough and we still observe exospheric calcium at the end. However, the two signals seem similar: c404 signal could be due to Ca contamination or could be the detection of Mn (emission line at 403.1 nm). As a reminder, potassium has not been observed by Messenger at this wavelength (Vervack et al., 2016).

Fig. 2 c422 (blue) and c404 (orange) count rate as a function of time. The gray dashed area corresponds to BepiColombo being in the shadow of Mercury, the solid grey line represents the CA time and the red dotted line corresponds to the level of dark on c404 at the beginning of the observation.


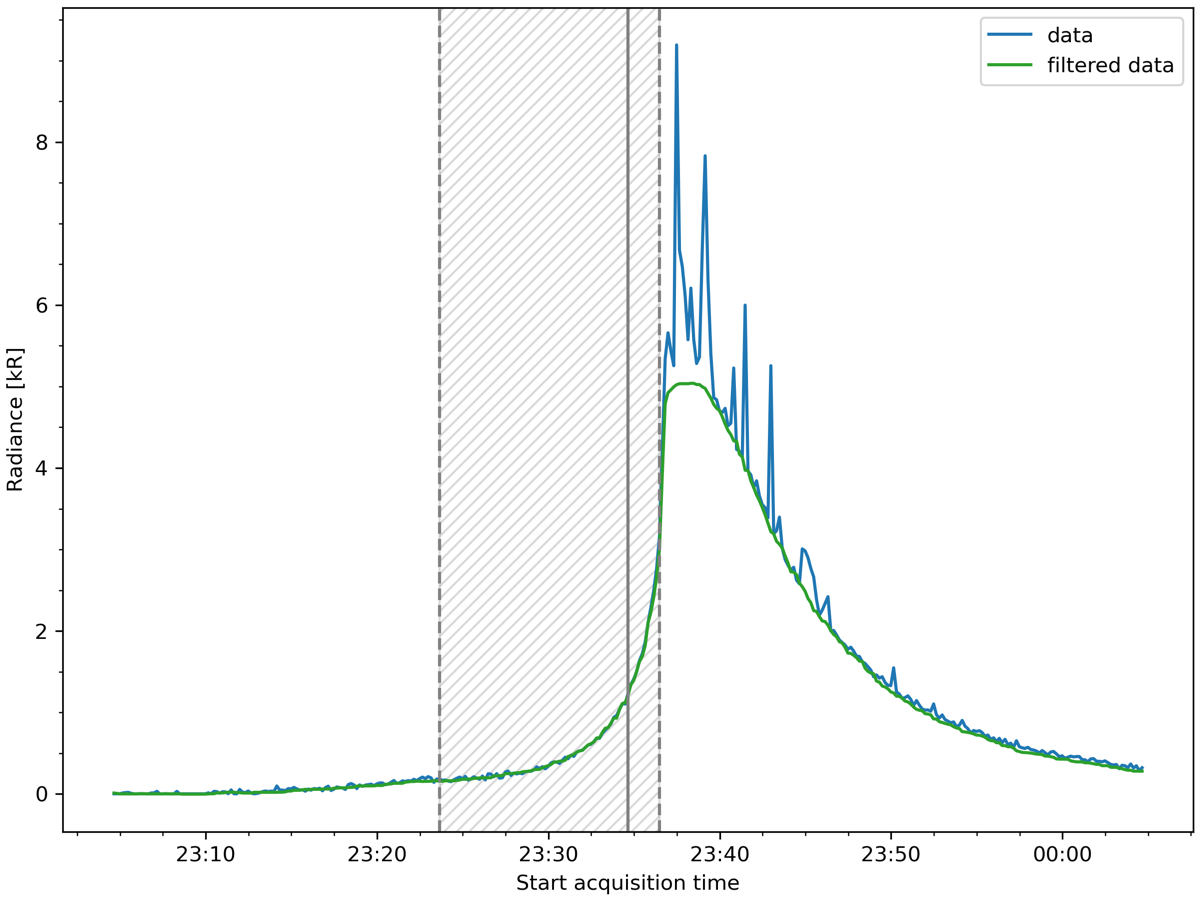
We correct the data for different contributions: dark current, zodiacal light and stars present in PHEBUS Field of View (FoV). We then model the c422 signal by removing the peaks and applying a median filter. The corrected signal is then converted to radiance, units of Rayleigh (Fig3). One Rayleigh corresponds to 106/4π photons.cm-2.s-1.sr-1. We consider the solid angle (units of sr) related to the pre-slit computed on ground and the effective area (units of cm2), calibrated in flight.

Fig. 3 Ca radiance as a function of time, the blue curve represents the data while the green curve represents the filtered data.


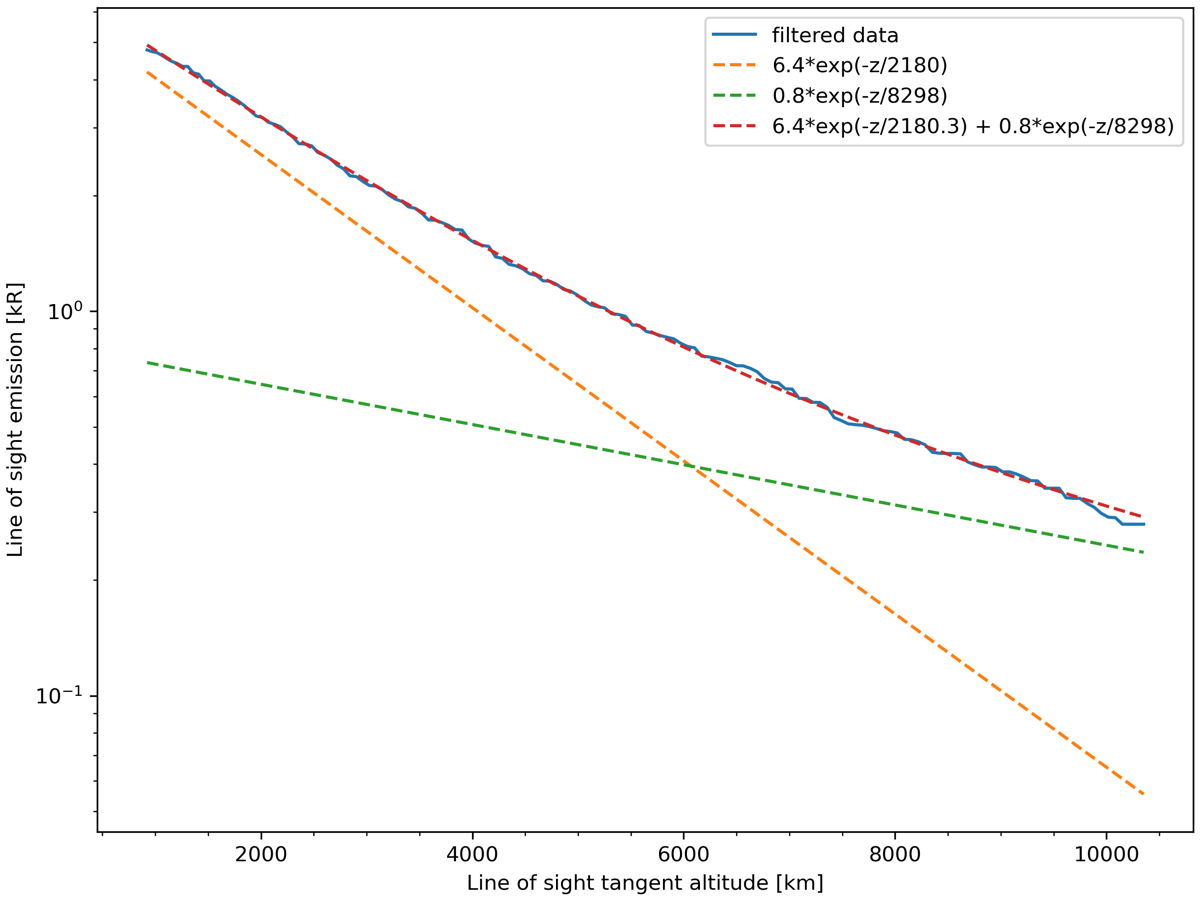
We then consider the data on the dawn side and apply an exponential fit I = I0 e-z/h, where r is the tangent altitude of PHEBUS line of sight above the surface, I0 the radiance at the surface and h is the e-folding scale height (Fig4). The best fit found indicates two different populations with two scale heights: 2 180 km when close to the surface and 8 300 km when farther from the surface of Mercury. Our results differ slightly from those of Burger et al. (2012) (1 840 ±140 km and 1 700 ± 200 km at the north and south poles, respectively) but the observation geometries were different.

Fig. 4 Emission of Ca on dawn side. Exponential fits to the data are shown by the dashed lines. In the exponential fits, z=r-RM where r is the distance from Mercury's center and RM is Mercury's radius.


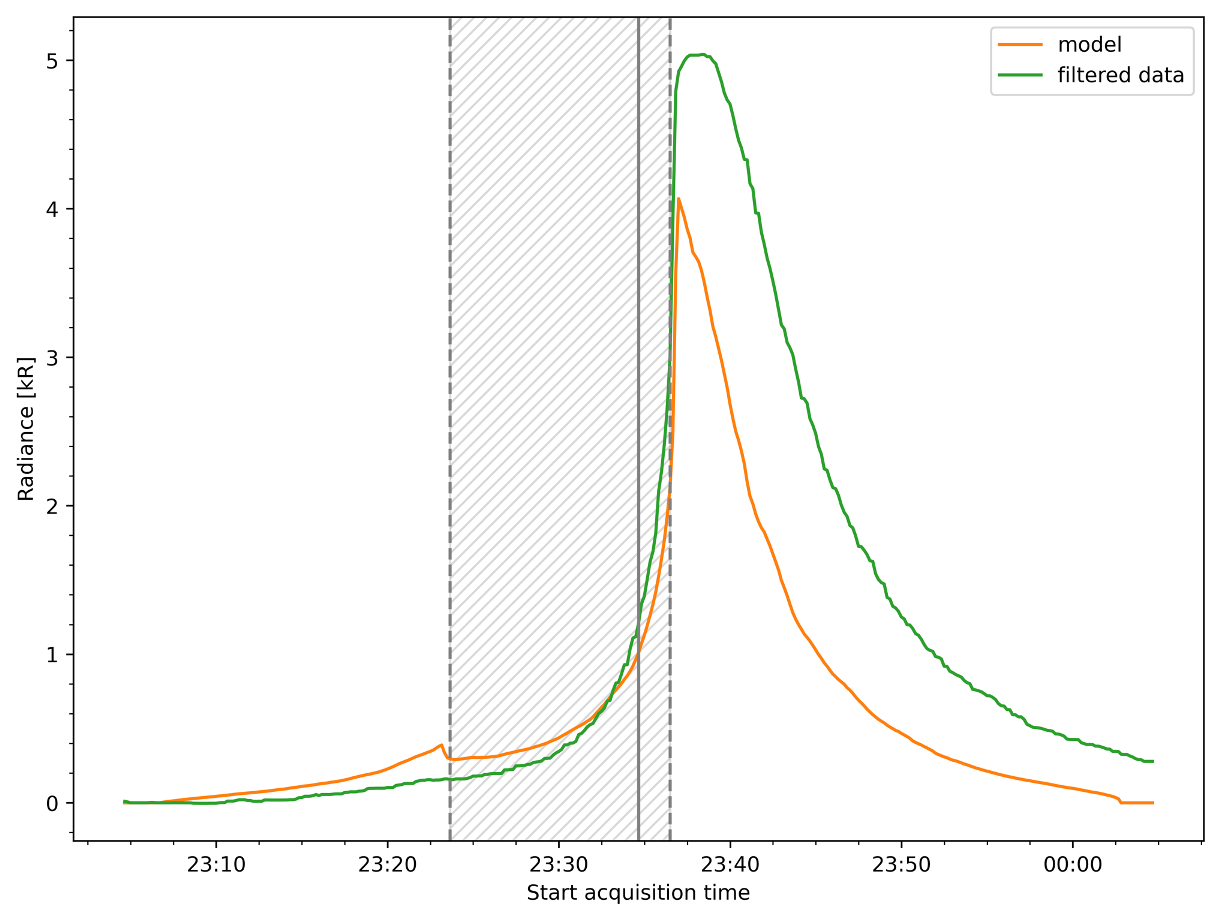
Finally, we compare our results with a 3D exospheric model (Chaufray et al., 2022) which comes from simulations that reproduce the MESSENGER observations on the morning side (Burger et al., 2012, 2014; Merkel et al., 2017, 2018). We computed the g-value corresponding to the geometry of this flyby (i.e. true anomaly angle q = 263° and heliocentric distance r = 0.281 AU) from the solar flux of Killen et al. (2009). The difference between the model and the data (Fig5) is also observed for other species (e.g., He).

Fig. 5 Comparison of the filtered data (green) and an exospheric model (orange) for the Ca radiance as a function of time.


To conclude, the first flyby has allowed the detection of calcium and potentially manganese. Two different high energy source processes seem to be at the origin of the calcium. The difference with the 3D exospheric model is to be explained. Finally, the origin of the surprising emission bursts on the morning side is still under investigation.


References:

  • Burger et al., Icarus 238, 51–58, 2012;
  • Burger et al., JGR Planets 117, 2012;
  • Chaufray et al., Icarus 115081, 2022;
  • Killen et al., ApJS 181, 351-359, 2009;
  • Merkel et al., Icarus 281, 46-54, 2017;
  • Merkel et al. GRL 45, 6790-6797, 2018;
  • Vervack et al., GRL 43, 11-545, 2016.

How to cite: Robidel, R., Quemerais, E., Koutroumpa, D., Chaufray, J.-Y., and Leblanc, F.: Observation of Mercury's Exopshere with the Visible Channels of PHEBUS during BEPICOLOMBO First Mercury's Flyby, Europlanet Science Congress 2022, Granada, Spain, 18–23 Sep 2022, EPSC2022-123, https://doi.org/10.5194/epsc2022-123, 2022.

10:45–10:55
|
EPSC2022-264
|
ECP
Carlota Cardoso, Marco Pinto, Patrícia Gonçalves, Beatriz Sanchez-Cano, Richard Moissl, Rami Vainio, Philipp Oleynik, Johannes Benkhoff, Pedro Assis, Arto Lehtolainen, Manuel Grande, Go Murakami, Wojciech Hajdas, and Arlindo Marques

December 2019 marked the beginning of Solar Cycle 25. Since then, the Sun´s activity has been ramping up with multiple Coronal Mass Ejections (CMEs), Solar Flares, and Solar Energetic Particle (SEP) events having been registered in the past few years. These events are extremely hazardous to both spacecraft and biological systems. However, due to the lack of multi-point measurements, it is still impossible to predict their occurrence and to accurately model their propagation.

BepiColombo, the first European mission to the Hermean System, was launched in 2018 and is predicted to enter Mercury’s orbit in 2025. It is composed of two spacecraft, ESA’s Mercury Planetary Orbiter (MPO) and JAXA’s Mercury Magnetospheric Orbiter (nicknamed Mio). Given the mission´s close proximity to the Sun, reaching 0.3 AU at multiple points of its trajectory, BepiColombo will provide critical measurements to characterize and model Solar Events. While BepiColombo carries a plethora of scientific instruments, most of them are turned-off during a large part of the cruise phase. However, the BepiColombo Environment Radiation Monitor (BERM) aboard the MPO, is always operational since it is part of the mission´s housekeeping, with the objetive of monitoring radiation hazards so they can be managed in order to prevent possible damage on the spacecraft and instruments. Being in operation during all phases of the mission allows it to detect and characterize SEP events, even when other instruments are switched off.  

BERM is based on standard silicon stack detectors. It consists of a single telescope stack with 11 Silicon detectors interleaved by aluminum and tantalum absorbers. It can detect electrons with energies from ~0.1 to ~10 MeV, protons with energies from ~1 MeV to ~200 MeV, and heavy ions with a Linear Energy Transfer from 1 to 50 MeV/mg/cm2. Particle species and energies are determined by the track and signal registered in the stack. Because of the limited bandwidth, particle events are processed in-flight before being sent to Earth. Particles are assigned to 18 channels, five are dedicated to electrons, eight to protons, and five to heavy ions. BERM provides daily files with the number of registered counts in each channel integrated over 30 seconds sampling intervals.  To provide useful information for scientists, BERM data must be converted into physical units.

This work presents the results of applying the bow-tie method, first introduced by Van Allen in 1979, to obtain the fluxes from BERM’s count rates. assuming a power law for the electron and proton spectra. The method considers energy spectra with a range of power-law indices and finds the effective energy measured by each channel and its corresponding geometric factor.  We have used this method to analyze the data collected by BERM during the Earth flyby of BepiColombo.  We apply the bow tie method to estimate the fluxes of particles during the already detected solar events. So far, two events are worthy of special attention.

During the event on April 17th, 2021, BERM and the Solar Intensity X-ray and Particle Spectrometer (SIXS) instrument were simultaneously operating onboard BepiColombo. The particle detector of SIXS (SIXS-P) can measure electrons from approximately 50 keV to 3 MeV and protons from 1 to 30 MeV. The two instruments measure overlapping particle energy ranges, which allows for validating the results of bow tie analysis of BERM particle channels.

The second event of interest happened on February 16th, 2022. It exhibited fluxes of such high energies that all 8 proton bins registered a signal above the noise levels strong enough to be analyzed.

Results for other events will also be shown.

How to cite: Cardoso, C., Pinto, M., Gonçalves, P., Sanchez-Cano, B., Moissl, R., Vainio, R., Oleynik, P., Benkhoff, J., Assis, P., Lehtolainen, A., Grande, M., Murakami, G., Hajdas, W., and Marques, A.: First Analysis of Solar Energetic Particles with the BepiColombo Radiation Monitor (BERM), Europlanet Science Congress 2022, Granada, Spain, 18–23 Sep 2022, EPSC2022-264, https://doi.org/10.5194/epsc2022-264, 2022.

Interior
10:55–11:10
|
EPSC2022-1250
|
ECP
|
solicited
|
MI
Jurrien Knibbe

One-dimensional parametrized planetary thermal evolution models are often used for computation of many thermal evolution schemes of a planet, as convenient alternative for computationally expensive thermal evolution simulations that solve complex three-dimensional processes, such as convective motions. Such one-dimensional thermal evolution models for terrestrial objects are motivated mainly with a silicate-dominated object in mind (Venus, Earth, the Moon, and Mars), with a small relative size of the metallic core. Because a correspondingly thick mantle commonly remains convective for a long period of time, parametrized mantle evolution models focus primarily on capturing the convective state of the thick mantle. Additionally, the thermal profile of the metallic core is commonly simplified by an adiabat, or the core is treated as a thermal load situated below the mantle. For a small core, this assumption goes without loss of much accuracy even if the core may actually end up (partly) conductive. Because the assumptions of a convective mantle and fully adiabatic or small core seem to be inappropriate for Mercury, we are developing a parametrized thermal evolution model for Mercury with a mantle and core that turns into a (partially) conductive state. The model development takes strict conservation of energy as starting point, which is an additional minor improvement relative to most existing parametrized thermal evolution models. I will present an outline of the developed model, and discuss some challenges for future work.

How to cite: Knibbe, J.: Some technical challenges for parametrized one-dimensional thermal evolution models of Mercury, Europlanet Science Congress 2022, Granada, Spain, 18–23 Sep 2022, EPSC2022-1250, https://doi.org/10.5194/epsc2022-1250, 2022.

11:10–11:20
|
EPSC2022-829
|
ECP
Aymeric Fleury, Ana-Catalina Plesa, Nicola Tosi, Michaela Walterova, and Doris Breuer

Introduction

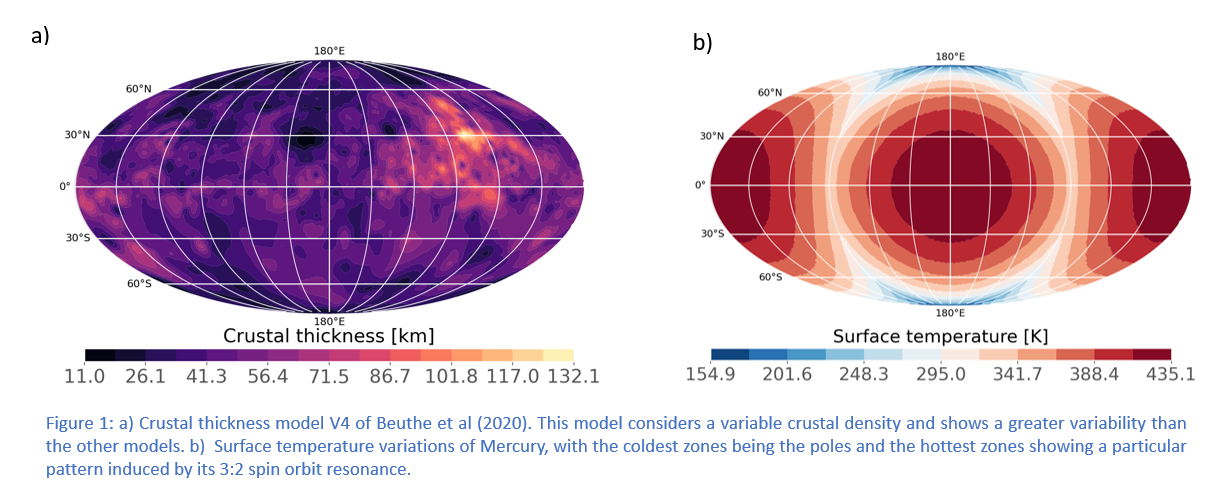
Because of its very low obliquity, Mercury experiences significant surface temperature variations between its polar region and its equatorial region (Margot et al., 2012). On the other hand, its atypical 3:2 spin-orbit resonance also leads to longitudinal temperature variations (Siegler et al 2013). The combination of these effects creates a peculiar surface temperature distribution with equatorial hot and warm poles, and cold poles at the geographic poles of the planet. Models that considered the insolation pattern were found compatible with the low-degree shape and geoid from MESSENGER (Tosi et al., 2015). The models of Tosi et al. (2015) showed that the insolation pattern imposes a long wavelength thermal perturbation throughout the mantle, whose temperature distribution is strongly correlated with  the surface temperature variations.

Lateral variations of the crustal thickness can also affect the temperature distribution of the lithosphere and mantle as it was suggested for Mars (Plesa et al., 2016, 2018). Crustal thickness models for Mercury have been calculated based on the MESSENGER gravity and topography data, and largely depend on the assumed density difference between the crust and mantle. Recently, Beuthe et al. (2020) proposed several crustal thickness models using either a constant crustal density or a variable one, as informed by the surface chemical composition and further assuming that the crustal composition does not change significantly with depth.

In this study, we investigate the effects of surface temperature and crustal thickness variations on the thermal evolution of the interior of Mercury. We compute the surface and CMB heat flux patterns, as well as that of  the elastic lithosphere thickness and compare our results to local elastic thickness estimates.

Model

We combine the geodynamical code GAIA (Hüttig et al., 2013) with the surface temperature variations and crustal thickness data similar to Plesa et al., (2016). All simulations are done in a full 3D spherical geometry, use the extended Boussinesq Approximation, and consider core cooling and radioactive decay. The pressure- and temperature-dependent viscosity follows an Arrhenius law of diffusion creep. 

We use a pressure- and temperature-dependent thermal expansivity and conductivity in the mantle (Tosi et al., 2013). The thermal conductivity of the crust is set to 1.73 W/m/K, a value based on a crustal conductivity of 2 W/m/K that additionally takes into account the effect of an insulating,  5-km-thick megaregolith layer.

The crust is enriched in heat producing elements (HPEs) by a factor λ compared to the primitive  mantle, for which we assume a chondritic HPE abundance. We test two crustal thickness models of Beuthe et al. (2020), namely model U0 with a homogeneous crustal density of 2957 kg/m3 and an average crustal thickness of 35 km, and model V4 (Fig. 1a) with a variable crustal density and an average crustal thickness of 45 km. 

Additionally, our models include surface temperature variations (Fig. 1b) following the model of Vasavada et al. (1999).

Results

We model the entire evolution of Mercury to determine the variations of core-mantle boundary and surface heat flux, as well as the elastic lithosphere thickness at different times. 

Our simulations show that the combined effect of surface temperature, crustal thickness variations and the enrichment of the crust in HPEs can significantly affect the CMB and surface heat flux as well as the elastic lithosphere thickness of Mercury. 

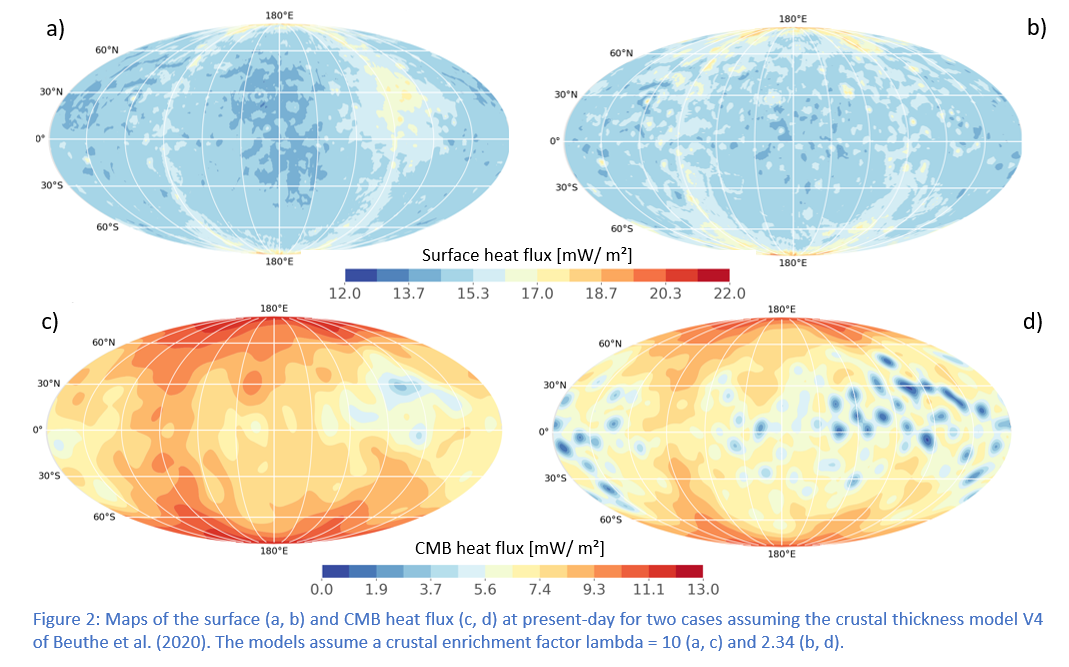
Fig. 2 shows the results of two simulations employing the V4 crustal model of Beuthe et al. (2020). Here we can observe both the effect of the surface temperature variations and of the crustal enrichment in HPEs on the surface and CMB heat flux Mercury at present day. The long-wavelength pattern of the heat flux follows the distribution of Mercury’s surface temperatures. Areas with a high heat flux correspond to the cold poles of Mercury, while smaller heat flux values are attained in the hot poles regions.  For a high crustal enrichment in HPEs, the high Mg region, which is characterized by a thick crust in the V4 crustal thickness model, becomes clearly visible (Fig 2a, c). In this case, we observe a clear anti-correlation between the CMB heat flux and the surface heat flux at around 30°N and 240°-330°E. 

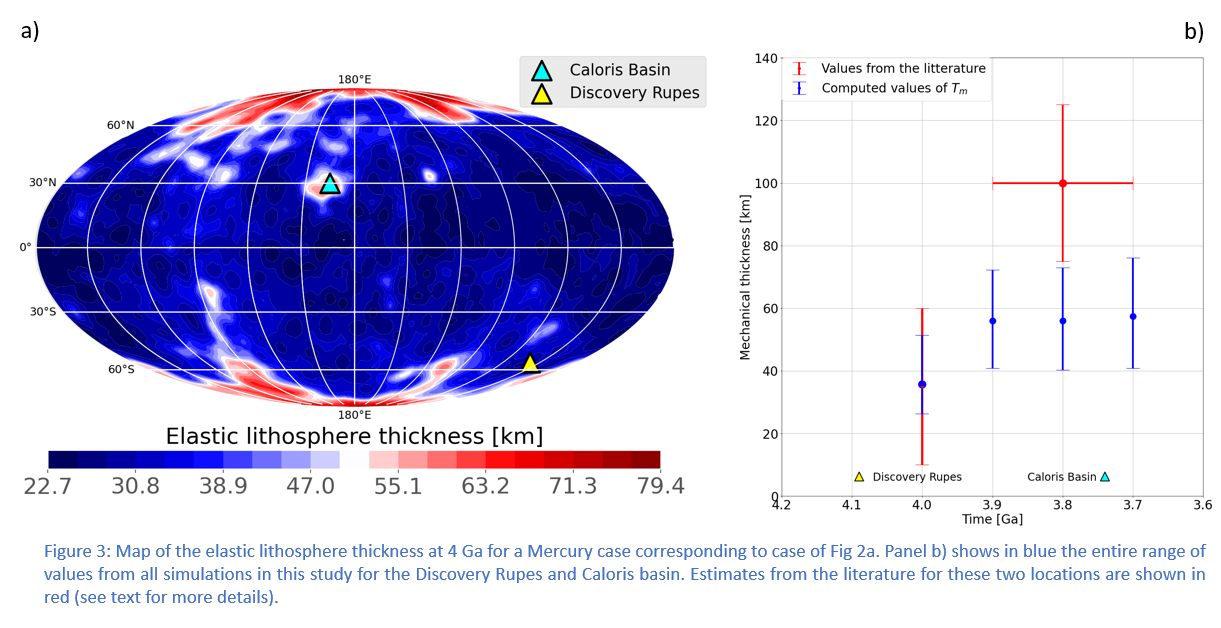
In addition to the surface and CMB heat fluxes, our models calculate local estimates of elastic lithosphere thickness between 4.0 and 3.8 Ga as in Tosi et al. (2015). Here we focus on two locations, i.e., Caloris basin and Discovery Rupes, for which elastic thickness estimates are available in the literature (Watters et al., 2002; Nimmo & Watters 2004; Phillips et al., 2018). Fig. 3a shows the elastic lithosphere thickness at 4 Ga obtained from one of our models and the location of the two estimates that were used here.  While model values show a good agreement with the literature estimates of the Discovery Rupes, they are smaller than the estimates available for the Caloris basin (Fig. 3b).

Discussion and conclusion

Our models show that the surface heat flux of Mercury is chiefly affected by its peculiar surface temperature distribution, but the crustal thickness pattern and the distribution of HPEs between the mantle and crust can introduce additional variations. Models show that elastic thickness values for Discovery Rupes are compatible with estimates from previous studies, while systematically lower values are obtained for Caloris basin. These discrepancies reflect uncertainties in elastic thickness estimates and model values, but also in the Caloris formation age. The latter is important to estimate time at which the elastic thickness estimates are representative for the thermal state of the lithosphere.

Future data from the BepiColombo mission (Benkhoff et al., 2021) will provide a better resolution for the gravity and topography of Mercury, as well measurements of its surface composition. This will help to improve our geodynamical models and in turn constrain Mercury’s thermal evolution. Furthermore, these data could be used to provide additional estimates of the elastic lithosphere thickness and the time of formation of the associated geological features that in turn can be used to constrain the thermal state of Mercury through time.

How to cite: Fleury, A., Plesa, A.-C., Tosi, N., Walterova, M., and Breuer, D.: Elastic Thickness and Heat Flux Variations on Mercury from Thermal Evolution Modeling, Europlanet Science Congress 2022, Granada, Spain, 18–23 Sep 2022, EPSC2022-829, https://doi.org/10.5194/epsc2022-829, 2022.

11:20–11:30
|
EPSC2022-929
Attilio Rivoldini, Marie-Hélène Deprost, Yue Zhao, Jurien Knibbe, and Tim Van Hoolst

The low intensity and lack of small-scale variations in Mercury’s present-day magnetic field can be explained by a thermally stratified layer blanketing the convective liquid outer core. The presence of a present-day stable layer is supported by thermal evolution studies that show that a sub-adiabatic heat flow at the core-mantle boundary can occur during a significant fraction of Mercury’s history. The requirements for both the likely long-lived Mercury dynamo and the presence of a stable layer place important constraints on the interior structure and evolution of the core and planet.

We couple mantle and core thermal evolution to investigate the necessary conditions for a long-lived and present-day dynamo inside Mercury’s core by taking into account an evolving stable layer overlying the convecting outer core. Events such as the cessation of convection in the mantle may strongly influence the core-mantle boundary heat flow and affect the thickness of the thermally stratified layer in the core, highlight the importance of coupling mantle evolution with that of the core. We employ interior structure models that agree with geodesy observations and make use of recent equations of state to describe the thermodynamic properties of Mercury’s Fe-S-Si core for our thermal evolution calculations. 

How to cite: Rivoldini, A., Deprost, M.-H., Zhao, Y., Knibbe, J., and Van Hoolst, T.: Effect of a thermally stratified layer in the outer core of Mercury on its internally generated magnetic field, Europlanet Science Congress 2022, Granada, Spain, 18–23 Sep 2022, EPSC2022-929, https://doi.org/10.5194/epsc2022-929, 2022.

Coffee break
Chairpersons: Jack Wright, Sebastien Besse
Surface
15:30–15:50
|
EPSC2022-1239
|
ECP
|
solicited
|
MI
Valentina Galluzzi, Jack Wright, David Rothery, Emanuele Simioni, Joe Zender, Johannes Benkhoff, and Gabriele Cremonese

Introduction:  On October 1, 2021, the ESA/JAXA BepiColombo spacecraft successfully accomplished its first Mercury’s swingby, with the closest approach (CA) taking place at 23:34 UTC at 199 km altitude. During this maneuver, more than 50 images of the planet were captured by two of the three Monitoring Cameras (M-CAMs) mounted on the BepiColombo Mercury Transfer Module (MTM). On June 23, 2022, the second swingby will take place providing other useful pictures of Mercury that will offer us the most up to date views of the planet. In fact, these are the first images of Mercury after more than six years since the NASA MESSENGER mission last pictured the planet. For both swingbys, because the spacecraft approached the planet from the nightside, the surface only becomes visible in images taken starting 5 minutes after the closest approach. The first swingby, provided a regional view of two adjoining regions —the Kuiper and the Discovery quadrangles— at varying lighting conditions (from dawn to noon) that let us appreciate some of the main features of Mercury that will be an objective for the BepiColombo mission [1,2]. The second swingby will provide a regional view of the opposite longitudes by picturing the Eminescu quadrangle regions.

Using MCAM Images:  We used Geographic Information System (GIS) software ArcGIS Pro to manually select control points on M-CAM images to be precisely georeferenced onto MESSENGER basemaps derived from the Mercury Dual Imaging System (MDIS) datasets. To minimize control point localization errors, we used ad-hoc projections for each M-CAM frame. The selected projections use a “Vertical Near Side Perspective Projection” centered on the camera calculated boresight at a finite distance (i.e., the spacecraft altitude). This projection permits simulation of the planet’s horizon from a spacecraft point of view at the time of the image. Precise calculation of the camera boresight and pointing was possible thanks to the Spectrometer and Imagers for MPO BepiColombo Integrated Observatory System (SIMBIO-SYS) instrument tools [3]. Manual selection of control points not only permits a high georeferencing accuracy, but also offers a chance to detect any surface change since Mercury was last imaged by MESSENGER/MDIS.

Results: We manually georeferenced the four M-CAM images released by ESA the day after the first flyby [4], which also represent the best views of Mercury acquired during the flyby. M-CAM2 images mainly cover the Kuiper quadrangle (“image2” and “image6”), while M-CAM3 images cover the Discovery quadrangle (“image 1” and “image8”). We grouped these images into two pairs, one representing the view 5 min after CA and one representing the view 10 min after CA. The first pair provides dramatic shadows highlighting the morphology of Mercury (“image1” and “image2”), including some known lobate scarps such as Astrolabe Rupes. The second pair provides a wider view of the captured regions providing a continuous view of the planet’s terminator (“image6” and “image8”). Although the M-CAMs were not designed to obtain images with resolutions comparable to those of MESSENGER/MDIS, we verified that these areas were only partially imaged before with the same illumination conditions. The Discovery quadrangle was captured by MDIS with similar conditions only during MESSENGER’s flybys and with a slightly lower resolution. The Kuiper quadrangle was never imaged before with these illumination conditions. Hence, M-CAM frames surprisingly provided unique views of these regions of Mercury.

Future Developments: After the second flyby in June, there will be four further swingbys before orbit insertion (5 December 2025) providing M-CAM imaging opportunities covering a range of latitude and longitudes at a variety of incidence angles. We will use these to identify and interpret features not, or only imperfectly, revealed in MESSENGER images and to revise current and recent geological mapping. Fault scarps, whose visibility is known to be prejudiced by illumination bias [4] are of particular concern, and swingby 1 has demonstrated the utility of high incidence angle images for revealing catenae that are poorly understood and probably polygenetic [5]. These swingby images will be also useful to redefine some of the targets selected for BepiColombo observations, in particular, those of the SIMBIO-SYS instrument [3].


References:

[1] Benkhoff J. et al. (2020) Space Sci. Rev. 217.8, 1-56. [2] Rothery D.A. et al. (2020) Space Sci. Rev. 216, 1–46. [3] Cremonese et al. (2020), Space Sci. Rev., 216, 1–78. [4] https://www.esa.int/Science_Exploration/Space_Science/BepiColombo/BepiColombo_s_first_views_of_Mercury [5] Fegan E. et al. (2017) Icarus 288, 226–234. [6] Rothery D.A. and Fegan E. (2015) EGU Gen. Ass. Abstr., p12771.

How to cite: Galluzzi, V., Wright, J., Rothery, D., Simioni, E., Zender, J., Benkhoff, J., and Cremonese, G.: BepiColombo Unique Views of Mercury Seven Years After MESSENGER, Europlanet Science Congress 2022, Granada, Spain, 18–23 Sep 2022, EPSC2022-1239, https://doi.org/10.5194/epsc2022-1239, 2022.

15:50–16:00
|
EPSC2022-728
|
ECP
Alistair Blance, David Rothery, Jack Wright, Matt Balme, and Valentina Galluzzi

Impact ejecta flows are found on rocky planets, and some icy moons. In contrast to ballistically emplaced ejecta, which thins exponentially from crater rims, ejecta flow deposits have a layered morphology with steeper margins, often lobate in shape. This fluidised morphology is thought to result from deposition by ground-hugging flows. For ejecta flows on Mars, the Earth, and some icy satellites, volatiles have been suggested as a possible fluidising agent. Ejecta flows on the Moon however, where volatiles are mostly absent, are likely dry granular flows.

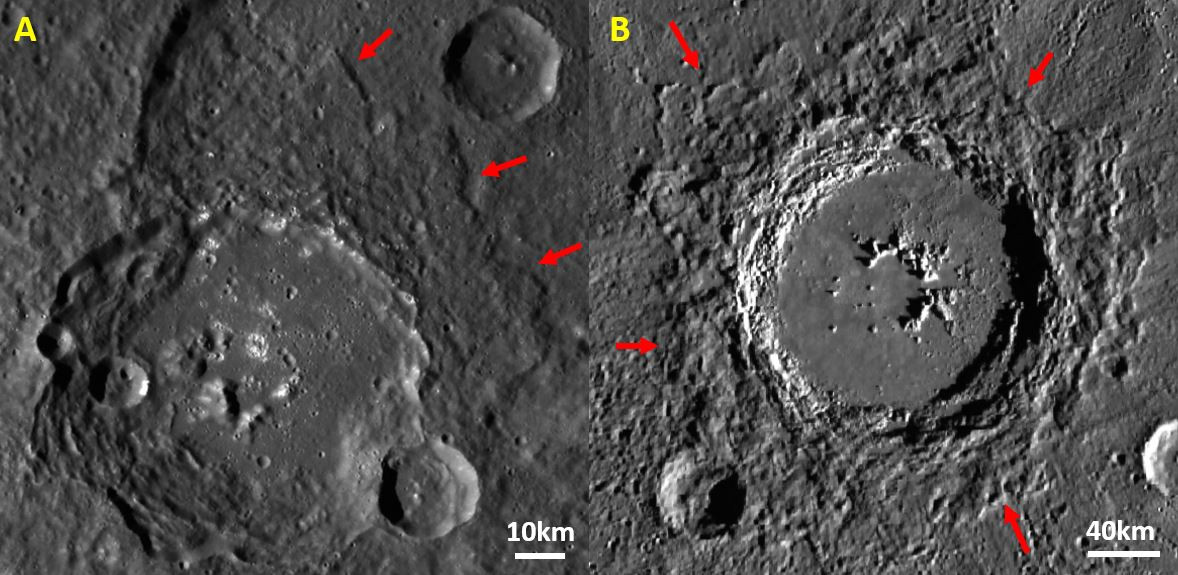
On Mercury, seven ejecta flow deposits were reported by Xiao and Komatsu (2013), described as single layer deposits, extending downslope into adjacent, older craters (Fig 1A). These flows could have occurred during the impact process, or afterwards by mass-wasting. Hokusai crater also has an apparent ejecta flow (Barnouin et al., 2015), but by contrast it occurs on relatively flat ground and does not extend into an adjacent crater (Fig 2A).

Figure 1: Previously reported ejecta flows on Mercury. Image A = Unnamed crater with an ejecta flow extending downslope into an adjacent crater. Reported by Xiao and Komatsu (2013). Image B = Hokusai crater with an ejecta flow on flat ground. Reported by Barnouin et al. (2015). Red arrows indicate flow boundaries.

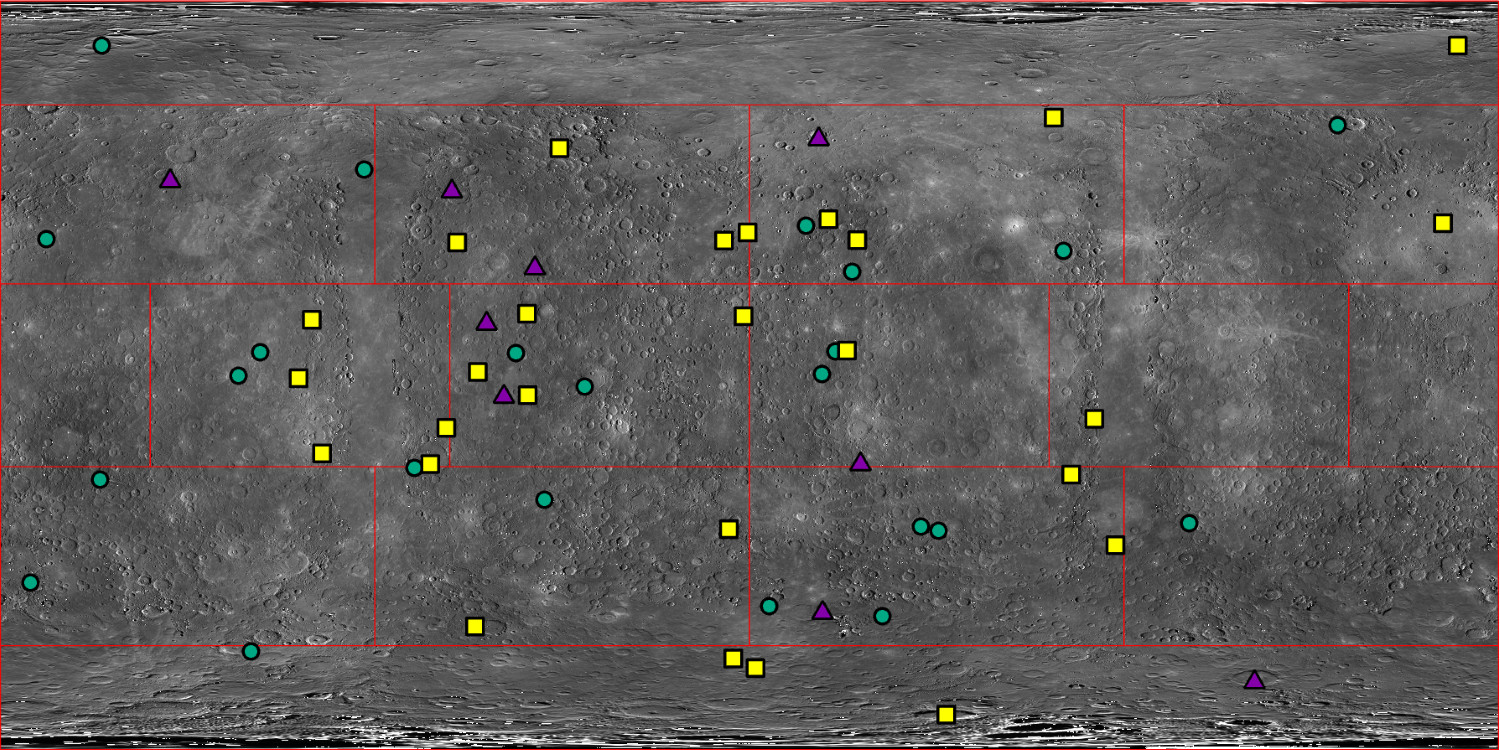
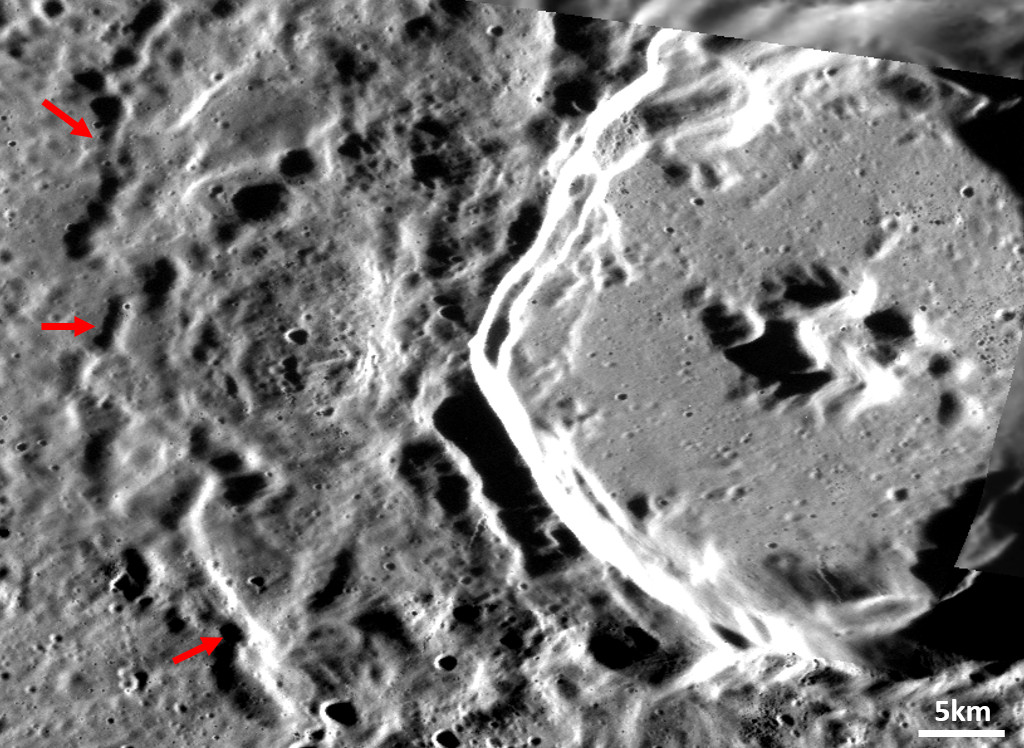
Here we present a global survey of Mercury identifying 36 craters with ejecta flows and a further 27 probable examples (Fig 2). The majority occur around craters ~30–80 km in diameter and are widespread across the planet. All but two of the ejecta flows appear to extend downslope into adjacent craters or other topographic lows. In addition to Hokusai, an unnamed crater, also on the northern plains, has an ejecta flow on relatively flat ground (<2° slope) and not extending into an adjacent crater (Fig 3). These two flows look distinct from other examples on Mercury, resembling single-layer ejecta craters on Mars, with distal ramparts and a ropey texture. The prevalence of Mercurian ejecta flows shown by this survey is also of note, representing at least a fourfold increase in the number of known flows.

Figure 2: Results of a global survey for ejecta flows. Purple triangles = Previously reported flows. Yellow squares = Flows identified by this survey. Green circles = Probable flows identified by this survey. Image is a monochromatic basemap of Mercury in a simple cylindrical projection. The middle of the image is at 0 degrees longitude, with Mercury quadrangle boundaries shown in red.

Figure 3: Unnamed crater with an ejecta flow on flat ground. Distal ramparts at flow boundaries indicated with red arrows.

As Mercury has volatile-bearing materials at the surface, these could be a factor in ejecta fluidisation. However, we find no evidence for volatile involvement, and features indicative of local volatile concentration (e.g. hollows) don’t occur preferentially near to ejecta flows. Slope of local terrain is clearly a major factor in influencing ejecta flow development on Mercury, since almost all flows extend downslope into adjacent craters. Perhaps some flows are post-impact mass movements, rather than forming during the impact process. However, other work shows that for at least one example, the time of emplacement was contemporaneous with impact (Lennox et al., 2022).

Of the flows on low slopes, Hokusai crater exhibits evidence of excess impact melt: a possible fluidising agent (Barnouin et al., 2015). However, the other crater with a flow on relatively flat ground has no identifiable impact melt present outside the crater rim. The crater is also considerably smaller than Hokusai (~37 km vs 95 km diameter), and smaller craters tend to have proportionally less impact melt. Understanding how this crater’s ejecta flow formed would give insight into the factors influencing ejecta fluidisation on Mercury, as for this crater the slope of local terrain, volatile presence, and impact melt excess do not appear to be obvious factors.

How to cite: Blance, A., Rothery, D., Wright, J., Balme, M., and Galluzzi, V.: A Global Survey of Mercury for Ejecta Flows: Investigating their Origins, Prevalence, and Significance, Europlanet Science Congress 2022, Granada, Spain, 18–23 Sep 2022, EPSC2022-728, https://doi.org/10.5194/epsc2022-728, 2022.

16:00–16:10
|
EPSC2022-811
|
ECP
Salvatore Buoninfante, Valentina Galluzzi, Luigi Ferranti, Maurizio Milano, and Pasquale Palumbo

Introduction: The Michelangelo quadrangle of Mercury (H-12) encompasses the area between latitudes 22.5°S-65°S and longitudes 180°E-270°E. The first geological map of the H-12 quadrangle was produced by [1] at 1:5M scale using Mariner 10 data. They have identified and mapped five classes of craters and four main plain units: intecrater, intermediate, smooth and very smooth plains. Here, we present a new geological study of this quadrangle, derived from the photointerpretation of the MErcury Surface, Space ENvironment, GEochemistry, and Ranging (MESSENGER) Mercury Dual Imaging System (MDIS) imagery. This geological investigation will contribute to the 1:3M geological map series campaign that constitutes a basic work to identify targets proposed for science observations during the ESA-JAXA BepiColombo mission [2]. Furthermore, our purpose is to map the tectonic structures at the southern boundary of the High-Mg region, in order to verify any possible linkage between fault systems and the areal distribution of this geochemical terrain, as observed in other quadrangles [3]. Three main contractional structures have been recognized on Mercury: wrinkle ridges, lobate scarps and high-relief ridges. A global map of the tectonic structures of Mercury was provided by [4]. With our work we will provide an updated structural framework of the area and study the relationship of the mapped structures with crustal discontinuities also with the help of geophysical analysis of the gravimetric data.

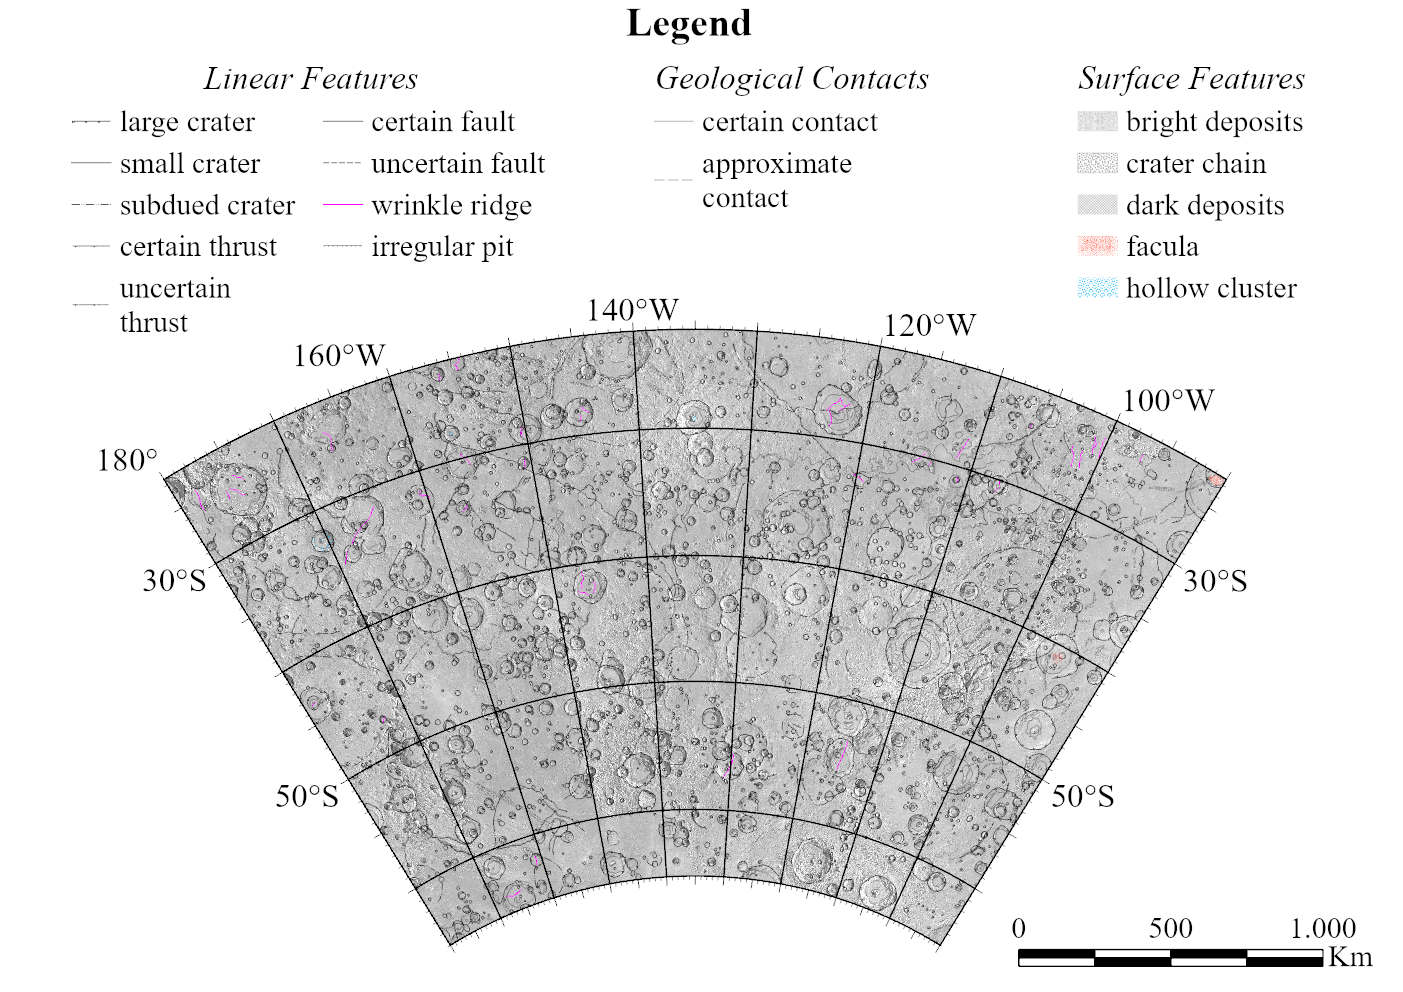
Geological Mapping: We are currently mapping the tectonic structures and geological units using the MDIS derived basemaps, with an average resolution of 166 m/pixel. In particular, we use the map-projected Basemap reduced Data Record (BDR), the map-projected Low-incidence Angle (LOI) basemap, the map-projected High-Incidence angle basemap from the East (HIE) and the map-projected High-Incidence angle basemap from the West (HIW). In addition, we use the USGS global Digital Elevation Model (DEM) to better distinguish morphological features, and the color and enhanced color basemaps to distinguish surface features (faculae, hollows, dark deposits, bright deposits, crater chains). Linear features are subdivided into large craters (crater rim diameter > 20 km), small craters (5 km < crater rim diameter < 20 km), subdued or buried craters, certain or uncertain thrusts, certain or uncertain faults, wrinkle ridges and irregular pits (Fig. 1), consistently with other mapped quadrangles [2].

Structural Analysis: We have identified two main thrusts systems with NW-SE and NE-SW trends. Comparing the mapped fault systems with the X-Ray Spectrometer (XRS) Mg/Si abundance, the NW-SE system appears to be broadly coinciding with the south-western edge of the High-Mg region, although we are aware that the accuracy of XRS data at this latitudes is much lower than those acquired in the northern hemisphere. We identified tectonic structures that are arranged radially with respect to large basins (e.g., Beethoven). Indeed, as also shown by [5], some older basins, such as Beethoven (20.8°S-236.1°E) and Vincente-Yakovlev (52.6°S-197.9°E), are responsible for a reactivation of their edges with the formation of lobate scarps. We mapped some vents that are located along lobate scarps or at soft-linkage transition zone between different scarp segments, which, on the Earth, are considered as possible preferential areas for magma uprise.

Future Work: We plan to complete the 1:3M geological mapping of the Michelangelo quadrangle including characterization of the plains units. Moreover, we will perform a geophysical analysis of the gravity anomalies, to identify the main crustal structures and to investigate how Mercury’s tectonic structures relate to large crustal discontinuities.

Acknowledgements: This work is part of the PhD project of SB at the University of Naples Federico II. We gratefully acknowledge funding from the Italian Space Agency (ASI) under ASI-INAF agreement 2017-47-H.0.


Figure 1. Preliminary geostructural map of the Michelangelo Quadrangle. Basemap is the MDIS BDR 166m mosaic.


References:

[1] Spudis P. D. and Prosser J. G., (1984). U.S. Geological Survey, IMAP 1659.

[2] Galluzzi et al. (2021). LPI Contrib. No. 2610.

[3] Galluzzi et al. (2019). J. Geophys. Res. 124(10), 2543-2562.

[4] Byrne P. K., (2014). Nature Geosci., 7(4), 301-307.

[5] Fegan E. R. et al., (2017). Icarus, 288, 226-234.

How to cite: Buoninfante, S., Galluzzi, V., Ferranti, L., Milano, M., and Palumbo, P.: Geostructural mapping of the Michelangelo (H-12) quadrangle of Mercury: relationship between tectonic and crustal structures, Europlanet Science Congress 2022, Granada, Spain, 18–23 Sep 2022, EPSC2022-811, https://doi.org/10.5194/epsc2022-811, 2022.

16:10–16:20
|
EPSC2022-278
|
ECP
Hannes Bernhardt, Jaclyn D. Clark, Frank Preusker, Christian Klimczak, Maria E. Banks, David A. Williams, David Nelson, and Thomas R. Watters

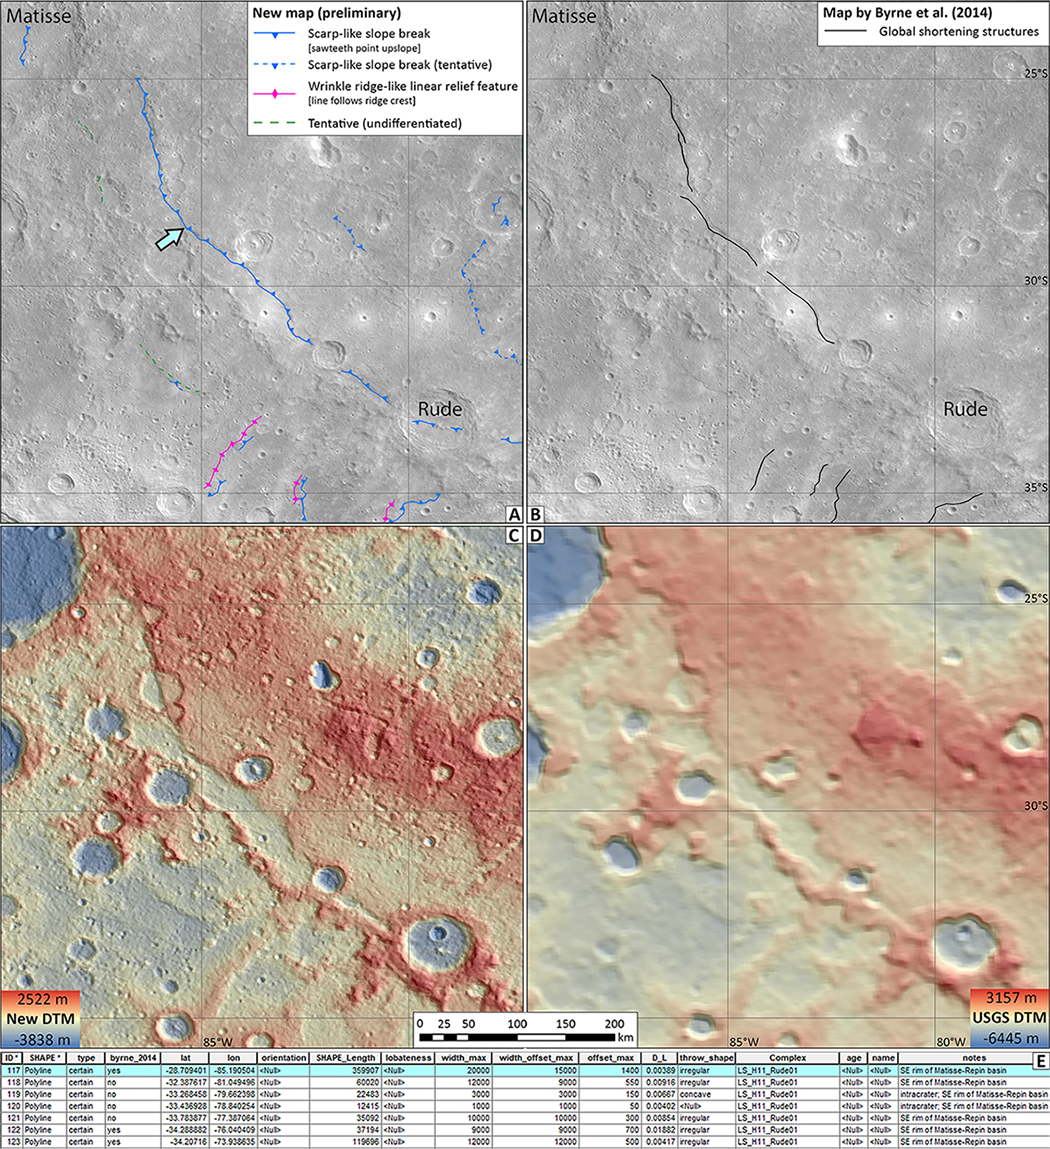
Introduction: The global distribution of shortening structures on Mercury as well as geographic and temporal trends of any of their morphometric and structural parameters are key to better understand the planets’ history of contraction, tidal despinning, and lithologic/rheologic variations in its current crust  [1–4]. Previous global cataloging of ~6000 shortening structures on Mercury by [1] was based on preliminary, ~250 m/pixel data by MESSENGER’s Mercury Dual Imaging System (MDIS) and included no morphometric analyses other than displacement-length (D/L) assessments on 665 m/pixel digital terrain models (DTMs) [5]. Furthermore, as recently elaborated on by [6], the association of shortening structures with larger tectonic complexes needs to be assessed to derive a more realistic inventory of actually implied faults. We provide such assessments without interpolating between geographically disconnected structures while maintaining optional association of structural complexes, thereby offering a more versatile dataset (Fig. 1).

Data: Our mapping is carried out on high- and low-incidence angle, ~166 m/pixel mosaics of MDIS images as well as on 222 m/pixel digital terrain models (DTMs) derived from photogrammetric analysis of MDIS-Near-Angle Camera stereo images. While four quadrangles of these DTMs have been released  [7–9], we have since finished the remaining 11 quadrangles. Hillshade models and slopemaps derived from these DTMs are also used for feature identification and mapping to minimize any residual illumination bias (especially at certain longitudinal bands) that likely affected previous efforts [1,6] that lacked fully global hi-res topographic data.

Methodology: We established a thorough step-by-step procedure to map and parametrize each identified shortening structure:

  • Digitization at scale 1:1,000,000 using streaming method at constant vertex placement every 2 km. Midpoint coordinates and lengths will be automatically recorded.
  • Check whether feature had been (entirely or partially) recognized by [1].
  • Interpretive assignment to a complex (or none). Nomenclature "[LobateScarp or WrinkleRidge]_Quadrangle name_[closest named feature or official scarp name]#", e.g., "WR_H-03_Brahms01" (quadrangle based on where majority of complex is). All compound scarps associated with a wrinkle ridge are mapped as scarp-like slope breaks but assigned to an according complex with prefix WR.
  • Measure maximum width and width at point of maximum offset, i.e., extent of scarp backarc until it reassumes background elevation or distance between front- and backscarp.
  • Measure maximum relief (in steps of 50 m, which is the vertical accuracy of the DTMs)
  • Determine shape of throw (topographic trend along scarp or ridge crest; only for lengths >20 km).
  • Orientations are determined in bulk after completion of a quadrangle. Will be done per entire line feature (avg. orientation) and per 2 km-vertex segment (weighted orientation).
  • Lobateness (i.e., ratio between line connecting endpoints and actual feature length) will be determined in bulk after completion of a quadrangle.
  • Segmentation (i.e., sum of gap length divided by sum of segment lengths) will be determined per assigned complex.
  • Depth of faulting, displacement-length ratios (D/L), and horizontal shortening will be derived per line feature according to methods by[10–15] in bulk after completion of a quadrangle. Maximum values per complex will be recorded. D/L per complex (i.e., max. offset/entire complex length) will also be offered.
  • Minimum model ages will be dereived for subset of shortening structures from crater size-frequency distribution measurements on underlying units, e.g., sufficiently large smooth crater floors. Initial assessments indicate 5 to 10 such locations per quadrangle.

Applications: The geographic and temporal distribution of the structural parameters listed above will be used to test a variety of predictions made by several hypotheses, e.g., regarding global contraction, tidal despinning, thermal weakening, mascon subsidence, as well as lithologic/rheologic variations  [1,2,6,15–21].

Figure 1: Portion of H-11 quadrangle showing the region between Matisse and Rude craters as preliminary sample area of our structural mapping project. A) Current state of our structural map superposed on low incidence MDIS mosaic. Compared to the linework in (B), we were able to trace the scarp more coherently, also identifying segments on the floor of Rude crater and new structural features elsewhere. The blue-green arrow points to the feature highlighted in (E). B) Same as (A) but with the map by [1]. C) New color-coded DTM over derived hillshade model. D) Same as (C) but using topography data by the USGS [5]. E) Attribute table of our scarp-like slope break linework (blue lines in (A)), including the highlighted one in blue-green (marked by arrow in (A)). Columns show parameters for each line feature. Orientation and lobateness will be derived in bulk at a later point using ArcToolbox plugins. Ages will only be determined for scarps whose formation age can be constrained with CSFD measurements, e.g., when they transect a smooth, sufficiently large crater floor.

References: [1] P. K. Byrne et al., Nat. Geosci. 1 (2014). [2] K. T. Crane and C. Klimczak, Icarus 317, 66 (2019). [3] M. E. Banks et al., J. Geophys. Res. Planets 122, 1010 (2017). [4] M. E. Banks et al., J. Geophys. Res. Planets 120, 1751 (2015).[5] K. J. Becker et al., in LPSC (2016), p. 2959.[6] T. R. Watters, Commun. Earth Environ. 2, 9 (2021).[7] F. Preusker et al., Planet. Space Sci. 142, 26 (2017).[8] A. Stark et al., in LPSC (2017), p. 2287.[9] J. Oberst et al., in LPSC (2017), p. 1442.[10] T. R. Watters et al., Geophys. Res. Lett. 29, 1542 (2002).[11] I. Egea-González et al., Planet. Space Sci. 60, 193 (2012).[12] G. A. Peterson et al., in LPSC (2017), p. 2315.[13] S. F. Wojtal, J. Struct. Geol. 18, 265 (1996).[14] T. R. Watters, R. A. Schultz, and M. S. Robinson, Geophys. Res. Lett. 27, 3659 (2000).[15] P. K. Byrne, C. Klimczak, and A. M. Celâl Şengör, in Mercur. - View after MESSENGER (2018), pp. 249–286.[16] T. R. Watters et al., Geophys. Res. Lett. 42, 3755 (2015).[17] S. A. Hauck et al., in Mercur. - View after MESSENGER (2018), pp. 516–543.[18] R. G. Strom, N. J. Trask, and J. E. Guest, J. Geophys. Res. 80, 2478 (1975).[19] T. R. Watters et al., Geophys. Res. Lett. 31, L04701 (2004).[20] R. J. Phillips et al., in Mercur. - View after MESSENGER (2018), pp. 52–84.[21] T. R. Watters et al., Earth Planet. Sci. Lett. 285, 309 (2009).

How to cite: Bernhardt, H., Clark, J. D., Preusker, F., Klimczak, C., Banks, M. E., Williams, D. A., Nelson, D., and Watters, T. R.: Global Map and Parameter Catalog of Shortening Structures on Mercury Using Novel High-Resolution Topography Data, Europlanet Science Congress 2022, Granada, Spain, 18–23 Sep 2022, EPSC2022-278, https://doi.org/10.5194/epsc2022-278, 2022.

16:20–16:30
|
EPSC2022-199
|
ECP
Anna Galiano, Fabrizio Capaccioni, Gianrico Filacchione, and Cristian Carli

Introduction

The surface of Mercury has been divided in several spectral units [1-4] as a result of the application of the Principal Component Analysis (PCA) on MDIS [5] photometrically-corrected images acquired during the first two MESSENGER flybys. The spectral units are mainly distinct for differences in reflectance and spectral slope, described as “red” or “blue” depending on a steeper or less steep slope than the average Mercury terrain in MDIS spectral range (395-1040 nm). The three major terrain classes are the Low-Reflectance Material (LRM), the Intermediate Terrain (IT), and Smooth Plains, which are in turn subdivided into High-reflectance Red Plains (HRP), Intermediate Plains (IP), and Low-reflectance Blue Plains (LBP). HRP are the brightest and reddest smooth plains; IP and IT are spectrally similar to the global mean; the LBP is intermediate between the IP and the LRM; the LRM is the darkest unit on Mercury [3]. Minor classes on Mercury are: fresh crater ejecta, hollows, and “red units” [1,4]. Fresh crater ejecta are interpreted to be among the least space-weathered materials on Mercury, for the higher reflectance and bluer spectral slopes than their mature counterparts [1]. Hollows are shallow, irregularly shaped, and rimless flat-floored depressions with bright interiors and halos and flat spectral slopes [4]. The red units are distinguished in red material (RM) emplaced during the impact process [6] and pyroclastic deposits, formed after explosive eruptions [1,2,7]. The spectral units on Mercury were also classified with MASCS data [8]: a PCA and a cluster analysis was applied on MASCS spectra acquired during the first two MESSENGER flybys and not corrected for viewing geometries[9].

In this work, we applied the unsupervised classification PCA and the supervised classification Spectral Angle Mapper (SAM [10]) on photometrically-corrected [11] MASCS spectra acquired during the MESSENGER orbit phases.

Dataset

MASCS employed a Cassegrain telescope to simultaneously feed an UltraViolet and Visible Spectrometer (UVVS) and a Visible and Infrared Spectrograph (VIRS). VIRS was a point spectrometer equipped with two detectors operating in the Visible (VIS, 300-1050 nm) and Near-Infrared (NIR, 850-1450 nm) range, and characterized by a spectral sampling of 5 nm. The PCA and SAM classifications were applied on 21 channels of VIRS reflectance spectra,  with a spectral sampling of 25 nm and spanning from 300 nm to 800 nm. To analyse high quality data, the VIRS dataset was filtered for observing angles (incidence and emission angles lower than 65°), temperature of VIS detector (less than 30°C), and footprint size (length lower than 25 km and length/width ratio lower than 10), as already performed in [12].

Results

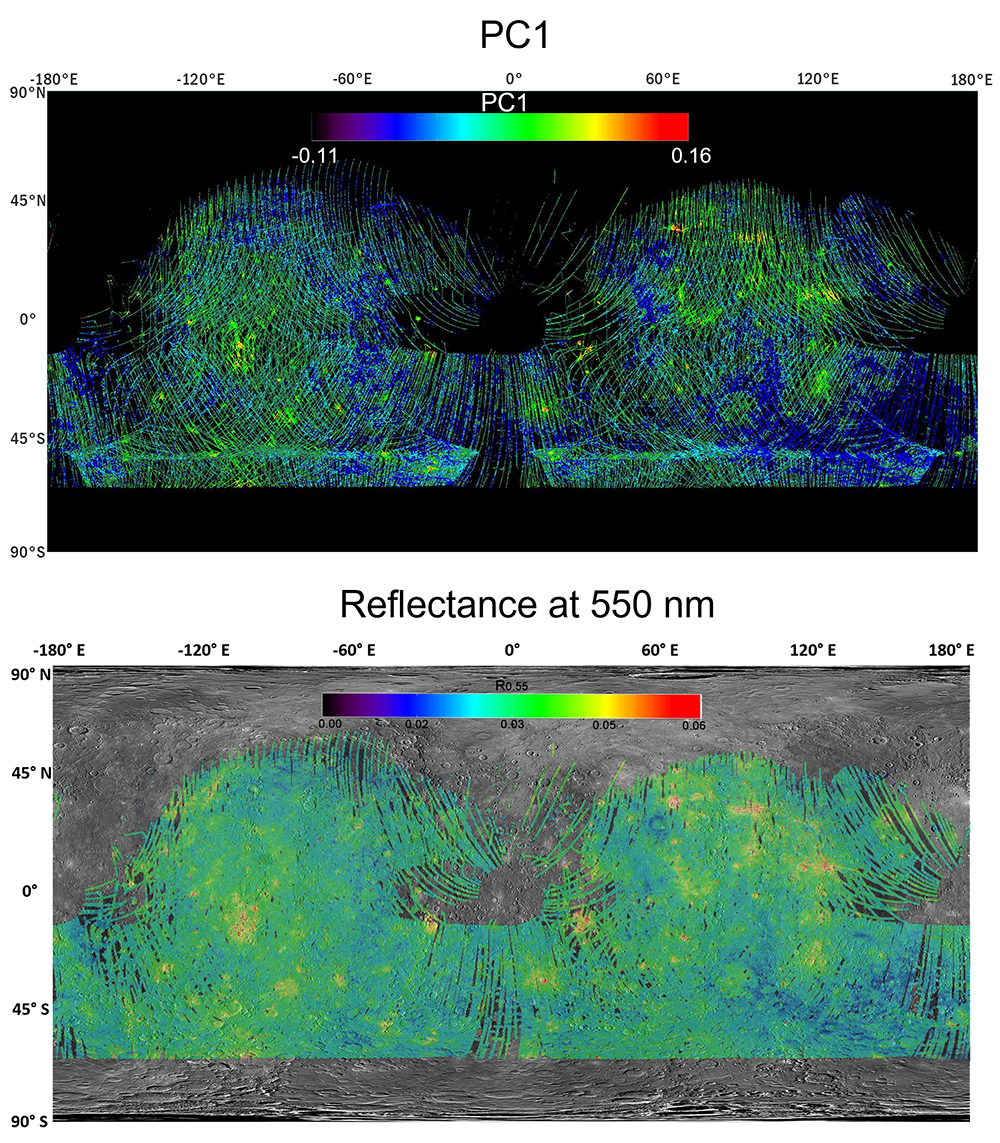
The PCA uses a linear transformation of data to translate and rotate the data into a new coordinate system that maximizes their variance [13].  As a result, the primary PCs, i.e. PC1, PC2, and PC3 are responsible for the 98.72%, 0.95%, and 0.17% of the spectral variability in the dataset. The spectral variation of PC1 appears to be coincident with that of the reflectance at 550 nm (Figure 1); a similar correlation has been observed for the PC2 and the VIS Slope (estimated in the 500-800 nm range), and for the PC3 and the UV Slope (estimated in the 300-400 nm range). The secondary PCs (PC4-PC21) covers the 0.16% of the total variance, and are increasingly dominated by the noise, useless therefore for the analysis. By combining the PC1, PC2, and PC3 maps in an RGB image, the minor terrains, i.e. hollows, fresh ejecta, and red units are readily distinguishable, as well as the LRM and the HRP major terrains.

Figure 1. Upper image: Map of PC1. Bottom image: Map of Reflectance at 550 nm


The SAM compares spectra of the dataset with spectra used as end-members and estimates the spectral similarity between two spectra by calculating the “spectral angle” between them, since the spectra are considered as vectors in a n-dimensional space (n is the number of bands, 21 in our case) [10].

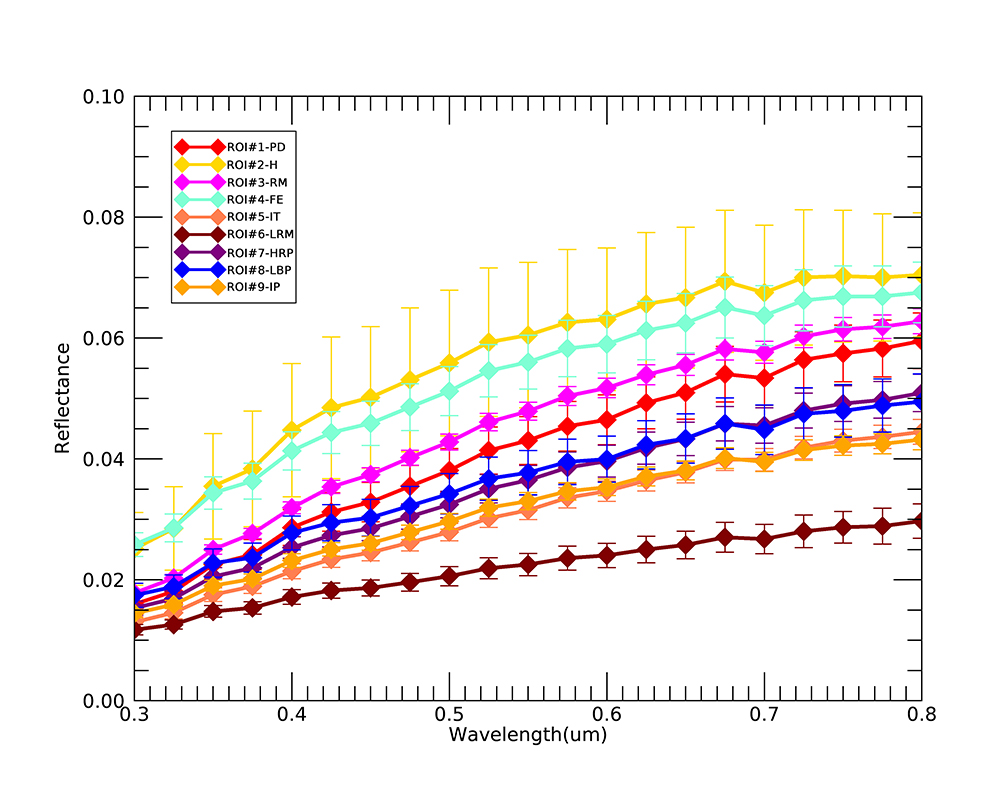
We used the mean spectra of representative regions for each major and minor terrain as end-members driving the classification. In particular, the mean spectra (Figure 2) of each region has been obtained from 10-15 pixels, where each pixel is a VIRS reflectance spectrum with 21 channels.

Figure 2. Mean spectra of the major and minor terrains used to drive the SAM classification

Then, we used multiple angles to perform the classification, i.e. we defined specific variability of spectral angles for each class in order to maximize the spectral variability of the classes and minimize false results. After the application of SAM on VIRS dataset, the surface of Mercury has been classified in 9 classes: the 87.5% of the data is classified as smooth plains (26% HRP, 18.7% LBP, and 42.8% IP), the 2.8% as IT, the 6% as LRM, and the minor classes represent the 3.8% of the dataset (2.2% fresh ejecta, 1% red material, 0.5% pyroclastic deposits, 0.1% hollows).

Results from PCA and SAM are compared to derive the chemical/physical properties of Mercury surface.

References: [1]Robinson et al. (2008) Science 321. [2]Murchie et al. (2008) Science 321. [3]Denevi et al. (2009) Science 324. [4]Blewett et al. (2009) EPSL 285. [5]Hawkins et al. (2007) SSR 131. [6]Ernst et al. (2010) Icarus 209. [7]Head et al. (2008) Science 321. [8]McClintok and Lankton (2007) SSR 131. [9] D’Amore et al. (2011) LPSC XLII. [10]Yuhas et al. (1992) JPL Publication 92–41. [11] Izenberg et al. (2014), Icarus, 228, 364-374. [12] Galiano et al. (2022) LPSC LIII. [13] Richards, 1994 Remote Sensing Digital Image Analysis: An Introduction, Springer.

Acknowledgments: We gratefully acknowledge funding from the Italian Space Agency (ASI) under ASI-INAF agreement 2017-47-H.0

How to cite: Galiano, A., Capaccioni, F., Filacchione, G., and Carli, C.: The Mercury surface investigated with Principal Component Analysis and Spectral Angle Mapper on MASCS/MESSENGER data, Europlanet Science Congress 2022, Granada, Spain, 18–23 Sep 2022, EPSC2022-199, https://doi.org/10.5194/epsc2022-199, 2022.

16:30–16:40
|
EPSC2022-319
|
ECP
Emma Caminiti, Alain Doressoundiram, and Sebastien Besse


Introduction:

The study of geological processes such as cratering and volcanism provides information on the evolution of Mercury's crust since its formation. The well-preserved, approximately 4 Ga, Caloris basin is one of the most important geological features on Mercury [1] [2] [3]. The basin is associated with two smooth plains, Caloris Planitia inside the basin and the Circum-Caloris smooth plain respectively called interior and exterior plains [4]. These two plains are spectrally different [5] [6]. The interior plain has a high reflectance that increase with wavelengths associated to the High-reflectance Red Plains (HRP) spectral unit. The exterior plain is bluer and have a lower reflectance being part of the Low reflectance Blue Plains (LBP). The interior and exterior plains appear to be both mostly volcanic in origin and emplaced after the formation of the basin although the timing of their establishment and the understanding of their spectral differences remain debated. The formation of large impact basins can bring to the surface deep material sampling the earliest carbon rich crust now buried under the secondary magmatic crust [7]. This deep excavated material is at the origin of the Low Reflectance Material (LRM) spectral unit [8]. A detailed spectral study of Caloris is proposed with the aim of improving our understanding of the setting up of volcanic smooth plains associated with basins. We also propose a comparison with other basins in order to understand whether the location of basins on Mercury has any influence on the setting up of volcanic plains.


Method:

We created spectral maps using on a one hand multispectral images obtained by the Mercury Dual Imaging System (MDIS/MESSENGER) and on another hand spectral observations acquired by the Mercury Atmospheric and Surface composition Spectrometer (MASCS/MESSENGER). MASCS data are contained in the MeSS (Mercury Surface Spectroscopy) database as well as several spectral parameters. We filtered the MASCS footprints, keeping only those with an instrumental temperature below 40 degrees Celsius, an angle of incidence below 75 degrees and an area of less than 65 km2. Then, the samplings of the interior HRP and exterior LBP have been done within the Caloris basin. The LRM was sampled around the Rachmaninoff, Tolstoj, Basho and Atget craters. A statistical study of the sampled areas allowed us to obtain a spectral characterization for each of the units. This spectral characterization was then used to map the different spectral units interacting in the setting of the basin and the current state of the crust.


Results:

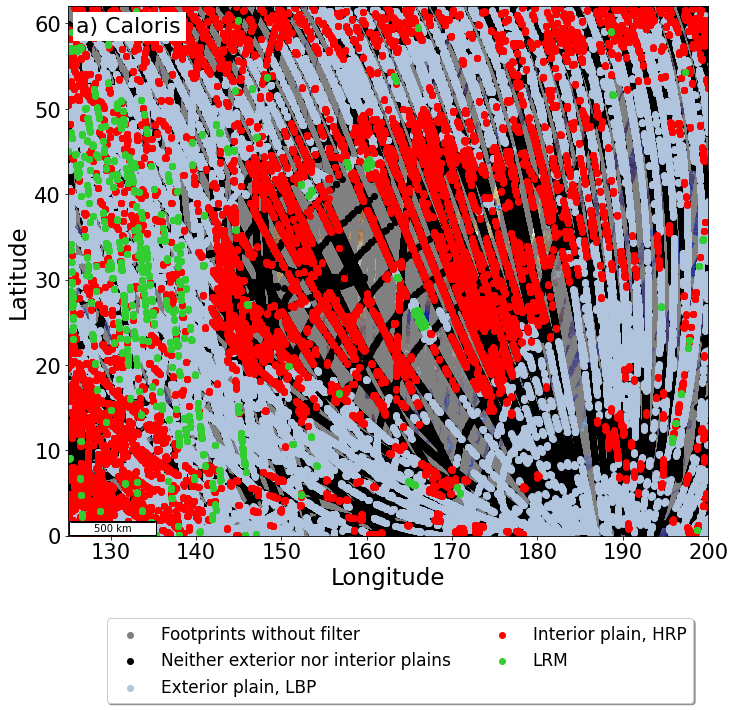
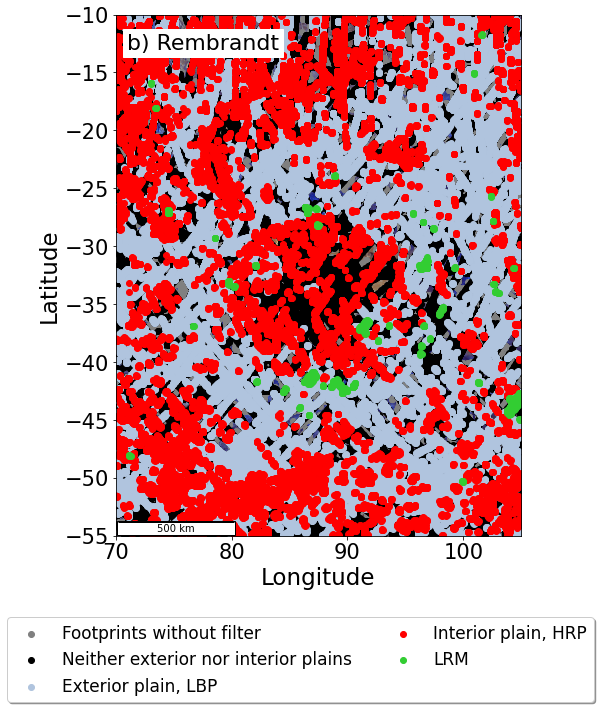
Our spectral characterization allows to distinguish the interior from the exterior plains of the Caloris basin (Figure 1.a). We highlight the presence of LRM concentrated in the western part of the exterior plain. It is also possible to identify LRM excavated from craters located on the interior plain. Focusing on the small craters located on the interior plain, we can see that there are LBP deposits around the LRM deposits themselves concentrated in the craters. This arrangement of spectral units provides information on the stratigraphy under the basin and thus the timing of the Caloris basin volcanic plains [2][9]. The study of the second largest basin Rembrandt (Figure 1.b) located in the southern hemisphere shows an arrangement of spectral units close to that of Caloris with an interior HRP filling the basin and exterior LBP both associated with partial LRM deposits.


Figure 1: Spectral maps: each point represents a footprint of MASCS and each color is associated to a spectral unit. a) Caloris basin b) Rembrandt basin.


Conclusion:

Spectral data from MESSENGER/MASCS allow us to map the spectral units on the surface of Mercury. The asymmetric LRM deposits in the western part of the basin suggests that it is possible that the process of laying down the exterior plain is not homogeneous all around the basin and seems to be related to the geochemistry of the crust. Results also suggest that the circum-Caloris volcanic smooth plain could have been set up before the interior plain. The comparison with the Rembrandt basin shows that the location of the basins may not be a major parameter in the setting up of the volcanic smooth plains on Mercury's surface. Even if the local properties of the crust are not negligible, the setting up of smooth plains could be related to impact processes and so be common to all impact basins. Extrapolating our results to multiple basins it is possible to bring some precisions concerning the nature of the smooth plains whose relationship between volcanism and impact melt remains ambiguous.


Acknowledgements:

The authors acknowledge the Centre National des Etudes Spatiales (CNES) for continuous and support.The authors would also like to thank the Domaine d’Intérêt Majeur en Astrophysique et Conditions d’Apparition de la Vie+ île de France for their support. The authors acknowledge the use of MESSENGER data.


References:

  • Murchie, S. L. et al. Geology of the Caloris Basin, Mercury: A View from MESSENGER. Science. (2008).
  • Fassett, C. I. et al. Caloris impact basin: Exterior geomorphology, stratigraphy, morphometry, radial sculpture, and smooth plains deposits. Earth and planetary Science Letters. (2009).
  • Marchi, S.Global resurfacing of Mercury 4.0–4.1 billion years ago by heavy bombardment and volcanism. Nature. (2013)
  • Rothery, D. A. et al.Caloris basin: Continuity between the interior and exterior plains: Mercury’s Caloris Plains. Journal of Geophysical Research. (2017)
  • Robinson, M. S. et al. Reflectance and Color Variations on Mercury: Regolith Processes and Compositional Heterogeneity. Science (2008).
  • Denevi, B. W . et al. The Evolution of Mercury’s Crust: A Global Perspective from MESSENGER. Science. (2009)
  • Peplowski, P.N et al. Remote sensing evidence for an ancient carbon-bearing crust on Mercury. Nature Geoscience. (2016)
  • Klima, R. L. et al. Global Distribution and Spectral Properties of Low‐Reflectance Material on Mercury. Geophysical Researcher Letters. (2018)
  • Ernst, C. M. Stratigraphy of the Caloris basin, Mercury: Implications for volcanic history and basin impact melt. Icarus. (2015)


How to cite: Caminiti, E., Doressoundiram, A., and Besse, S.: Impact basins and their associated smooth plains on Mercury using MESSENGER/MASCS observations, Europlanet Science Congress 2022, Granada, Spain, 18–23 Sep 2022, EPSC2022-319, https://doi.org/10.5194/epsc2022-319, 2022.

16:40–16:50
|
EPSC2022-326
|
ECP
Gaku Nishiyama, Alexander Stark, Christian Hüttig, Hauke Hussmann, Klaus Gwinner, Ernst Hauber, Luisa M. Lara, and Nicolas Thomas

Introduction

The ESA/JAXA joint mission BepiColombo comprises two spacecraft, one of which is the Mercury Planetary Orbiter (MPO). It will arrive at the Mercury orbit in 2025, and the BepiColombo Laser Altimeter (BELA) onboard MPO will start to characterize the Mercury’s surface, such as topographic reliefs. During the nominal and extended operations, the whole surface of Mercury will be covered by the BELA footprints, and separations between neighboring tracks were expected to vary from 3 km at the equator down to less than 250 m in polar regions [1].

One of the scientific objectives of BELA is to measure surface roughness, local slope, and albedo variations of Mercury [2]. In general, laser altimetry is a useful remote sensing tool to reveal the surficial features because the shape of the received pulse contains various information about footprints. For example, vegetation structure within footprints was observed in the waveforms measured by the Ice, Cloud, and land Elevation Satellite (ICESat) [3], and the martian roughness was estimated from the pulse width received by the Mars Orbiter Laser Altimeter [4]. Thus, BELA is expected to help characterize geologic features on Mercury, such as hollows [5]

In contrast, the effects of surficial features on the BELA pulse shape have not been investigated numerically. Until recently, semi-analytical pulse shape models have been employed to demonstrate the BELA measurements after the operation starts [1, 6]. Therefore, we develop the procedure to simulate realistic pulse shapes, incorporating digital terrain models (DTMs) and noise data from previous in-cruse checkouts of BELA. Then, we discuss the detectability of the surficial properties of Mercury.


Method

To simulate the realistic pulse shape returning from the Mercury surface, we first numerically model pulses returning from DTMs. Assuming a Gaussian pulse transmission and a Lambertian surface, we integrate photons from all the facets. Then, after the pulse shape is widened by the receiver optics, the number of photons is converted to signals in the avalanche photodiode. With 16 gain channels ranging from 4 to 44 dB, the Analog Electronics Unit amplifies the signal.

The simulated signal is finally compared with the sum of dark, solar, and shot noises. Data from in-cruise checkouts by June 2021 is used as the dark noise for respective gain channels. The solar and shot noise levels are analytically estimated [1]. By incorporating these noises, the signal-to-noise ratio (SNR) of the received pulse is calculated for various surfaces.


Results and discussions

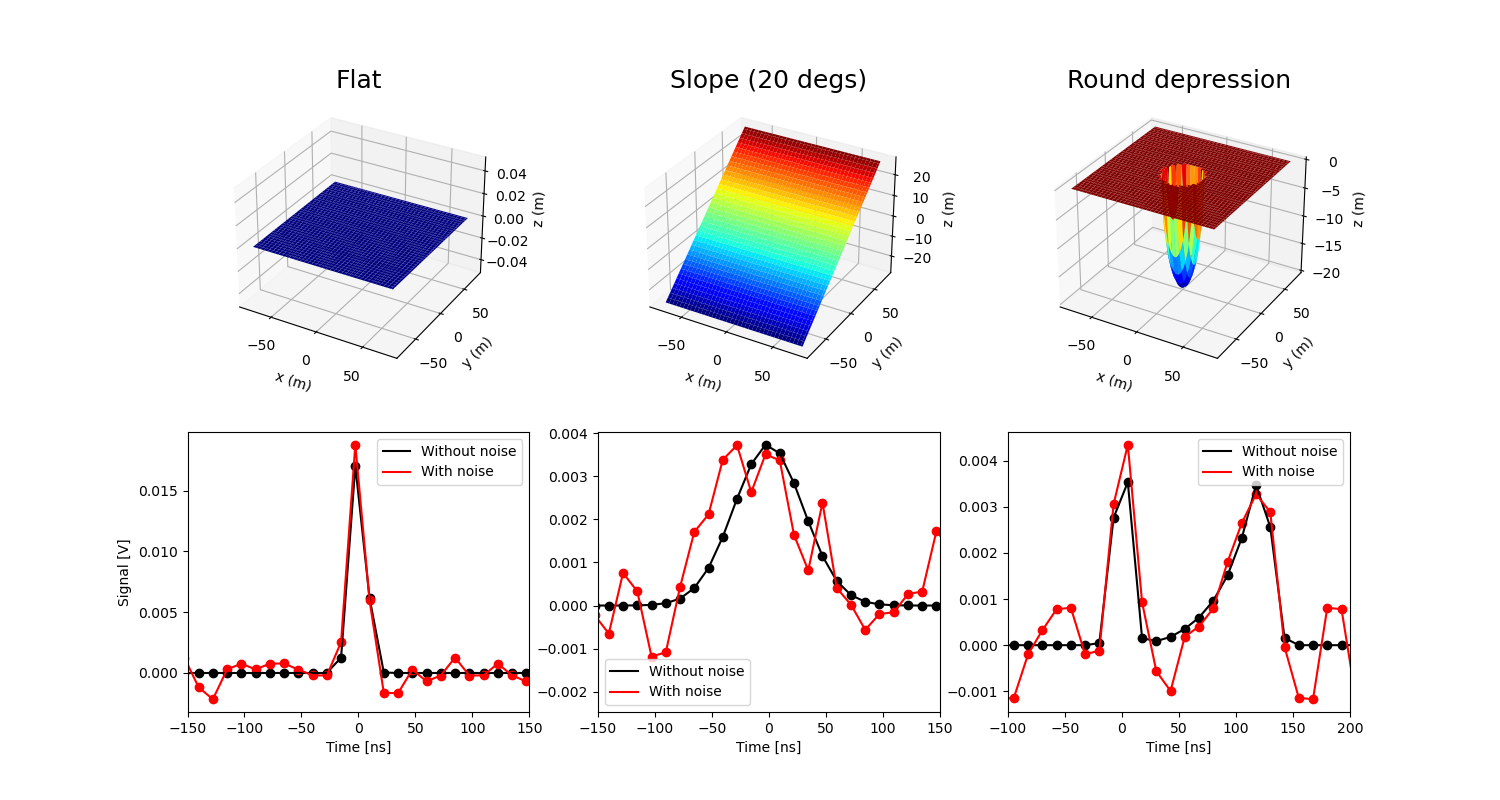
Figure 1 shows pulse shape examples simulated with various ideal topographies. For the flat surface, time of flight is almost uniform for all the photons from the footprint. However, slopes change distances between facets and BELA, widening pulse shapes. If bimodal height distribution, such as depression, cliff, and rocks, is contained within the footprint, a split pulse can be detected, depending on the height gaps.

Figure 1. Pulse shapes returning from a flat surface, slope (20 degrees), and round depression. The altitude is set to be 1000 km above the Mercury surface.


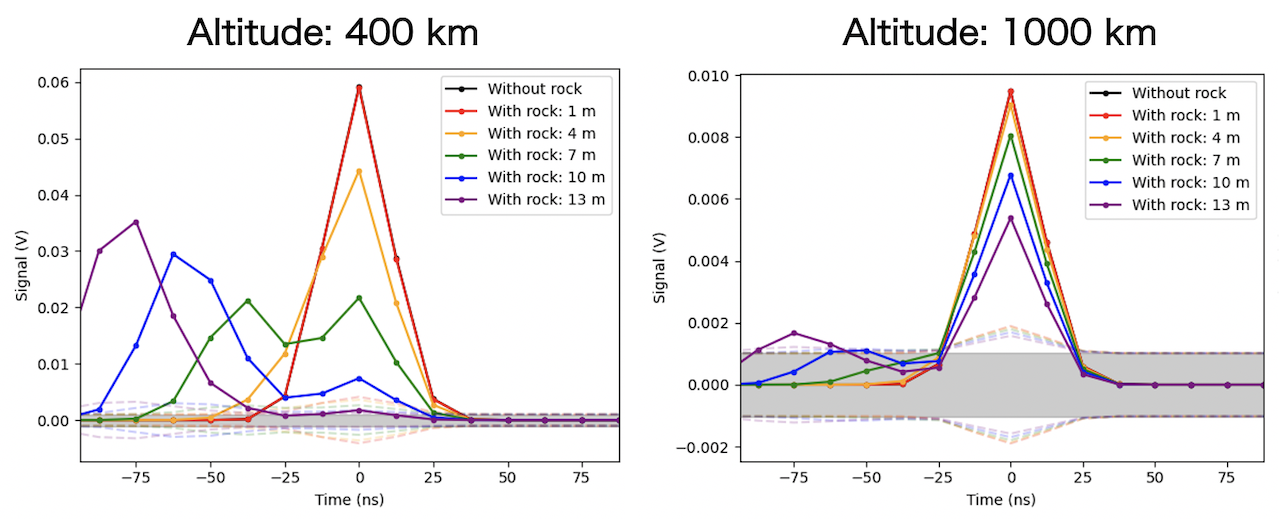
Detectability of rocks within a footprint is also examined in our analysis. Locating a hemispherical rock on a flat plain and changing its radius, we calculated pulse shapes with two peaks from the rock and its surroundings (Figure 2). In order to receive the rock’s signal with an SNR of 1 or higher, our estimate suggests that the radius of the rock needs to be larger than a few meters at an altitude higher than 400 km.

Figure 2. Pulse shapes without noises simulated for hemispherical rocks with various radii. Black shades show a standard deviation of dark noise. Dashed lines show the sum of dark, shot, and solar noises. Left peaks correspond to laser pulses reflected by the rock surface.


Furthermore, roughness estimation within the footprint requires accurate slope values because they similarly widen the pulse shape. Although only one-dimensional slopes can be constrained with BELA, possible constraints on roughness will be estimated using these pulse shape simulations. This presentation will report on such further implications for Mercury’s surfaces in future BELA observations.


Acknowledgment

This research is granted by JSPS Overseas Challenge Program for Young Researchers.


Reference

[1] G. Steinbrügge, A. Stark, H. Hussmann, K. Wickhusen, J. Oberst, The performance of the BepiColombo Laser Altimeter (BELA) prior launch and prospects for Mercury orbit operations. Planetary and Space Science. 159, 84-92 (2018).

[2] N. Thomas et al., The BepiColombo Laser Altimeter. Space Sci Rev. 217(2021).

[3] D. J. Harding, C. C. Carabajal, ICESat waveform measurements of within-footprint topographic relief and vegetation vertical structure. Geophysical Research Letters. 32, L21S10-n/a (2005).

[4] G. A. Neumann et al., Mars Orbiter Laser Altimeter pulse width measurements and footprint-scale roughness. Geophysical Research Letters. 30, 1561-n/a (2003).

[5] T. Blewett David et al., Hollows on Mercury: MESSENGER Evidence for Geologically Recent Volatile-Related Activity. Science. 333, 1856-1859 (2011).

[6] A. HosseiniArani et al., Comprehensive in-orbit performance evaluation of the BepiColombo Laser Altimeter (BELA). Planetary and Space Science. 195, 105088 (2021).

How to cite: Nishiyama, G., Stark, A., Hüttig, C., Hussmann, H., Gwinner, K., Hauber, E., M. Lara, L., and Thomas, N.: Simulation of laser pulse shapes received by the BepiColombo Laser Altimeter (BELA): Implications for future constraints on surficial properties of Mercury, Europlanet Science Congress 2022, Granada, Spain, 18–23 Sep 2022, EPSC2022-326, https://doi.org/10.5194/epsc2022-326, 2022.

16:50–17:00
|
EPSC2022-658
|
ECP
Edoardo Rognini, Veronica Camplone, Angelo Zinzi, Alessandro Mura, Anna Milillo, Matteo Massironi, Angelo Pio Rossi, Francesco Zucca, and Maria Teresa Capria
 

Introduction. The ASI Space Science Data Center (SSDC) has a long-standing experience in space data management. Among its tools, MATISSE (Multi-purpose Advanced Tool for Instruments for the Solar System Exploration [1]) was created in 2013 to search, visualize and analyze data from planetary exploration missions. MATISSE, whose v2.0 update [2] is available at https://tools.ssdc.asi.it/Matisse/, allows users to analyze data from different missions, such as NASA Messenger and NASA Dawn, and the possibility of visualizing the data directly on the 3D shape of the targets greatly helped in reaching stunning scientific results. The work here presented points at improving and expanding the functionalities of the MATISSE tool for the Mercury explorations, by including the possibility to merge together the outputs of a thermophysical code of Mercury surface and the study of planet’s surface from a geological point of view. 

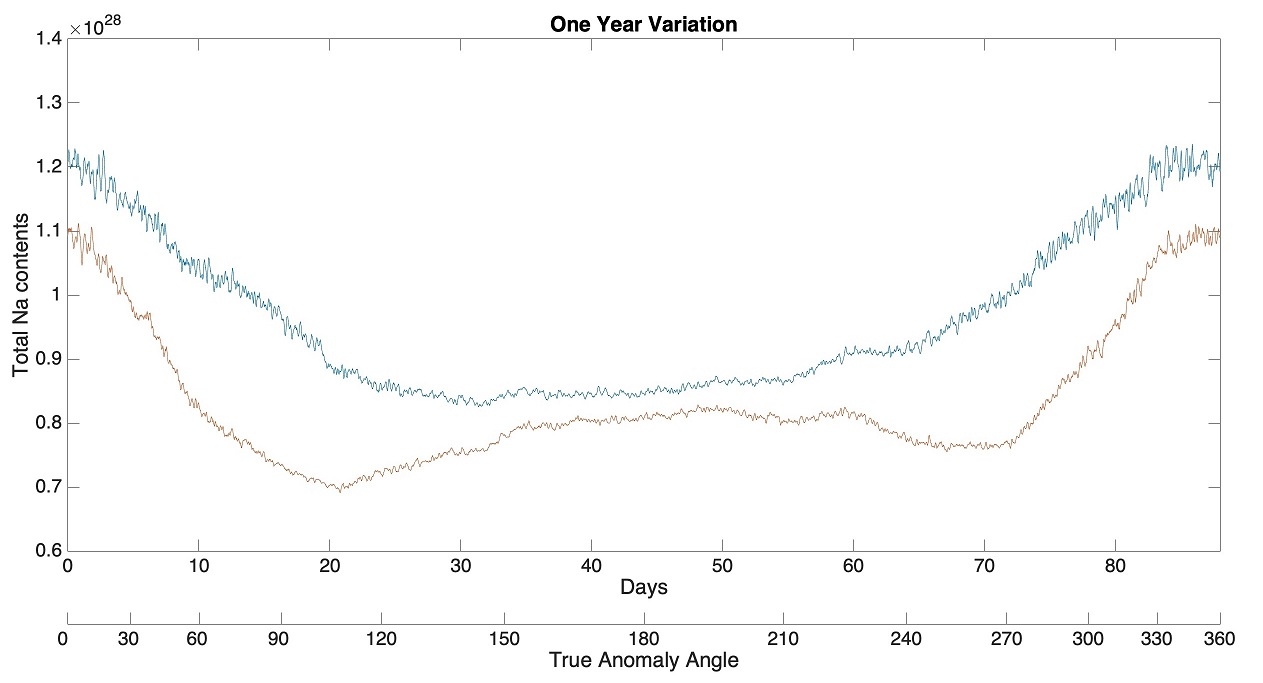
MATISSE for Mercury exploration. The ESA-JAXA BepiColombo mission is the first European mission to Mercury; the spacecraft will study in detail the surface, the exosphere and the magnetosphere of the planet. We have developed a thermophysical model with the aim to analyze the dependence of the temperature of the surface and of the layers close to it on the assumptions on the thermophysical properties of the soil. The code solves the one-dimensional heat equation, assumes purely conductive heat propagation and no internal heat sources; the surface is assumed to be composed of a regolith layer with high porosity and density increasing with depth. Calculations have been carried out to analyze the thermal response of the soil as a function of thermal conductivity. The model has been also used to study the sodium content in the planet's exosphere, whose origin is under investigation [3]; the MESSENGER mission has measured the exospheric sodium content as a function of time, detecting an increase at the "cold poles" (so called because of their lower than average temperature). In order to study the effect of surface temperatures on the sodium content in the exosphere, the temperature distribution calculated with the code has been used together with an atmospheric circulation model that calculates the exospheric sodium content [4].  


Figure 1. Total sodium exospheric content as function of time and true anomaly angle, calculated in two cases: surface temperature from the thermophysical code (red line), and reference temperature (T proportional to ¼ power of cosine of illumination angle, blue line). 

A simplified version of the thermophysical code is available to the scientific community through MATISSE and, therefore, it could be crucial to interpret the data acquired by the instruments on board the BepiColombo mission, especially if it is taken into account that, through MATISSE, it is possible to analyze the surface of Mercury with data from NASA Messenger based on queries looking for specific geological units (as is already possible for Mars, Mercury and Ceres). 

Thanks to the data from the MDIS (Mercury Dual Imaging System [5]) camera on board the MESSENGER, it was possible to create a global map of the planet's surface. The identified lithologies can be analyzed and subsequently uploaded to our MATISSE tool in order to have the possibility to study the surface of Mercury directly from the site. 

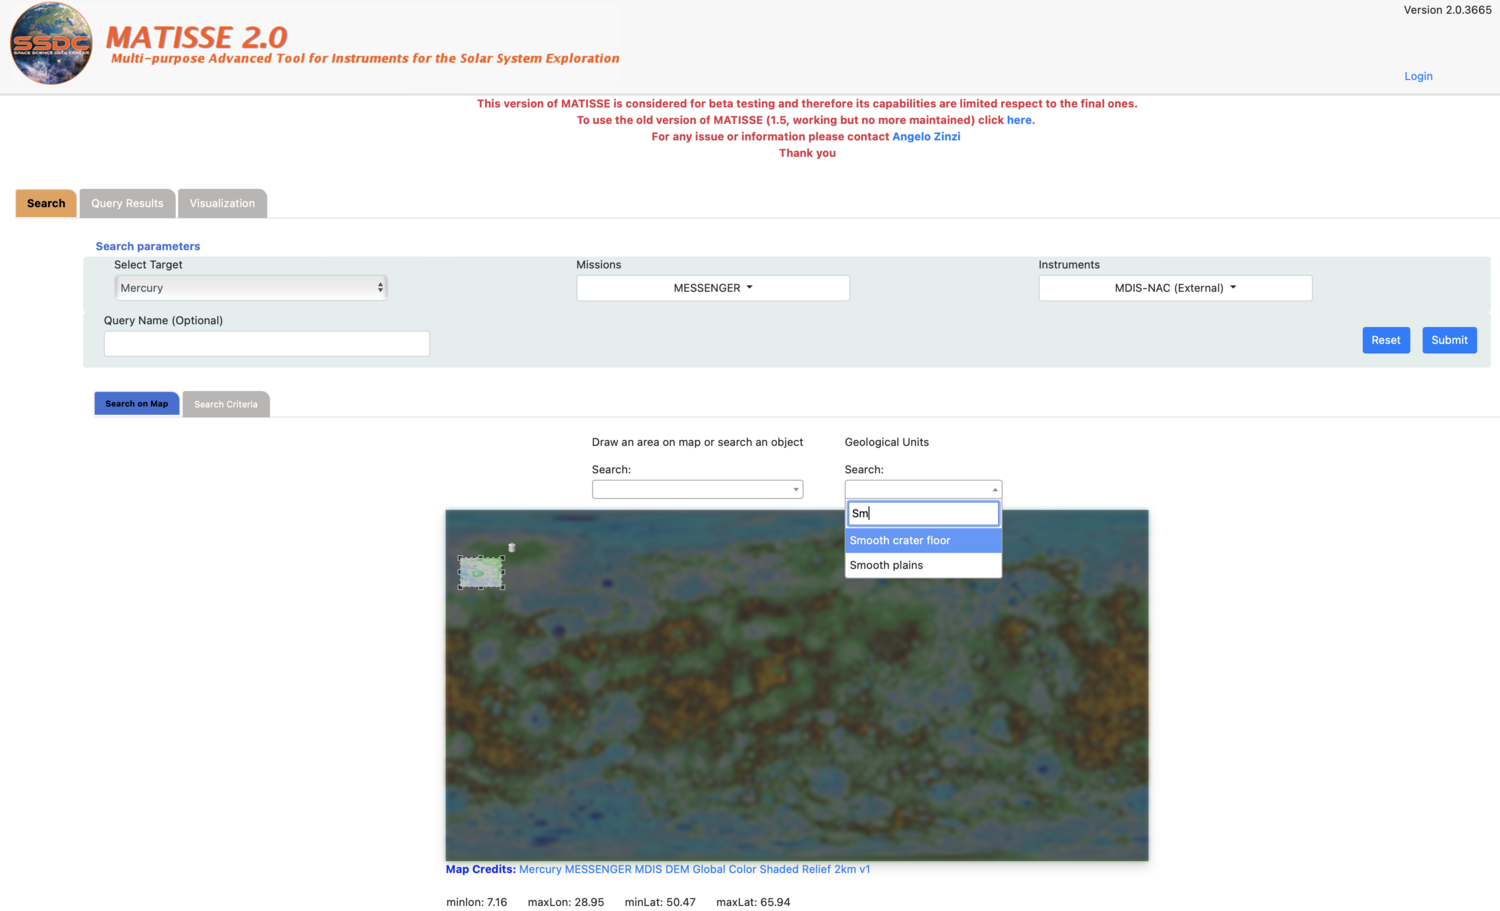
On MATISSE it will be possible to select the data not only with the usual geographical coordinate, but on the basis of geological maps, so that the user can analyze observational and modeled data collected on areas with well-defined geology that allow to study the effects of the heterogeneity of surface. 


Figure 2. MATISSE homepage and selection of parameters to be observed. Example of selection of the Hokusay crater on Mercury's surface. 

The possibility of studying the Mercury surface directly from the tool will allow not only to make a detailed study of the terrain but understanding its formation will help science to understand how the solar wind affects some materials. For this reason our work will allow planetologists and astrophysicists to have all the available data for the study of the planet. In collaboration with the PlanMap and GMap teams, we are currently working to include the geological units identified on the surface of Mercury in order to be ready with the data that will come from the Bepi Colombo mission in order to have everything you need to study this planet in depth. 

Next steps. We plan to add in the tool all geological units mapped by GMAP team on Mercury surface. Moreover we will expand in the tool the possibility of searching for data based on the morphologies that the user wants to analyze (e.g. craters, valleys). Another goal will be to expand the use of the tool, making it similar to the geographic information system (GIS). We will expand the possibility of selecting specific areas to be analyzed, having clear the geographical position of the data. It will also be possible to obtain topographic profiles, select more data to be observed. All these analyses will be performed directly on the 3D models. The inclusion of these functionalities in the tool could produce a sensible step forward in the study of planetary geology, with the possibility of better exploiting different datasets and taking also into account the collaboration of different teams already leaders in this field. 

References.  

[1] Zinzi A. et al. (2016) Astron. Comput., 15, 16-28  

[2] Zinzi A. et al. (2019) EPSC-DPS Joint Meeting 2019, id. EPSC-DPS2019-1272  

[3] Rognini, E., et al. (2022), Effects of mercury surface temperature on the sodium abundance in its exosphere, Planetary and Space Science, 212 

[4] Mura, A., et al. (2009), The sodium exosphere of Mercury: Comparison between observations during Mercury’s transit and model results, Icarus, 200, 1-11 

[5] Hawkins et al., (2007). The Mercury Dual Imaging system on the MESSENGER spacecraft, Space Science Reviews, 131, 247–338 

How to cite: Rognini, E., Camplone, V., Zinzi, A., Mura, A., Milillo, A., Massironi, M., Rossi, A. P., Zucca, F., and Capria, M. T.: Mercury exploration with MATISSE tool, Europlanet Science Congress 2022, Granada, Spain, 18–23 Sep 2022, EPSC2022-658, https://doi.org/10.5194/epsc2022-658, 2022.

Coffee break
Chairpersons: Lina Hadid, Anna Milillo
Planetary Environment
17:30–17:40
|
EPSC2022-849
|
ECP
Johannes Brötzner, Herbert Biber, Noah Jäggi, Paul Stefan Szabo, Christian Cupak, Benjamin Cserveny, André Galli, Peter Wurz, and Friedrich Aumayr

Rocky bodies in space without a protective atmosphere like Mercury are subject to harsh conditions, including the bombardment by solar wind ions. This leads to the ejection of particles along with alteration of the surface properties like composition and morphology. These ion-induced sputter processes contribute to the formation of the Hermean exosphere [1]. Therefore, understanding the involved fundamental ion-solid interaction processes is important for the modelling of exosphere creation. From a computational standpoint, those impacts are usually investigated using simulation codes based on the Binary Collision Approximation (BCA) like SRIM [2] or SDTrimSP [3]. However, past studies revealed that especially for compound targets relevant as Hermean regolith analogues, simulations have to be adapted by means of modified input parameters to reproduce experimental results [4]. Thus, laboratory measurements are strongly needed to ensure that valid inputs enter the exosphere modelling.

A well-proven method for such investigations of sputtering is the Quartz Crystal Microbalance (QCM). It allows to measure sputter yields of thin films deposited onto a quartz resonator with high precision in real time and in situ [5]. Expanding on this technique, we use a setup in which we place a second QCM in the vicinity of the irradiated target, facing the centre of particle emission [6]. Ejecta that stick to its surface result in a mass accumulation, which is resolved through the piezoelectric properties of the quartz resonator. By moving this second catcher-QCM in an arc around the target, the angular emission characteristic of sputtered particles can be probed. The experimental realisation is sketched in figure 1. The setup also allows for experiments with targets that cannot be deposited onto a resonator or whose surface properties change during the deposition process. Particularly, the above-mentioned films used in, e.g. [4], are vitreous and smooth. We therefore extended our studies to pellets from ground and pressed mineral specimens that retain some roughness for a more realistic regolith analogue [7]. Through comparison of these measured angular distributions with reference samples, also total sputter yields can be determined for targets whose yields cannot be measured with a single QCM.

Figure 1: Sketch of the setup. A target is irradiated with an ion beam under an angle of incidence α. The angular distribution of ejecta (blue shaded area) is probed with the catcher-QCM by varying the angle αC.

We initially used a 2 keV Ar+ ion beam to irradiate both an enstatite (MgSiO3) film and a pellet under 60° and 45° incidence with respect to the sample surface normal. This choice of projectile has a high sputter yield and produces sufficient signal at the catcher-QCM to allow for a proof of principle. After initial hardships, modified sample preparation routines made reproducible quantification of the obtained data possible. We attribute differences in shape and magnitude of the sputtered particle angular distributions between the sample types to the different roughnesses of the sample configurations. Geometric considerations alone are sufficient to describe the qualitative behaviour of our results [8]. Simulation results to visualise the impact of surface roughness on the sputter yield as a function of incidence angle are given in figure 2. For a solar wind relevant projectile species, the same measurements were also carried out with a 4 keV He+ ion beam. This presentation will include the results from both the He and the Ar irradiation experiments.

Figure 2: Sputter yields Y for a perfectly smooth surface (as simulated by SDTrimSP, blue) and for the surface of an enstatite (MgSiO3) pellet used in this study in orange. The latter are obtained using a home-made code based on geometric considerations [8].


References

[1] P. Wurz et al.: Planet. Space Sci. 58, 1599, 2010
[2] J.F. Ziegler et al.: Nucl. Instrum. Methods Phys. Res. B: Beam Interact. Mater. At., 268, 1818, 2010
[3] A. Mutzke et al.: SDTrimSP Version 6.00. Max-Planck-Institut für Plasmaphysik, 2019
[4] P.S. Szabo et al.: Astrophys. J., 891, 100, 2020
[5] G. Hayderer et al.: Rev. Sci. Instrum., 70, 3696, 1999
[6] H. Biber et al.: EPSC2021, online, EPSC2021-526, 2021
[7] N. Jäggi et al.: Icarus, 365, 114492, 2021
[8] C. Cupak et al.: Appl. Surf. Sci., 570, 151204, 2021

How to cite: Brötzner, J., Biber, H., Jäggi, N., Szabo, P. S., Cupak, C., Cserveny, B., Galli, A., Wurz, P., and Aumayr, F.: Laboratory measurements to study the sputtering of Hermean surface analogues under He ion impact, Europlanet Science Congress 2022, Granada, Spain, 18–23 Sep 2022, EPSC2022-849, https://doi.org/10.5194/epsc2022-849, 2022.

17:40–17:50
|
EPSC2022-125
|
ECP
Noah Jäggi, Herbert Biber, Paul Stefan Szabo, Andreas Mutzke, Johannes Brötzner, Friedrich Aumayr, Peter Wurz, and André Galli

Surface sputtering, the process of energetic ions (e.g. from the solar wind) ejecting  particles from the surface, is one of the major processes to supply energetic particles to a thin, collisionless atmosphere on otherwise atmosphere-free celestial bodies. The energetic ejecta reach high altitudes or may escape the celestial body completely so they can be observed remotely from the ground or in-situ with a spacecraft. The accuracy of a model to reproduce the thin atmosphere surrounding exposed rocky bodies such as the Moon and Mercury therefore requires accurate sputter efficiencies.

Determining the sputter yields of the various species from a realistic mineral surface is still a work in progress [1]. Modeling of sputtering with commonly used Binary Collision Approximation (BCA) models such as TRIM [2] has been shown to overestimate the sputter yields compared to experimental data [3, 4]. The number of sputter experiments performed on rock forming minerals is growing steadily, however. We apply the latest results to obtain yields for a range of minerals from the state-of-the-art code SDTrimSP [5], which is an improved model based on the static TRIM and the dynamic TRIDYN [6]. 

We present a novel implementation of oxides as components to appropriatly represent mineral densities in SDTrimSP by distinguishing between bound and free O atoms in the simulation. We compare the oxide implementation to recent sputter yields obtained from mineral pellets and mineral-derived thin-film irradiation experiments [2,3,4]. One of our preliminary results is shown in Figure 1 where we compare the SDTrimSP sputter yields of the commonly used atomic model and the newly implemented oxide model with experimental data from [4]. For reference we also show the atomic model equivalent results from the widely used SRIM code. This work includes a parameter study including density, binding energy, and binding model and how they affect the resulting mineral sputter yields as well as the ejectas energy and angular distribution. We further elaborate on necessary experiments to better constrain the parameter spaces. 

Figure 1: Sputter yields of solar wind energy hydrogen ions on wollastonite (CaSiO3). SDTrimSP results for the default atomic model and the newly implemented oxide model recreate experimental data from [4] reasonably well compared to the commonly used SRIM.

[1] Jäggi, N., et al. (2021). Icarus, 365, 114492. 

[2] Ziegler, J.F., et al. (2010). Nucl. Instrum. Methods Phys. Res. B, 268, 1818–1823. 

[3] Biber H., et al. (2020). Nucl. Instrum. Methods Phys. Res. B, 480, 10. 

[4] Szabo, P.S., et al. (2018). Icarus, 314, 98–105.

[5] Mutzke, A., et al. (2019). SDTrimSP Version 6.00. Max-Planck-Institut für Plasmaphysik.

[6] Möller, W., & Eckstein, W. (1984). Nucl. Instrum. Meth. B., 2(1–3), 814–818

How to cite: Jäggi, N., Biber, H., Szabo, P. S., Mutzke, A., Brötzner, J., Aumayr, F., Wurz, P., and Galli, A.: The sputtering of Mercury surface analogues in models and experiments, Europlanet Science Congress 2022, Granada, Spain, 18–23 Sep 2022, EPSC2022-125, https://doi.org/10.5194/epsc2022-125, 2022.

17:50–18:00
|
EPSC2022-574
|
ECP
Nicolas Bott, Michelle S. Thompson, Kathleen E. Vander Kaaden, Mark J. Loeffler, and Francis M. McCubbin

Introduction

The surfaces of airless bodies across the solar system are continually altered due to their exposure to interplanetary space [1]. This process, known as space weathering (SW), is driven by solar wind irradiation and micrometeoroid bombardment. SW alters the microstructural, chemical, and spectral characteristics of grains on the surfaces of airless bodies across the solar system. The effects of SW vary with heliocentric distance (e.g., solar wind flux decreases further from the sun) and they are also linked to the initial surface composition of the body [2]. The effects of SW are well-understood for the Moon and S-type asteroids: darkening and reddening of spectra, and attenuated absorption bands in the visible-near infrared wavelengths. These spectral effects are driven by the production of metallic Fe nanoparticles (npFe) via both solar wind irradiation and micrometeoroid bombardment. However, for highly reduced bodies like Mercury, the microstructural, chemical, and spectral effects of SW are far less constrained. Due to its proximity to the Sun, Mercury experiences a more intense solar wind flux, as well as higher flux and velocity of micrometeoroid impactors [3]. It also has a unique surface composition: low Fe (<2 wt.%) [4] and high volatile content with regions particularly rich in graphite, up to 4 wt.% in the low reflectance material (LRM) [5]. To better understand the effects of this harsh SW environment at Mercury, laboratory experiments are crucial.

Here, we present analyses of the microstructural, chemical, and spectral characteristics of Mercury analog samples subjected to pulsed laser irradiation to simulate the short duration, high temperature events associated with micrometeoroid impacts.

Samples and methods

We prepared samples of forsteritic olivine at NASA’s Johnson Space Center (JSC), with various FeO contents representative of those at the surface of Mercury: F-T-004 (0.53 wt.% Fe) and F-S-002 (0.05 wt.% Fe), and SC-001 (San Carlos olivine, Fo90-91) as a standard sample comparable to previous experiments. The powdered samples (45–125 µm grain size) were mixed with graphite (5 wt.%) to simulate the high-carbon content of LRM. The mixtures were pressed into pellets at Northern Arizona University and irradiated with an Nd-YAG (λ=1064 nm) pulsed laser under ultra-high vacuum with 1 and then 5 pulses of ~6 ns (48 mJ/pulse). For more details on the samples preparation, see [6].

Infrared (0.65–2.5 µm) reflectance spectra of the samples were acquired using a Nicolet IS50 FTIR spectrometer. The surface morphology of the samples was analyzed by scanning election microscopy (SEM) using a FEI Nova NanoSEM200 at Purdue University. Finally, electron-transparent thin sections of the samples were prepared with a FEI Helios NanoLab 660 focused ion beam (FIB) for analysis with the 200 keV JEOL 2500 transmission electron microscope (TEM) at JSC.

Results

Near-infrared spectroscopy

The reflectance spectra show that the SC-001 sample becomes brighter and the 1 µm absorption band is deeper after 1 laser pulse, but after 5 total pulses the spectrum is darker and the band depth is lower than the unirradiated sample (Fig. 1a).