
Compositional and subsurface analysis of an outcrop close to Olympia Planum on Mars
 1,2,1,3,
- 1Geoscience Department of University of Padova, Padova, Italy(nicole.costa@inaf.it)
- 2Institute for Space Astrophysics and Planetology, IAPS-INAF, Rome, Italy
- 3Observatory of Padova, OAPD-INAF, Padova, Italy
- 4Centre of Studies and Activities for Space, CISAS, Padova, Italy
Introduction: In the Martian North Polar Cap, troughs are formed and enlarged by the erosive action of katabatic winds, blowing perpendicularly with respect to steep edges of the cap. Along these valleys deeper layering of the polar deposits are often exposed making it possible to study the stratigraphy of the upper part of the polar cap [1]. We focused our attention on a 140 km long and 500 m high scarp located in the North-Western edge, facing Olympia Planum, and where part of the North Polar Layered Deposits (NPLD) are exposed. NPLD deposits are finely layered and laterally continuous sequence of light and dark strata with sporadic unconformities in between, whose periodicity has been attributed to climatic and orbital variations [2]. In the polar cap, Tanaka et al. [3] has distinguished different polar units by means of surface image interpretation, hence our scarp exposes Planum Boreum 1 unit overlapped by Planum Boreum 3 unit, both composed of variable ice/dust content, but different thickness. Putzig et al. [4] identified instead seven units inside the polar cap on the basis of the pattern of radar reflections in the radargram-based stratigraphy thanks to the data provided by SHARAD. The stratigraphic sequence of our interest correlates with the upper part of the packet-inter-packet sequence of the unit G by Putzig et al. [4]. The aim of our work is to relate the composition and stratigraphy of the visible layered deposits with the subsurface radar reflectors, using the data acquired by the NASA Mars Reconnaissance Orbiter instruments.
Data selection: We performed stratigraphic and geomorphologic interpretation on images of the Context Camera (CTX) and High Resolution Imaging Science Experiment (HiRISE); band ratios and spectral signatures on a hyperspectral cube of the Compact Reconnaissance Imaging Spectrometer for Mars (CRISM); subsurface reconstructions on radar reflectors obtained by the Shallow Radar (SHARAD). The integration of the results obtained by such a multi-score data-set underlies the possibility to join the SHARAD stratigraphy with the stratigraphic record recognisable at the surface including its compositional variability (Fig.1).
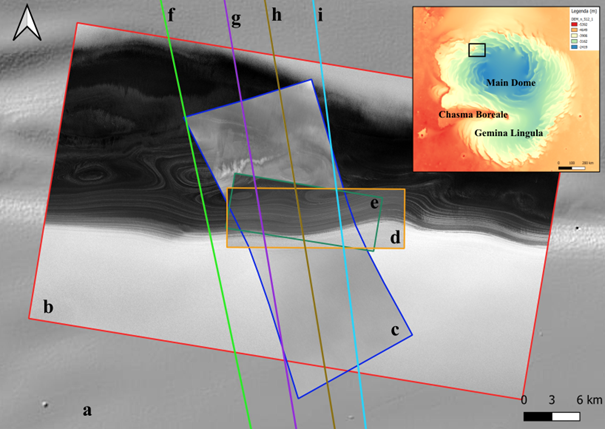
Fig.1 – Data-set: MOLA DEM (a), CTX image (b), CRISM cube (c), HiRISE images (d, e) and SHARAD radargram tracks (f, g, h, i). Black rectangle in the North Polar Cap region shows the study area.
Spectral analysis: Spectra for five Regions of Interest (ROIs) of about 50 pixels were acquired and are shown in Fig.2a-b.
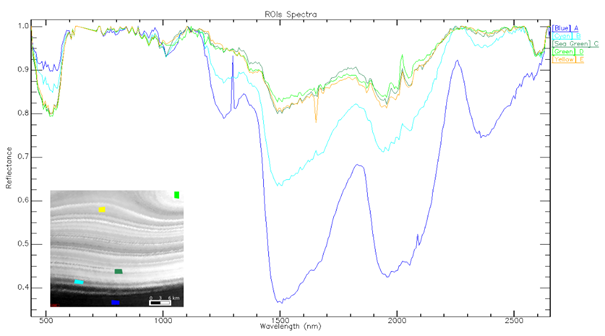
Fig.2 – (a) Regions of Interest over CRISM image detail; (b) Plot of five ROI average spectra: each colour line represents a ROI spectrum (continuum is removed).
The exposed stratigraphy is composed of different amount of dry ice, water ice and basaltic dust [3]. Spectra A and B are well distinguishable, whereas the signatures of C, D and E appear similar, indicating comparable compositions. Spectrum A exhibits well developed water-ice absorption bands (1.5 and 1.95 µm), less development of same peaks might imply an increase of dry ice content. The 1 µm peak (water ice) is well visible in both A and B spectra, but less evident in C, D and E. Multiple absorptions at 1.65 and 2.06 µm, associated to CO2, are well visible in C, D and E. Other absorption bands (at 0.50, 1.02 and 2.30 µm for example) can be related to femic and aqueous alteration minerals. Spectrum A is similar to the signature of pure water ice, with less altered minerals, while C, D and E appear to be characterized by dry ice and femic minerals. Spectrum B appear to be transitional between these two end-members.
Spectral indexes: Spectral indexes were produced using CRISM Analysis Toolkit (CAT) [5]. Indexes allowed us to create false colour images to highlight the presence/absence of specific minerals. Example of these are shown in Fig. 3 (see FED for the index definition).
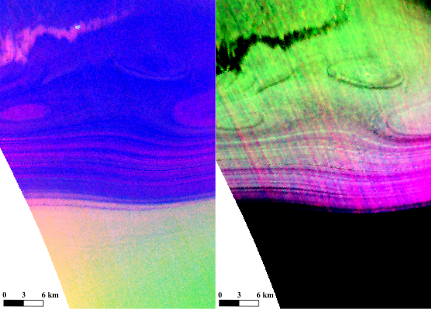
Fig.3 – Two false colour images created with spectral indexes (a) BDI1000VIS_BD15002_BD1435 representing ice compositions and (b) OLINDEX3_LCPINEX2_RBR to highlight mineral composition.
Mapping and correlation to radar reflectors: Geological units were identified on CRISM and CTX data on the basis of morphology, composition, albedo and their stratigraphic relationship. Fig.4 displays the mapped units.
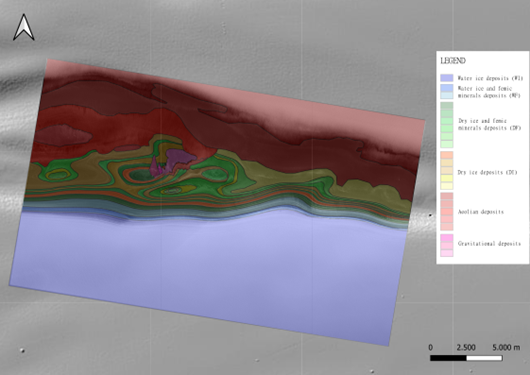
Fig.4 – Geological map and relative units. WI-units: water-ice-rich deposits (blue), WF-unit: water ice and femic minerals deposits (light blue); DF-units: dry ice and femic minerals deposits (green); DI-units: dry-ice-rich deposits (yellow); Aeolian deposits (red); Gravitational deposits (purple).
Fig.5 shows the geological units correlated with radargrams features. Variations of dielectric constant among strata are due firstly to presence of water ice in the surficial layers and dry ice in deeper ones, secondly to different amount of dust in radar units. These affect the signal reflectance: stronger if it is from water-ice layers. Additionally, high content of dust significantly decrease the radar signal, so units appear darker [4] [6]. The lines in Fig.5 represent lower contact of the geological units.
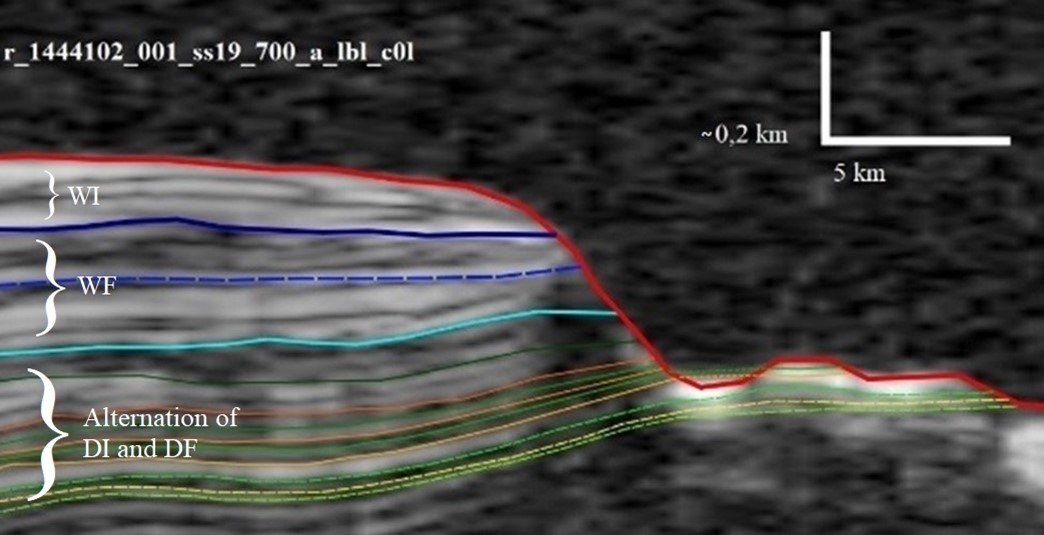
Fig.5 – Correlation between geological units and radar reflectors. The colours of units are the same of geological map (vertical axis in time). Section track is shown in Fig.1.
Discussion and conclusions: We provide a detailed compositional and geometrical characterization (using CRISM, HiRISE, CTX) of outcropping layered deposits of the North Polar Cap, to evaluate the potential for performing sound stratigraphic correlations with the subsurface reflectors identified in SHARAD radargrams. At a scale of single layers, compositional variations of basaltic dust content in the stratigraphic sequence were identified. This variability is visible especially in dry-ice-rich layers. Basaltic dust showed aqueous alteration, especially in water-ice-rich strata.
Acknowledgments: We acknowledge support from the EU’s H2020 research and innovation program under grant agreement N° 871149 (GMAP).
References: [1] Masse, M. et al. (2012) Earth and Planetary Science Letters, 317, doi: 10.1016/j.epsl.2011.11.035; [2] Byrne, S. (2009) Annual Review of Earth and Planetary Science, 37, doi: 10.1146/annurev.earth.031208.100101; [3] Tanaka, K. et al. (2008) Icarus, 196(2), doi: 10.1016/j.icarus.2008.01.021; [4] Putzig, N. et al. (2009), Icarus, 204(2), doi: 10.1016/j.icarus.2009.07.034; [5] Viviano-Beck, C. et al (2014), Journal of Geophysical Research, 119(6), doi: 10.1002/2014JE004627; [6] Lauro, S. et al. (2012), Icarus, 219(1), doi: 10.1016/j.icarus.2012.03.011.
How to cite: Costa, N., Massironi, M., Penasa, L., Nava, J., Pozzobon, R., and Ferrari, S.: Compositional and subsurface analysis of an outcrop close to Olympia Planum on Mars, Europlanet Science Congress 2022, Granada, Spain, 18–23 Sep 2022, EPSC2022-167, https://doi.org/10.5194/epsc2022-167, 2022.