The Mercury surface investigated with Principal Component Analysis and Spectral Angle Mapper on MASCS/MESSENGER data
- INAF-IAPS, Institute for Space Astrophysics and Planetology, via del Fosso del Cavaliere, 100, 00133, Rome, Italy (anna.galiano@inaf.it)
Introduction
The surface of Mercury has been divided in several spectral units [1-4] as a result of the application of the Principal Component Analysis (PCA) on MDIS [5] photometrically-corrected images acquired during the first two MESSENGER flybys. The spectral units are mainly distinct for differences in reflectance and spectral slope, described as “red” or “blue” depending on a steeper or less steep slope than the average Mercury terrain in MDIS spectral range (395-1040 nm). The three major terrain classes are the Low-Reflectance Material (LRM), the Intermediate Terrain (IT), and Smooth Plains, which are in turn subdivided into High-reflectance Red Plains (HRP), Intermediate Plains (IP), and Low-reflectance Blue Plains (LBP). HRP are the brightest and reddest smooth plains; IP and IT are spectrally similar to the global mean; the LBP is intermediate between the IP and the LRM; the LRM is the darkest unit on Mercury [3]. Minor classes on Mercury are: fresh crater ejecta, hollows, and “red units” [1,4]. Fresh crater ejecta are interpreted to be among the least space-weathered materials on Mercury, for the higher reflectance and bluer spectral slopes than their mature counterparts [1]. Hollows are shallow, irregularly shaped, and rimless flat-floored depressions with bright interiors and halos and flat spectral slopes [4]. The red units are distinguished in red material (RM) emplaced during the impact process [6] and pyroclastic deposits, formed after explosive eruptions [1,2,7]. The spectral units on Mercury were also classified with MASCS data [8]: a PCA and a cluster analysis was applied on MASCS spectra acquired during the first two MESSENGER flybys and not corrected for viewing geometries[9].
In this work, we applied the unsupervised classification PCA and the supervised classification Spectral Angle Mapper (SAM [10]) on photometrically-corrected [11] MASCS spectra acquired during the MESSENGER orbit phases.
Dataset
MASCS employed a Cassegrain telescope to simultaneously feed an UltraViolet and Visible Spectrometer (UVVS) and a Visible and Infrared Spectrograph (VIRS). VIRS was a point spectrometer equipped with two detectors operating in the Visible (VIS, 300-1050 nm) and Near-Infrared (NIR, 850-1450 nm) range, and characterized by a spectral sampling of 5 nm. The PCA and SAM classifications were applied on 21 channels of VIRS reflectance spectra, with a spectral sampling of 25 nm and spanning from 300 nm to 800 nm. To analyse high quality data, the VIRS dataset was filtered for observing angles (incidence and emission angles lower than 65°), temperature of VIS detector (less than 30°C), and footprint size (length lower than 25 km and length/width ratio lower than 10), as already performed in [12].
Results
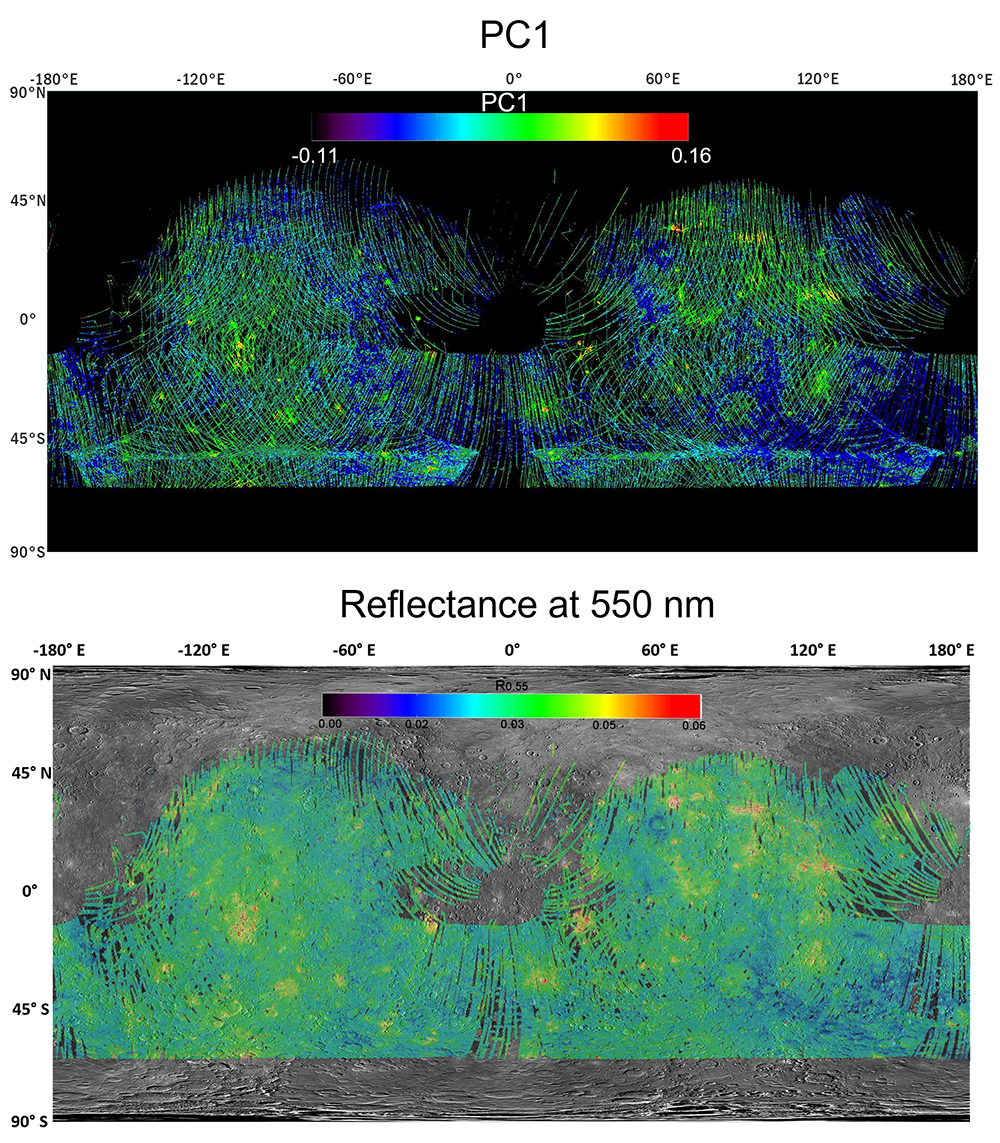
The PCA uses a linear transformation of data to translate and rotate the data into a new coordinate system that maximizes their variance [13]. As a result, the primary PCs, i.e. PC1, PC2, and PC3 are responsible for the 98.72%, 0.95%, and 0.17% of the spectral variability in the dataset. The spectral variation of PC1 appears to be coincident with that of the reflectance at 550 nm (Figure 1); a similar correlation has been observed for the PC2 and the VIS Slope (estimated in the 500-800 nm range), and for the PC3 and the UV Slope (estimated in the 300-400 nm range). The secondary PCs (PC4-PC21) covers the 0.16% of the total variance, and are increasingly dominated by the noise, useless therefore for the analysis. By combining the PC1, PC2, and PC3 maps in an RGB image, the minor terrains, i.e. hollows, fresh ejecta, and red units are readily distinguishable, as well as the LRM and the HRP major terrains.

Figure 1. Upper image: Map of PC1. Bottom image: Map of Reflectance at 550 nm
The SAM compares spectra of the dataset with spectra used as end-members and estimates the spectral similarity between two spectra by calculating the “spectral angle” between them, since the spectra are considered as vectors in a n-dimensional space (n is the number of bands, 21 in our case) [10].
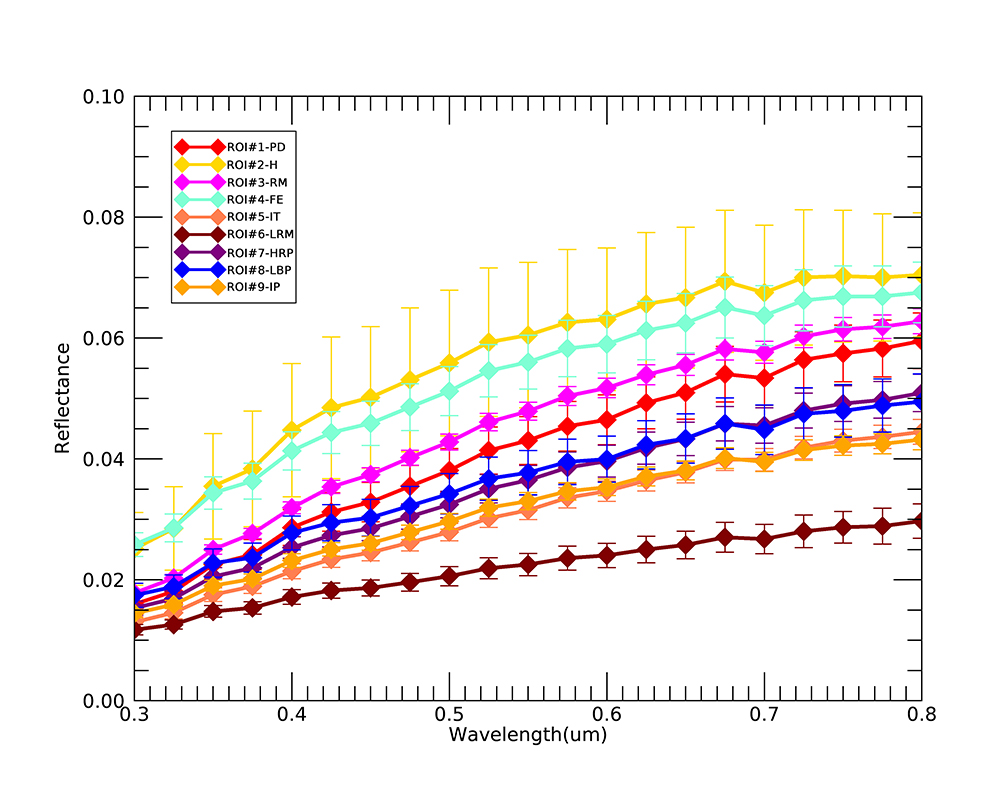
We used the mean spectra of representative regions for each major and minor terrain as end-members driving the classification. In particular, the mean spectra (Figure 2) of each region has been obtained from 10-15 pixels, where each pixel is a VIRS reflectance spectrum with 21 channels.

Figure 2. Mean spectra of the major and minor terrains used to drive the SAM classification
Then, we used multiple angles to perform the classification, i.e. we defined specific variability of spectral angles for each class in order to maximize the spectral variability of the classes and minimize false results. After the application of SAM on VIRS dataset, the surface of Mercury has been classified in 9 classes: the 87.5% of the data is classified as smooth plains (26% HRP, 18.7% LBP, and 42.8% IP), the 2.8% as IT, the 6% as LRM, and the minor classes represent the 3.8% of the dataset (2.2% fresh ejecta, 1% red material, 0.5% pyroclastic deposits, 0.1% hollows).
Results from PCA and SAM are compared to derive the chemical/physical properties of Mercury surface.
References: [1]Robinson et al. (2008) Science 321. [2]Murchie et al. (2008) Science 321. [3]Denevi et al. (2009) Science 324. [4]Blewett et al. (2009) EPSL 285. [5]Hawkins et al. (2007) SSR 131. [6]Ernst et al. (2010) Icarus 209. [7]Head et al. (2008) Science 321. [8]McClintok and Lankton (2007) SSR 131. [9] D’Amore et al. (2011) LPSC XLII. [10]Yuhas et al. (1992) JPL Publication 92–41. [11] Izenberg et al. (2014), Icarus, 228, 364-374. [12] Galiano et al. (2022) LPSC LIII. [13] Richards, 1994 Remote Sensing Digital Image Analysis: An Introduction, Springer.
Acknowledgments: We gratefully acknowledge funding from the Italian Space Agency (ASI) under ASI-INAF agreement 2017-47-H.0
How to cite: Galiano, A., Capaccioni, F., Filacchione, G., and Carli, C.: The Mercury surface investigated with Principal Component Analysis and Spectral Angle Mapper on MASCS/MESSENGER data, Europlanet Science Congress 2022, Granada, Spain, 18–23 Sep 2022, EPSC2022-199, https://doi.org/10.5194/epsc2022-199, 2022.

