
Thermal modelling of Mercury’s surface for the MERTIS instrument
 1,2,1,4
- 1Aix Marseille Univ, CNRS, CNES, LAM, Marseille, France (olivier.groussin@lam.fr)
- 2Image Analysis Group, TU Dortmund University, Otto-Hahn-Str. 4, 44227 Dortmund, Germany
- 3Institut für Planetologie, Wilhelm-Klemm- Str.10, 48149, Germany
- 4Institute for Planetary Research, DLR, Rutherfordstrasse 2, 12489 Berlin, Germany
Context – The Bepi-Colombo mission (ESA-JAXA) will reach Mercury in December 2025 (Benkhoff et al. 2021). Onboard, the Mercury Radiometer and Thermal Infrared Spectrometer (MERTIS; Hiesinger et al. 2010) will study the surface composition and map the surface temperature. The interpretation of the MERTIS data requires a dedicated thermal model, able to predict accurately the surface temperature at any location and any time on Mercury. Previous works on this topic have been performed by, e.g., Wohlfarth et al. (2021, 2022). The scientific objectives are to produce thermal inertia maps, to look for thermal anomalies (cold or hot spots), to look at the icy environment (polar cups craters), and to determine the thermal continuum for compositional studies.
Thermal model – We developed a thermal model that considers solar heating, thermal emission, heat conductivity, projected shadows, and self-heating (i.e. mutual heating of facets seeing each other’s). This thermal model is inherited and adapted from our previous works on small bodies (e.g. Groussin et al. 2004). Our thermal model is applied to the USGS Digital Elevation Model of Mercury with 20 million facets, and run for six revolutions of Mercury, i.e. three complete thermal cycles, until convergence. The geometry is computed by the OASIS software (Jorda et al. 2016). The thermal model is parallelized, and for a given set of parameters (typically for a given thermal inertia), it runs in two hours for a polar cup (1.4 million facets) on a 24 cores CPU PC. The output of the model is the surface temperature map, for any position (time) of Mercury on its orbit, and for various thermal inertia. The surface temperature can then be used to compute the spectral energy distribution, to be compared with the MERTIS data.
Preliminary results – We applied our thermal model to the Northern polar cup of Mercury. Figure 1 shows the maximum surface temperature over one complete thermal cycle, i.e. two revolutions of Mercury, for a thermal inertia of 50 J/K/m2/m1/2. The maximum temperature varies strongly across the surface, and many surface morphologies like craters are still visible in the thermal infrared, with the side facing the pole being colder than the side facing the equator. Many blue patches are also visible, inside craters, and correspond to areas of permanent shadows, where the temperature is constantly below 150 K, allowing the presence of exposed water ice. Those results are similar to those obtained by Paige et al. (2013), also discussed by Chabot et al. (2019).
Perspectives – The current shape model, with 20 million facets, provides a spatial resolution of 3.7 km2 per facet on average, while the MERTIS instrument will have a spatial resolution up to 0.1 km2 per pixel (at 400 km altitude). Even though the topography is crucial for thermal models, unresolved surface roughness further influences the thermal behavior, but occurs on much smaller scales of approximately 0.5 – 1 cm (Bandfield et al. 2015). The current standard is therefore to include a model that addresses surface roughness to mitigate directional effects, which are due to shadowing and self-heating. We will do this by adding fractal roughness, as we already did in the past for small bodies in particular (Davidsson et al. 2015), as illustrated in Figure 2.
References
Bandfield et al. 2015, Icarus 248, 357
Benkhoff et al. 2021, Space Science Review 217, 90
Chabot et al. 2019, Mercury – The view after MESSENGER, Cambridge Univ. Press, 13
Davidsson et al. 2015, Icarus 252, 1
Groussin et al. 2004, Astronomy & Astrophysics 419, 375
Hiesinger et al. 2010, Planetary and Space Science 58, 144
Jorda et al. 2016, Icarus 277, 257
Paige et al. 2013, Science 339, 300
Wohlfarth et al. 2021, LPSC conference 52, 2548
Wohlfarth et al. 2022, LPSC conference 53, 2431
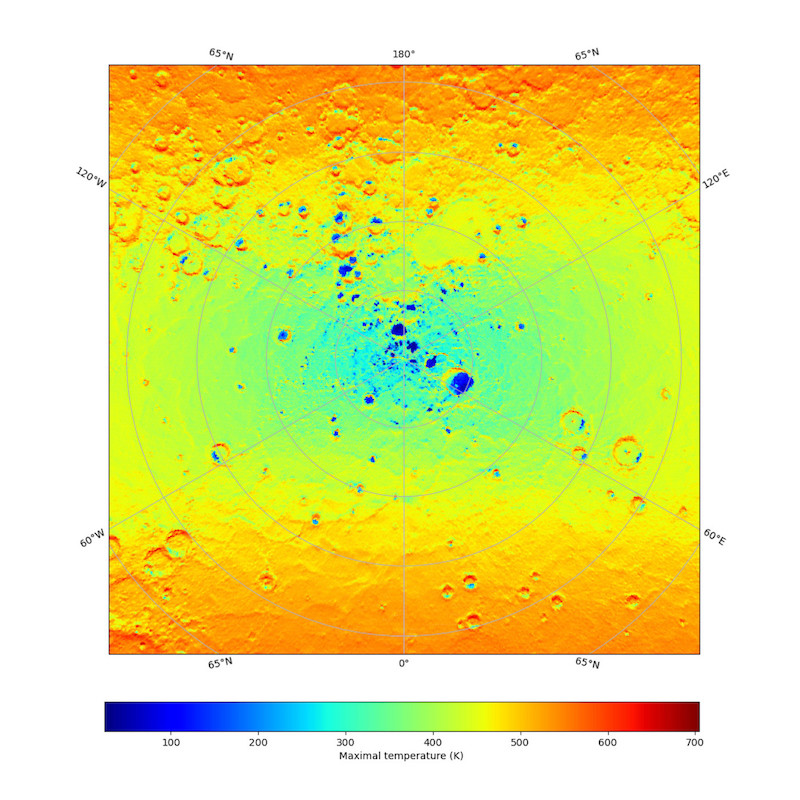
Figure 1 – Maximum surface temperature on the Northern polar cup of Mercury, for a thermal inertia of 50 J/K/m2/m1/2. The blue areas are in permanent shadows, inside craters, with a temperature constantly below 150 K, allowing the presence of exposed water ice.
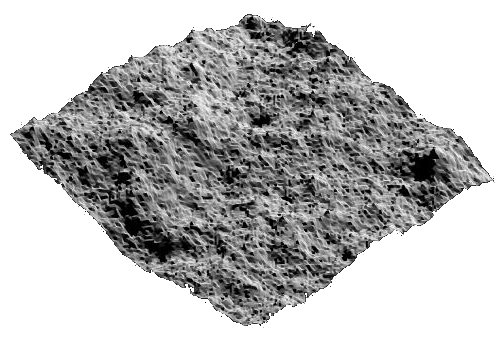
Figure 2 – Example of a terrain with 32000 facets, on which we added fractal roughness, with a fractal dimension of 2.2.
How to cite: Groussin, O., Wohlfarth, K., Vernazza, P., Hiesinger, H., and Helbert, J.: Thermal modelling of Mercury’s surface for the MERTIS instrument, Europlanet Science Congress 2022, Granada, Spain, 18–23 Sep 2022, EPSC2022-202, https://doi.org/10.5194/epsc2022-202, 2022.