
Nippur Sulcus from 2D to 3D: A Multidisciplinary approach in preparation for JUICE
 1,1,1,2,3,1,
- 1INAF-IAPS, Via del Fosso del Cavaliere 100, 00133 Roma, Italy (federico.tosi@inaf.it)
- 2INAF- OAPd, Vicolo dell’Osservatorio, 5, 35122 Padova, Italy
- 3INAF-IRA, Via Piero Gobetti 101, 40129 Bologna, Italy
- 4Università degli Studi di Napoli “Parthenope”, Dipartimento di Scienze e Tecnologie (DiST), Centro Direzionale, 80143 Napoli, Italy
Summary. We focus on a portion of the Nippur Sulcus region on Ganymede, which is currently promising for a multisensor data analysis. We first combine data acquired by the Galileo/SSI framing camera and by the Galileo/NIMS imaging spectrometer. We then apply a self-similar clustering technique able to explain how the grooves visible on the surface are distributed inside the icy crust. Finally, we apply a simple model to obtain a synthetic topographic dataset based on the existing optical dataset, which is used to simulate radar echoes coming from the RIME instrument with the goal of evaluating the magnitude of clutter noise.
Geological and compositional context. We first focus on optical images obtained by the Galileo/SSI framing camera on a portion of Nippur Sulcus bordering Galileo Regio to the east and Marius Regio to the west (167.4°E–193.5°E and 16.8°N–38.2°N) (Fig. 1). This region includes different terrain units, such as dark terrains, grooved terrains, and the palimpsest crater Epigeus [1].
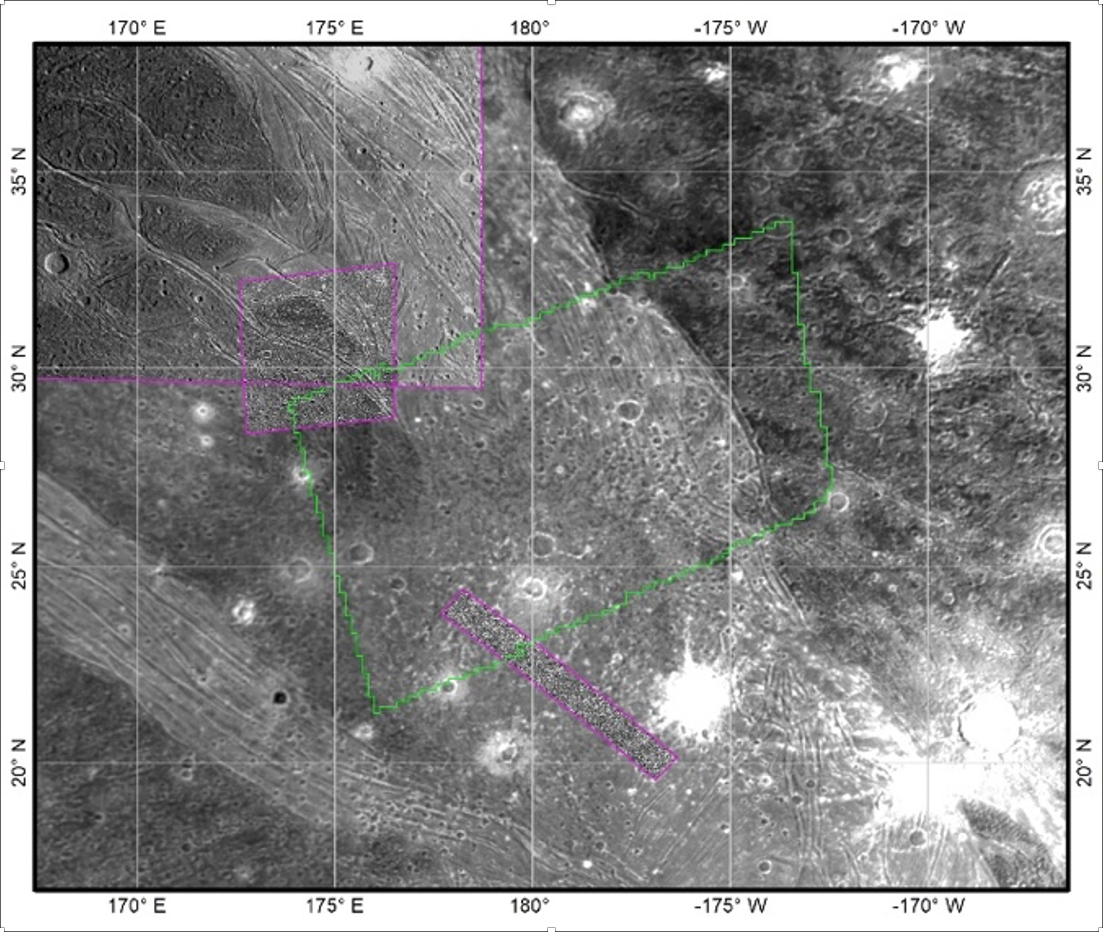
Fig. 1. Overview of the Nippur Sulcus region of inter-est used for our case study, from Ganymede’s optical basemap (1 km/px). The violet contours highlight the regions for which high-resolution optical imagery is available, while the green contour highlights the region covered by hyperspectral, near-infrared (NIMS) data (see Fig. 2).
The coverage obtained by the Galileo/NIMS imaging spectrometer [2] allows for the combination of geologic and compositional information, using specific spectral indices such as an IR slope, the 2-μm band depth, and a IR ratio, which can account for the distribution of contaminants, water ice, and grain size, respectively (Fig. 2).
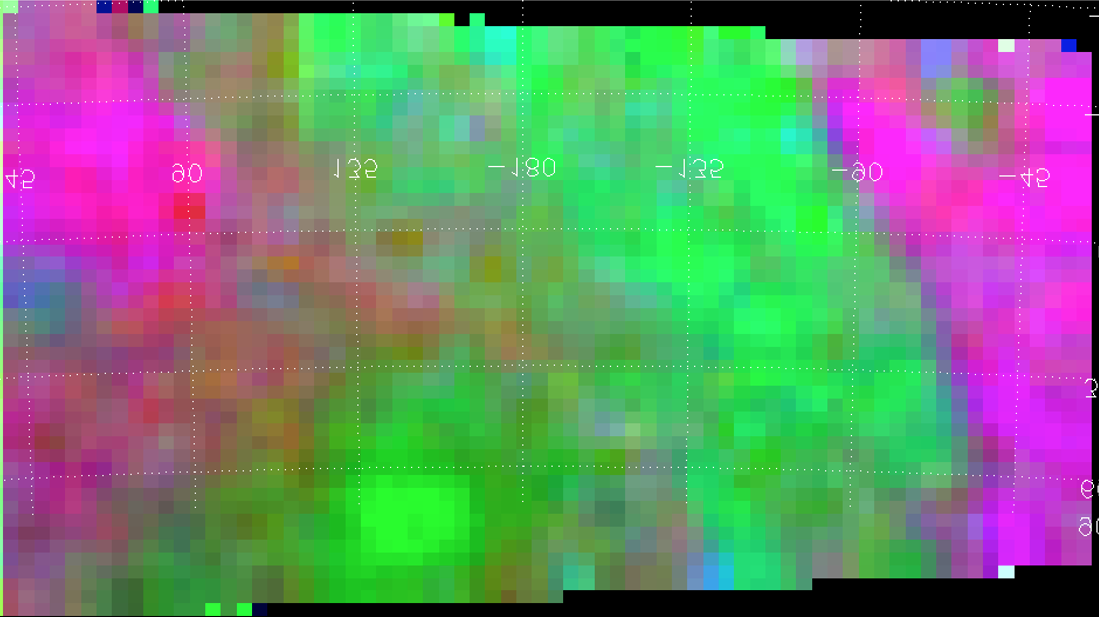
Fig. 2. NIMS Color composite map covering the Nip-pur Sulcus region at a spatial resolution of 6.7 km/px (R: IR slope 1.10-2.25 µm, G: 2-µm band depth, B: IR ratio between 3.6 µm and 1.82 µm). In the adopted color scheme, green marks high albedo, large (100s µm) regolith grains and stronger water ice band, while magenta is associated with dark terrain where the 2-µm water ice band is shallower and the grain size is smaller (10s of µm).
Grooves’ length and fractal analysis. On the selected region of interest within Nippur, we establish a link between geology and geophysics, namely between what is seen on the surface at visible to infrared wavelengths, and Ganymede’s shallow subsurface, which is still largely unknown today. To do so, we analyse the grooves’ length and spatial distribution to estimate the potential thickness of the icy crust above the deep ocean required to develop the grooves. A fractal approach, namely a self-similar clustering method, allows us to determine the maximum depth at which grooves can penetrate the icy subsurface [3, 4]. As a result, the grooves mapped in the Nippur Sulcus region in principle could penetrate the ice crust up to 130-145 km (Fig. 3).
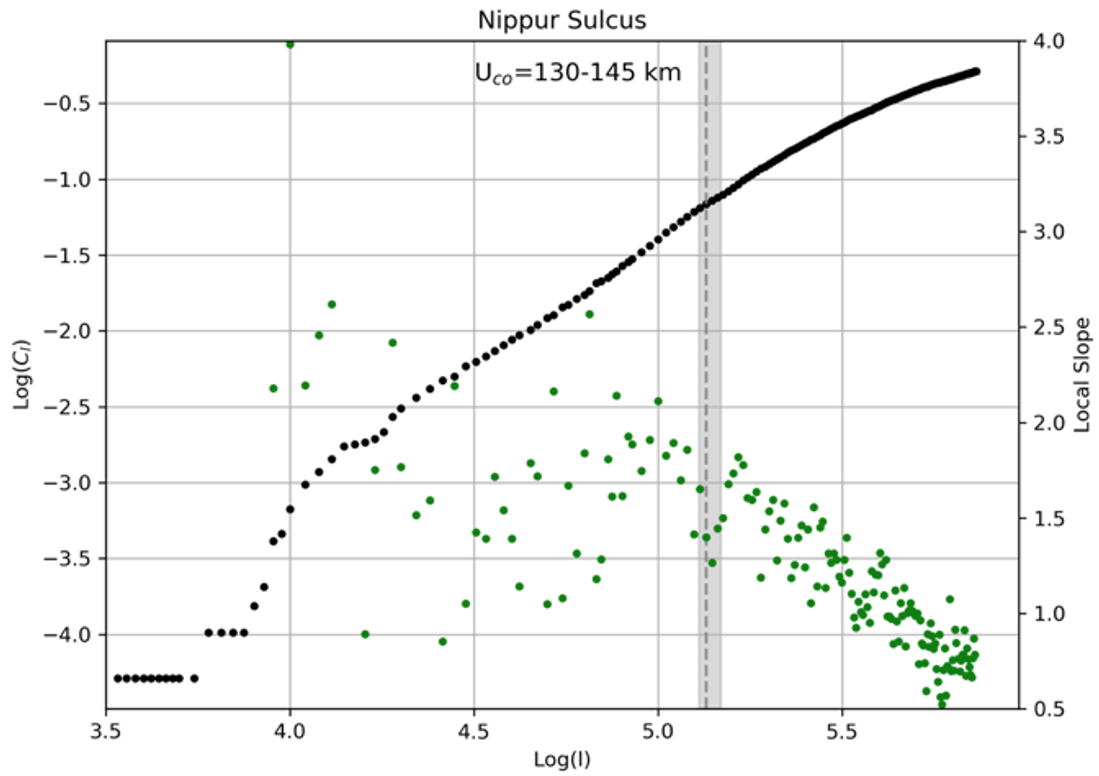
Fig. 3. A self-similar clustering method allows us to determine the maximum depth up to which grooves can penetrate the icy subsurface. To do this, we calcu-late an integral correlation coefficient within certain length ranges. In this plot, the x axis is the logarithm of these threshold lengths, while the y axis represents the logarithm of the correlation coefficient (on the left) and what is called the local slope (on the right, which is the point-by-point measurement of the slope of the tangent to the curve). As a result, the grooves mapped in the Nippur Sulcus region in principle could pene-trate the ice crust up to 130-145 km, which is in agreement with independent estimates of the average thickness of the icy shell.
Simulation of radar surface scattering at RIME frequencies. The Radar for Icy Moon Exploration (RIME) is one of the payload instruments aboard the JUICE spacecraft [5]. Operating at a central frequency of 9 MHz, and transmitting either a 3-MHz or a 1-MHz bandwidth (corresponding to a range resolution in water ice of about 30 m and 90 m respectively), RIME is tasked to explore the subsurface of Ganymede, Europa and Callisto down to a depth of several kilometres. However, clutter noise from rougher terrains is a limiting factor in the detectability of deeper, weaker reflections from the subsurface. The application of a coherent model of surface scattering to a roughness model of Nippur Sulcus demonstrates that clutter decays much slower than on Mars for a Ganymede-like topography (Fig. 4), which creates a challenge for the scientific interpretation of future RIME data.
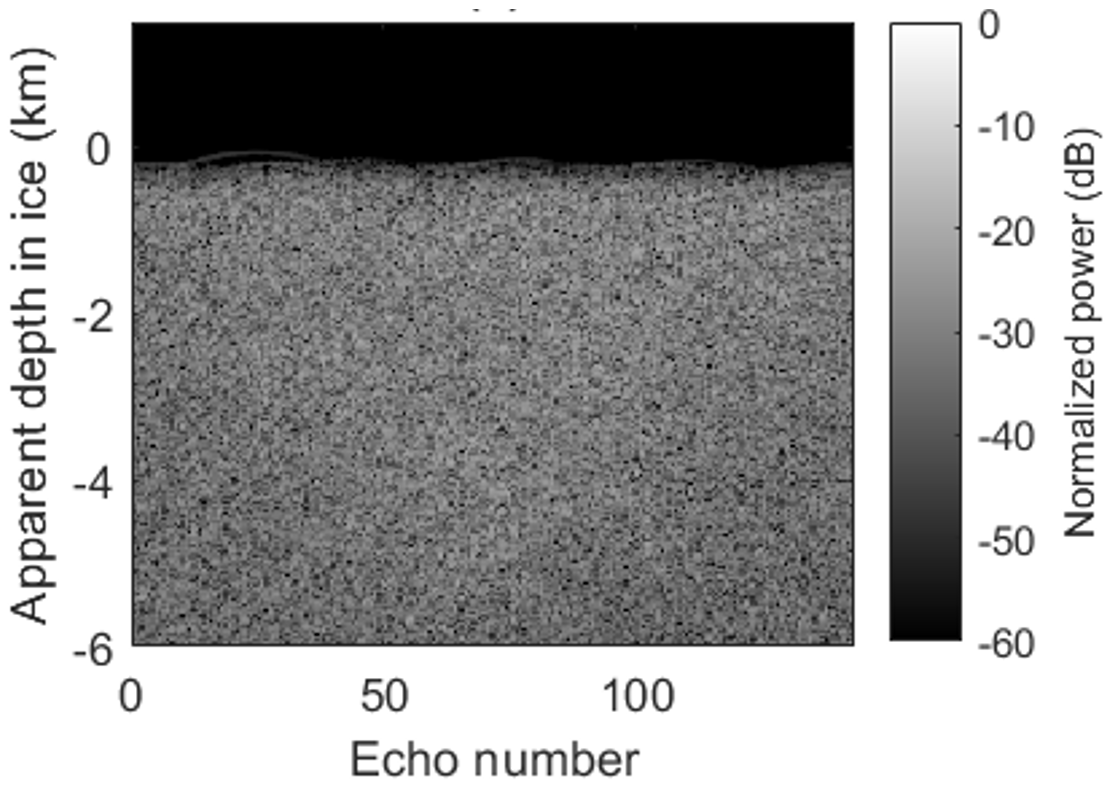
Fig. 4. Radargram of simulated surface echoes pro-duced for a subset of Nippur Sulcus, for a 3-MHz bandwith pulse. The time delay of echoes has been converted to the depth in water ice from which a radar echo would have the same time delay. The radargrams have been cropped to show only the part of the echoes that is unaffected by the finite size of the pseudo-topographic model.
Conclusions. The case of Nippur Sulcus is well suited to test what could be closely observed in the future by different instruments onboard the JUICE mission, combining remote sensing data probing the surface and theoretical modeling aimed at the geophysical study of the satellite’s subsurface. The merits and issues brought to light by our study should be taken into account to achieve a broader understanding of the physical processes linking Ganymede’s surface and subsurface.
Acknowledgements: We acknowledge support from the research project: “Ganymede from 2D to 3D: A multidisciplinary approach in preparation for JUICE”, selected in 2019 in the framework of an “INAF Mainstream” call.
References: [1] Collins G. C., et al., Global geologic map of Ganymede: U.S. Geological Survey Scientific Investigations Map 3237, pamphlet 4 p., 1 sheet, scale 1:15,000,000 (2013). [2] Carlson R. W, et al., Space Sci. Rev. 60, 457-502 (1992). [3] Lucchetti A., Pozzobon R., Mazzarini F., Cremonese G., Massironi M. (2017). Icarus 297, 252-264. [4] Lucchetti A., Rossi C., Mazzarini F., Pajola M., Pozzobon R., Massironi M., Cremonese G. (2021). Planet. Space Sci. 195, article id. 105140. [5] Bruzzone L., Croci R. (2019). Proceedings of the 2019 IEEE 5th International Workshop on Metrology for AeroSpace, Turin (Italy), 19-21 June 2019.
How to cite: Tosi, F., Filacchione, G., Galluzzi, V., Lucchetti, A., Orosei, R., Zambon, F., Cremonese, G., Palumbo, P., and Piccioni, G.: Nippur Sulcus from 2D to 3D: A Multidisciplinary approach in preparation for JUICE, Europlanet Science Congress 2022, Granada, Spain, 18–23 Sep 2022, EPSC2022-215, https://doi.org/10.5194/epsc2022-215, 2022.