OPS3
Session assets
Orals: Mon, 19 Sep, 17:30–18:30 | Room Andalucia 2
Introduction: Ganymede´s surface can be subdivided into dark and light terrain [1]. The dark terrain covers 35% of the surface, is composed of relatively low albedo material and high crater density. The 65% light terrain is characterized by higher albedo and a lower crater density indicating a relatively younger age [2]. Omnipresent morphotectonic structures such as grooves within the light terrain suggests a more recent activity of this terrain with respect to the dark terrain. The assemblage of lineated grooves has been interpreted as extensional zones similar to the Earth continental rifts, resulting from a global expansion that affected the satellite crust in the past [3]. Figure 1a and b show the spatial distribution of Ganymede’s dark terrain.
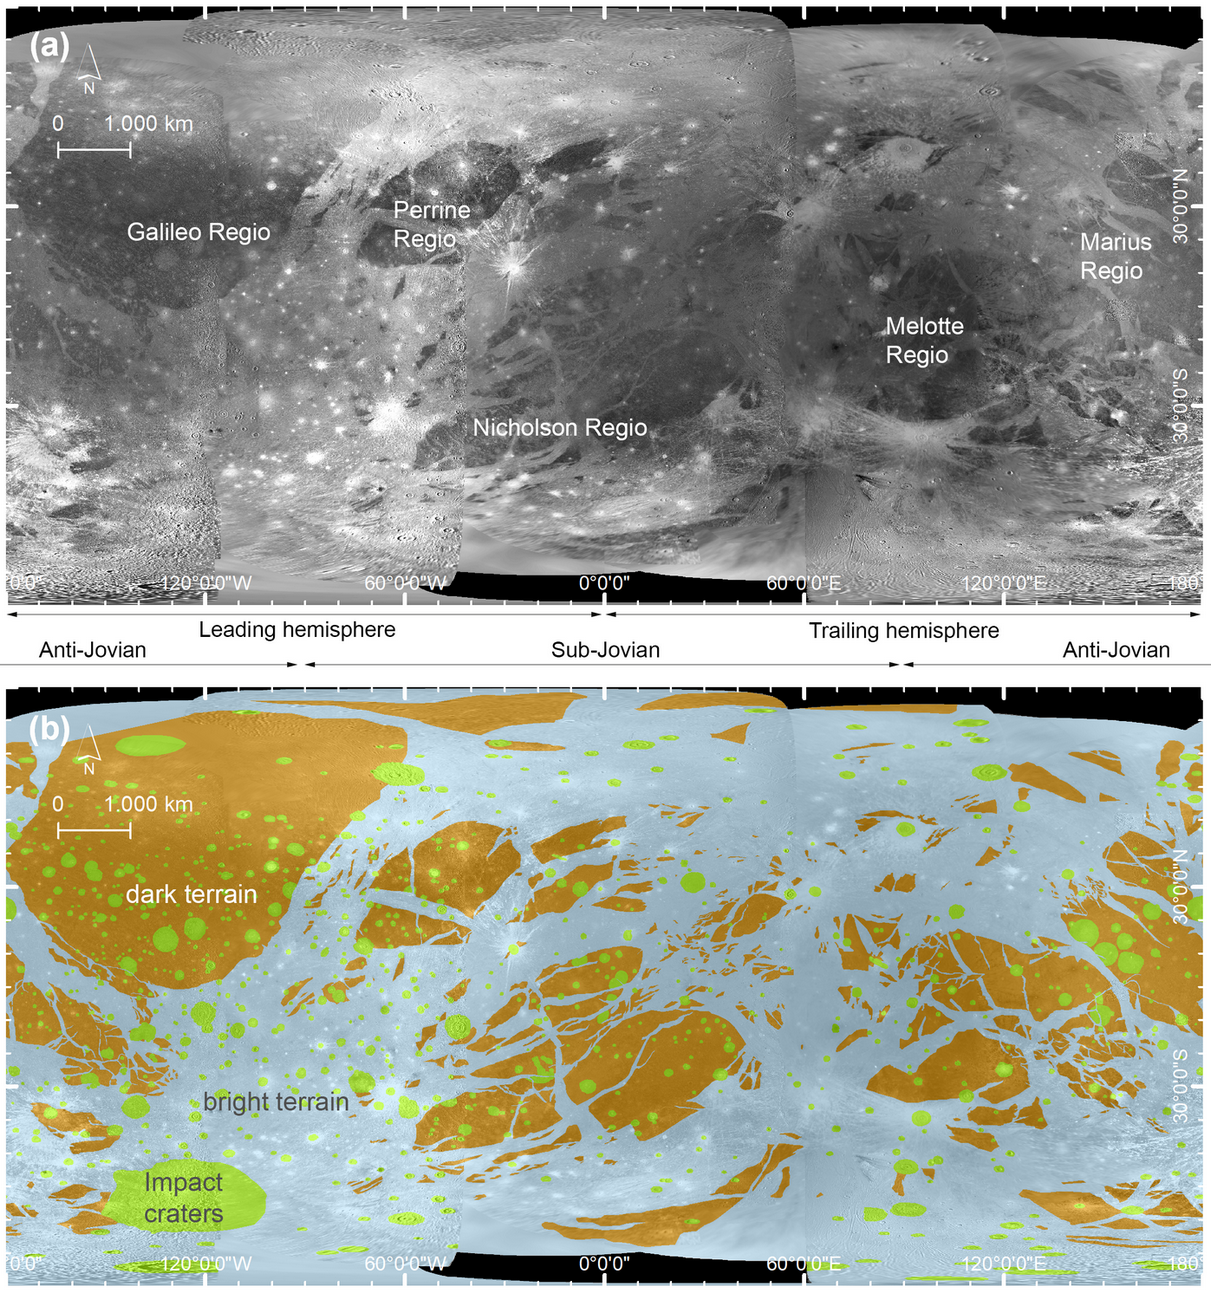
Figure 1: Global Mosaic and terrain distribution. (a): Global mosaic of the surface of Ganymede by images of Voyager 1+2 and Galileo Solid State Imagery (SSI) (Becker et al., 2001; Schenk, 2010). (b): Simplified geological map displaying the distribution of the bright and dark terrains as well as impact craters. Data from [1].
Objectives: Neighboring dark terrains (see Fig. 1a and b) often show obvious fitting pattern with respect to their external shape, suggesting that the areas have drifted apart by extension. We intend to reconstruct magnitude and orientation of the finite extension between adjacent dark terrains by restoring their original shape. The kinematic restoration allows to better understand the global tectonic movement pattern and may ultimately help to address the issue whether the individual dark terrains once formed a single terrain covering the entire, smaller moon surface.
Methods: We used the global Ganymede image mosaic that was compiled by using a combination of Voyager 1 and 2 and Galileo images. [4-6]. The mosaic from the USGS can be found at the Annex of the PDS Cartography & Imaging Sciences Node (SIM 3237). Using ESRI's ArcMap 10.7 software polygons of all dark terrains were created in accordance to the geological mapping by [1]. When translating and rotating dark terrain polygons, there is the fundamental problem of distortion according to the projection in use. We therefore defined 32 regions, where dark terrains are particularly abundant and centered the stereographic projection upon every of these regions to minimize the distortion and maintained the angles when shifting the polygons. An example of the translation process is shown in Fig. 2. For every patch a repetitive procedure is chosen to reverse the extensional movements and shift the polygons back together. This repeats until finally all of the dark terrains more or less match up along their borders. The relative movement vectors on the sphere can then be computed by taking the centroid of each polygon both in the original and the final shapefile. The resulting vectors (Fig. 4) represent magnitude and direction of the extension of dark terrains since its break-up.
Results and Discussion: Figure 3 shows the results of the shifting and fitting procedure of the dark terrain polygones. Figure 3a shows the distribution of dark terrains in their present day position. Figure 3b shows the regional closure of smaller rift zones in each of the patches. Figure 3c shows the result of closing large gaps and Figure 3d a step towards a hypothetic “super-dark-terrain”. With increasing distance between the dark terrains, the reconstruction becomes more difficult and is not always unambiguous. Figures 4a and b show the translation vectors centered to the midpoint of each dark terrain and a possible “break-up” center with the deviation of each vector thereof. Vectors are color-coded with respect to the displacement between the present-day position (arrow origin) and the position after restoration (arrowhead). Vectors show a complex displacement pattern that is not solely the result of a ballooning effect but also indicates movements by intrinsic forces.
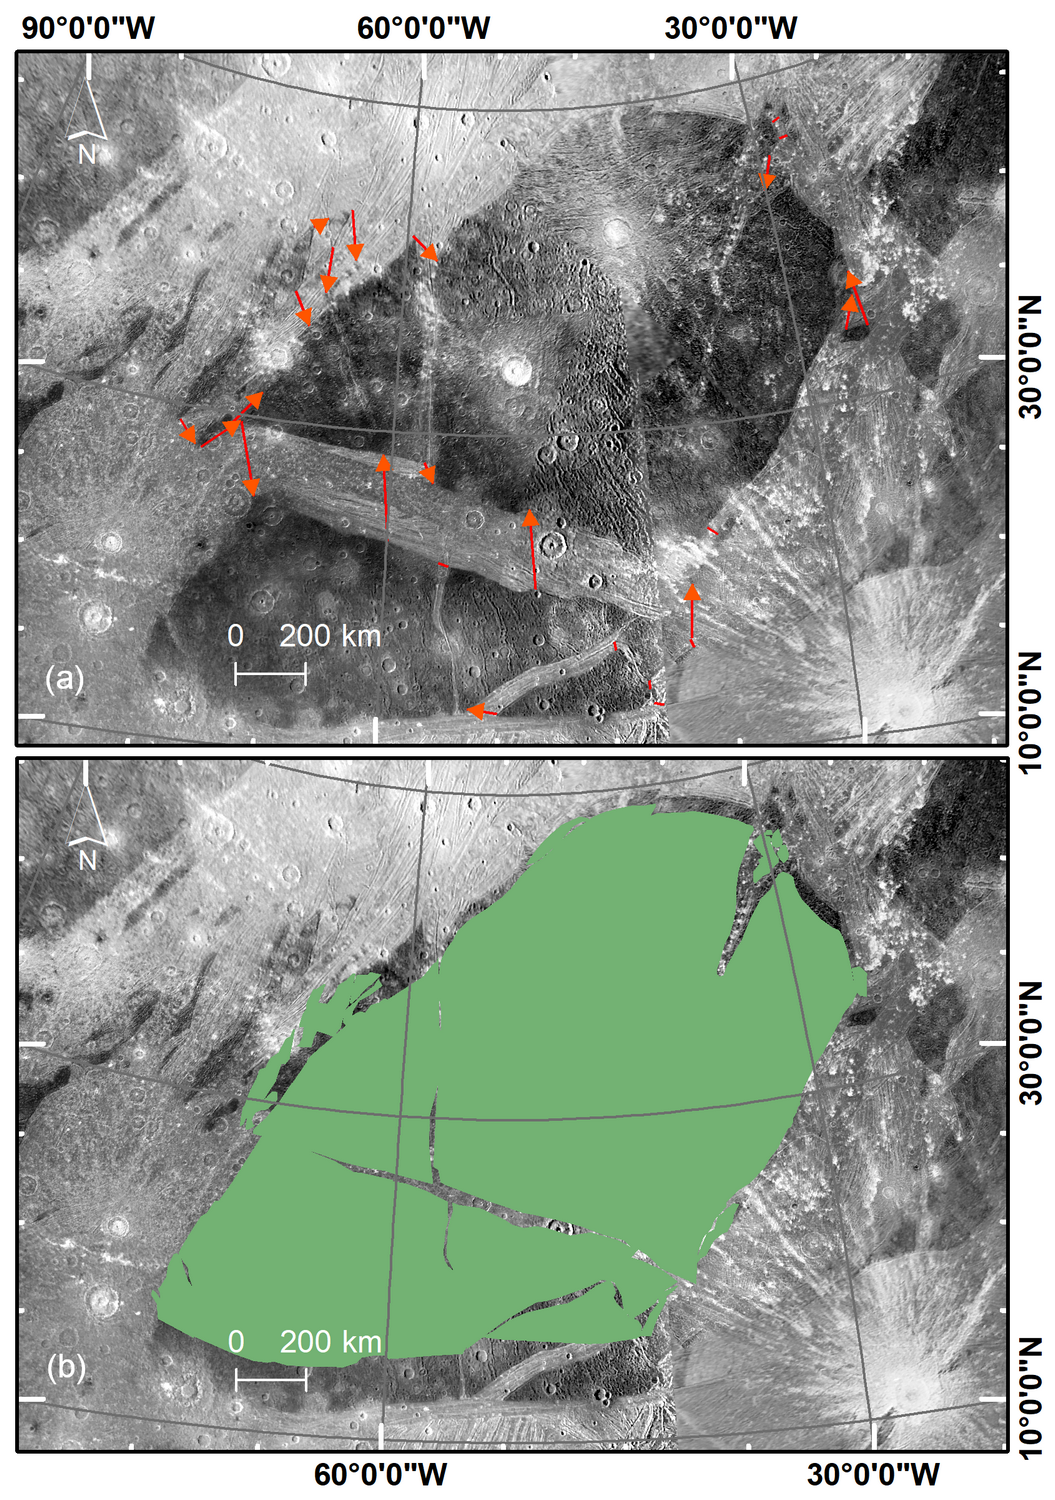
Figure 2: Example of the translation process of Perrine Regio (Stereographic Projection). (a) Dark terrains with indication of piercing points (arrows). (b) final small-scale restoration. An obvious fitting pattern along the edges of adjacent dark terrains is clearly visible and can be inferred by extensional tectonism.
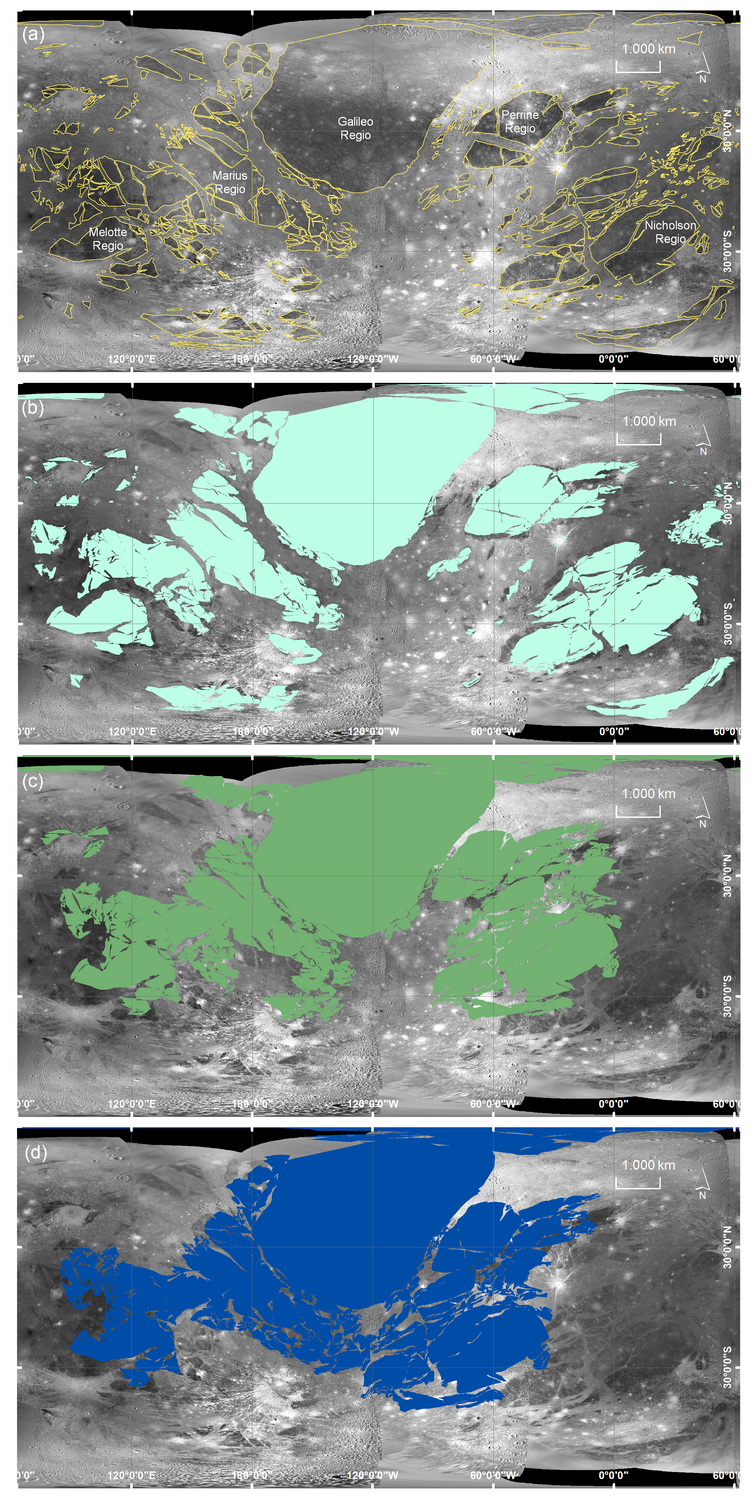
Figure 3: Palinspastic restoration of Ganymede's dark terrain. (a) Dark terrains at their present location outlined in yellow. (b) Intermediate restoration closing smaller gaps. (c) Final positions after reversing all the extensional features. (d) Hypothetic “super-dark-terrain”. Scale only representative at equator and meridians.
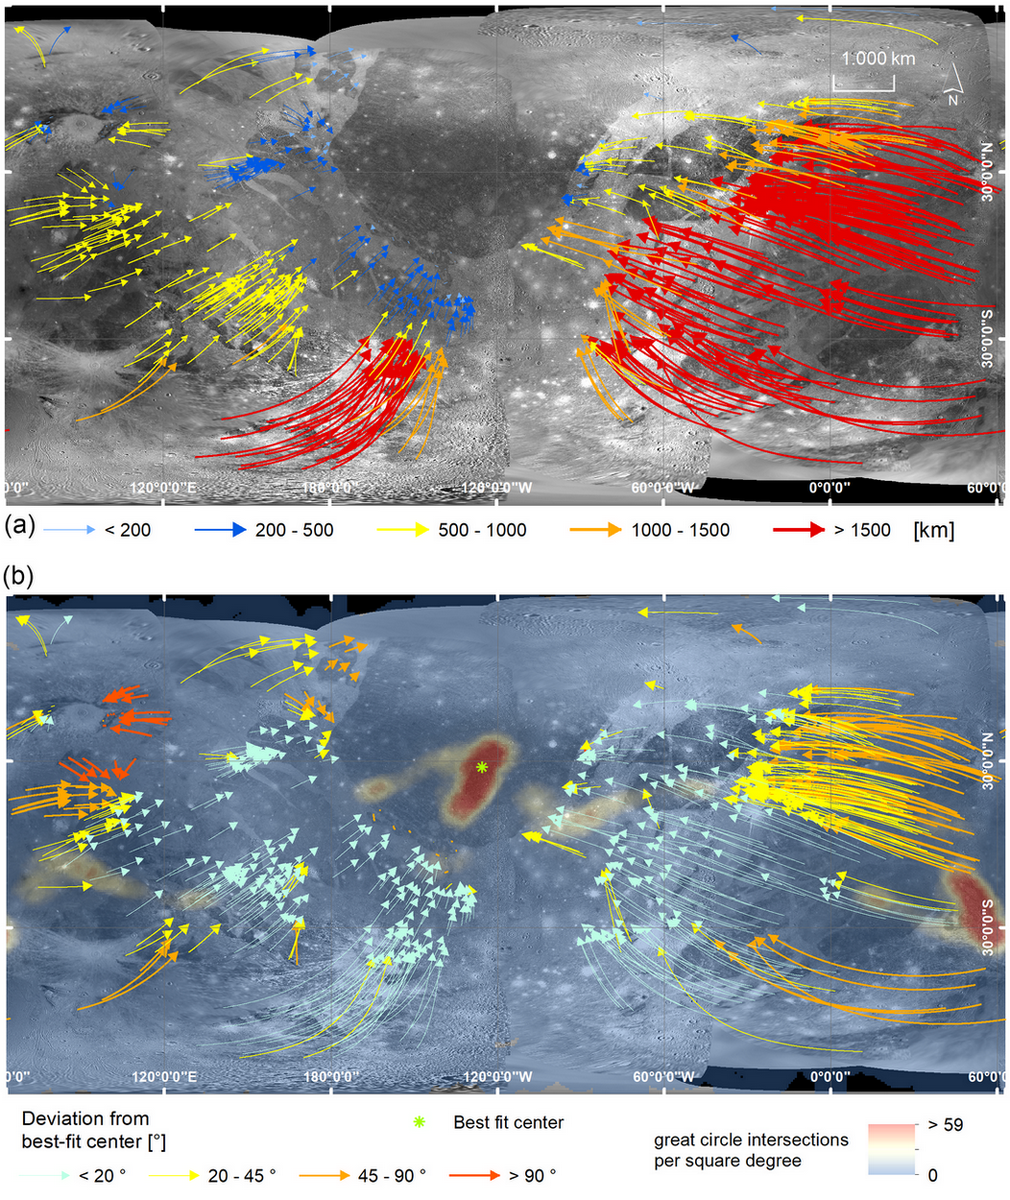
Figure 4: (a): Translation vectors of the centroids between the present-day position (arrow origin) and the restored polygons (arrow head). The color-code represents the absolute distance on a great arc segment and ranges from 0 km up to a maximum of more than 2700 km. (b): Distribution (heatmap) of the intersection points of every two great circles derived from the translation vectors of each polygon and deviation in degrees (color-coded as indicated) of each translation vector from the direct path towards the best-fit center (green dot) inside the area of the most great-circle intersections.
At present, our reconstruction gives no indication of the timing of the rift events because the tectonic signatures of the light terrains have not yet been considered. In addition, the movements are to be understood as relative movements, since an absolute reference system is missing. Due to the uneven spatial resolution of the available data, reconstructions are inaccurate or impossible in some areas. The planned JUICE mission [7] will remedy this situation.
References: [1] Collins G. C. et al. (2013) USGS Sci. Inv. Map #3237, [2] Rossi, C. et al. (2020) J. Maps. 16, 6–16 [3] Pappalardo, R. T., & Greeley, R. (1995). JGR Planets, 100(E9), 18985–19007. [4] Becker, T.L., et al. (2001) 32 LPSC. [5] Schenk, P., 2010. Atlas of the Galilean Satellites. [6] Kersten, E., et al., (2021). Planet. Space Sci. 206, 105310. [7] Stephan et al. (2021) Planet. Space Sci. 208, 105324.
How to cite: Fabi, M., Kenkmann, T., Wulf, G., Baby, N., Stephan, K., and Wagner, R.: Kinematic restoration of Ganymede's dark terrain, Europlanet Science Congress 2022, Granada, Spain, 18–23 Sep 2022, EPSC2022-134, https://doi.org/10.5194/epsc2022-134, 2022.
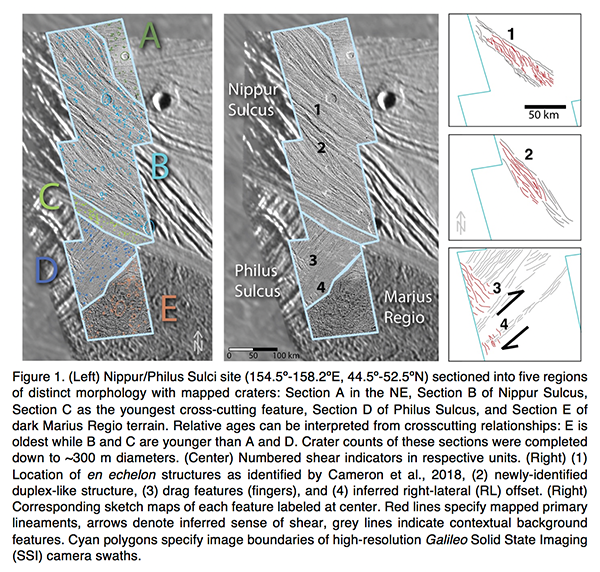
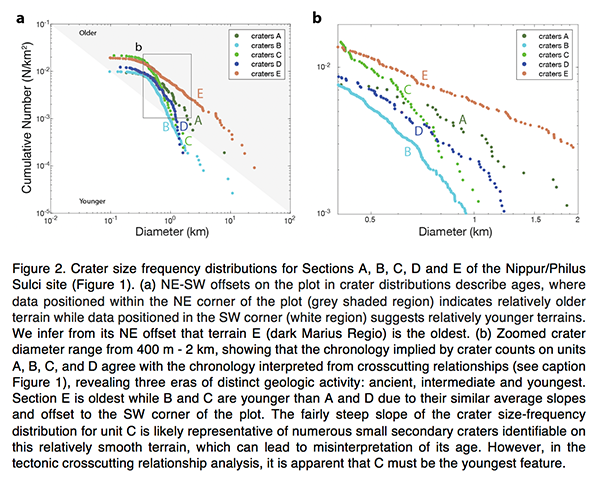
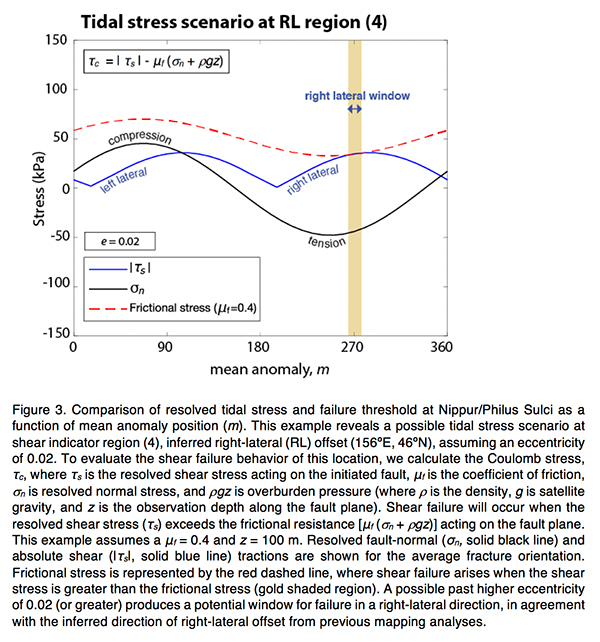
Voyager and Galileo observations of Jupiter's largest moon Ganymede revealed numerous fractures and evidence of strike-slip faulting. The formation of these features has been studied by considering gravitational tidal forces and extensional tectonism, but remains enigmatic. In this study, we continue to advance the assessment of Ganymede’s geologic history by examining the high-resolution Galileo Solid State Imaging (SSI) camera images (∼100m/pixel) available for the area of Nippur/Philus Sulci (Figure 1). Here, various geologic units align on a single line of longitude, providing an excellent sampling region of Ganymede’s deformed surface and eliminating the need to correct for possible leading/trailing hemisphere disparities in the cratering record (Figure 2). First, we produced new crater counts and size frequency distributions to define the relative ages of terrains and their individual geologic units. The chronology of tectonic activity implied by mapped crosscutting relationships is consistent with our findings from analyses of crater densities for each unit, revealing three eras of distinct geologic activity: ancient, intermediate and youngest. Moreover, crosscutting bands of light terrain throughout the surface of Ganymede (and at the Nippur/Philus Sulci site) show varying degrees of tectonic distortion related to these eras of activity, ranging from smooth and less distorted bands to highly grooved and deformed terrain with indicators of shear deformation and strike-slip offsets. To further constrain the timing of geologic activity, we conducted a tidal stress analysis to better understand the formation of shear deformation inferred within the region. Previous studies suggest that tidal stresses resulting from a high eccentricity can generate stress fields capable of driving shear failure and promoting tectonism. At present, Ganymede’s diurnal tidal stresses are not large enough to initiate shear failure. However, the Galilean satellites could have been captured for a period of 10 Ma to 1 Ga years in two Laplace-like resonances previous to the current state and eccentricity. In this past phase, the eccentricity could have been as high as e = ∼0.07, driving internal activity as well as subsequent resurfacing. Using examples of shear deformation indicators found in the Nippur/Philus Sulci area, we examined higher values of past eccentricity to evaluate the promotion of shear failure using the SatStress tidal stress model and Coulomb failure theory, where tractions are resolved onto shallow fault planes (100 m depth) with azimuthal orientations consistent with mapped observations (Figure 3). We find that candidate past eccentricities > 0.02 provide optimal conditions for shear failure throughout the Nippur/Philus Sulci region in its intermediate phase of geologic activity, implied by the positioning of shear indicators within intermediate units as identified by the cratering analysis. Moreover, a past higher eccentricity could have produced a stress field conducive to shear failure of the icy upper crust and possibly promoted the formation of the inferred shear features of Nippur/Philus Sulci and beyond. Future high-resolution images, provided by NASA’s Juno mission, as well as future observations by ESA’s Jupiter Icy Moons Explorer (JUICE) mission and NASA’s Europa Clipper mission, may further aid in our understanding of synergies within Ganymede’s cratering record and tectonic history, especially in the far-field regions surrounding this study, for which only lower resolution Voyager data is currently available.
How to cite: Burkhard, L., Costello, E., Smith-Konter, B., and Cameron, M.: Uncovering the tectonic past of Ganymede through crater size frequency distribution and tidal Coulomb failure modeling at Nippur/Philus Sulci, Europlanet Science Congress 2022, Granada, Spain, 18–23 Sep 2022, EPSC2022-305, https://doi.org/10.5194/epsc2022-305, 2022.
Introduction. Ganymede, Jupiter’s largest moon, is thought to have a salty subsurface ocean underlying an ice shell and may harbor the conditions to support life. The uppermost crust is mainly comprised of two types of terrain: heavily cratered, dark terrains and bright terrains often characterized by grooves [1]. The surface has also been subject to various landform degradation processes, such as mass movement, volatile segregation and migration, impact erosion, and regolith generation [2]. For example, such processes could be responsible for the formation of the dark deposits (layers) observed on Galileo Regio that vary in thickness (and other properties) as a function of their resting slope and position relative to local topographic crests, among other criteria [2]. Landform degradation processes thus can spatially alter the near-surface structure, characterized by different densities, impurities, and thicknesses (from tens to hundreds of meters). We present a radiometric approach for investigating the properties of near-surface layering at Ganymede from the combined observations of radar sounding systems that will reach the Jovian system within the next decade.
Multi-frequency Radar Sounders. The JUpiter ICy moons Explorer (JUICE) from the European Space Agency (ESA) will be orbiting Ganymede by 2034. Its science payload includes the Radar for Icy Moons Exploration (RIME), a 9-MHz central frequency radar sounder with a 1-MHz (low resolution) or 3-MHz (high resolution) bandwidth (noted [9/1 MHz] and [9/3 MHz], respectively) [3]. Nearly concurrently, the Europa Clipper from the National Aeronautics and Space Administration (NASA), will perform flybys of Ganymede once to thrice, providing complementary observations from the Radar for Europa Assessment and Sounding: Ocean to Near-surface (REASON), a dual frequency radar sounder at [60/10 MHz] and [9/1 MHz] [4]. This wealth of multi-frequency and multi-bandwidth observations is uniquely suited to constraining Ganymede’s near-surface properties through differential surface reflectometry.
Reflectometry of Layered Near-surfaces. Reflectometry is related to the measurement of the radar surface echo strength that is sensitive to surface and near-surface properties with a footprint-size spatial resolution of several kilometers (depending on the spacecraft altitude) [5]. The near-surface depth is bounded by the vertical resolution defined from the bandwidth of the transmitted signal. In void, [60/10 MHz], [9/1 MHz] and [9/3 MHz] radar systems have a vertical resolution of 15 m, 50 m and 150 m, respectively [4]. The reflection strength of a homogeneous icy near-surface combined with a smooth surface is nearly independent of the radar system across the RIME-REASON frequency range. However, a sharp dielectric gradient from a horizontal discontinuity in the near-surface affects the effective surface reflection coefficient (Re) because of the phase shift between the surface and the near-surface reflections that are coherently integrated when measured at the receiver. Thin-film theory provides analytical tools to predict Re for layered media as a function of the layers’ thickness and permittivity, as well as the signal wavelength [6].
As an illustration, consider an overburden layer of unknown thickness (zlayer) and permittivity (εlayer), bounded by a void (ε0 = 1), and covering a compact ice substrate (εice = 3.1). Fig. 1 illustrates the field of solutions for Re computed for the three radar systems considered and assuming a synthetic chirp of 100 μs. Each plot on Fig. 1 is characterized by two regimes. When zlayer is larger than the near-surface depth, then the signal strength is independent of zlayer across all frequencies and only dependent on εlayer. Note in particular that as zlayer gets thinner than the near-surface depth, Re exhibits a resonant behavior strongly dependent on zlayer relative to the radio wavelength. Hence, multi-frequency observations can be overlapped, although the solutions are not necessarily unique. However, additional constraints like assumed lateral continuity of the near-surface structure can help resolve most ambiguities.
In addition, surface roughness has a wavelength-dependent effect on surface reflectivity that can be difficult to deconvolve from the effect of near-surface layering. In that regard, because the [9/1 MHz] and [9/3 MHz] radar systems provide the same response to roughness (same radio wavelength), their response should differ only when layer boundaries are between their respective near-surface depths (different bandwidth).
A strategy based on the combination of the reflectivity plots in Fig. 1 for the range of frequencies/bandwidths deployed on Ganymede can then be used to constrain its near-surface properties. An analog application on a terrestrial ice cap is provided in the next section.
Proof-of-concept: Devon Ice Cap, Canadian Arctic. The near-surface of Devon Ice Cap (DIC) is subject to melting and refreezing processes, forming meters-thick ice layers embedded in lower porosity firn. The reflections from these layers from the surface down to the near-surface depth affect the coherent power (Pc) observed by a radar sounder (IPR). Fig. 2 illustrates a transect over DIC, where concurrent ground-penetrating radar (GPR) collected at 500 MHz and airborne IPR observations collected at [60/15 MHz] exist. Superimposed on the GPR radargram is a pink line that represents the frequency/bandwidth-constrained near-surface depth/vertical resolution of the airborne IPR. Results indicate that the behavior of Pc (green line) well correlates with the ice layer thickness within the near-surface depth and decorrelates below the near-surface depth at this frequency.
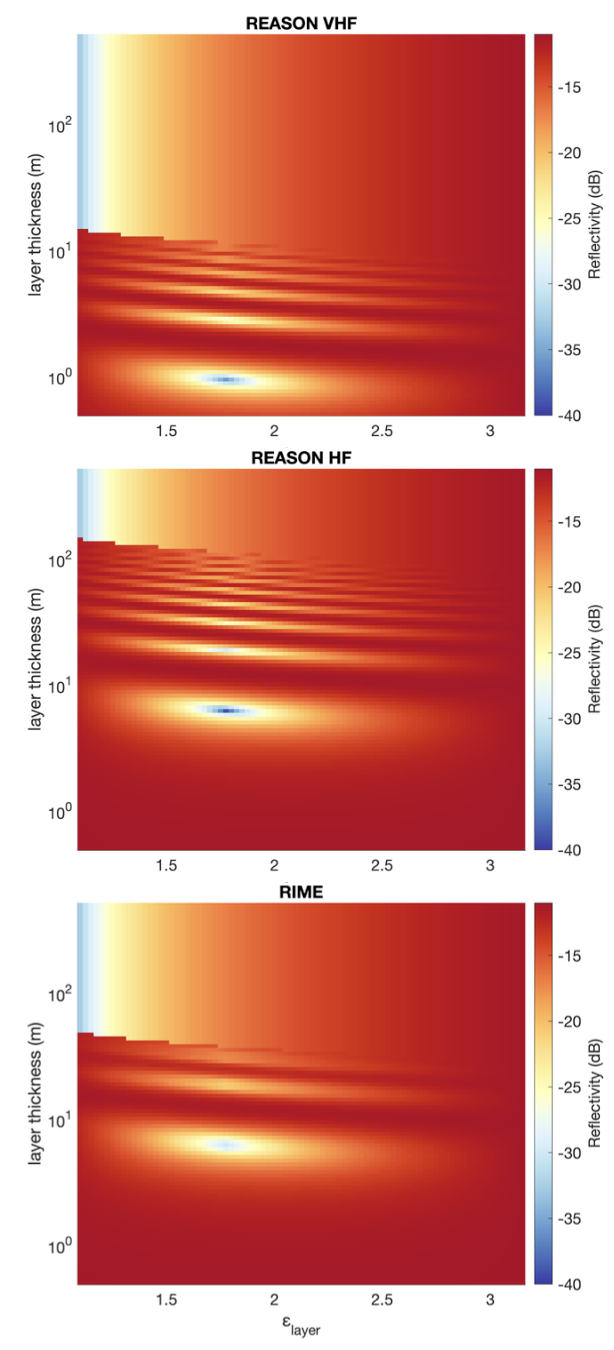
Figure 1: Coherent surface echo strength (Re) as a function of an overburden thickness (zlayer) and permittivity (εlayer) covering an icy substrate (εice = 3.1) for REASON VHF [60/10 MHz], REASON HF [9/1 MHz], and RIME [9/3 MHz].
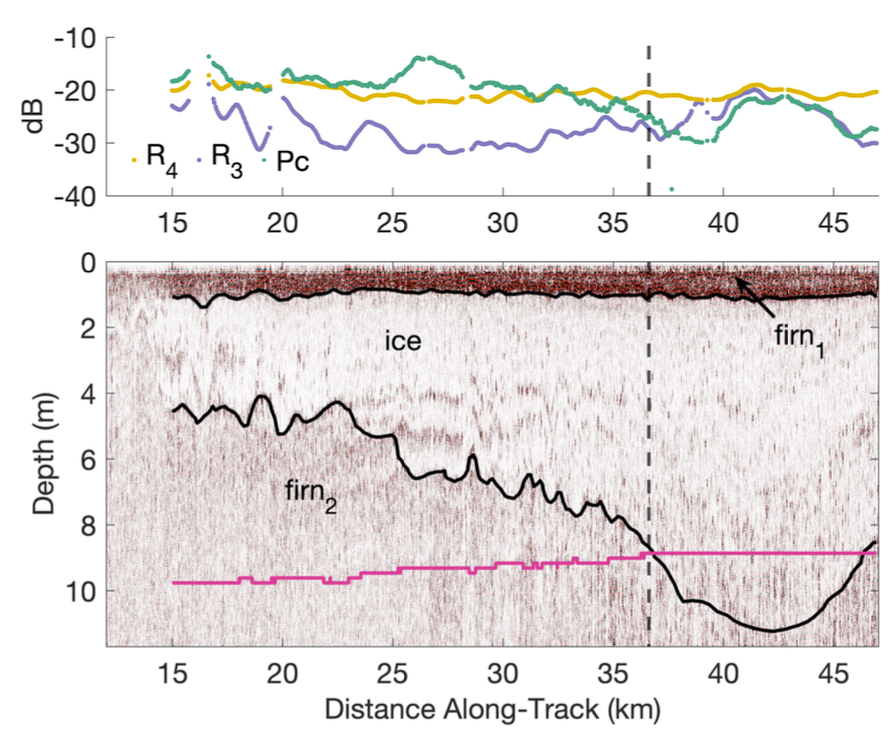
Figure 2: Observed coherent power and modeled reflectivity values (top), with concurrent GPR radargram (bottom) along a transect on Devon Ice Cap.
References: [1] R. T. Pappalardo et al., Jupiter: The Planet, Satellites and Magnetosphere (2004), pp. 363– 396. [2] J. M. Moore et al., Icarus 140.2 (1999), pp. 294– 312. [3] L. Bruzzone et al., Proceedings of the IEEE 99.5 (2011), pp. 837–857. [4] C. Grima et al., Planetary and Space Science 117 (2015), pp. 421–428. [5] C. Grima et al., Planetary and Space Science 103 (2014), pp. 191– 204. [6] P. Yeh. Hoboken, New Jersey: John Wiley & Sons, Inc., 1998.
How to cite: Chan, K., Grima, C., Moore, J. M., and Blankenship, D. D.: Multi-frequency Radar Characterization of Ganymede's Near-surface, Europlanet Science Congress 2022, Granada, Spain, 18–23 Sep 2022, EPSC2022-743, https://doi.org/10.5194/epsc2022-743, 2022.
Introduction: The Galilean satellites’ surfaces and subsurfaces will be explored by robotic spacecraft in the early 2030s, but significant advances from ground-based astronomical facilities will be possible in the coming decade. Ganymede’s surface is composed of regions of brighter young terrain with similar composition to Europa’s young surface, and older dark terrain that has a higher abundance of potentially silicate-rich material (Pappalardo et al., 2004). Infrared spectra from the Galileo orbiter Near-Infrared Mapping Spectrometer (NIMS) provided high-spatial-resolution IR spectra of Ganymede but with limited spatial coverage in many locations. In recent years, ground-based adaptive optics observations in the infrared with Keck/OSIRIS (Brown & Hand, 2013) and VLT/SINFONI (Ligier et al., 2019), along with orbital visible wavelength observations using HST (Trumbo et al. 2021) have provided new insights into the distributions of surface materials on the Galilean satellites.
Datasets: Near-IR observations with almost complete longitudinal coverage of Ganymede were taken with the ground-based VLT/SPHERE in 2015 and 2021, producing spectral cubes covering 0.95 to 1.65 μm (at R∼30) and dual band images at 2.11 and 2.25 μm. SPHERE has a high spatial resolution, with a pixel size of 7.46 mas/px, corresponding to ∼25 km/px at Jupiter. Accounting for diffraction, this allows features ∼150 km across to be easily resolved. Galileo/NIMS observations with similar spatial coverage have also been analysed to provide a direct comparison to the SPHERE dataset.
Visible wavelength observations of Ganymede with VLT/MUSE were acquired in 2019, covering the trailing and anti-jovian hemispheres. MUSE produces high spectral resolution spectra from 480 nm (R=1740) to 930 nm (R=3450). MUSE has a spatial sampling of 25 mas/px and a spatial resolution of ~80mas, corresponding to ~275 km on Ganymede’s surface.
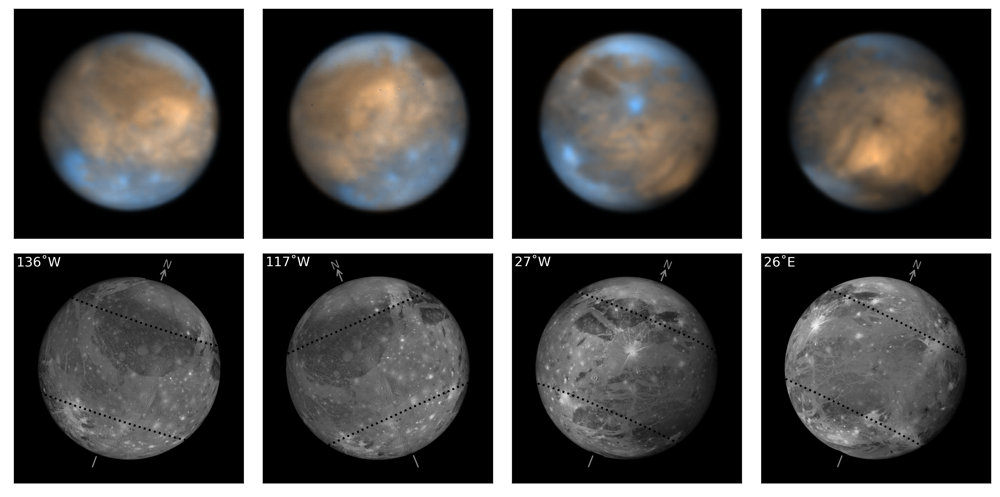
Figure 1: VLT/SPHERE dual band images of Ganymede (top) compared to simulated visible light images using the USGS reference basemap (bottom). The two colour images show the 2.11 µm filter in orange and the 2.251 µm filter in blue. Water ice has a broad absorption around 2 µm, so blue areas are icy and orange areas are contaminated. (King & Fletcher, in review)
MCMC spectral modelling: We analyse the mapped near-IR cubes from VLT/SPHERE by fitting to laboratory spectra from reference cryogenic libraries, including water ice, sulphuric acid, hydrated salts, and spectrally flat ‘synthetic’ spectra. Our fitting routine uses Markov Chain Monte Carlo (MCMC) techniques to model observed spectra, producing a posterior distribution of fitted abundance values for each endmember at each observed location (King et al., 2022). These posterior distributions can be sampled to calculate the best estimate abundance and its associated uncertainty for each endmember and class of endmembers, allowing more detailed investigation of the confidence of different detections.
Results: Spectral modelling results of the VLT/SPHERE observations confirm previous results, showing Ganymede’s surface consists of contrasting ancient dark terrain and young bright terrain (King & Fletcher, in review). The dark terrain (e.g. Galileo Regio) has high abundances of a spectrally flat darkening agent which appears to have a uniformly low albedo (~15%) across Ganymede’s surface. Water ice is most abundant in young bright terrain (e.g. sulci) and appears most abundant in large impact craters. The water ice grain size distribution shows strong latitudinal and longitudinal trends, which appear to be caused by thermal and radiation gradients respectively (see Figure 2). Lower abundances of hydrated salts and sulphuric acid were detected, with modelling uncertainties making it difficult to identify the exact mixture of salts present on Ganymede’s surface.
Absorption bands and spectral slopes were analysed in the visible wavelength VLT/MUSE spectra of Ganymede. One of the most distinguishing features of Ganymede’s visible spectrum is the molecular oxygen absorption at 577.3 nm (see Figure 3). The spatial distribution of this absorption band shows latitudinal and longitudinal trends, with the strongest absorptions found at low to mid latitudes on the trailing hemisphere in Ganymede’s closed magnetic field line region.
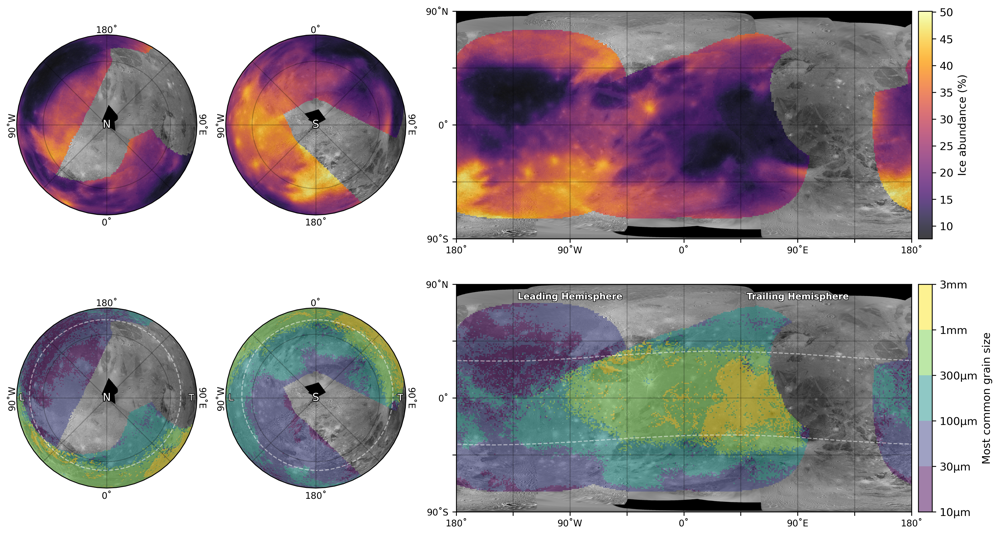
Figure 2: Modelled water ice best estimate spatial distributions using MCMC modelling of near-IR VLT/SPHERE observations. Total water ice abundance (top) is highest in young bright terrain, while the grain size (bottom) shows strong latitudinal and longitudinal trends. (King & Fletcher, in review)
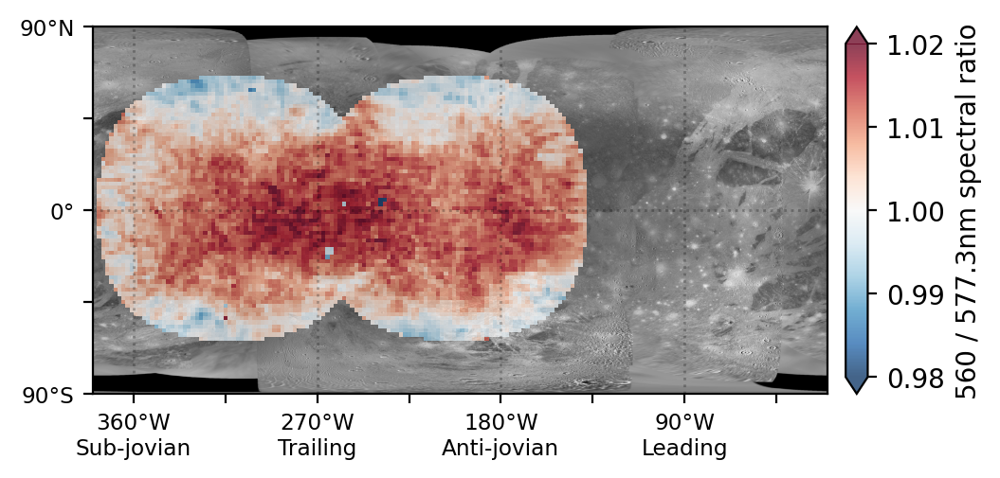
Figure 3: Molecular oxygen absorption on Ganymede, as measured by the 560 nm / 577.3 nm spectral ratio using the VLT/MUSE observations. Stronger O2 absorption (red) occurs at low to mid latitudes, mainly on the trailing hemisphere.
How to cite: King, O., Fletcher, L., Clarke, F., and Hidalgo, A.: Spectroscopy and compositional mapping of Ganymede with VLT, Europlanet Science Congress 2022, Granada, Spain, 18–23 Sep 2022, EPSC2022-987, https://doi.org/10.5194/epsc2022-987, 2022.
Models for the internal structure of the icy satellites Ganymede and Titan, as derived from the data of the Galileo and Cassini-Huygens space missions, suggest that both moons are differentiated with a hydrosphere of ices and liquid water overlaying an inner rocky core. The presence of significant amounts of Insoluble Organic Matter (IOM) in this silicate layer (in quantities consistent with those found in chondrites) has recently been advanced to properly explain the density and moment of inertia of these moons [1]. Interestingly, laboratory experiments at room pressure have shown that the pyrolysis of IOM (starting from temperatures as low as 500 K) gradually releases volatiles such as H2O, CO/CO2, CH4, H2S, and SO2, with possible N-bearing compounds such as N2, NOx and NH3 [2, 3, 4]. This evolution of the IOM could have a defining impact on the habitability and chemical evolution of icy worlds, including the formation of an atmosphere. However, the effect on these thermal reactions of the high pressures found inside large icy worlds remain largely unknown. The purpose of this study is to analyze the chemical and physical evolution of the IOM under the combined pressure and temperature conditions expected inside Titan and Ganymede (pressures from 0.5 to 7 GPa and temperatures up to 1200 K).

Figure 1: Species produced by IOM dissociation at high pressure and high temperature (blue) compared to those produced by pyrolysis at ambient pressure in Kuga et al. (2014) (green) and Okumura and Mimura (2011) (red).
We conducted anvil cell experiments on mixtures of IOM with water at temperatures up to 773 K and pressure up to 8 GPa. The IOM, with a composition of C100H93N65O61, was synthetized at the Nebulotron (CRPG, France [3]), an ultra-high vacuum chamber using a radiofrequency plasma to ionize a N2-CO gas mixture. Systematic pressure and temperature monitoring, and in situ Raman spectroscopy analyses, were conducted during the experiments to characterize the evolution of the samples. Additional infrared analyses were conducted to compare the initial organic matter (as loaded in the anvil cell) with the residual IOM collected at the end of some of the experiments.
During our high-pressure experiments, elevated temperatures led to the production of C- and N-bearing species, as was reported by others during the pyrolysis of dry IOM at room pressure. Our IOM-water mixtures, however, yielded NH3 (rather than N2) as the main N-bearing molecule. Furthermore, CO2 was never observed in our samples; instead, CO3 (as carbonic acid and/or carbonate ions) was identified as the main C-bearing species alongside CH4 (Figure 1). Overall, the degradation of the IOM at high pressure appears to start at slightly higher temperature, although additional experiments are needed to confirm this result (in particular for the formation of CO3 species). Evidence of the restructuration of the IOM appeared in both Raman and infrared spectroscopy.
Our results support that the thermal dissociation of the IOM inside Titan may have contributed to the formation of its atmosphere [5,6]. These results will also prove useful in assessing the chemical evolution of the hydrosphere of icy worlds, notably regarding the formation of gas hydrates inside their high-pressure ice layers.
Acknowledgements:
This research is founded by CNRS 80 PRIME program. This work also acknowledges the financial support from CNES (Centre National d’Etudes Spatiales, France) in preparation of the ESA JUICE mission.
References:
[1] Néri et al. (2020) A carbonaceous chondrite and cometary origin for icy moons of Jupiter and Saturn. Earth and Planetary Science Letters, 530 :115920.
[2] Okumura and Mimura (2011) Gradual and stepwise pyrolysis of insoluble organic matter from the Murchison meteorite revealing chemical structure and isotopic distribution. Geochimica et Cosmochimica Acta, 75(22) :7063–7080.
[3] Kuga et al. (2014) Nitrogen isotopic fractionation during abiotic synthesis of organic solid particles. Earth and Planetary Science Letters, 393:2–13.
[4] Franklin (1949) A study of the fine structure of carbonaceous solids by measurements of true and apparent densities. Part I. Coals. Transactions of the Faraday society, 45:274–286.
[5] Tobie et al. (2012) Titan’s bulk composition constrained by Cassini-Huygens: implication for internal outgassing. The Astrophysical Journal, 752(2):125.
[6] Miller et al. (2019) Contributions from accreted organics to Titan’s atmosphere: new insights from cometary and chondritic data. The Astrophysical Journal, 871(1):59.
How to cite: Lévêque, P., Sotin, C., Bujoli, B., Bollengier, O., Queffelec, C., Le Menn, E., Clouet, A., Marrocchi, Y., and Tobie, G.: Evolution of Insoluble Organic Matter and H2O mixtures Under Ganymede and Titan’s Interior Conditions, Europlanet Science Congress 2022, Granada, Spain, 18–23 Sep 2022, EPSC2022-792, https://doi.org/10.5194/epsc2022-792, 2022.
Orals: Tue, 20 Sep, 10:00–17:00 | Room Andalucia 2
Introduction: With a launch readiness date of late 2024, NASA’s Europa Clipper will set out on a journey to explore the habitability of Jupiter’s moon Europa. In the early 2030s, the spacecraft will enter Jupiter orbit then fly by Europa nearly 50 times to collect data on Europa’s ice shell and ocean, study its composition, investigate its geology, and search for and characterize any current activity. The mission’s science objectives will be accomplished using a highly capable suite of remote-sensing and in-situ instruments.
Mission Context: Interpretation of Galileo mission data suggests that Europa likely hides a global saltwater ocean beneath the icy surface. Chemistry at the ice surface and ocean-rock interface might provide the building blocks for life. NASA’s Europa Clipper mission is intended to assess Europa’s potential habitability.
The Voyager and Galileo missions first revealed a deformed surface at Europa with an average surface age younger than Earth’s, dominated by water ice and renewed through recent or current geologic activity. Galileo data indicates that Europa has an induced magnetic field, implying the presence of a global, electrically conductive fluid layer beneath the surface, most likely a saltwater ocean. Geological data including structural patterns are also consistent with a subsurface ocean. Recent observations also suggest the presence of plumes may release internal water into space, indicating the potential for additional shallow water reservoirs beneath Europa’s icy surface.
There are many open questions regarding the viability of Europa to support life. Intense radiation from Jupiter at Europa’s surface forms water and impurities into oxidants, chemical reagents capable of carrying out oxidation. Active geologic cycling of seawater through rocky material on the Europan seafloor is expected to be chemically reducing. If mixing between the surface oxidants and the reduced ocean water occurs, there is an opportunity in Europa’s ocean or ice shell to produce a reduction-oxidation (redox) potential. All known life on Earth relies on such redox potentials to extract chemical energy from the environment in exchange for heat energy and entropy, enabling cellular maintenance, metabolism, and reproduction. Europa may have the ingredients that could support life: liquid water, bioessential elements, chemical energy, and a stable environment through time.
Science Goal and Objectives: The overarching goal of the Europa Clipper mission is to explore Europa to investigate its habitability. This will be achieved through the accomplishment of three science objectives:
- Characterize the ice shell and any subsurface water, including their heterogeneity, ocean properties, and the nature of surface-ice- exchange.
- Understand the habitability of Europa’s ocean through composition and chemistry.
- Understand the formation of surface features, including sites of recent or current activity, and characterize high science interest localities.
Science Payload: The remote sensing payload consists of the Europa Ultraviolet Spectrograph (Europa-UVS), the Europa Imaging System (EIS), the Mapping Imaging Spectrometer for Europa (MISE), the Europa Thermal Imaging System (E-THEMIS), and the Radar for Europa Assessment and Sounding: Ocean to Near-surface (REASON). The in-situ instruments comprise the Europa Clipper Magnetometer (ECM), the Plasma Instrument for Magnetic Sounding (PIMS), the SUrface Dust Analyzer (SUDA), and the MAss Spectrometer for Planetary Exploration (MASPEX). Gravity and Radio Science (G/RS) will be achieved using the spacecraft's telecommunication system, and valuable scientific data will be acquired by the spacecraft’s Radiation Monitoring system (RADMON).
Status and Advancement Toward Launch: Both the spacecraft and the payload are currently under construction, as the mission begins its assembly, testing, and launch operations (ATLO) phase. Recent major milestones include selection of a launch vehicle and launch readiness date by NASA, evaluation of candidate tours by the science team, and preparations for the cruise and operational phases of the mission. The project, flight system, and payload have completed their Critical Design Reviews, and the project has completed its System Integration Review. Europa Clipper is now formerly a Phase D mission. Meanwhile, the science team is preparing a set of manuscripts describing the mission’s science and instruments for publication in the journal Space Science Reviews.
One Team Philosophy: Our “One Team” philosophy prioritizes synergistic science by bridging across the individual instrument-based investigations, while promoting collaborations among members of the Europa Clipper science team. Each of the Europa Clipper individual instruments will be used to investigate Europa and its environs, finding critical clues about how Europa works as a planetary body. In combining and assessing the datasets from each instrument's experiments, we can collectively gain clarity into Europa’s mysteries. It is at the overlapping boundaries of our subfields that the greatest insights and discoveries will be made. Integrated science celebrates our individual expertise, challenges our assumptions, breaks through our limitations, and expands our intellectual boundaries. Associated visibility brings trust, promotes partnerships, and enhances personal relationships. These aspirations are the inherent basis for functioning as one Europa Clipper science team.
JUICE-Clipper Coordination: The JUICE spacecraft is expected to be in the Jovian system at the same time as Europa Clipper, and there is substantial overlap between these missions’ primary phases. The Europa Clipper and JUICE science teams have begun informal collaboration to suggest synergistic science that could be supported on a non-interference basis. The scientific collaborations currently extend across two ad hoc working groups, one on the Galilean satellites and one on Jupiter’s magnetosphere. Current discussions are to form a joint focus group to advise the two project teams on potential collaborations and propose a plan for synergistic observations, joint publications, and joint archival data products.
Acknowledgments: Portions of this work were performed at the Jet Propulsion Laboratory, California Institute of Technology, under contract with the National Aeronautics and Space Administration. This work was supported by NASA through the Europa Clipper Project.
How to cite: Pappalardo, R., Buratti, B., Korth, H., Craft, K., Daubar, I., Howell, S., Klima, R., Leonard, E., Matiella Novak, A., and Philips, C.: Europa Clipper: exploring Europa’s habitability, Europlanet Science Congress 2022, Granada, Spain, 18–23 Sep 2022, EPSC2022-307, https://doi.org/10.5194/epsc2022-307, 2022.
The repeated eruptions of water plumes on Europa have been suggested based on Hubble observations, Keck observations and in-situ magnetic field data from Galileo (Roth et al., 2014; Sparks et al., 2016, 2017, 2019; Jia et al., 2018; Arnold et al., 2019; Paganini et al., 2019). The possibility that such plumes could transport material from Europa’s subsurface, or from water reservoirs contained in the ice layer (Vorbuger and Wurz 2021), creates an unprecedented opportunity to sample Europa’s subsurface environment and investigate its habitability. The JUpiter ICy moon Explorer (JUICE) is scheduled to make two flybys of Europa, one over the Northern and one over the Southern hemisphere, with the closest approach at 400 km altitude.
In this work we investigate the detectability of such water plumes using the Neutral Mass Spectrometer (NIM) and the ion mass spectrometer Jovian Dynamics and Composition analyser (JDC) of the Particle Environment Package (PEP) on JUICE. Using a Monte Carlo particle tracing model we simulate the density distribution of the plume and simulate the measured signature with NIM and JDC along the two JUICE flyby trajectories.
We show that H2O molecules and H2O+ ions of the plume can be detected during the JUICE flybys. We also investigate the detectability of the plume source as a function of location on the surface of Europa and as a function of the plume mass flux. We find that the plume reported by Roth et al., 2014 is the most likely to be detected, even at the lowest mass fluxes, and that the first JUICE flyby has the best coverage of all the presumptive plume sources. Using a DSMC simulation of the plume we comment on the effect of intermolecular collisions in the plume and demonstrate that such collisions will reduce the detectability of the plume.
Lowering the altitude of this flyby will contribute to an increased chance of detecting the presumptive plume sources, and should be prioritized over lowering the other flybys if any deltaV is available. Furthermore, we also investigate the separability of the plume from Europa’s asymmetric water atmosphere and discuss the influence of the instrument pointing and operations on the plume detectability.
How to cite: Huybrighs, H. L. F., Dayton-Oxland, R., Winterhalder, T., Mahieux, A., Goldstein, D., Vorburger, A., Galli, A., and Wurz, P.: Detecting Europa’s water plumes with JUICE’s particle instruments, Europlanet Science Congress 2022, Granada, Spain, 18–23 Sep 2022, EPSC2022-183, https://doi.org/10.5194/epsc2022-183, 2022.
Volcanic activity at Europa’s seafloor is one of the key question regarding the habitability of its subsurface ocean. The suitable conditions for hydrothermalism on Europa’s seafloor are conditioned by the heat released from the underlying silicate mantle, either supplied by both radiogenic and tidal heating.
The orbital resonance between Io, Europa, and Ganymede forces their orbit and maintain non-zero eccentricities. As a consequence, Io, and to a lesser extent, Europa, undergo large tidal forcing during their journey around Jupiter. Because of its greater distance from Jupiter, a smaller mantle size and the decoupling effect due to the presence of the subsurface water ocean [1], mechanical energy produced by tides in Europa’s mantle is much less than that produced within Io [1, 2]. However, as demonstrated by the 3D approach of Běhounková et al. [3], the combination of tidal and radiogenic heating could maintain a partially molten state within Europa’s mantle for several tens to hundred millions of years, particularly during periods of increased eccentricity [4]. Due to inefficient melt transport through the thick lithosphere of Europa [5], melt produced during periods of enhanced eccentricity may accumulate and in turn affect the tidal heating, as it is the case for Io [e.g. 6], implying a possible runaway melt process in the silicate interior of Europa.
In this context, the goal of this study is to evaluate the effect of melt accumulation on Europa’s mantle tidal heat production, based on the predictions from the 3D simulations of Běhounková et al. [3]. For that purpose, we follow the approach developed to model the solid tides in Io’s partially molten interior [6], taking into account the effect of melt on the viscoelastic properties of the mantle. We adapt it to the context of Europa, corresponding to a deeper asthenosphere than on Io. We use the 3D model of Běhounková et al. [3] to assess in a manner consistent with mantle dynamics the depths where melting should occur as well as the production rates, which should be seen here as minimum values, and estimate the effect of melt accumulation in Europa’s mantle on local dissipation rate and re-assess the consequences in terms of global melt production rate.
Based on the production rates predicted by Běhounková et al. [3], a 100 km thick layer with a melt fraction of 20% would form in 140 million years. In order to evaluate the impact of such an accumulation zone of melt, we considered different thicknesses of partially molten layers (25, 50, 100, 200 km), plated at the base of the lithosphere, and investigate melt fraction from 0 to 30 %, corresponding to different degrees of accumulation of melt products. We show that, whatever the partially molten layer thickness, melt accumulation increase tidal heat production and even exceed radiogenic heating. For equivalent volume of accumulated melt, the thinner the layer, the more pronounced this effect is (Figure 1).
Our results show that the accumulation of melt, over timescales consistent with the 3D model prediction of Běhounková et al. [3], may significantly affect the tidal dissipation amplitude and its pattern. The potential presence fo such melt accumulations may be tested by future measurements by Europa Clipper and JUICE from the combined analysis of gravimetric, altimetric and magnetic data, which might reveal long-wavelength anomalies which could be confronted to our model prediction. Future work is, however, needed to better understand the link between melt generation and extraction in the context of Europa's mantle.
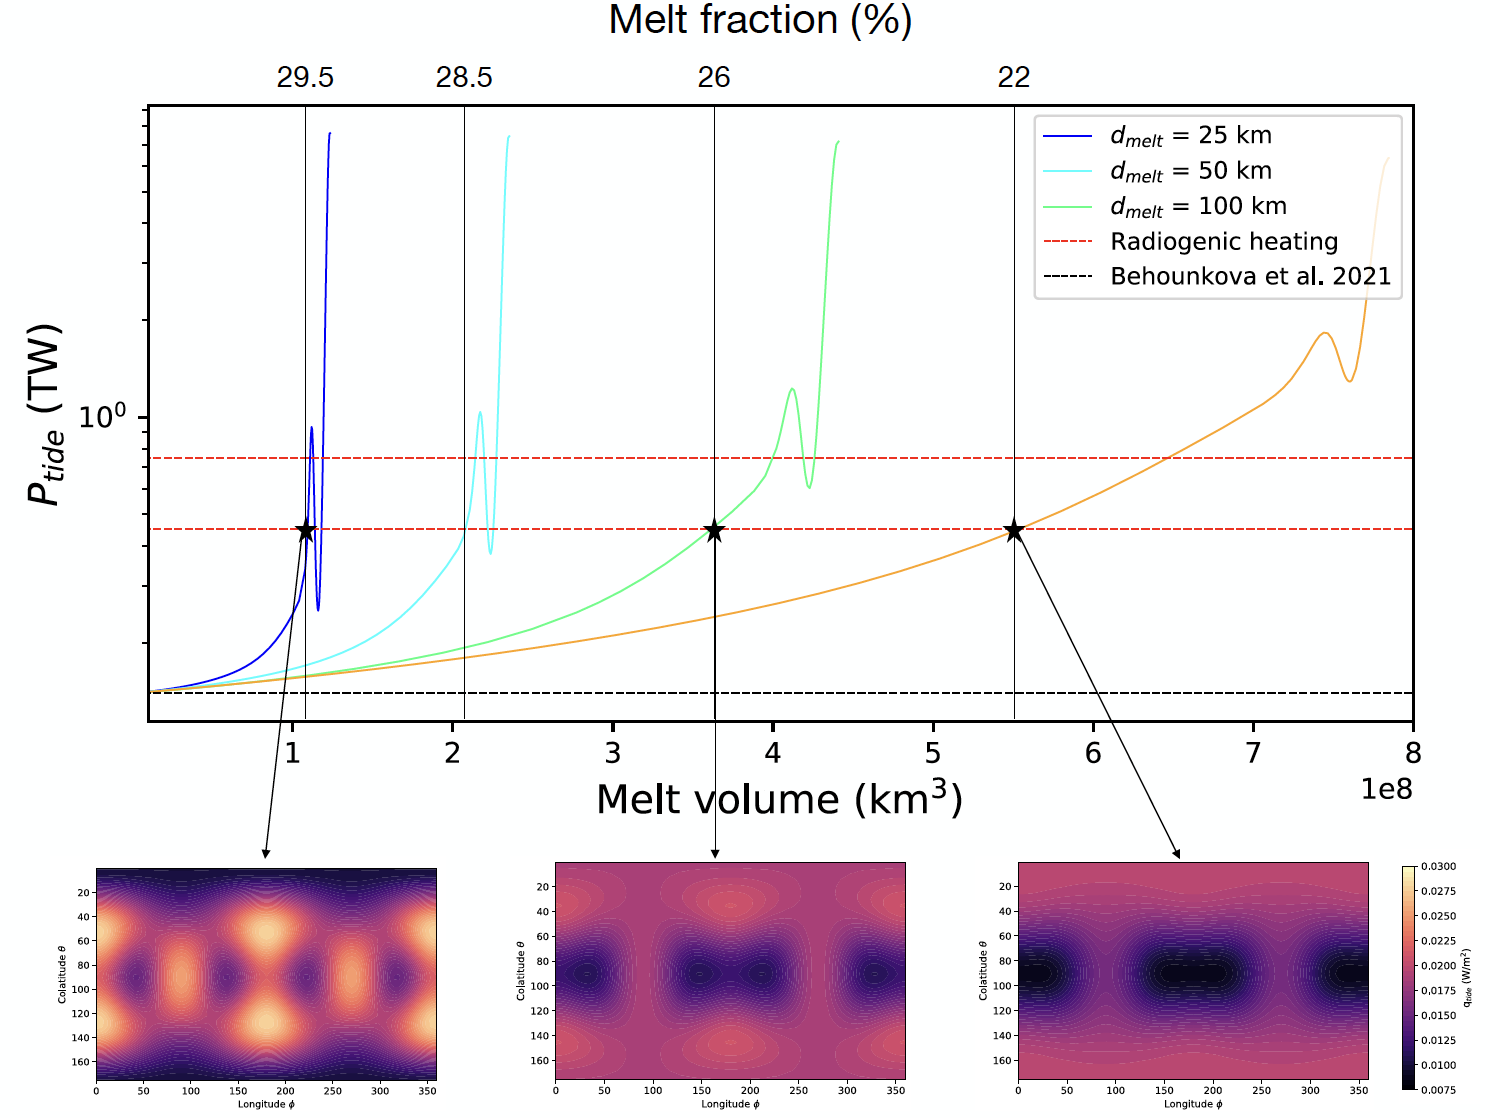
Figure 1 : Tidal power produced in Europa’s mantle with a partially molten layer of 25 (blue), 50 (cyan), 100 (green) and 200 (orange) km thickness. The expected range for radiogenic heating is represented for comparison by the red dashed lines and the black dashed line corresponds to the tidal power for no melt. The melt fraction value required in order to exceed the radiogenic power (black line) for each partially molten layer thickness is indicated, with the corresponding pattern of tidal heat flux integrated over the mantle.
[1] Tobie, G. et al., Icarus (2005).
[2] Sotin, C. et al. Europa (2009).
[3] Běhounková et al., GRL (2021).
[4] Hussmann and Spohn , Icarus (2004).
[5] Bland and Elder, GRL (2022).
[6] Kervazo et al., A&A (2021).
Acknowledgements: This research received funding from the French “Agence Nationale de Recherche” A.N.R. (OASIS project, ANR-16-CE31-0023-01,( G.T., G.C., M.K., C.D.), from CNES (JUICE and Europa Clipper missions, G.T., G.C., M.K., C.D.) and from Czech Science Foundation through project No. 22-20388S (M.B.).
How to cite: Kervazo, M., Běhounková, M., Tobie, G., Choblet, G., and Dumoulin, C.: Impact of melt accumulation on tidal heat production in Europa’s mantle, Europlanet Science Congress 2022, Granada, Spain, 18–23 Sep 2022, EPSC2022-234, https://doi.org/10.5194/epsc2022-234, 2022.
Introduction: Constraining the composition of Europa’s ocean is critical to understanding whether it could support microbial life, and provides an insight into the satellite’s evolution. However, there is much uncertainty about the ocean as it sits beneath a layer of ice and is thus not directly accessible for observation or to orbiting spacecraft. Salts on Europa’s surface, such as MgSO4 and NaCl, cannot be explained entirely by exogenous delivery, and so must originate from the ocean [1, 2] indicating that the ocean interacts with a silicate interior to liberate solutes [3]. If so, this means a “bottom-up” approach, that explores water-rock interactions occurring between the ocean and silicate interior, can be used to assess potential ocean compositions.
Previous studies have taken a similar approach [4–7] but have focused on silicate compositions based on carbonaceous chondrites. However, computer modelling has shown that a composition between a L and LL-type ordinary chondrites correlated with Europa’s moment of inertia, and therefore, could also be a candidate composition for Europa’s silicate interior [8]. Moreover, these previous studies have focused on water-rock interactions that use either pure H2O or HCl initial fluids [4–7, 9], derived from ices during Europa’s accretion. However, the europan surface shows evidence of cratering, with 90% of craters of cometary origin [10]. Comets could, therefore, have made a significant contribution to Europa’s water inventory and influenced the composition of the ocean, which warrants further investigation.
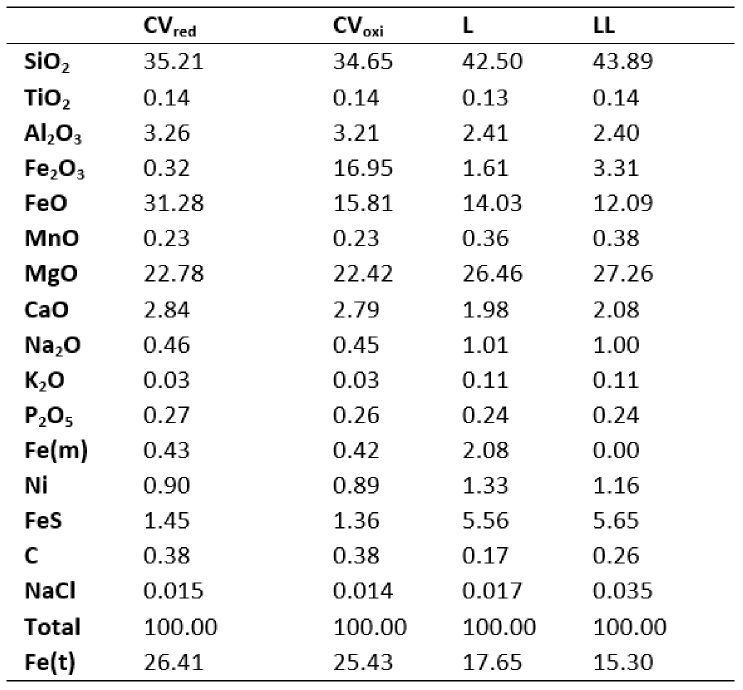
Methods: The computer code CHIM-XPT [11] was used to explore possible ocean compositions that could arise from water-rock interactions occurring within the europan interior. Four silicate compositions based on L, LL and CV (both oxidised and reduced endmembers) chondrites (Table 1) were reacted with two fluids: pure H2O and a cometary melt (based on the volatile composition of 67P/Churyumov-Gerasimenko [12]). These fluids represent plausible endmember compositions that may have contributed to the ocean water inventory. Initial models were run to mimic water-rock interactions occurring at an anticipated pressure and temperature of 250 MPa and 333.15 K [13]. These fluids were then cooled and depressurised to mimic the ascent of fluids from the interior to the ocean reservoir. Models were run at water-rock ratios (W/R) of 1-100 to reflect the degree of alteration experienced within the silicate interior [9, 14].
Table 1. Silicate compositions (based on data from [15]) used for models.
Results and Discussion: Here, results from models performed at a W/R of 1 are presented, which is reflective of the degree of alteration expected today for the europan silicate interior [9].
Variations in secondary mineral assemblages were produced from the initial fluid compositions. Pure H2O models were dominated by serpentine and greenalite for all four silicate compositions. Conversely, cometary models were dominated by talc, carbonates, serpentine, greenalite and chlorite. The high abundance of carbonates in cometary models reflect the high C content found in the initial fluid composition.
Overall, the evolved ocean compositions were dominated (concentrations > 10-3.mol.kg-1) by Cl, C, Si, K and Na regardless of initial fluid endmember compositions (Figure 1). Differences in ocean composition between the four silicate compositions was restricted to variations in Fe and/or S concentrations. The absolute concentrations of Fe and S were strongly influenced by initial silicate composition in the pure H2O models, leading to variations greater than one order of magnitude (Figure 1). Only S showed a variation of greater that one order of magnitude for cometary melt fluids, where all S was removed from the ocean for CVoxi by mineral precipitation.
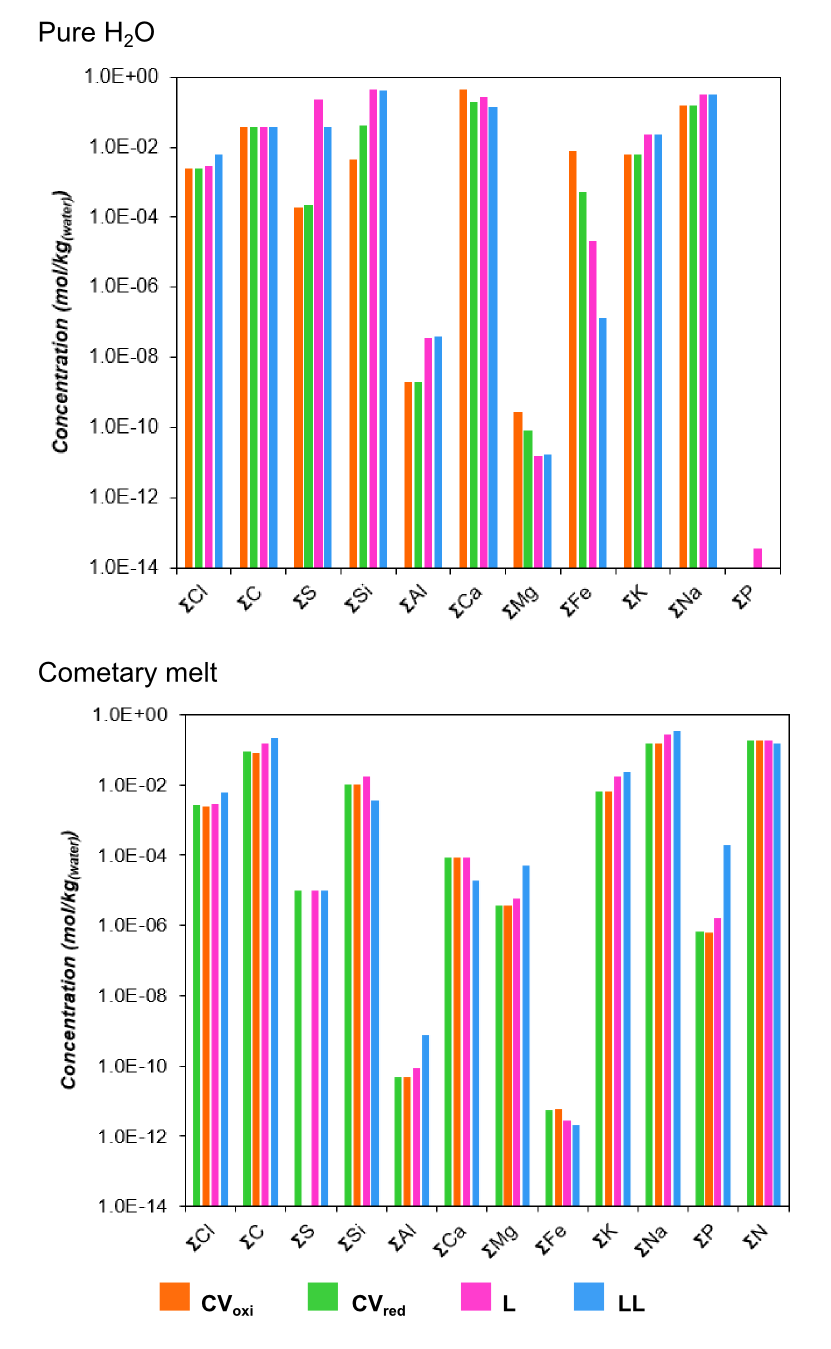
Figure 1. Proposed ocean compositions from water-rock interactions and the ascent of fluids from depth.
Although the dominant elements were similar between pure H2O and cometary melt models, differences in the absolute concentration of Fe were observed (Figure 2). Fe concentrations were at least four orders of magnitude greater in pure H2O models than in cometary melt models. This is significant because the variation of Fe within the europan ocean could influence its ability to support life; Fe is a redox active element that is used by chemotrophic organisms for energy.
A variation of four orders of magnitude was also observed for Mg concentrations, with Mg greater in cometary melt models than in pure H2O models. Given the presence of Mg-salts within Europa’s icy crust, it is possible that the variation in concentration between the two initial fluids could be diagnostic of source fluids and be an indication that cometary ices may have made a significant contribution to Europa’s ocean.
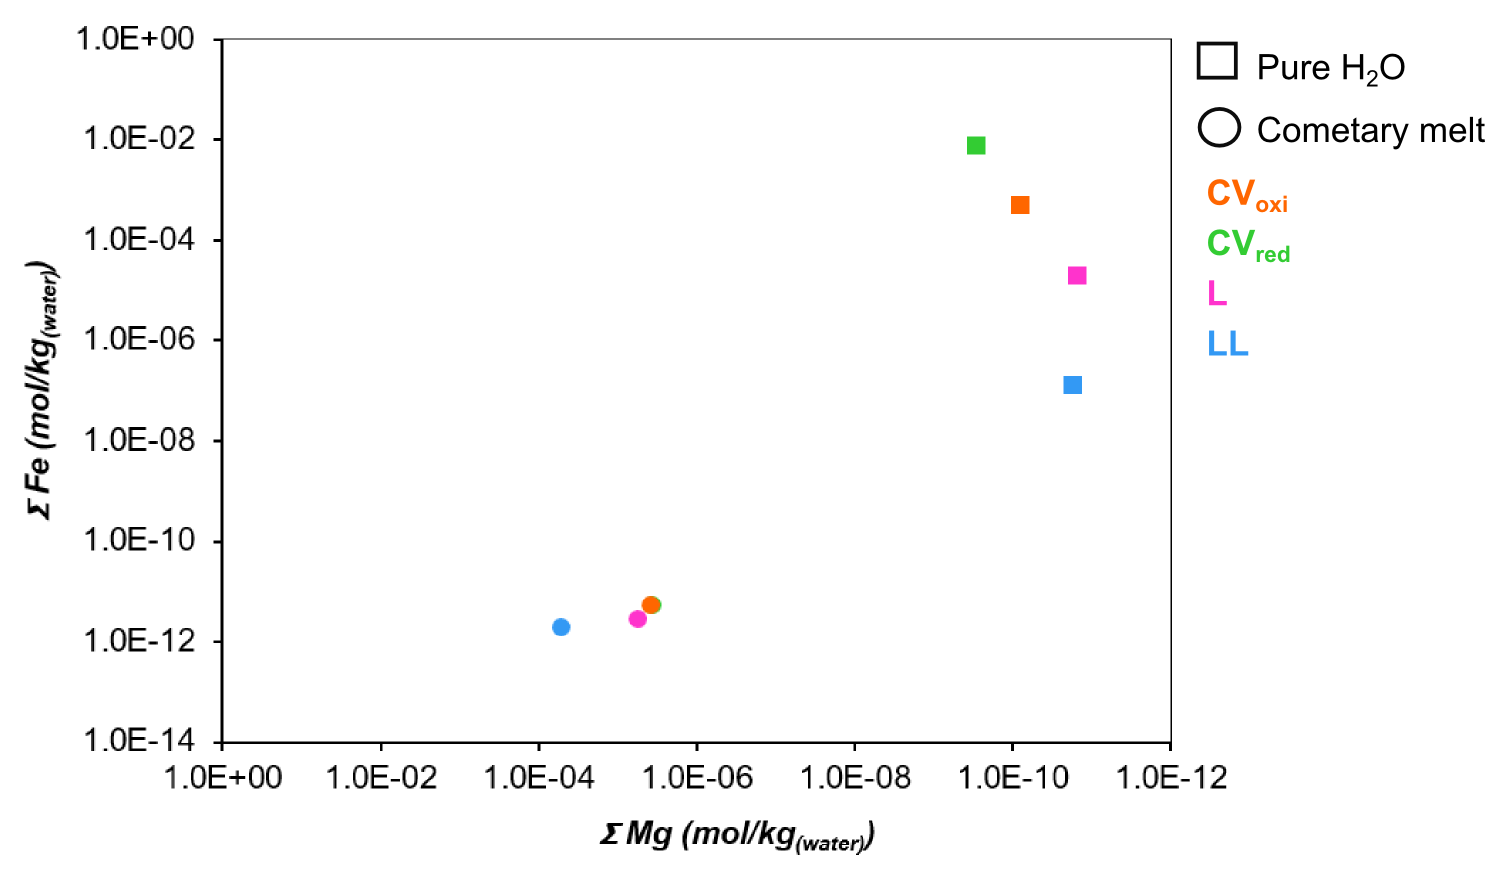
Figure 2. Fe and Mg concentrations for pure H2O and cometary melt fluids and silicate compositions [15].
Conclusions: The modelling indicates that the initial fluid would have a stronger influence on the resultant europan ocean composition than proposed candidate silicate compositions. Hence, a wider range of candidate fluid compositions should be explored to assess their possible influence on the composition of Europa’s ocean.
Furthermore, results showed a variation in absolute Mg concentrations between both initial fluid compositions. If surface Mg-salts did form as the underlying ocean froze then this Mg variation could be used to identify the composition of the ocean. However, to fully understand the link between the ocean and salts in the ice shell requires further investigations into the salt precipitation sequence as potential ocean compositions freeze.
References: [1] McCord et al. (1998) Science, 1242. [2] Trumbo et al. (2019) Sci. Adv., 5. [3] Hand (2018) Halogens on and Within the Ocean Worlds of the Outer Solar System. [4] Zolotov & Mironenko (2007) Ices, Oceans, and Fire: Satellites of the Outer Solar System, Abstract# 6065. [5] Zolotov & Shock (2001) J. Geophys. Res. E Planets, 106. [6] Kargel et al. (2000) Icarus, 148. [7] Daswani et al. (2021) Geophys. Res. Let, 48. [8] Kuskov & Kronrod (2005) Icarus, 177. [9] Zolotov (2012) Icarus, 220. [10] Zahnle et al. (1998) Icarus, 136. [11] Reed (1982) Geochim. Cosmochim. Acta, 46. [12] Rubin et al. (2019) Mon. Not. R. Astron. Soc., 489. [13] Vance et al. (2007) Astrobiology, 7. [14] Spivack & Edmond (1987) Geochim. Cosmochim. Acta, 51. [15] Jarosewich (1990) Meteoritics, 25.
How to cite: Ramkissoon, N., Schwenzer, S., Fox-Powell, M., Del Moral, A., Olsson-Francis, K., and Pearson, V.: Assessing the potential composition of Europa’s subsurface ocean from water-rock interactions., Europlanet Science Congress 2022, Granada, Spain, 18–23 Sep 2022, EPSC2022-1167, https://doi.org/10.5194/epsc2022-1167, 2022.
During the past decade the large icy moons of Saturn and Jupiter have become one of the prime targets in the search for extraterrestrial life (Coustenis et al, 2013). The likely existence of subsurface oceans in those moons (e.g., Soderlund et al., 2020) provide a key ingredient supportive to life as we know it, which is liquid water (Chyba & Phillips, 2001). The Jovian moon Europa is of particular interest when it comes to the search for habitable environments. Europa has been and still is experiencing significant tidal heating due to the gravitational pull of Jupiter (Sotin et al., 2009) and its ice-water layer most likely contains a non-negligible amount of salt (Carlson et al., 1992; Kargel et al., 2000; Zolotov et al. 2009; Trumbo et al., 2019). Both factors slow down freezing of liquids, which might help to keep a present-day liquid salty ocean as well as liquid reservoirs in the icy shell forming the outermost layer of Europa (e.g., Sotin et al., 2002; Tobie et al., 2003; Hussmann et al., 2006; Kalousova et al., 2014).
Depending on the conditions present, liquid reservoirs in Europa’s ice shell could either form somewhere within the ice shell due to melting or be a relic of the process of freezing at the ice-ocean interface (mushy layer). Possible convection of Europa’s ice shell might allow for transporting liquid inclusions to shallow subsurface regions. If liquid inclusions exceed a certain volume fraction and thus become interconnected they will not only be passively advected by the solid but simultaneously percolate (two-phase porous flow). Potential shallow subsurface liquid reservoirs on Europa provide a unique chance for probing these regions in the context of conceivable future missions (Dachwald et al., 2016). Investigating the emergence and the subsequent transport of liquid reservoirs in the ice shell will provide insights into their current location. It is thus not only important for understanding the general habitability of Europa but it is also essential for designing missions for probing the subsurface.
In the present study, we want to set the stage for the concurrent modeling of solids and liquids in Europa’s ice shell in order to investigate the evolution of potential brine inclusions. As a first step, we conduct a parameter study for a completely solid ice shell with salt intrusions. The goal is to investigate the influence of different parameters on the transport of salt intrusions in a convecting ice shell. This study will serve as a basis for later, more complex models incorporating liquid intrusions.
We study ice layers that are pure water ice as well as a mixture of water ice and salt. For the pure water ice case, we investigate the effects of viscosity and thermal conductivity on the ability of the ice shell to convect. To this end, we use the mantle convection code GAIA (Hüttig et al., 2013) and perform simulations in a spherical annulus geometry (Hernlund & Tackley, 2008; Fleury et al., 2020).
We test realistic material parameters such as a composite rheology (Goldsby et al., 2001) and compare the results to pure diffusion creep rheology. We also compare simulations that account for a temperature-dependent thermal conductivity (Hobbs et al., 2010; Petrenko et al., 1999) with results obtained for a constant thermal conductivity.. Fig. 1 shows the convection pattern in a 60 km ice shell employing a diffusion creep rheology with a reference viscosity of 1014 Pa s for a pure water ice scenario. Fig. 1a uses a variable thermal conductivity following the parameterization of (Petrenko et al., 1999) and Fig. 1b shows a case with a constant conductivity of 2.44 W/m/K. In the variable thermal conductivity case, convection is more sluggish and leads to a thicker immobile layer at the top of the convecting domain (the so-called stagnant lid) compared to the constant conductivity case.
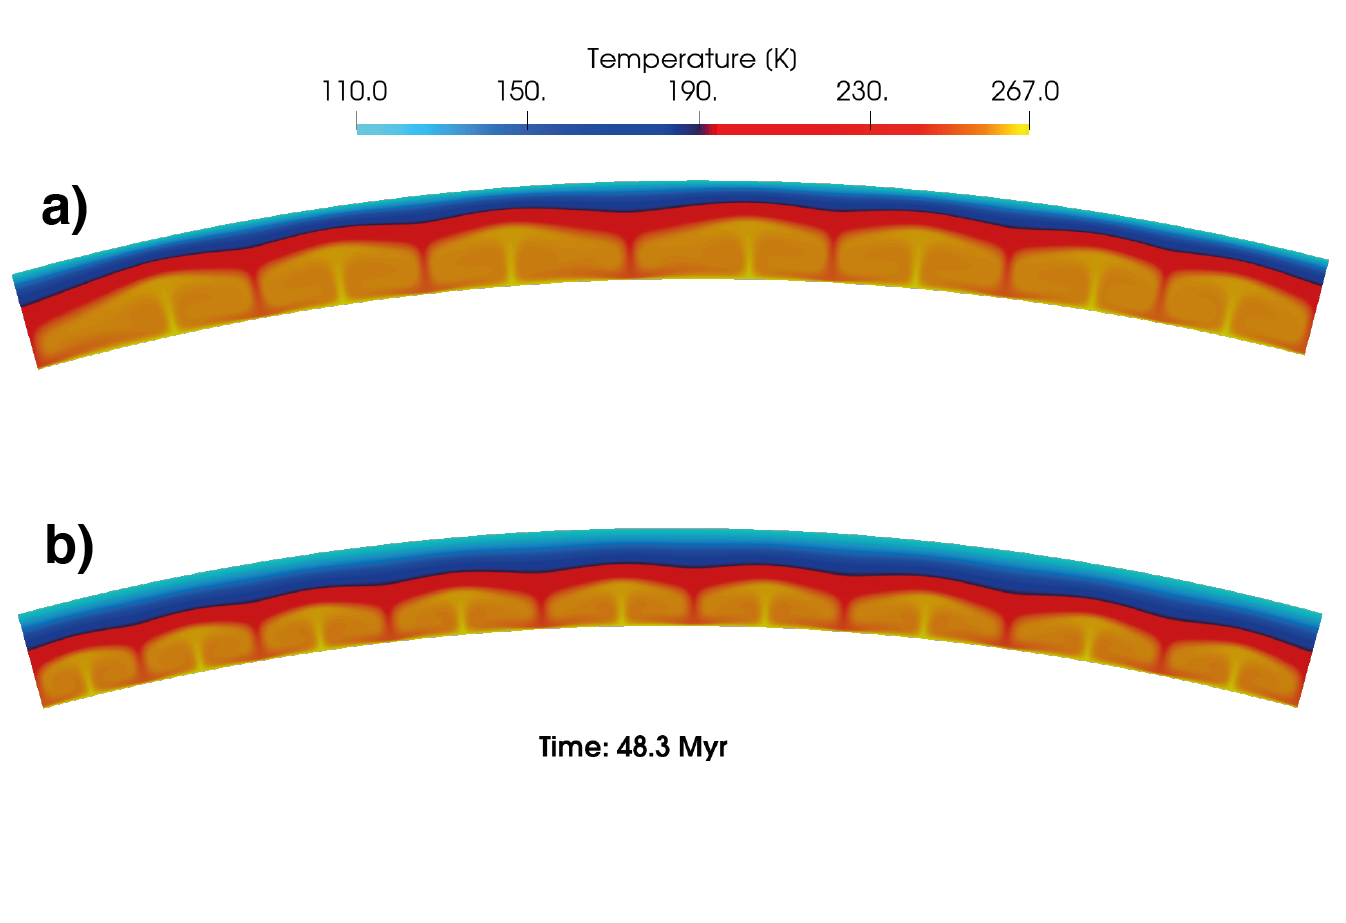
Figure 1: Two snapshots at 48.3 Myr for a 60km thick convecting ice shell: a) constant thermal conductivity and b) temperature dependent thermal conductivity.
Furthermore, we systematically vary the thickness of the ice shell between 10 and 120 km, which influences the existence and - if present - the vigor of convection. Generally, cases using a variable thermal conductivity show less vigorous convection compared to the constant conductivity cases. This is illustrated by the Nusselt-Rayleigh diagram in Fig. 2. For a variable thermal conductivity, solid-state convection occurs for ice shell thicknesses larger than 34 km, while for constant conductivity scenarios, convection occurs already for an ice shell thickness of 27 km.

Figure 2: Nusselt number as a function of Rayleigh number for constant (filled circles) versus temperature dependent (empty circles) conductivity. Dashed lines indicate onset of convection.
Finally, considering the more realistic material parameters mentioned above, we add compositional heterogeneities (e.g., salt intrusions) considering different initial distributions and study their redistribution via convective transport in ice shells of different thicknesses. Our parameter study will show under which conditions salt intrusions can exist near the surface, can remain as compositionally distinct regions, or are evenly mixed within the ice shell.
References:
A. Coustenis et al., Life beyond Earth: The search for habitable worlds in the universe (Cambridge University Press, 2013).
M. Soderlund et al., Space Science Reviews 216, 1 (2020).
F. Chyba and C. B. Phillips, Proceedings of the National Academy of Sciences 98, 801 (2001).
C. Sotin et al., Europa, (2009).
R. Carlson et al., The Galileo Mission (Springer, 1992).
S. Kargel et al., Icarus 148, 226 (2000).
Y. Zolotov and J. S. Kargel, in Europa, (2009).
K. Trumbo et al., Science advances 5,(2019).
C. Sotin et al., GRL 29, 74 (2002).
G. Tobie et al., JGR: Planets 108 (2003).
H. Hussmann et al., Icarus 185, 258 (2006).
K. Kalousova et al., JGR: Planets 119, 532 (2014).
B. Dachwald et al., in Proceeding of the conference Enceladus and the Icy Moons of Saturn (2016).
C. Hüttig et al., PEPI 220, 11 (2013).
W. Hernlund and P. J. Tackley, PEPI 171, 48 (2008).
How to cite: Rückriemen-Bez, T., Plesa, A.-C., Kowalski, J., and Terschanski, B.: Large-scale dynamics and the fate of salts in Europa's icy shell, Europlanet Science Congress 2022, Granada, Spain, 18–23 Sep 2022, EPSC2022-689, https://doi.org/10.5194/epsc2022-689, 2022.
1. Introduction
Liquid water reservoirs in Europa's icy crust, if they exist, could represent the most accessible liquid water bodies in the outer solar system. Previous studies have demonstrated that freezing cryoreservoirs might trigger eruptions due to the pressurization associated with volume change as liquid water expands to become water ice [1, 2]. Locating potentially stored and erupted brines is key for the exploration of ocean worlds and the search for habitability and life beyond Earth.
Here, we aim to numerically model the coupled chemical evolution and pressurization of freezing brines stored in Europa’s ice shell using current best estimates of the oceanic composition [3] to predict the composition of erupted cryolava. This composition varies with time, as salts concentrate during freezing [4], which could lead to erupted brines of varying composition depending on the reservoir frozen fraction when the eruption is triggered. This could explain the variations of albedo observed around features potentially associated with cryovolcanism, for example smooth plains, as shown in Fig. 1.
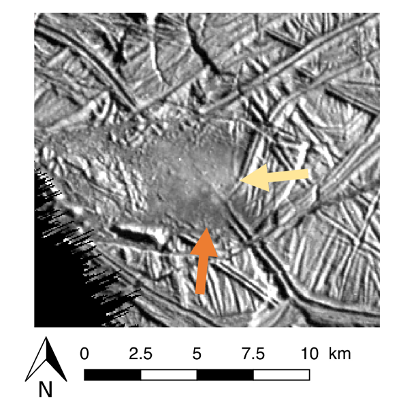
Figure 1: Smooth plain on Europa’s surface with morphology consistent with eruption of liquid cryolava [1]. The yellow and orange arrow indicate two areas of different albedo, which may have been emplaced by two eruptive events of brines of different composition. NASA Galileo image 9352r.
2. Methods
Cryomagma chemistry Whether they are formed by in-situ melting [5] or intrusion of oceanic water [6], the best estimate for cryomagmatic fluid composition is provided by models of evolution of Europa’s interior and ocean. An example cryomagma composition used in our model, consistent with oceanic compositions predicted by recent literature [3], in wt.%, is 99.0% H2O, 0.32% Na, 0.28% Cl, 0.16% bicarbonate, 0.21% sulfate, 0.027% K, 0.013% Ca, and 0.002% Mg. The equilibrium freezing of oceanic brines is modeled using the software PHREEQC [7] to obtain the liquid and solid fraction of each component of the aqueous solution as a function of the temperature. We use these data as an input of the model presented below.
Model principle Previous studies [1, 2] demonstrated that internal overpressure increases in potential freezing cryoreservoirs as cryomagma transitions to the less-dense solid phase. The critical freezing time required to break the reservoir and trigger an eruption is a function of the reservoir chemical and physical parameters (see example in Fig. 2 for a spherical 500 m radius reservoir located 2 km below the surface and filled with pure liquid water [1, 2]). The cryomagma chemical evolution during freezing will affect the solution and formed ice densities, and can thus make the critical freezing time different from what was calculated by previous studies. We thus need to model the cryomagma composition and internal overpressure as coupled variables. By doing so, we will be able to predict a realistic critical freezing time to trigger eruptions, as well as the
cryomagma composition when the eruption begins.
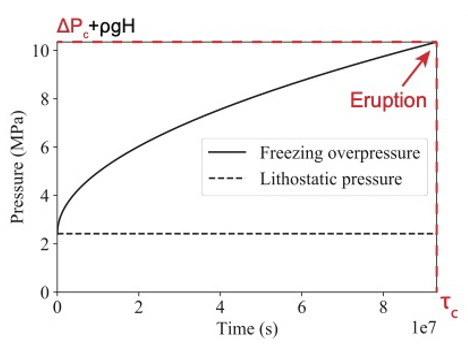
Figure 2: Pressure as a function of the time in a 500 m radius freezing cryoreservoir located 2 km below the surface. Here the cryomagma is composed of pure water only [2].
Numerical procedure We couple temperature-dependent compositional outputs from PHREEQC with a 1D numerical simulation using the finite differences method to simulate a freezing cryoreservoir. At each time step (i.e., reservoir temperature), we vary the composition of the formed ice and remaining aqueous solution. We modify several parameters accordingly, such as the liquid and solid densities and thermal conductivities. We ensure the energy and mass are conserved through time by calculating the cryomagma frozen fraction that balances the heat lost during each time step. As an output of the model, we can obtain the temporal evolution of: (i) the temperature in the reservoir, (ii) the composition of the formed solid and the remaining liquid and (iii) the internal overpressure. Finally, we can predict the composition of the erupted brines once (and if) the eruption is triggered.
Cyclic eruptions After the first eruption, cryomagma reservoirs may keep freezing and trigger several other eruptions as evoked in Lesage et al. [8]. We added the possibility to continue freezing and trigger several eruptions to our numerical simulation so that we can observe the evolution of erupted brines composition through time.
3. Preliminary results
Initial results demonstrate that salts concentrate in the reservoir during freezing, which decreases the solution freezing temperature and can make the freezing slower than expected with simpler models [1, 2]. On the other hand, the ice formed is initially mostly composed of pure liquid water and thus has a low density compared to the remaining liquid, which can accelerate the pressurization. The effect of both these mechanisms on the critical freezing time have to be quantified. The concentration of non-water components through time is also expected to result in cryolava flows with darker albedo and varying spectral signatures in the case of repeated eruptive events. These results will inform the upcoming missions JUICE (ESA) [9] and Europa Clipper (NASA) [10] on the spectral signatures that could indicate the presence of shallow sub-surface cryoreservoirs and provide information on their activity.
Acknowledgements
Portions of this research were carried out at the Jet Propulsion Laboratory, California Institute of Technology, under contract with the National Aeronautics and Space Administration (NASA). This work was supported by Scientific Exploration Subsurface Access Mechanism for Europa (SESAME) grant number 80NSSC19K0614 and by NASA’s Solar System Workings program (#80NSSC20K0139). The PHREEQC routine is available at https://github.com/MarcNeveu/frezchem.
References
[1] Lesage E. et al. (2020) Icarus, 335, 11336, [2] Lesage E. et al. (2022) The Planetary Science Journal, in press., [3] Melwani Daswani et al. (2021) Geophysical Research Letters, 48(18), [4] Zolotov M. Y. & Kargel J. S. (2009) Tucson, AZ: University of Arizona Press, [5] Kalousová et al. (2016) Journal of Geophysical Research: Planets, 121(12), 2444-2462, [6] Craft K. L. et al. (2016) Icarus, 274, 297-313, [7] Parkhurst, D. L. (1995). User's guide to PHREEQC, [8] Lesage et al. (2021) Icarus, 361, 114373, [9] Grasset O. et al. (2013) Planetary and Space Science, 78, 1-21, [10] Howell S. M. and Pappalardo R. T. (2020) Nature Communications, 11, 1311.
How to cite: Lesage, E., Howell, S. M., Naseem, M., Neveu, M., Melwani Daswani, M., and Vance, S. D.: Chemical composition of erupted brines on Europa, Europlanet Science Congress 2022, Granada, Spain, 18–23 Sep 2022, EPSC2022-301, https://doi.org/10.5194/epsc2022-301, 2022.
Jupiter’s moon Europa is a prime target in the exploration of potentially habitable extraterrestrial ocean worlds. Its global subsurface ocean is likely in contact with a rocky silicate seafloor [1] and may have provided a long-term, stable environment with essential elements and energy sources for an independent origin of life [2]. Biogenic, prebiotic, or abiotic organic material from the ocean could be incorporated in ice grains ejected from the surface due to micrometeorite impacts [3] or in potential cryovolcanic plumes [4]. These ice grains could be detected during spacecraft flybys by the SUrface Dust Analyzer (SUDA [5]), an impact ionization mass spectrometer on board NASA’s upcoming Europa Clipper mission [6]. SUDA-type instruments are powerful tools for the identification of organic molecules, as demonstrated by the detection of complex organic macromolecules [7] and smaller reactive nitrogen- and oxygen-bearing compounds [8] in ice grains formed from Enceladus’s subsurface ocean by SUDA’s predecessor instrument, the Cosmic Dust Analyzer (CDA) [9] on board the Cassini spacecraft. These findings required laboratory analogue experiments using the Laser Induced Liquid Beam Ion Desorption (LILBID) approach, a proven technique for the investigation of mass spectral characteristics of organic molecules as identifiable by SUDA-type instruments. LILBID experiments have shown that bioessential molecules such as amino acids, fatty acids and peptides, as well microbial biosignatures, could be detected, and that abiotic and biotic mass spectral fingerprints could be distinguished by spaceborne impact ionization mass spectrometers down to the ppm or ppb level [10, 11, 12].
In impact ionization mass spectrometry, the matrix from which a sample is analyzed can influence ion formation and the resulting spectra [13]. Simulating the mass spectra of organic compounds in ice grains ejected from Europa therefore requires consideration of matrix compounds, particularly inorganic salts which seem to be a common ingredient of Europa’s surface ices [14, 15]. Here we investigate the detectability of several organic molecules (5-amino-1-pentanol, acetic acid, benzoic acid, butylamine, glucose, methanol, pyridine) containing a wide range of functional groups, namely hydroxyl, azine, (aromatic) carboxylic acid, (aromatic) amine, and alkanolamine, in salt-rich ice grains ejected from Europa. We focus on the effects of sodium chloride (NaCl), an abundant inorganic salt (0.1-1.2 mol/kg H2O [16]), on the mass spectral signatures of these organics in both cation and anion mode.
Our results show that the salt-rich matrices modify the mass spectral characteristics of the organics by forming salt adducts, effectively suppressing characteristic organic peaks and complicating the spectral interpretation with interferences. We found that the spectral appearance of the organics fundamentally changes when using high (1M) NaCl concentrations as compared to low (0.01M) concentrations. At high concentrations in cation mode, the investigated organics typically form sodiated molecular ions [M+Na]+, clusters with NaCl and NaOH ([M+Na+(NaCl)]+, [M+Na+(NaOH)]+), as well as disodiated and trisodiated adduct cations ([M-H+ 2Na]+ and [M-2H+3Na]+). At the lowest salt concentration (0.01M NaCl), all the investigated organics are detected as protonated molecular peaks [M+H]+, whereas these peaks are mostly suppressed at higher NaCl concentrations. In anion mode, organics are typically detected as deprotonated molecules [M-H]-, chlorinated adducts [M+Cl]-, NaCl and NaOH clusters ([M+Cl+NaCl]-, [M+Cl+NaOH]-, [M-H+NaCl]-) at concentrations of 0.01M and 0.1M NaCl. Suppression effects of organic-related peaks are stronger in anion mode than in cation mode, and prevent the detection of most organics at the highest NaCl concentration investigated (1M), although those organics appear as salt adducts in cation spectra. By contrast, the two organic acids investigated (acetic and benzoic acid) are detected with a high sensitivity in anion mode, even at the highest salt concentration. Deprotonated molecular ions of acetic acid were identified in a 1M NaCl matrix at a concentration of 0.1vol%, whereas most other organics need to be present at least at 10 times higher concentrations to be detectable at these high salt concentrations. In both ion modes, fewer characteristic fragment ions appear in the spectra with increasing salt concentrations, possibly due to either neutralization of charged fragments or suppression of the fragmentation process of the organics.
Our results confirm the necessity for SUDA to record both cation and anion mass spectra to allow the identification in salt-rich ice grains of a wide range of organic compounds with different functional groups and pH and pKa values. Ongoing complementary investigations focus on other inorganic salts or acids expected to be found in the water ice matrix of Europa, including magnesium sulfate (MgSO4) and sulfuric acid (H2SO4), which are expected to similarly induce complex matrix effects.
[1] Anderson et al. (1998) Science, 281(5385), 2019-2022
[2] Hand et al. (2007) Astrobiology, 7(6),1006-1022
[3] Krivov et al. (2003) Planet. Space Sci. 51(3):251269
[4] Roth et al. (2014) Science 343:171–174
[5] Kempf et al. (2014) Eur Planet Sci Congr 2014:229
[6] Howell & Pappalardo (2020) Nat. Commun. 11(1), 1-4
[7] Postberg et al. (2018) Nature 558(7711)564-568
[8] Khawaja et al. (2019) Mon. Notices Royal Astron. Soc.489(4)5231-5243
[9] Srama et al. (2004) The Cassini-Huygens Mission, 465-518
[10] Klenner et al. (2020a) Astrobiology 20:179–189
[11] Klenner et al. (2020b) Astrobiology 20:1168–1184
[12] Klenner et al. (2021) AGU 2022,857183
[13] Annesley (2003) Clin Chem 49:1041–1044
[14] Carlson et al. (2009) Europa. University of Arizona Press, pp.283–327
[15] Trumbo et al. (2019) Sci. Adv. 5(6), eaaw7123
[16] Zolotov & Shock (2001) J. Geophys. Res. 106, 32815–32827
How to cite: Napoleoni, M., Klenner, F., Khawaja, N., Hillier, J. K., and Postberg, F.: Analogue Experiments for the Mass Spectral Analysis of Organic Compounds form the Salt-rich Surface of Europa, Europlanet Science Congress 2022, Granada, Spain, 18–23 Sep 2022, EPSC2022-193, https://doi.org/10.5194/epsc2022-193, 2022.
To assess the potential habitability of Europa, it is important to understand its chemical composition (Hand et al., 2007). Young terrain features on Europa’s surface likely consist of material up-welled from the liquid water source below (Wilson et al., 1997; Pappalardo et al., 1998; McCord et al., 1999; Figueredo and Greeley, 2004; Mével and Mercier, 2007), encoding relevant compositional information. A major science objective of NASA’s Europa Clipper mission is to characterize the composition of young terrain features using data acquired on close flybys. The Surface Dust Analyzer (SUDA) is an in situ instrument that collects and analyzes the composition of individual grains (Kempf et al., 2012), which are ejected from Europa’s surface by a continuous bombardment of interplanetary impactors (Krüger et al., 1999, 2003; Goode et al., 2021). By applying a dynamical model to these particles, we compute the probability of SUDA’s detections originating from a given feature along the flyby trajectory based on Monte Carlo (MC) simulations. The time-of-flight (TOF) mass spectra that characterizes the chemical composition of individual grains results in a time series of various compositional types along the flyby. We present here a method to analyze a time series of compositional spectra recorded by SUDA that provides a robust estimate for the abundance of different compositional types on the surface, resolved for features along the ground track of the flyby. By demonstrating the association of compositional detections with geological sites of origin, data collected by SUDA is used to infer the compositional ground truth for young terrain features on Europa.
How to cite: Goode, W., Kempf, S., and Schmidt, J.: Mapping the composition of Europa’s young terrain features with SUDA, Europlanet Science Congress 2022, Granada, Spain, 18–23 Sep 2022, EPSC2022-150, https://doi.org/10.5194/epsc2022-150, 2022.
Introduction : Europa’s surface is one of the youngest surfaces in the solar system. The great diversity of morphologies observed quickly raised the question of the processes responsible for this active resurfacing. The Jovian moon is believed to hide a global liquid water ocean under its ice crust [1] which led to the assumptions of exchange between the surface and the putative subsurface ocean [1]. In addition, Europa is exposed to intense space weathering due to the continuous bombardment by electrons and ions from Jupiter’s magnetosphere [2]. The surface therefore appears as the key witness of these internal and external processes.
To finely characterize the microphysics of the ice it is necessary to use radiative transfer (RT) modeling. Such modeling allows to estimate these parameters integrating the highly nonlinear effects of the light path within the icy regolith due to scattering. A recent work has been proposed to determine surface properties using Bayesian Monte Carlo Markov Chain (MCMC) [3]. This approach is based on RT models [4,5] using the optical properties of the considered chemical species and physical properties of the regolith. Here we report the use of a RT model [5] in a Bayesian MCMC inference framework to retrieve microphysical properties of Europa's surface using the Galileo Near-Infrared Mapping Spectrometer (NIMS) hyperspectral data [6].
Data: We use data acquired by NIMS collected during the Galileo mission. Here we present the analysis of calibrated data from the hyperspectral cube "e6007ci" (available from the PDS archive) from the trailing Anti-jovian hemisphere (Fig. 1). The estimated signal-to-noise ratio (SNR) is between 5 and 50, we mainly focus on the 1.0-2.5 µm region for which the SNR is higher. Within this spectral range the uncertainty on the absolute calibration is up to 10% [7].
Radiative transfer model requires the optical constants of the pure chemical species considered. Here we consider 15 different compounds: crystalline and amorphous water ice [7,8], sulfuric acid octahydrate (SAO; [2]), hydrated sulfates [9,10], hydrated chlorine salts [11], and minerals such as magnetite [12], sodium chloride [13] and ammonium sulfate [14].
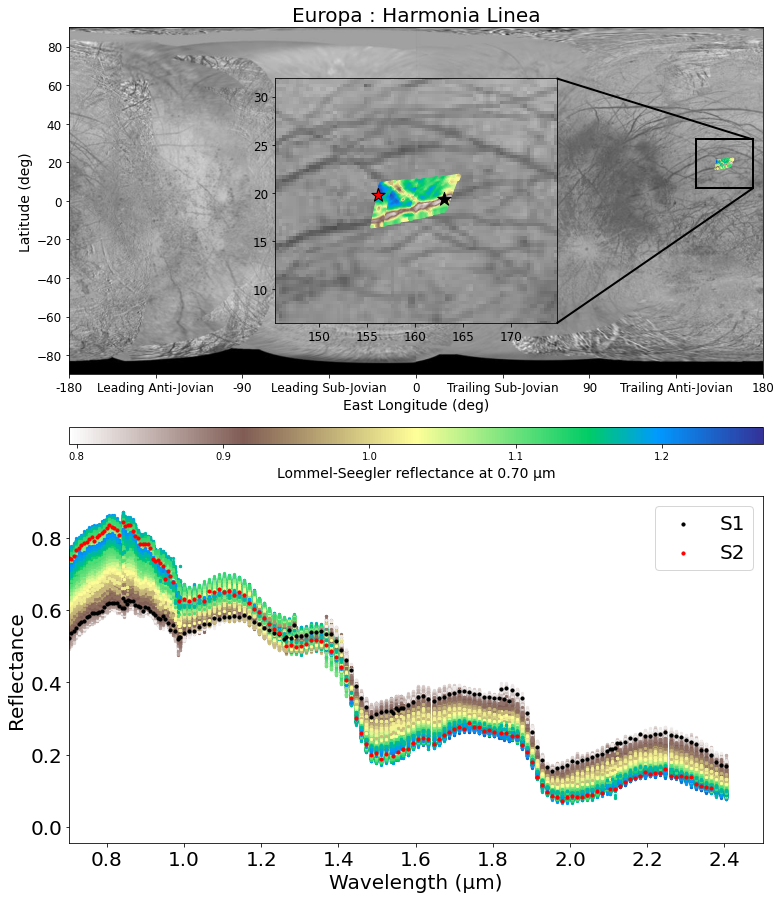
Figure 1 - (top): Map of Europa with a zoom on Harmonia Linea observation. The color represents the reflectance at 0.7 µm normalized using the Lommel-Seegler law. (bottom): all spectra from the corresponding cube and the selected spectra (S1 and S2) used in this study.
Method: We use a MCMC Bayesian inference approach [15,16] to analyze NIMS spectra because it has the advantage of allowing the exploration of a large parameter space and looking for non-unique solutions while statistically constraining the model parameters [17,18]. We compute the bidirectional reflectance of the regolith using a RT model [5]. Then, the algorithm is used to sample the parameter space following the Bayesian Posterior distribution. The parameters we are adjusting are: abundances, grain size of each chemical species and macroscopic roughness of the regolith. For the abundances we use a Dirichlet prior to ensure that they are sum up to 1, while we use a uniform distribution prior for the other parameters.
A first study was done to test all combination of 3, 4 and 5 chemical species among the 15 compounds on the S1 spectrum to select the most appropriate chemical species to consider for the surface characterization. For each of this combination (4823 in total), we perform the MCMC inversion.
Results: We first discuss the chemical species selection (called here endmember) by looking at all best-fit from all combination of 3, 4 and 5 endmembers and their associated RMS. We first show that going from 3 to 4 endmembers significantly improves the quality of the fit while using 5 endmembers only slightly improve it. In addition, some compounds appear necessary to reproduce the observation, such as water ice and SAO. We show that adding either hydrated sulfates or chlorine salts produces results substantially similar. Fig. 2 illustrates such results when considering 4 endmembers. Finally we perform MCMC inversion with 5 endmembers including both crystalline and amorphous water ice. The best fit from the 5 endmembers model and their associated posterior pairwise distribution are shown fig. 3 and 4 for the S1 and S2 spectra.
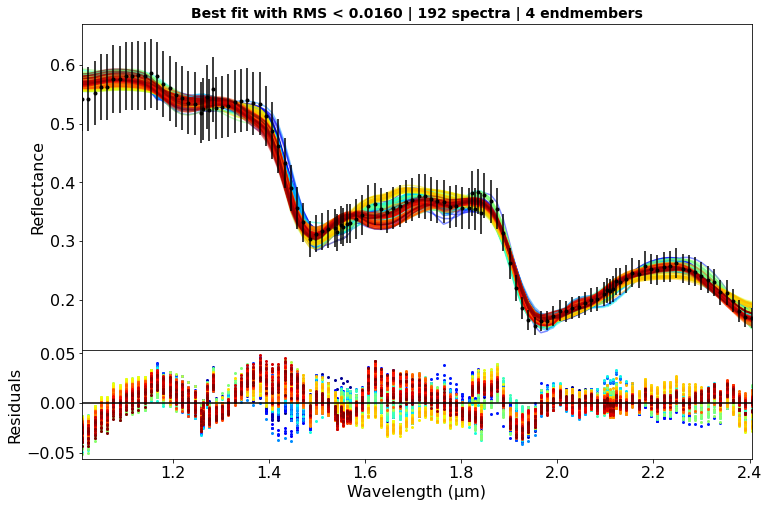
Figure 2 - Results of all combination for the 4 endmembers case: only the best-fit with RMS below 0.016 are showed.
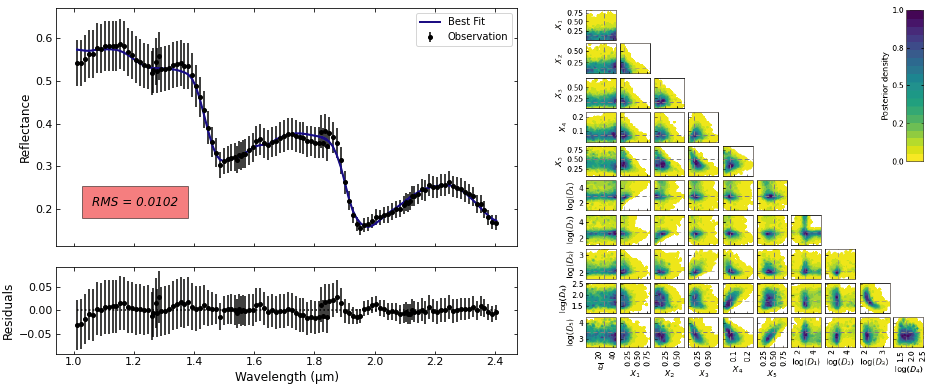
Figure 3 - results for S1: best fit (left) and pairwise posterior distribution (right) using 5 endmembers.
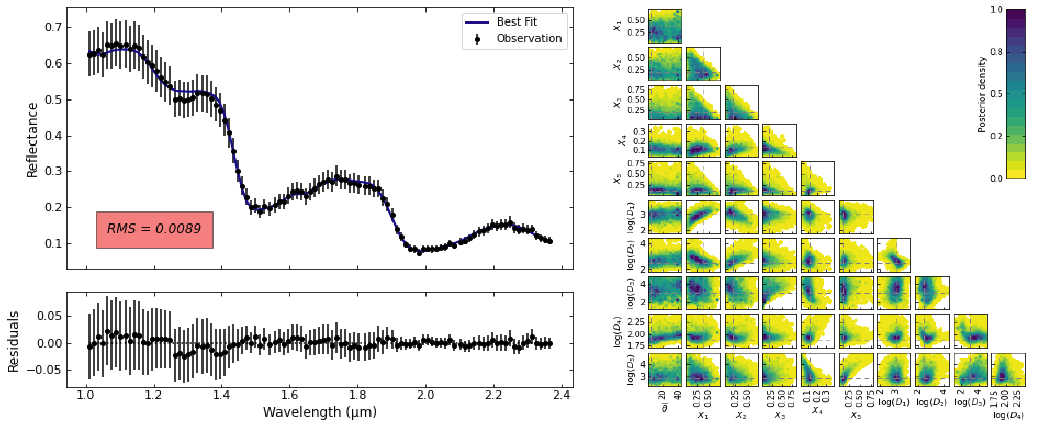
Figure 4 - results for S2: best fit (left) and pairwise posterior distribution (right) using 5 endmembers.
Conclusion: We tested, for the first time and in a systematic way, the inversion of Galileo NIMS infrared spectra using a significant number of 3, 4 and 5 compounds combinations out of a selection of 15 chemical compounds, using a non-linear radiative transfer model. We found that there is no unique solution to determine the exact composition of the surface, but a family of endmember are required: water ice, SAO and sulfates. This composition set seems to be coherent for both bright and dark regions of Europa. We will discuss the implication of these results on the Europa’s surface processes.
References: [1] Pappalardo, R. et al. (1999) JGR. [2] Carlson, R. W. et al. (2005) Icar. [3] Mishra, I. et al. (2021) Planet. Sci. [4] Hapke, B. (2012). Cambridge Univ. Press. [5] Douté. S. and Schmitt. B. (1998) JGR. [6] Carlson, R. et al. (1992) ed. C. T. Russell. [7] Schmitt, B. et al. (2004). [8] Trotta, F and Schmitt, B (2018). [9] Dalton, J.B. et al. (2012) JGRE. [10] D. Angelis, S et al. (2021) Icar.. [11] Hanley, J. et al. (2014), JGR. [12] Roush, T. et al. (2021) Icar. [13] Querry, M. (1987). [14] Fastelli, M. et al. (2022), Icar. [15] Cubillos, P. et al. (2016), The Astr. Jour. [16] Braak, C. J. F. (2008), Stat & Comp. [17] Mosegaard, K. et al. (1995) JGR. [18] Schmidt, F. and Bourguignon, S. (2019) Icar.
How to cite: Cruz Mermy, G., Schmidt, F., Andrieu, F., Belgacem, I., Cornet, T., and Altobelli, N.: New insights into Europa's surface using Galileo/NIMS data and MCMC modeling, Europlanet Science Congress 2022, Granada, Spain, 18–23 Sep 2022, EPSC2022-825, https://doi.org/10.5194/epsc2022-825, 2022.
Introduction
Europa's surface is the youngest of the icy satellites and shows signs of recent activity [1]. The main driver of this activity is Jupiter’s tidal forces which are responsible for the existence of a global water ocean underneath Europa’s icy crust [2]. This ocean is thought to be in a direct contact with the rocky mantle [3] creating a potential environment for the emergence of life.
This places Europa at the center of future space exploration with NASA’s Europa Clipper mission [4] as well as ESA’s JUpiter ICy moons Explorer (JUICE) that will more generally study the Jovian icy moons [5].
To prepare for those missions, it is crucial to get the most out of the data we currently have. Photometry plays a key role in deriving remote sensing science products. As such, photometric correction is often the first step of any remote sensing analysis such as mapping or spectroscopy. In itself, photometry is closely linked to the surface microtexture and can help us better understand its physical state [e.g. 6, 7].
In this work, we are deriving photometric parameters for selected areas of Europa - we analyze their spectral dependency and how that can be translated into physical properties.
Dataset
We are revisiting data from Galileo’s Near Infrared Mapping Spectrometer (NIMS) [8] that operated between 0.7 – 5.2 m.
Calibrated and georeferenced data cubes (g-cubes) archived in the PDS Imaging Node have been stored in a database [9] with relevant information such as longitude, latitude, wavelengths, reflectance value, photometric angles etc. This tool allows for a comprehensive view of the dataset and quick exploration to assess the surface and angle coverage available for our study.
Due to changes in the wavelengths calibration and detector failures during operations, the phase angle coverage is very variable across the spectrum (from one cube to the other) with ranges from a few degrees to 80 degrees. We favor spectral intervals with a dense phase coverage. Moreover, to accommodate the shift in the wavelengths reference over time as well as to maximize our geometric diversity, we will not be looking at specific wavelengths but at 40 nm wide ranges of wavelengths across the spectrum.
We retrieved the reflectance and geometry information for a selection of regions of interest across the surface (Figure 1) by finding a compromise between interesting regions and relevant phase angle and spectral coverage.
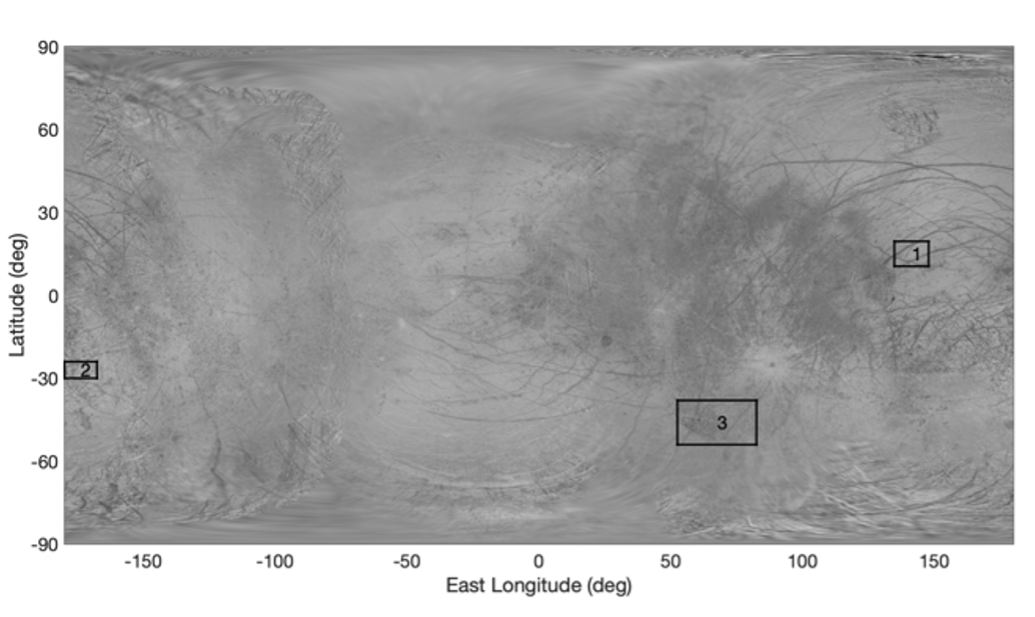
Figure 1: Map of Europa (credits: Björn Jónsson) with studied areas highlighted
Estimation of photometric parameters
For each area we are considering, we estimated a set of photometric parameters for every 40 nm wavelength interval we have defined. For this work, we are considering Hapke’s direct model detailed in [10] and [11]. Six parameters are to be estimated: phase function (b, c), single-scattering albedo (ω), rugosity (θ ̅), opposition effect (h and B_0).
We used an estimation method based on Bayesian statistics and that we developed for our regional studies of Jupiter’s icy moons in the visible [12, 13, 14]. This allows for of the parameters was inferred except for their physical domain of variation. The posterior Probability Density Functions (PDFs) are sampled with a Monte Carlo Markov Chain algorithm.
Results
We analyzed the different parameters over our three areas of study. Results were very heterogeneous in terms of accuracy across the spectrum but it is clear that the photometric parameters do vary somewhat with the wavelength, as also observed in laboratory experiment [15].
Figure 2 shows the example of the single-scattering albedo and macroscopic roughness estimations between 700 nm and 5 μm for ROI#1 in the leading hemisphere and a sample of wavelengths for which we have well constrained results.
Even though with naïve theoretical considerations we would expect a constant roughness - independent of wavelength - we found here that θ ̅ seems to become more important with higher wavelengths and lower reflectance. This could be related to specific absorption patterns or the presence of certain inclusions that would influence the photometric behavior in preferred wavelengths. In addition, roughness, as observed at various scales determined by the wavelength, may differ in natural material. This phenomenon is known as scale dependence roughness and may play a role here. Here we confirm the first-order dependence of absorptivity and roughness, determined in laboratory measurements [15].
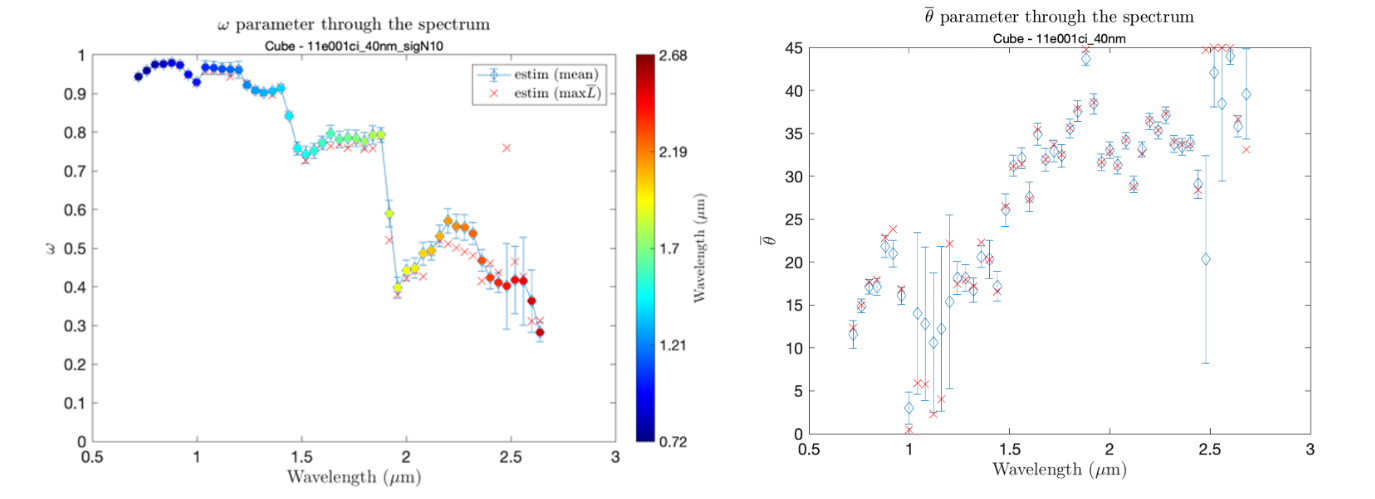
Figure 2: Spectral evolution of the single scattering albedo (left) and the macroscopic roughness (right) for ROI#1 estimated via mean of posterior distribution (blue) and maximum likelihood (orange)
Conclusion and future work
Based on this work, we aim at locally derive photometric corrections that can be used for other remote sensing products like mapping and spectroscopy. The physical implications of a spectrally dependent macroscopic roughness or phase function might also contribute to a better understanding of the history of Europa’s surface and will be our primary focus going forward.
Studying the spectral dependence of the Hapke parameters specifically is interesting as this model is one of the most widely used to investigate radiative transfer in relation to planetary surfaces. Nonetheless, a lot of different photometric models could also be considered. We plan to complement this work by studying the spectral dependency of other photometric models [e.g. 14, 16].
References
[1] Pappalardo, R. T. et al. (1999) JGR: Planets, 104 (E10) :24015_24055. [2] Carr, M. H. et al. (1998) Nature. [3] Vance, S. D. et al. (2018) JGR: Planets, 123. [4] Phillips, C. B. and Pappalardo, R. T. (2014) Eos, Transactions American Geophysical Union. [5] Grasset, O. et al. (2012) Planetary and Space Science. [6] A. McGuire, A. and Hapke, B. (1995) Icarus. [7] Souchon, A. et al. (2011) Icarus. [8] Carlson, R. W. et al (1992) Space Science Review. [9] Cornet, T. et al. EPSC 2022. [10] Hapke, B. (1993) Cambridge University Press. [11] Hapke, B. (2002) Icarus, vol. 157. [12] Schmidt, F. and Bourguignon, S. (2019) Icarus. [13] Belgacem, I. et al. (2019) Icarus. [14] Belgacem, I. et al. (2021) Icarus, vol 369. [15] Pilorget, C. et al., (2016) Icarus [16] Oren, M., Nayar, S. K. (1994) SIGGRAPH94.
How to cite: Belgacem, I., Cornet, T., Schmidt, F., Cruz Mermy, G., Andrieu, F., and Altobelli, N.: Spectral variation of Europa’s regional photometry, Europlanet Science Congress 2022, Granada, Spain, 18–23 Sep 2022, EPSC2022-359, https://doi.org/10.5194/epsc2022-359, 2022.
The solid-state imaging experiment onboard the Galileo mission returned around 700 images of Jupiter’s icy moon Europa [1]. These images revealed a young surface that seems to have undergone resurfacing processes, mainly caused by ridges that overprint older ridged terrains [2]. Tidal stress fields from resonances with other Galilean moons and non-synchronous rotation seem to drive geophysical surface processes. Although the Galileo images have undergone substantial study, formation mechanisms of linear surface features and connected to that, the thickness of the ice layer, are not well constrained, but many hypotheses are proposed [3]. However, a statistical analysis of linear surface features in terms of photometric properties has not yet been done.
With this work, we aim to provide a deeper understanding of geophysical processes on the surface of Europa. Furthermore, it is valuable for future mission design and planning, e.g. for the upcoming Europa Clipper mission [4], to find places that show anomalies or that would benefit from further investigations.
We analyse manually segmented linear surface features in selected Galileo images of intermediate resolution (150 - 600 m/px). The surface feature categories we investigate are 1) bands, 2) double ridges, 3) ridge complexes and 4) undifferentiated lineae. Additionally, we also segment cusps, which indicate cycloidal features. Since the cross-cutting relationships are preserved during segmentation, we can gain insights into the geological history. With these segmentations, we can retrieve the length, width and the main direction of each linear feature, while taking the number of overprints into account, in order to analyse the tidal stress field and its development over time. We look into differences in radiance between the different linear surface features with respect to the geological history to learn about endogenic and exogenic processes. More specifically, we extract radiance profiles along the direction of maximal change. For double ridges for example, we extract a w-shaped profile that let’s us investigate symmetry and differences between instances of double ridges. These analyses could turn out useful in constraining formation mechanisms for linear surface features and in reconstructing the geological history of Europa’s surface. The current status of our work is presented.
References:
[1] Belton, M. J. S., et al., The Galileo solid-state imaging experiment, Space Sci. Rev., 60, No. 1/4, 413-455.
[2] Greeley, R., et al., Europa: Initial Galileo Geological Observations, Icarus, Vol. 135, No. 1, 4-24, 1998
[3] Daubar, I., et al., Planned Geological Investigations of the Europa Clipper Mission, in prep.
[4] Richey, C., et al., The Europa Clipper Mission: Science Objectives and Mission Status Update, AGU Fall Meeting Abstracts, 2018
How to cite: Haslebacher, C. and Thomas, N.: Statistical analysis of manually segmented linear surface features in Galileo images of Europa, Europlanet Science Congress 2022, Granada, Spain, 18–23 Sep 2022, EPSC2022-577, https://doi.org/10.5194/epsc2022-577, 2022.
1. Introduction
The Jovian icy moon Europa will be the target of the Europa Clipper mission, which carries the REASON instrument, a dual-frequency radar sounder.
Radar sounders operate by emitting electromagnetic waves towards a solid planetary body and by recording subsequent reflections of these waves from discontinuities of the dielectric constant, which confers them the capability to image subsurface features. As radar sounders are sensitive to the delay of echoes, a major issue these instruments have to overcome is the problem of discriminating a genuine subsurface feature from a surface feature located away from nadir at an equivalent delay (i.e. clutter).
The REASON instrument will have the capability to use interferometric clutter discrimination in its VHF component (f=60 MHz). This is enabled by the presence of four radiating elements, forming two independent groups of two antennas, L and R, separated by a baseline (see Fig. 1). By comparing the phase of a features in the L and R signals, it is possible to determine, under certain conditions, if the feature is a subsurface reflector at nadir of if it originates from a non-nadir position on the surface [Castelletti et al., TGRS, 2017][Haynes et al., TGRS, 2021].
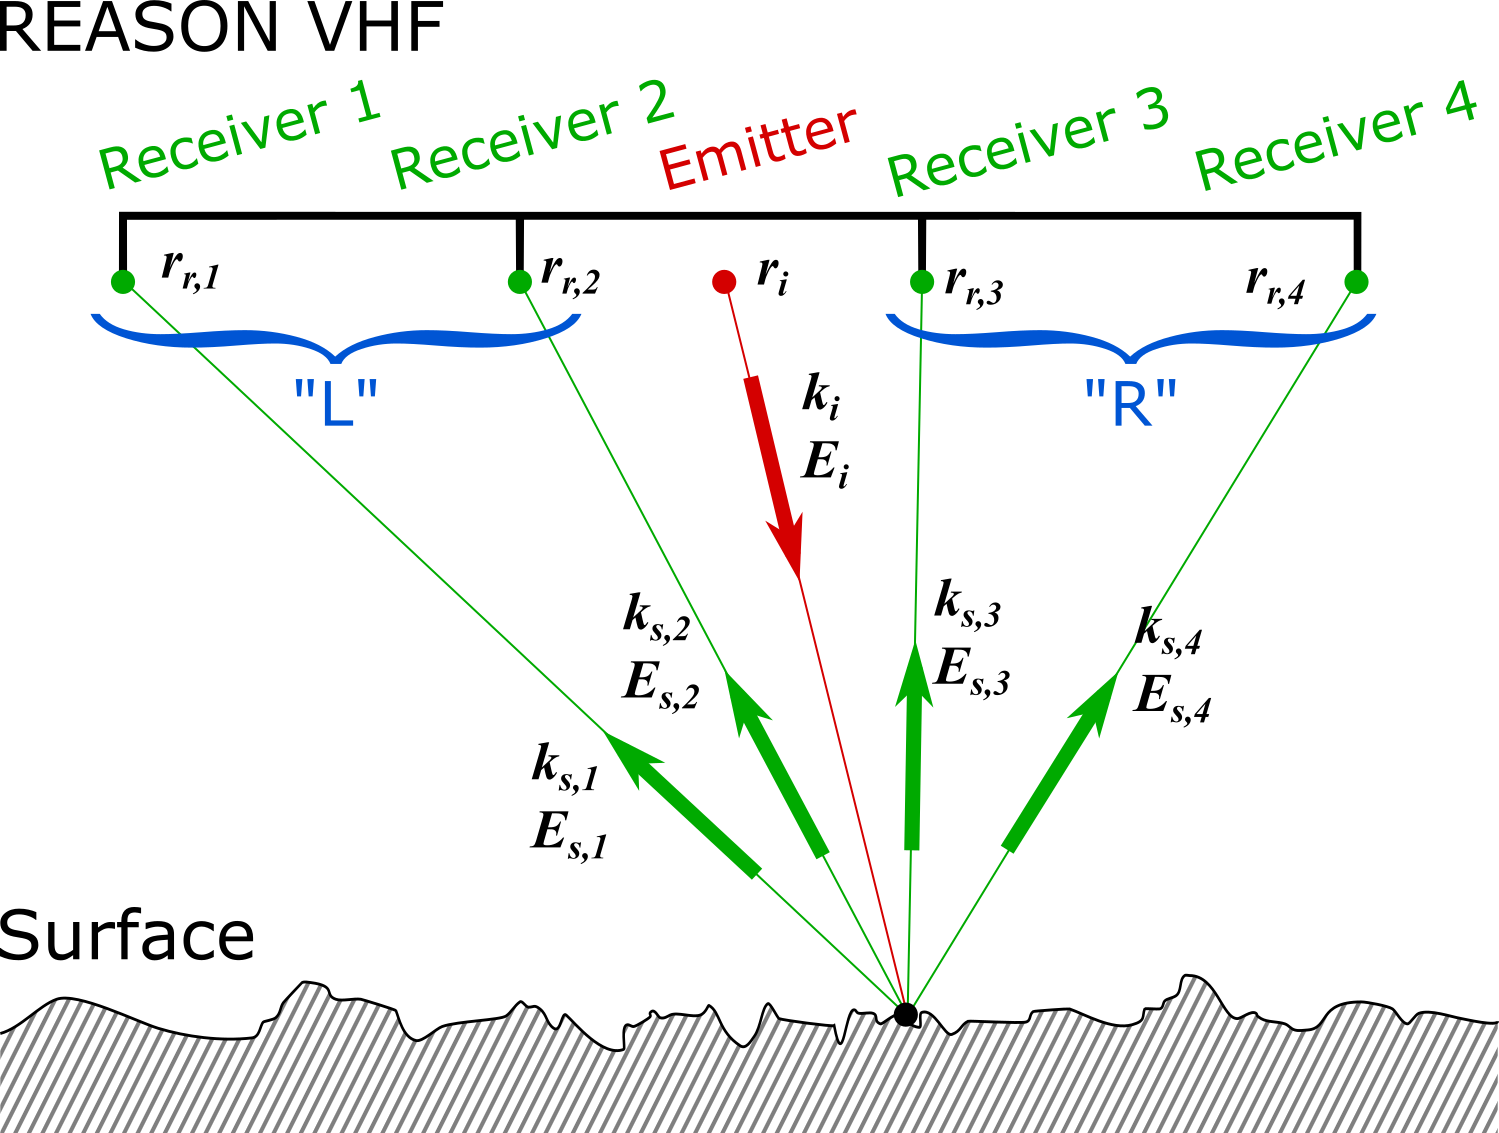
Fig. 1 - Schematic representation of the REASON VHF interferometric scattering geometry as implemented in the simulator.
On Europa, features known as multiring basins are of particular interest to the planetary science community as their formation depends on the thickness and structure of Europa's ice shell at the time of the impact, and are foreseen to be studied by REASON. However, the clutter environment they represent is likely to be challenging, which warrants having a good prior understanding of how clutter will interact with possible subsurface targets.
To predict the detectability of subsurface targets in the presence of such a unique clutter environment, we will make use of an advanced Stratton-Chu simulator, which has the capability to consider subsurface layers or large inclusions, subwavelength roughness on the DEM (digital elevation model) facets, and which we have generalised to multiantenna sounders with interferometric capabilities such as REASON. The multilayer aspects have been described in [Gerekos et al., TGRS, 2018][Gerekos et al., IGARSS, 2018] whereas the rough facet generalisation has been outlined in [Gerekos et al., IGARSS, 2022 (accepted)]. In this abstract, we present simulation results over a Martian crater, discuss possible clutter models for Europan ridged terrain, and how the capabilities of such a simulator could be leveraged to have a precise understanding of REASON's capabilities over these landforms.
2. Simulations over a Martian crater
As all four antennas fire at once, we consider the emitter to be a fictional point at the centre of the VHF array (see Fig. 1). The receivers are located at the four different antennas, and the echoes are simulated for each antenna, making use of the bistatic formulation on which [Gerekos et al., TGRS, 2018][Gerekos et al., IGARSS, 2018] is based. The fields received at each pair of antennas are combined into an L and R signal as described above. The considered REASON altitude in this test is 50 km.
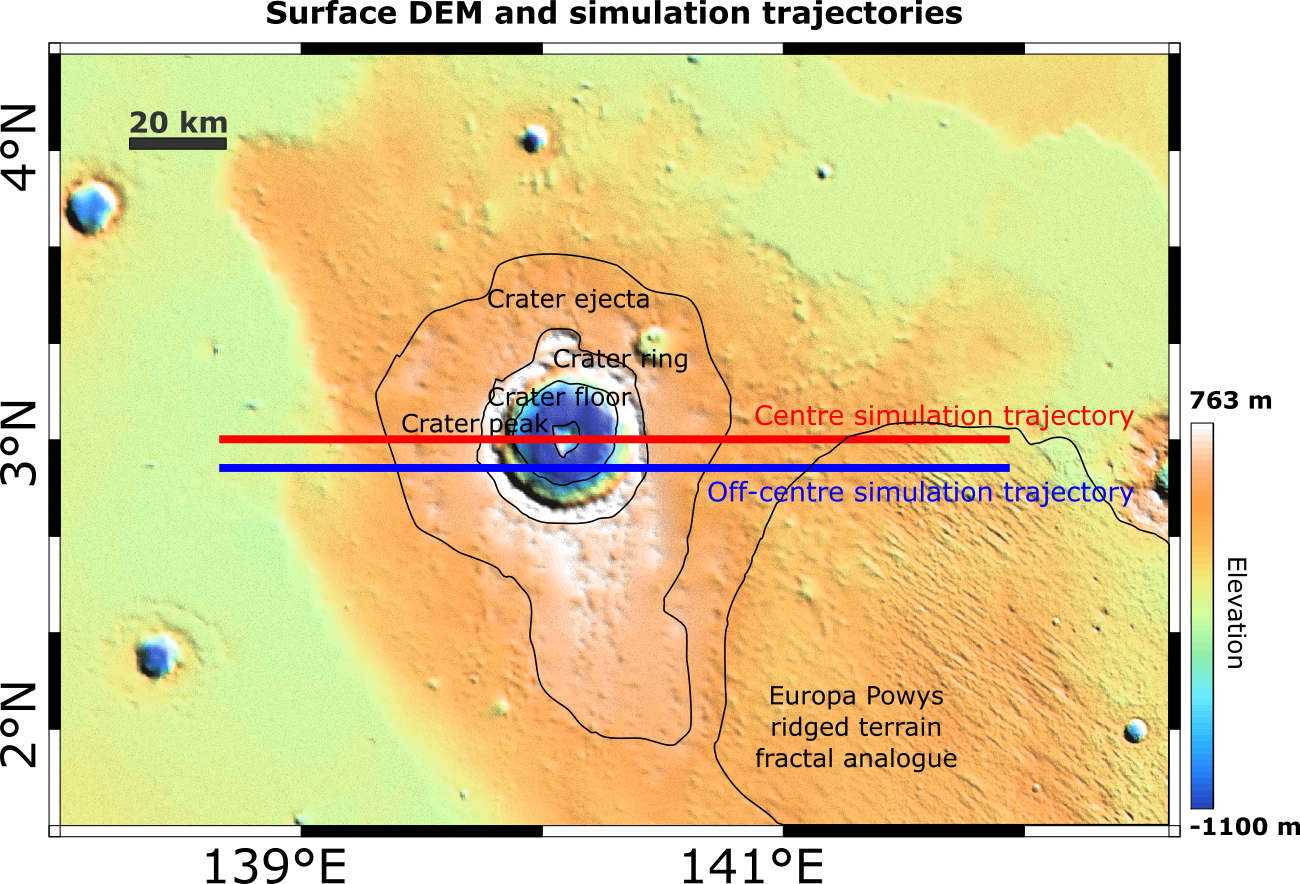
Fig. 2 - MOLA-HRSC DEM (200m resolution) of a crater in Aeolis Planum, Mars, with some geologic units shown as black outlines, and the simulation trajectories as the red and blue lines.
The DEM we used is that of highly circular a peaked crater in Aeolis Planum surrounded by a Europa Powys ridged terrain fractal analogue [Gerekos et al, Icarus, 2021], Mars, and is shown in Fig. 2. Two simulations are conducted: one going through the centre of the crater and one having a slight offset to the South. A uniform small-scale roughness of σ=1m, l=60m is considered on the DEM facets.
The centred and off-centre simulation results are shown in Figs. 3 and 4, respectively. The surface on either side of the crater has an unambiguously zero intereferometric phase as expected, whereas the echoes from further off-nadir in the ridged area show a distinctive non-zero phase difference, showing that the interferometric clutter discrimination is having the expected effect in the simulation. Likewise, clutter echoes around the crater area can be identified and separated from the otherwise identical-looking floor echo. Comparing the two tracks, we can see how introducing asymetry within the sounding geometry can lead to potentially easier clutter discrimination, at least when it comes to the crater ring.
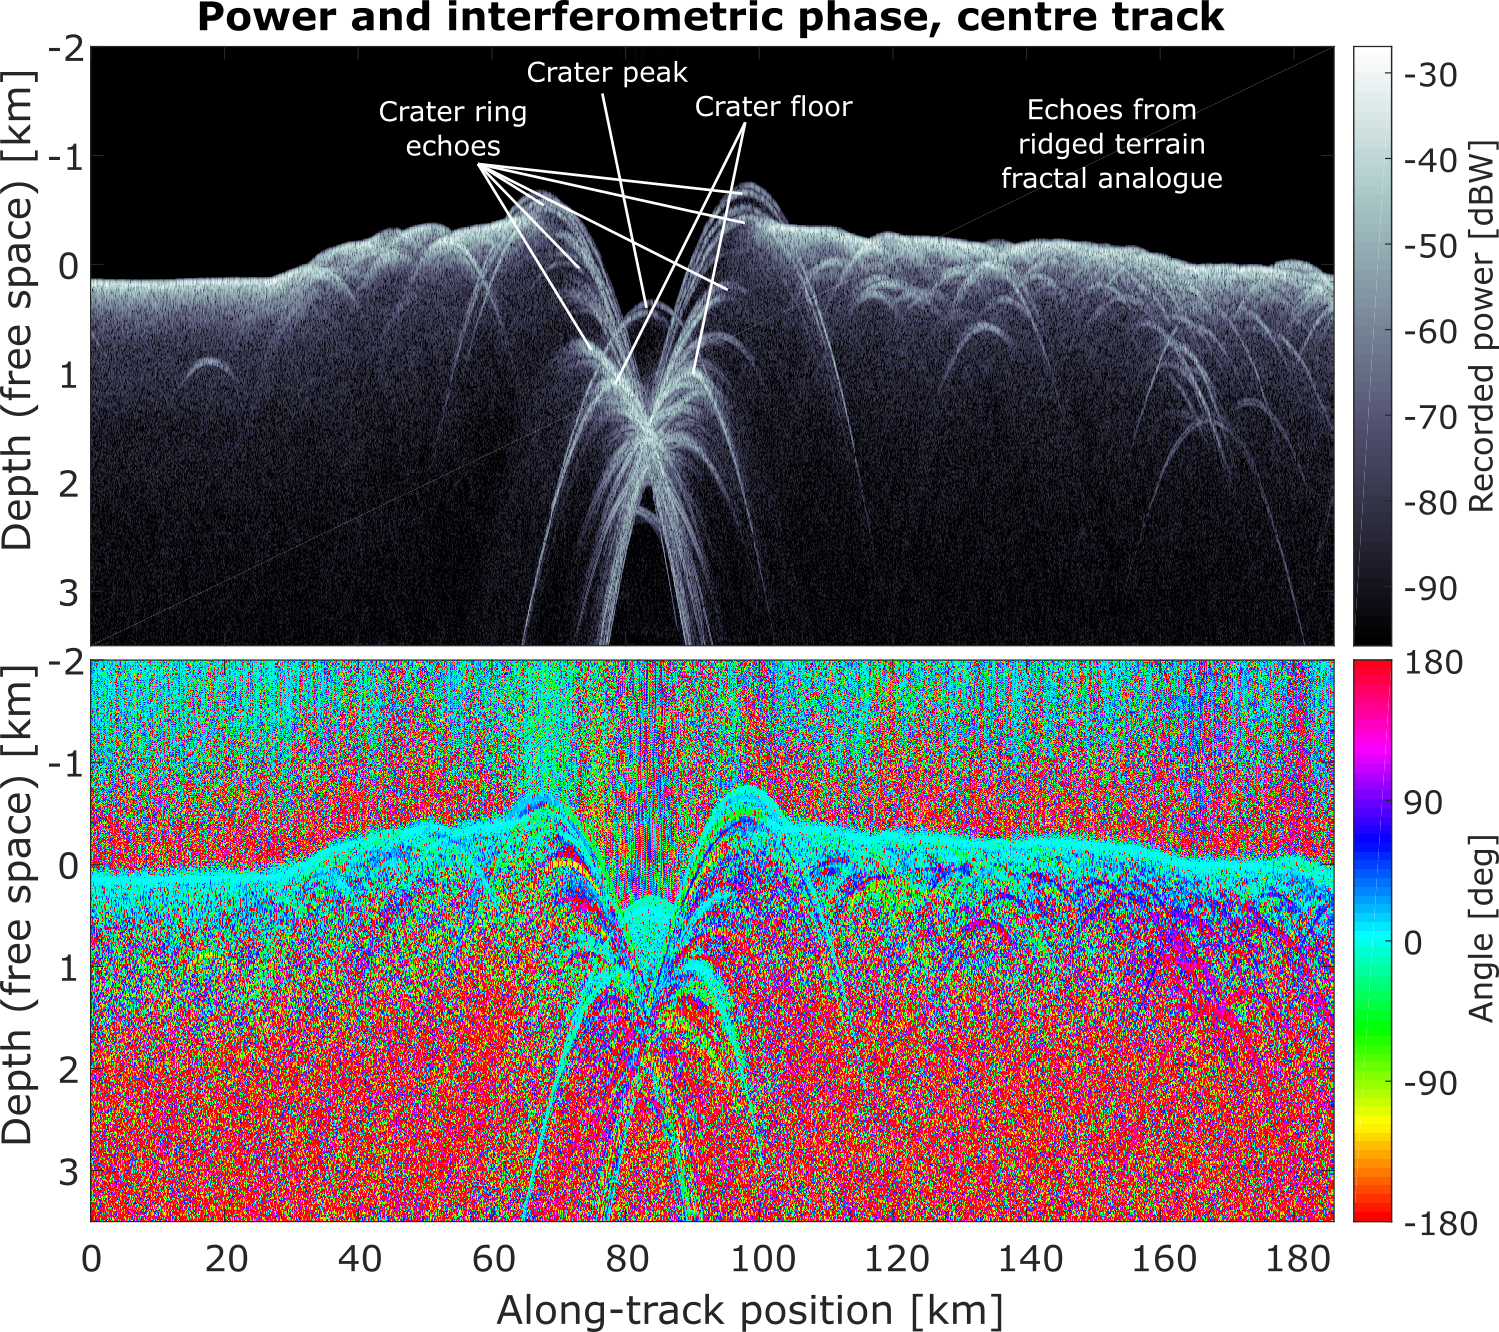
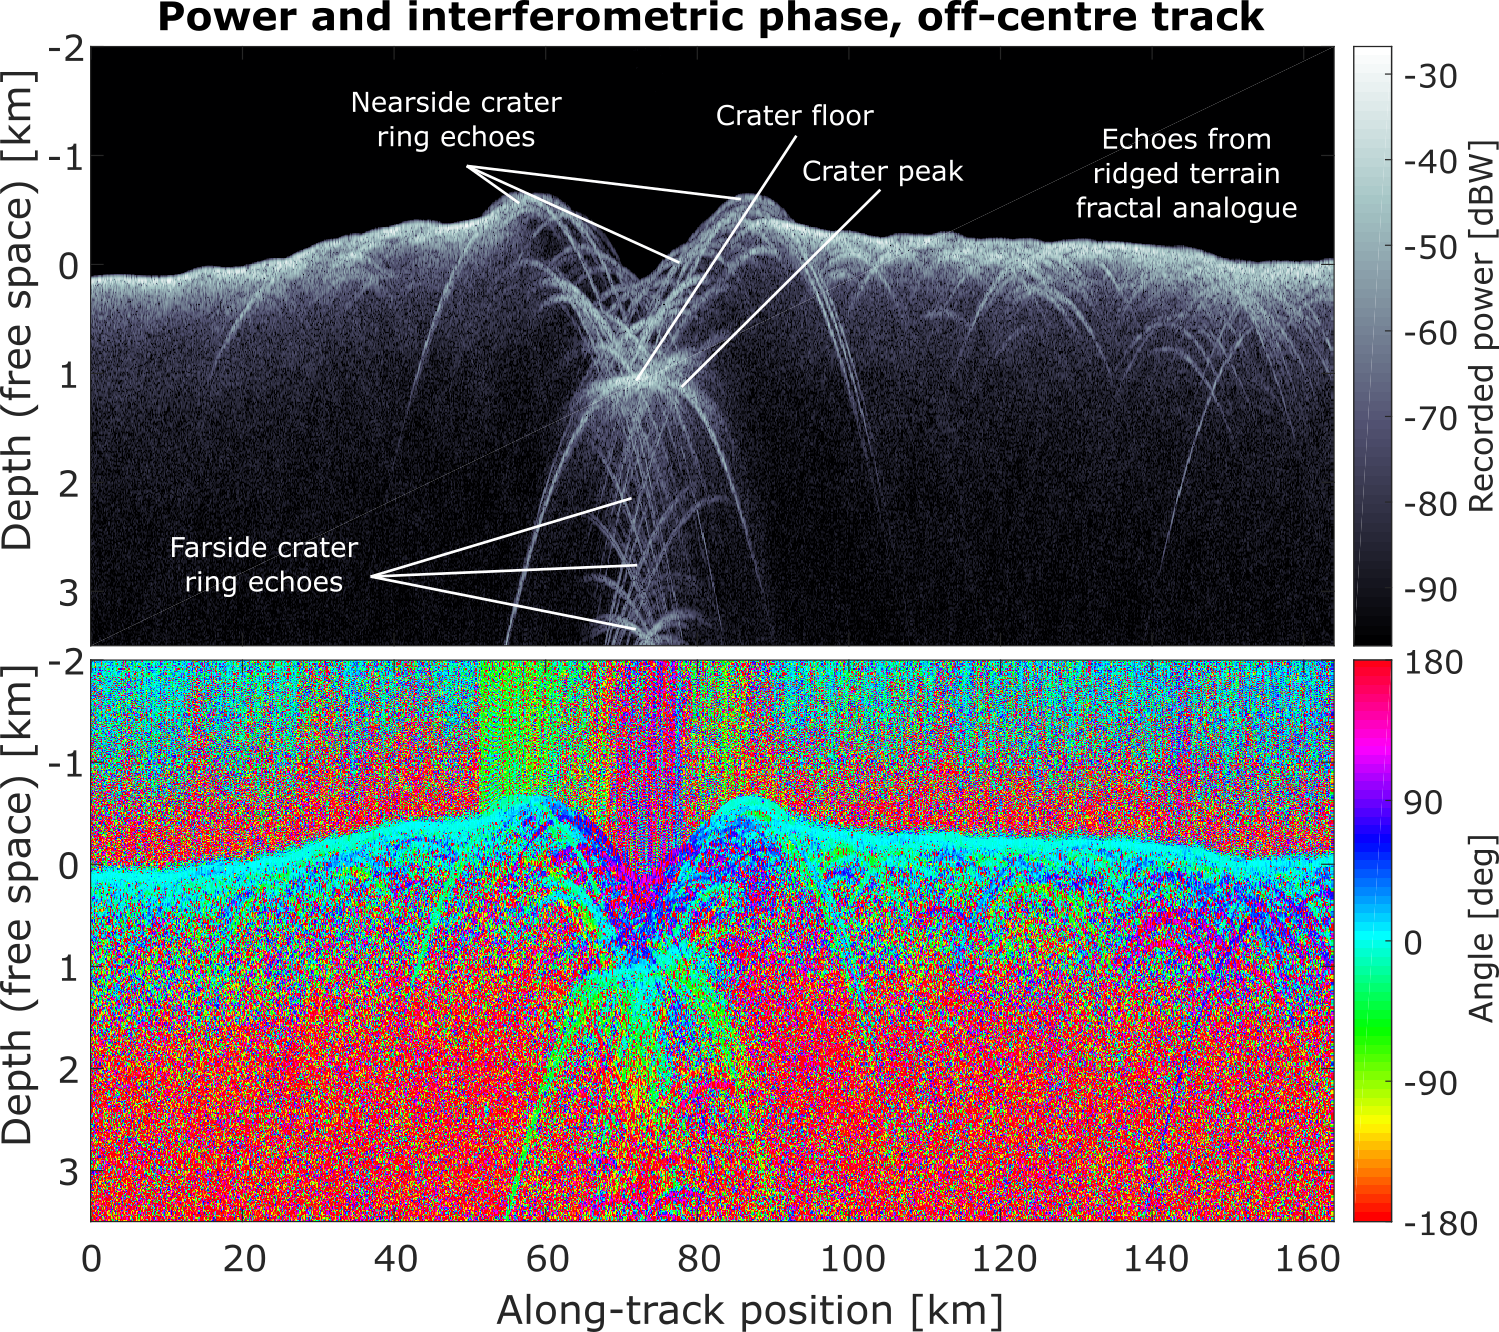
Figs. 3 and 4 - Intereferometric simulations results for the "centre" (left) and "off-centre" (right) scenarios depicted in Fig. 2. The top image represents the backscattered power from all channels combined, PL + PR, whereas the bottom one represents the difference between the phase two channels, <φL - <φR.
3. Towards multiring basin clutter environment description
Multiring basins are thought to be formed by the impact of massive projectiles. During the collapse of the initial crater, low-viscous ice, or even water, at depth would flow towards the center, filling the gap left by material excavated from the impact. As the overlying crust is pulled inward, normal faults form, shaping the characteristic concentric rings around the basin's center. A depiction of the geological units of such basins is shown in Fig. 5. The two prominent multiring basins on Europa, Tyre and Callanish, have both diameters around 35 km. Their dimensions, flank slopes, and roughness have been estimated in the literature [Moore et al., Icarus, 1998].
As future work, we plan to construct realistic DEMs of these landforms in order to use our simulator to predict REASON's capability to image subsurface events in presence of such a clutter environment. Leveraging the rough facets modelisation capability of the simulator, we will also be able to consider different subwavelength roughness levels to add to the different geological units of a multiring basin (σi, li in Fig. 5), in addition to its topography, leading to a very complete clutter characterisation.
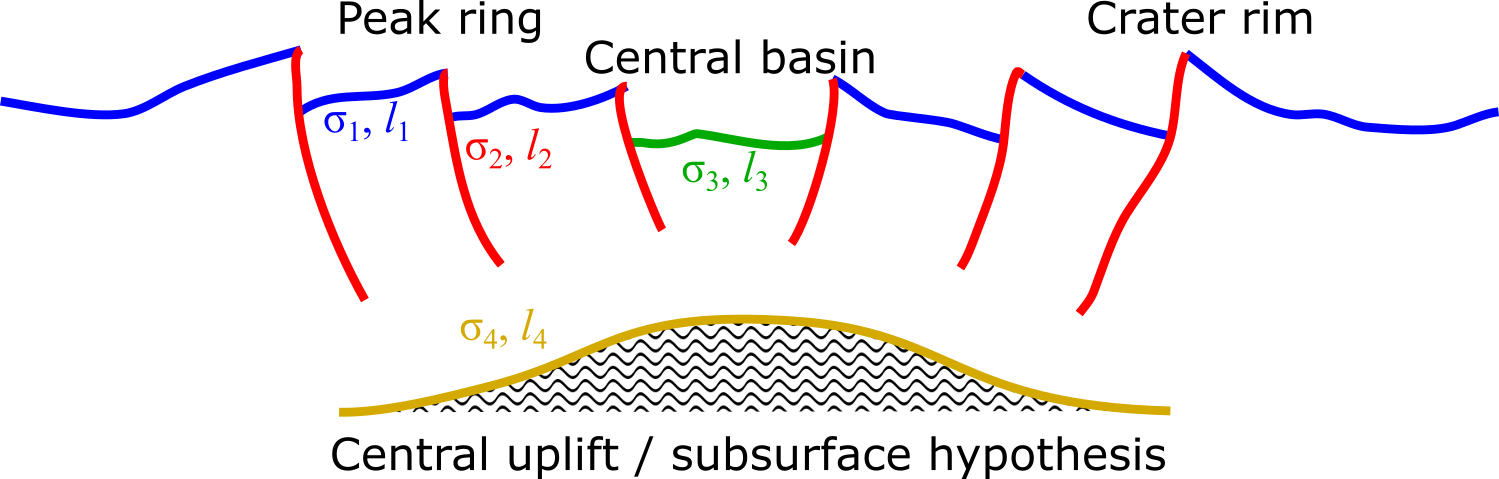
Fig. 5 - Schematic of a multiring basin that will be the basis for smulations of interferometric clutter discrimination over these objects.
How to cite: Gerekos, C., Steinbrügge, G., Haynes, M., Young, D., and Blankenship, D.: Assessing the detectability of subsurface events beneath Europan multi-ring basins with an interferometric radar sounder: Test-simulations on a Martian crater, Europlanet Science Congress 2022, Granada, Spain, 18–23 Sep 2022, EPSC2022-661, https://doi.org/10.5194/epsc2022-661, 2022.
Acknowledgements
The present study received financial supports from the project GRIM funded by the Region Pays de La Loire (France) and from CNES for the preparation of the Europa Clipper mission.
Introduction
Most planetary bodies in the outer solar system are composed largely of water ice, which can behave like granular materials at their surface. These materials present a particle size distribution typically ranging between 10 and 100μm, which is the characteristic size of powders, a class of granular materials [1] that are subjects to potentially very high cohesion forces. This implies mechanical behavior different from those of more classical granular materials. In the particular case of Saturn’s moon Enceladus, jet activity resulting in the deposition of very fine ice grains (~10-100µm) at low temperature (~60-80K) suggest the formation of relatively stable powdery deposits [2]. Analogous processes could also be active on Europa [3, 4]. Characterizing the properties of these ice powders is essential for understanding the evolution of surface morphologies and anticipating the technical problems that future missions may encounter during landing and/or sampling of surface materials.
This study aims at characterizing the mechanical behavior of micrometric ice powders, on a wide range of temperatures, from Martian to Saturn’s moon conditions. The main goal is to quantify the evolution of internal parameters controlling the mechanical properties of ice powder, such as grain cohesion, with temperature, through various experiments. We will also use Discrete Element Method (DEM), a numerical technique in which a granular medium is simulated as multiple particles, interacting by means of contact laws accounting for the impenetrability of matter, friction, etc. Coupling experiments with DEM will place constraints on the properties of such powders, to then apply these results to icy surfaces.
Methods
We developed different methods to produce icy regolith analogue powders, with pure water ice grains of controlled sizes and shapes. A first method to produce analogs is to use a spray nozzle to create a fog consisting of water droplets, frozen in a liquid nitrogen bath (~77K), producing spherical grains with a size of a few micrometers to dozens of micrometers. A second method is to use a grinder, to produce angular grains with a wide range of sizes (dozens to hundreds of micrometers). A sifter allows to better constrain the grain size distribution.
The shape and size distribution of synthesized samples are analyzed using a numerical microscope, coupled with a cryostat to maintain our grains in controlled atmosphere (~80K and 10-1mbar) (fig. 1). We then use a liquid-nitrogen cooled rotating drum to perform dynamical measurements (fig. 2). The goal is to quantify the cohesion by analyzing the angle and irregularities of the flowing surface [5] on a wide range of temperatures (~80-250K). The more cohesive a powder is, the higher is the angle of the surface inside the drum, and the more irregular this surface is. We take several images of the ice powder inside the rotating drum, at multiple rotation speeds, and extract the angle of the surface for each image. We deduce a mean angle, and calculate a standard deviation around this angle, corresponding to a first level of irregularities as illustrated on fig. 3.
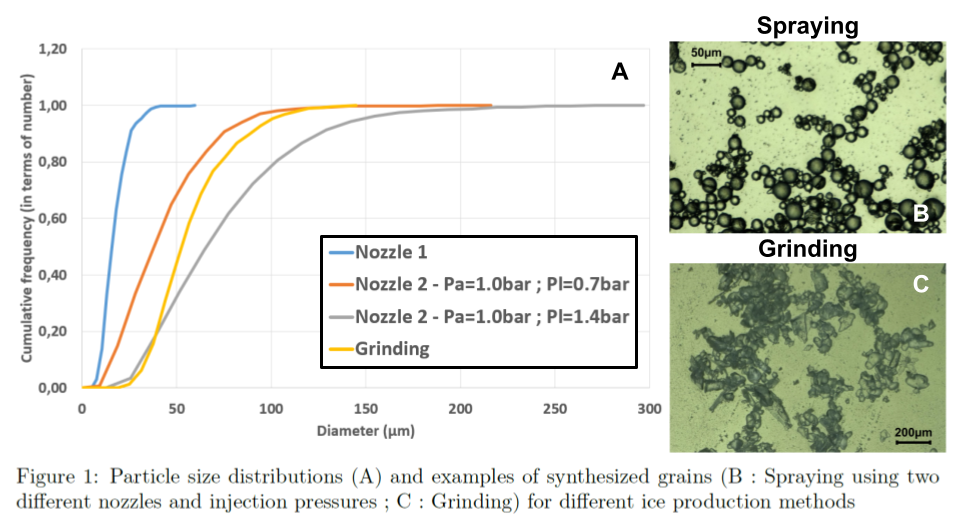
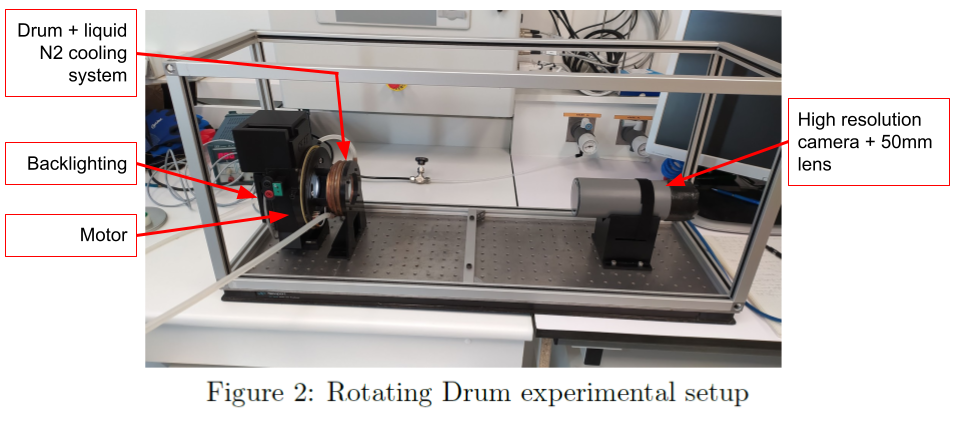
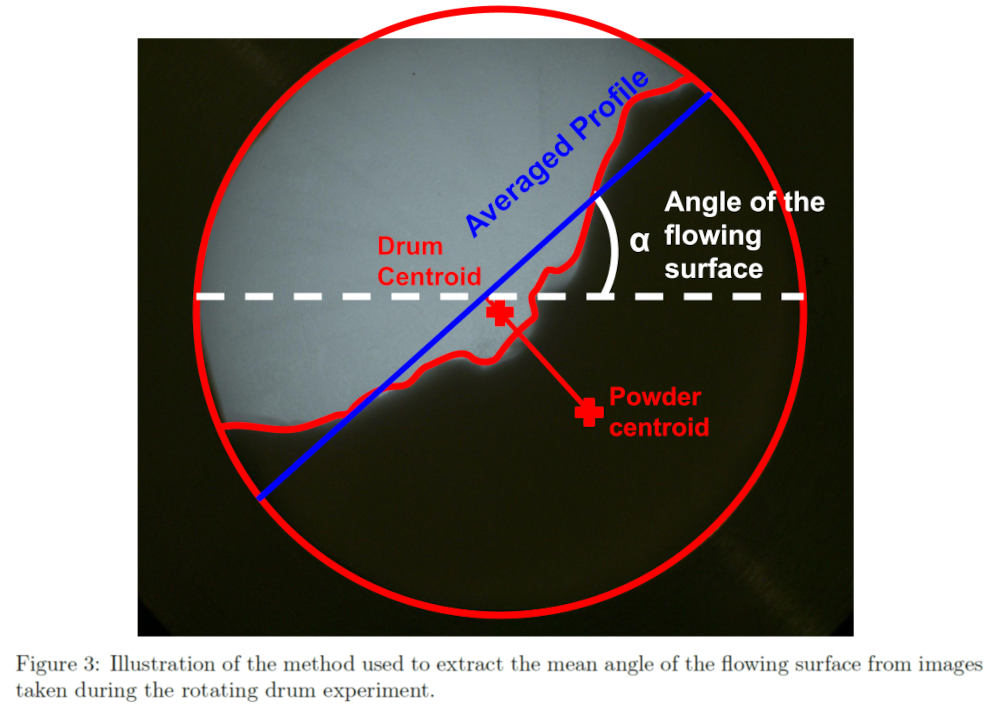
Results
The first measurements performed with the rotating drum on spherical grains ice powders (~40 and 60µm grain populations prepared from spraying at two different injection pressures, fig. 1) show an increase of the mean angle of the flowing surface, as well as an increase of the standard deviation around this angle, within the temperature range of 90 to 150K (fig. 4). This suggests that the cohesion significantly increases with temperature over this range, a surprising result on first look, but in agreement with other studies conducted at higher temperatures (>170K) [6].
We are currently developing numerical DEM simulations in support to the interpretation of the rotating drum experiment, focusing on the effect of cohesion or grain size. An increase of the cohesion in the simulations leads to the same behavior observed in experiments, an avalanche regime, a higher flowing angle and an irregular flowing surface. Decreasing the particle size tends to limit the effect of the walls of the drum, thus the formation of stable grain structures that could artificially give the same effect as an increase of the cohesion, such as an increase of the flowing angle.
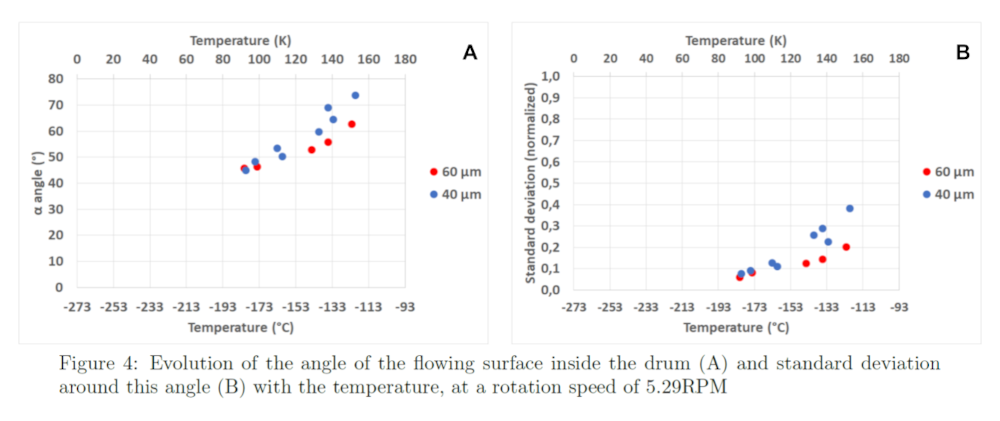
Conclusion
First rotating drum experiments on spherical grains samples of pure water ice indicate a clear dependence of grain cohesion on temperature. Similar experiments on angular grinded grains are currently under development. Experiments will then be performed on more exotic powders, including salt-ice mixtures relevant for Europa and organic-ice mixtures relevant for Titan.
We are also developing another experimental setup, a cold cell to perform shear tests on a powder rheometer (Freeman FT4). This will allow us to get new sets of data, to better constrain complementary properties of the powder.
References
[1] B. Andreotti et al. (2013) Granular Media: Between Fluid and Solid. Camb. Univ. Press.
[2] M. Choukroun et al. (2020) Geophys. Res. Letters, 47(15).
[3] L. Roth et al. (2014) Science, 343:171–174.
[4] W. B. Sparks et al. (2017) ApJ, 839:L18.
[5] G. Lumay et al. (2012) Powder Tech., 224:19–27.
[6] G. Musiolik and G. Wurm (2019) ApJ, 873:58.
[7] B. Gundlach et al. (2018) Monthly Notices of the Royal Astronomical Society, 479:1273–1277.
How to cite: Jabaud, B., Artoni, R., Tobie, G., Le Menn, E., and Richard, P.: The icy regoliths of Enceladus and Europa : experimental and numerical study, Europlanet Science Congress 2022, Granada, Spain, 18–23 Sep 2022, EPSC2022-466, https://doi.org/10.5194/epsc2022-466, 2022.
Introduction
The reliable identification and quantification of biosignatures on extraterrestrial ocean worlds is key to the search for life in our Solar System. Saturn’s moon Enceladus, and potentially Jupiter’s moon Europa, emit plumes of gas and ice grains formed from subsurface water into space (Spahn et al. 2006, Roth et al. 2014). The ice grains can be sampled during spacecraft flybys by impact ionization mass spectrometers, such as the Cosmic Dust Analyzer (CDA; Srama et al. 2004) on board the past Cassini mission, the SUrface Dust Analyzer (SUDA; Kempf et al. 2014) on board the upcoming Europa Clipper mission (Howell & Pappalardo 2020), or the ENceladus Ice Analyzer (ENIA), proposed for future Enceladus missions (Reh et al. 2016).
CDA data collected in the Saturnian System revealed that Enceladus’s ocean is salty (Postberg et al. 2009) and contains a variety of organic material, including complex macromolecules (Postberg et al. 2018) as well as low-mass volatile compounds (Khawaja et al. 2019), some of which could potentially act as amino acid precursors. Our recent detection of phosphates in ice grains emitted by Enceladus (Postberg et al. 2022) further enhances Enceladus’s potential as a habitable environment, possibly able to support microbial life in its subsurface ocean. However, biosignatures have not yet been identified on extraterrestrial ocean worlds.
Impact ionization detectors, such as SUDA or ENIA, are the only instruments capable of determining the compositions of single µm-sized ice grains emitted into plumes. Cassini CDA results showed that refractory organics occur in only a few % of plume ice grains. These are thought to form from an organic film covering the oceanic surface (Postberg et al., 2018).
Cell material, if present, would likely reside in such grains and would only be present in an even smaller number of ice grains, maybe just one in a thousand or less. On Earth, 70% of the planetary surface is covered by a biofilm, the surface microlayer on top of the ocean water (Flemming and Wuertz, 2019), which hosts a distinct microbial community at cell densities 3 – 5 orders of magnitude higher than in the bulk water phase (Franklin et al. 2005). After lifting, organics and cells from this layer can initiate ice crystal formation in clouds (Pratt et al. 2009).
Methods and Results
To simulate such a scenario, where biosignatures are only present in a small fraction of emitted grains, but with a high cell density, we conducted laboratory analogue experiments with Sphingopyxis alaskensis, an ultrasmall bacterium, extracted from various cold marine environments (Ting et al. 2010) and potentially capable of fitting into µm-sized ice grains. We simulated the case of an ice grain of 15µm in diameter - constituting the worst case for Enceladus where ice grains are generally much smaller (1-5 µm in diameter) - formed from a nucleation core of one single bacterial cell.
We used Laser Induced Liquid Beam Ion Desorption (LILBID) – a proven technique to simulate accurately impact ionization mass spectra of ice grains recorded in space (Klenner et al. 2019, 2020, 2020a). Recent LILBID experiments predict that DNA and lipids extracted from bacterial cultures will produce characteristic signals in the mass spectra of ice grains emitted from ocean worlds (Dannenmann et al. 2022, under review). Here we present the next steps – LILBID experiments with otherwise untreated lysed bacterial cells simulating the appearance of these microbial life forms in impact ionization mass spectra.
In both polarity mass spectra, we clearly identify signatures of S. alaskensis. Cation mass spectra exhibit features due to protonated amino acids, either fragments of the bacteria’s proteins or metabolic intermediates. Deprotonated fatty acids, fragments of bacterial lipids, are identifiable in anion mass spectra. Our experiments show that even if less than 0.1% of the cell constituents would form a nucleation core of a 15µm ice grain, the bacterial signature would be apparent in the data. The recorded spectra are part of a comprehensive database containing analogue data for impact ionization mass spectrometers on board spacecraft (Klenner et al. 2022, under review).
Conclusions
Our results show that biosignatures deriving from a single bacterial cell – or small fractions of it - embedded as a nucleation core in an ice grain will be clearly identifiable in impact ionization mass spectra from SUDA-type instruments. This demonstrates the advantage of analyzing individual ice grains in a plume over analyzing the average composition of all plume material encountered during a flyby. A modern impact ionization instrument like SUDA or ENIA would be capable of recording 10,000 – 100,000 ice grain spectra (cations and anions) during a single plume passage, allowing to assess biosignatures that are present in only 1 out of 100,000 grains during a multiple flyby mission. Such low abundances would be out of reach for other analytical methods that measure the integrated - and thus extremely diluted - concentrations of such biosignatures in a plume.
References
Dannenmann, M. et al. (2022) Astrobiology, under review.
Flemming, H.-C. & Wuerz, S. (2019) Nat Rev Microbiol 17, 247–260.
Franklin, M.P. et al. (2005) Environ Microbiol 7, 723–736.
Howell, S.M. & Pappalardo, R.T. (2020) Nat Commun 11, 1311.
Kempf, S. et al. (2014) EPSC 9, EPSC2014–229.
Khawaja, N. et al. (2019) Mon Not R Astron Soc 489, 5231–5243.
Klenner, F. et al. (2019) Rapid Commun Mass Spectrom 33, 1751–1760.
Klenner, F. et al. (2020a) Astrobiology 20, 179–189.
Klenner, F. et al. (2020b) Astrobiology 20, 1168–1184.
Klenner, F. et al. (2022) Earth Space Sci, under review.
Postberg, F. et al. (2009) Nature 459, 1098–1101.
Postberg, F. et al. (2018) Nature 558, 564–568.
Postberg, F. et al. (2022) AbSciCon Abstract, 505-01.
Pratt, K.A. et al. (2009) Nat Geosci 2, 398–401.
Reh, K. et al (2016) IEEE AeroConf Abstract, 1–8.
Roth, L. et al. (2014) Science 343, 171–174.
Spahn, F. et al. (2006) Science 311, 1416–1418.
Srama, R. et al. (2004) Space Sci Rev 114, 465–518.
Ting, L. et al. (2010) Environ Microbiol 12, 2658–267.
How to cite: Klenner, F., Bönigk, J., Napoleoni, M., Dannenmann, M., Pavlista, M., Khawaja, N., Hillier, J., Olsson-Francis, K., and Postberg, F.: Experiments for the Identification of Bacterial Cell Material in Single Ice Grains Emitted by Enceladus and Europa, Europlanet Science Congress 2022, Granada, Spain, 18–23 Sep 2022, EPSC2022-304, https://doi.org/10.5194/epsc2022-304, 2022.
Introduction. The plumes emanating from the south polar region of Saturn’s moon Enceladus were studied by the Cassini mission and have revealed evidence for ongoing hydrothermal activity [1], organic chemistry [2], and redox conditions favorable for microbial metabolism [3] in the ocean below. Salt-rich icy particles encountered by Cassini were interpreted to originate as rapidly frozen droplets of ocean spray [4]. If extant microbial communities exist within Enceladus’s ocean, cells may become incorporated into these particles and ejected into space where they can be sampled by future spacecraft [5]. However, the potential fate of biomass within frozen icy particles is not understood. Here, we used cryogenic imaging alongside sublimation-extraction techniques to study the interaction of microorganisms with precipitated inorganic phases during freezing of simulated Enceladus ocean fluids, at contrasting cooling rates. Our findings reveal how potential microbial biomass may be expressed in the Enceladus plumes, and carry implications for its potential detection using current and future spacecraft sampling strategies
Methods: Cells taken from four phylogenetically and morphologically distinct pure cultures, as well as a mixed community, were suspended in simulated Enceladus ocean fluid [6], and droplets were cooled at two contrasting rates: rapidly quench cooling in liquid nitrogen (101-102 K s-1), and gradual cooling (0.01 K s-1). Partitioning of microorganisms alongside ice and non-ice phases within frozen droplet interiors was imaged at 120 K via cryo-scanning electron microscopy. Specific associations between microorganisms and cryogenic mineral phases were analyzed using cryo-electron microscopy, and the mineralogy of crystalline precipitates was determined via infrared spectroscopy and X-ray diffraction (XRD) following extraction from the ice matrix by sublimation.
Results and discussion: Under both freezing scenarios, ice crystallisation produces an interconnected network of solidified solute-rich brine veins accumulated at ice grain boundaries, within which intact microorganisms can become entombed (Fig. 1). The presence of microbial cells also leads to the formation of small, solitary inclusions of brine fully encased by ice, which are disconnected from the main brine vein network. Microscale crystallization textures, previously identified to be diagnostic of cooling rate [6], are disrupted and modified by the presence of biomass, with distinct differences arising between brine veins and solitary inclusions. XRD analyses of cryogenic salt phases shows that the presence of microbial biomass during freezing also influences bulk mineralogy (Fig. 2). In the absence of biomass, nahcolite (NaHCO3) is kinetically inhibited during flash freezing. However, in the presence of biomass, nahcolite does form during flash freezing, and the resulting mineralogy instead resembles that of gradually cooled control fluids. This indicates that the presence of microorganisms kinetically favors the precipitation of nahcolite. Moreover, this finding provides a route by which the presence of biomass at Enceladus could influence the mineralogy of icy particles in the plumes. Given that mineralogy is also sensitive to cooling rate and fluid pH [6], analyses of mineralogy within plume particles at Enceladus should be prioritized in future observations.
Our results demonstrate how microbial biomass may be preserved within icy particles relevant to the Enceladus plumes, revealing complex, cooling rate-dependent interactions between microbial biomass and rapidly precipitating inorganic phases. The association of microbial cells with specific inorganic phases has implications for interpreting secondary ion fragments in spacecraft impact-ionization mass spectra [7], and in the planning for future plume sampling missions that target in situ analyses, or more ambitiously, cryogenic sample return.
References: [1] Waite, J. H. et al. Science 356, 155–159 (2017). [2] Postberg, F. et al. Nature 558, 564–568 (2018). [3] Ray, C. et al. Icarus 364, 114248 (2021). [4] Postberg et al. Science 459, 1098-1101 (2009). [5] Porco, C.C., et al. Astrobiology, 17, 876-901 (2017). [6] Fox-Powell & Cousins, JGR: Planets 126(1), e2020JE006628 (2021). [7] Klenner et al. Astrobiology 20, 1168-1184 (2020).
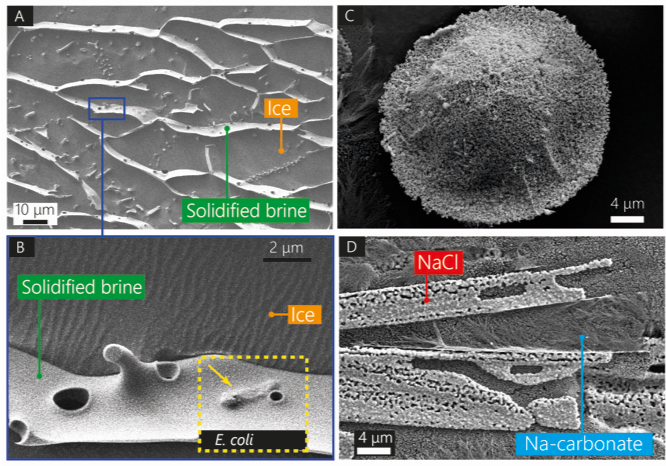
Figure 1. (Cryo) electron micrographs of co-partitioned cryogenic salt phases and microbial biomass. A, B., Cryo-SEM images of brine vein network with preserved E. coli cell. C., Solitary inclusion. D., brine vein crystallisation textures.
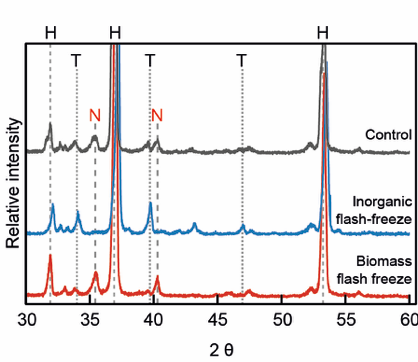
Figure 2. X-ray diffraction patterns from salt mineral assemblages produced by freezing in the presence and absence of microbial cells from community enrichments. ‘Control’ trace represents samples cooled gradually in the absence of biomass. H: halite (NaCl); T: Trona (Na2CO3•NaHCO3•2H2O); N: Nahcolite (NaHCO3).
How to cite: Fox-Powell, M., del Moral, Á., Stephens, B., Dazley, C., Slade, D., Richards, G., Cousins, C., and Olsson-Francis, K.: Entombment of microbial biomass within rapidly frozen fluid droplets relevant to the plumes of Enceladus, Europlanet Science Congress 2022, Granada, Spain, 18–23 Sep 2022, EPSC2022-1230, https://doi.org/10.5194/epsc2022-1230, 2022.
The phenomenal revelation by the Cassini spacecraft of exospheric plumes spewing from the surface of Enceladus into space [1] overturned our common perception that icy moons are geologically inactive and cold planetary bodies in our solar system. Instead, the on-board magnetometer detected a disturbance in Saturn’s magnetosphere due to plumes outgassing, hereby hinting at the existence of a subsurface ocean [2] which motivated closer flybys of the icy moon. The observation of the plumes’ composition further revealed the presence of complex organics [3] and raised the question of their origin. The icy grains in the plumes that exceed the escape velocity travel outward to Saturn’s E-ring from 4 to 8 Saturn radii. A study by Nölle et al. evidenced how during this journey the organic portion within the ice is strongly altered by impinging photons, while the degradation of salt rich particles is dominated by plasma sputtering [4].
Past studies have extensively probed the vacuum-UV (VUV) irradiation of icy grains in the interstellar medium [5,6], whereas little is known about photon irradiation of ices under environmental conditions characteristic for those present on icy moons such as Enceladus. New insights from space-based instruments onboard ESA’s JUICE or NASA’s Europa Clipper spacecraft are expected to arrive at similar ocean-bearing worlds in the 2030s. Therefore, preparatory laboratory studies are essential in order to advance our understanding of surface processes which are relevant for the chemical complexity of icy grains found on icy moon exteriors, plumes and within interplanetary space.
A cryogenic ultra-high vacuum (UHV) setup at Leiden University’s Laboratory for Astrophysics is used to explore the formation of complex organic molecules by energetic processing of Enceladus ice analogues. The latter is realised by using special lamps, a microwave discharge H2-flow lamp to generate VUV light (120-180 nm) and a Xe-arc lamp with an SED peaking approx. at λmax of the Sun. The UHV system can spectroscopically probe thin ices of varying composition and temperatures to constrain physical and chemical processes occurring within the ice. Fourier-transform infrared spectroscopy (FTIR) monitors changes in the solid state by means of vibrational spectroscopy, while a mass spectrometer complementarily confirms the detection of gas-phase species which desorb from the ice during linear warming of the underlying substrate.
Ices observed on Enceladus are mimicked in the laboratory at a temperature of 70 Kelvin and comprise mostly water (H2O) mixed with lesser amounts of carbon dioxide (CO2) and ammonia (NH3) [7]. Experimental irradiation studies of these mixed ices are presented which include, but are not limited to, the formation of complex organic molecules. In addition, UV-photolysis of CO2 rich ice is explored to study its lifetime on the surface of Enceladus, following the discovery of concentrated CO2 patches at the moon’s south pole [8]. These experimental results allow to investigate possible theories for the presence of volatiles on the surface of Enceladus such as plume deposition or gas seeping through fractures in the icy crust [9].
References
[1] Porco, C. C., et al.: Cassini observes the active South Pole of Enceladus, Science, Vol. 311, pp. 1393-1401, 2006.
[2] Dougherty, M., et al.: Identification of a dynamic atmosphere at Enceladus with the Cassini magnetometer, Science, Vol. 311, pp. 1406-1409, 2006.
[3] Postberg, F., et al.: Macromolecular organic compounds from the depths of Enceladus, Nature, Vol. 558, pp. 564-568, 2018.
[4] Nölle, L., et al.: Chemical ‘aging’ of icy dust grains in Saturn’s E-ring, EPSC-DPS Joint Meeting 2019, Vol. 2019, 2019.
[5] Linnartz, H. et al.: Atom addition reactions in interstellar ice analogues, Int. Rev. Phys. Chem., Vol. 34, pp. 205-237, 2015.
[6] Muñoz Caro, G. M., et al.: Amino acids from ultraviolet irradiation of interstellar ice analogues, Nature, Vol. 416, pp. 403-406, 2002.
[7] Brown, R. H., et al.: Composition and physical properties of Enceladus’ surface, Science, Vol. 311, pp.1425-1428, 2006.
[8] Combe, J.-P., et al.: Nature, distribution and origin of CO2 on Enceladus, Icarus, Vol. 317, pp. 491-508, 2019.
[9] Matson, D. L., et al.: Enceladus’ near-surface CO2 gas pockets and surface frost deposits, Icarus, Vol. 302, pp. 18-26, 2018.
How to cite: Bründl, T.-M., Linnartz, H., Cazaux, S., and Chuang, K.-J.: Laboratory studies of irradiated Enceladus ice analogues, Europlanet Science Congress 2022, Granada, Spain, 18–23 Sep 2022, EPSC2022-877, https://doi.org/10.5194/epsc2022-877, 2022.
The ice grains emitted from the south polar region of Enceladus are direct sample of the moon’s subsurface ocean material [1]. A substantial fraction of Enceladus’ plume grains escapes the moon’s gravity and becomes part of Saturn’s E ring [2]. The Cassini’s Cosmic Dust Analyzer (CDA) [3] sampled these ice grains directly from the plume during spacecraft flybys of Enceladus as well as from Saturn’s E ring. The detection of salty grains, nano-silica particles and organic enriched ice grains strongly indicated water-rock interactions and hydrothermal activity at the sea floor [1, 4, 5, 6]. Understanding the composition of the ice grains is key to finding out whether or not signs of life exist in Enceladus ocean.
The CDA mass spectrometer worked on the principle of impact ionization where an ice particle vaporizes and ionizes after hitting on the instrument’s metal target at velocities ≥ 1 km/s and generating Time of Flight (ToF) mass spectrum of the cations. One major type of Enceladean ice grains (i.e. Type 2) detected by the CDA instrument is enriched with organic species [7]. Laser Induced Liquid Beam Ion Desorption (LILBID), a laboratory technique proven to simulate impact ionization mass spectra of the ice grains recorded in space [8], is used to identify the composition of organic species in the ice grains. This led to further classification of CDA Type 2 spectra into: (i) Type 2 HMOC (High Mass Organic Cations), indicating complex, probably refractory and hydrophobic, macromolecular organic compounds with masses > 200 u. The ice grains of this type formed when organic condensation cores are generated by the dispersion of a putative organic layer by bubble bursting on top of Enceladus’ ocean surface [5]; and (ii) Type 2 VOC (Volatile Organic Compounds), indicating volatile low mass N- and O-bearing as well as single ring aromatic (< 100 u) organic compounds that condense onto pre-existing water ice grains in the icy vents of Enceladus [6].
In this work, we analysed CDA Type 2 mass spectral ToF data of freshly ejected plume ice grains during Enceladus flyby E5 in 2008 [9]. The closest approach of the Cassini spacecraft was 21 km from Enceladus surface at a velocity 17 km/s. Following the flight path from north to south, after the closest approach at the fringe of the plume, the spacecraft then passed through the dense plume region directly above the plume source. In the previous compositional analysis of E5 CDA data, Postberg et al. (2011) only assessed whether an ice grain is organic enriched or not without a detailed compositional investigation of organic species. The higher degree of fragmentation of organics inside these ice grains and the resulting spectral appearance (e.g. absence of water clusters and hence no interference with organic signatures) at higher impact speeds (17 km/s) provides a different perspective on the composition of the organics as compared to previous analysis of CDA Type 2 spectra recorded at lower impact speeds before and after the E5 flyby. Here, we relate the composition of these grains with the possible organic species. The analysis of freshly ejected organic enriched ice grains confirms the findings of Khawaja et al (2019) and Postberg et al. (2018), where most of the organic enriched ice grains were collected in the E ring. In addition, spectra of these freshly ejected organic-bearing grains also exhibit certain spectral features, which were not observed in E ring ice grains spectra.
References
[1] Postberg, F. et al. (2009) Nature 459, 1098-1101.
[2] Kempf, S. et al. (2010) Icarus 206, 446-457.
[3] Srama, R. et al. (2004) Adv. Space Res. 33, 1289-1293.
[4] Hsu, H. W. et al. (2015) Nature 519, 207-210.
[5] Postberg, F. et al. (2018) 558, 564-568.
[6] Khawaja, N. et al. (2019) Mon. Not. Astron. Soc 489, 5231-5243.
[7] Postberg, F. et al. (2008) Icarus 193, 438-454.
[8] Klenner, F. et al. (2019) Rapid Commun. Mass Spectrom. 33, 1751-1760.
[9] Postberg, F. et al. (2011) Nature 474, 620-622.
How to cite: Khawaja, N., Hillier, J., Nölle, L., Klenner, F., Napoleoni, M., and Postberg, F.: On the Composition of Organic-bearing Plume Ice Grains Detected during Cassini’s E5 Enceladus Flyby, Europlanet Science Congress 2022, Granada, Spain, 18–23 Sep 2022, EPSC2022-909, https://doi.org/10.5194/epsc2022-909, 2022.
The Cassini mission revolutionized our vision on the habitability of our solar system. While the icy moons orbiting Jupiter and Saturn were supposed to be cold and inert objects well outside the habitable zone (where water can be found liquid), Cassini showed that Saturn's moon Enceladus is very active, with a warm interior heated by tidal forces (Choblet et al. 2017), allowing the presence of an ocean under a km-thick icy crust (Thomas et al. 2016). This ocean escapes through geysers (plumes) from the icy surface. Plumes' material reaches escape velocity and goes into orbit around Saturn, forming the E ring. One characteristic of the plumes is their very large velocities, reaching 700-900 m/s (Yeoh et al. 2016), highlighting that plumes are due to (an adiabatic) expansion of the gas through a nozzle like crevasse. Cassini performed many fly-bys through the plumes, measuring their composition and characteristics and showed that the ocean under the icy crust is salty, fed by ongoing hydrothermal activity (Postberg et al. 2009, 2011, Hsu et al. 2015 and Waite et al. 2017) and contains COMs, i.e. complex organic molecules (Postberg et al. 2018a). Plumes are mainly composed of water vapour and 10% of icy grains by mass (Kempf et al. 2018). These icy grains are formed due to nucleation of water.
We have developed a fluid dynamics model based on Schmidt et al. (2008), to describe the plumes characteristics along icy crevasses that could exist on Enceladus. This model accounts for particle production generated from homogeneous nucleation, particle growth, wall accretion and sublimation and the viscous interaction with the walls. The wall interactions, reservoir conditions and the geometry of the channel are studied to reproduce some characteristics of the plumes observed by Cassini. Icy crevasses’ geometry will evolve with time due sublimation of ices from the walls or accretion onto the walls. The evolution of the geometry of the crevasses and the effect on the plumes’ characteristics has been determined with our model. In parallel, we developed an experimental setup to study the effect of the nozzle geometries on the plumes characteristics and to verify experimentally that under the icy moon’s conditions (pressure, temperature) a plume reaches hypersonic/supersonic velocities.
Bibliography:
[1] Choblet et al. 2017, Nat Astron 1, 841847
[2] Thomas, P. et al 2016 Icarus 264, 37
[3] S.K. Yeoh et al. 2016, Icarus 281, 357
[4] Postberg, F. et al. 2009 Nature 459, 1098
[5] Postberg, F. et al. 2011, Nature 474, 620
[6] Hsu et al. 2015 Nature 519 , 7542
[7] Waite et al. 2017 Science. 2017
[8] Postberg, F. et al. 2018a, Nature 558, 564
[9] Kempf et al. 2018, Enceladus and the icy moons of Saturn
[10] Schmidt et al. 2008, Nature 451, 685
How to cite: Cazaux, S., Schrijer, F., Bründl, T. M., Verhoeff, T., and Baeta Campos da Rocha Fontes, T.: Simulating Enceladus’ plumes, Europlanet Science Congress 2022, Granada, Spain, 18–23 Sep 2022, EPSC2022-686, https://doi.org/10.5194/epsc2022-686, 2022.
Introduction: Enceladus’s subsurface global ocean (Thomas et al. 2016) can be probed by sampling the gaseous and icy material the moon expels into its cryovolcanic plume and - even further out - into Saturn’s E ring (Postberg et al. 2009, 2011, Hsu et al. 2015, Waite et al. 2017). The observed high heat fluxes (Spencer et al. 2006) caused by tidal heating (Choblet et al. 2017), together with rich and complex organic chemistry (Postberg et al. 2018a, Khawaja et al. 2019) mean the moon appears to be one of the prime candidate locations for the emergence of extraterrestrial life in our solar system. Among the critical elements C, H, N, O, P and S that are considered to be essential for life, all except phosphorous have either been identified (Waite et al. 2017, Postberg et al. 2018a, Khawaja et al. 2019.) or - in the case of sulfur - tentatively detected (Postberg et al. 2018b), in emissions from Enceladus by Cassini instruments. Recent geochemical modelling claims that P will be severely depleted in ocean worlds and thus P could be a bottle neck for the emergence of life in subsurface oceans (Lingam & Loeb, 2018.).
Here we present results from a major re-analysis of mass spectrometric data from Cassini’s Cosmic Dust Analyzer (CDA), that shows proof of sodium-phosphate salts in E ring ice grains originating from Enceladus’s subsurface ocean.
Results: Most of the mass spectra of ice grains emitted by Enceladus that CDA recorded over the course of Cassini’s 13-year mission at Saturn, were detected in Saturn’s E ring. The spectra have been classified into a small number of compositional archetypes (Postberg et al. 2018b), of which the so-called Type 3 is defined by its high concentration of sodium and potassium salts (chlorides and carbonates). Type 3 ice grains probably originate from frozen aerosolized droplets of Enceladus’s salty subsurface ocean and are therefore believed to reflect the ocean’s composition close to its surface (Postberg et al. 2009, 2011).
We analyzed approximately 1000 mass spectra of individual Type 3 grains. Within this dataset we found a small number of ice grains whose spectra clearly indicate the presence of at least two sodium orthophosphates, at levels well above CDA’s detection limit: Na3PO4 and Na2HPO4. These CDA spectra have been subsequently reproduced in the laboratory using the proven method of Laser Induced Liquid Beam Ion Desorption (LILBID), which enables the quantitative evaluation of CDA spectra (Wiederschein et al. 2015, Klenner et al. 2019). The inferred salt concentrations in each of the small number of ice grains with detectable amounts of phosphates range from 0.1 M – 0.5 M. However, due to the small fraction of P-rich grains the P-concentration averaged over the entire dataset of salt rich grains, thought to reflect the near-surface ocean composition n, is of the order of a mM.
Discussion
The finding of phosphate-rich ice grains that originating from Enceladus’s subsurface ocean further increases the astrobiological potential of the moon. In addition to water, heat, and a complex organic chemistry, the presence of phosphates means that Enceladus’s subsurface waters now seem to provide all conditions considered astrobiologically essential. If our preliminary results indicating an phosphate concentration of the order of 1 mM are confirmed by ongoing analysis, P in fact seems to be a very abundant element in Enceladus’s ocean.
References:
Thomas et al. 2016, Icarus 264: 37-47
Postberg et al. 2009, Nature 474: 620-622.
Postberg et al. 2011, Nature 459: 1098-1101.
Hsu et al. 2015, Nature, 519: 207-210.
Waite et al. 2017, Science 356: 155-159.
Postberg et al. 2018a, Nature 558: 564 -568.
Khawaja et al. 2019, MNRAS 489: 5231-5243.
Spencer et al. 2006, Science 311: 1401 – 1405.
Choblet et al. 2017, Nat. Astron. 1: 841-847.
Postberg et al., 2018b, in Enceladus and the Icy Moons of Saturn (P.M. Schenk et al., eds.), 129 - 162.
Lingam & Loeb, 2018, Astron. J. 156: 151.
Wiederschein et al. 2015, Phys. Chem. Chem. Phys. 17, 6858 – 6864.
Klenner et al. 2019, Rapid Commun. Mass Spectrom. 33, 1751-1760.
How to cite: Postberg, F., Klenner, F., Zou, Z., Hillier, J. K., Khawaja, N., Nölle, L., and Schmidt, J.: Detection of Phosphates Originating from Enceladus’ Ocean by Cassini’s Cosmic Dust Analyzer, Europlanet Science Congress 2022, Granada, Spain, 18–23 Sep 2022, EPSC2022-639, https://doi.org/10.5194/epsc2022-639, 2022.
Enceladus, an icy moon of Saturn, is a potentially habitable environment. Its South Polar Region hosts active plumes that eject material from the subsurface into space. Plume material was analysed by the Cassini spacecraft, which confirmed the presence of a global subsurface ocean, active hydrothermal activity, and the presence of bio-essential elements (carbon, nitrogen, and hydrogen) [1-4]. Data from the plumes provided a snapshot of the subsurface chemical environment, however, it could not fully constrain the composition of the silicate interior or specific ocean chemistry. We present work constraining a modern-day Enceladus ocean composition utilising theoretical compositions for the icy exterior (and subsurface ocean) and silicate interior of an early Enceladus and studying the evolution of the ocean chemistry over time.
The modern-day ocean composition was determined by thermochemical modelling using CHIM-XPT [5], where hypothetical starting compositions for the ocean interact with the silicate interior. A CI carbonaceous chondrite was used as an analogue to represent the silicate interior of Enceladus [6] and a fluid of cometary ice composition was used as an analogue for the moon’s early ocean [7]. The water-rock interactions of these two analogues were modelled and used to investigate the evolution of the ocean chemistry of Enceladus over time. The models were run over a range of temperature and pressure conditions representative of the ocean floor conditions of Enceladus. For example, it has been determined [2] that a minimum temperature of 90 ℃ is required to form the SiO2 particles that have been measured in the stream believed to originate from Enceladus and the pressure hypothesized for the water-rock interface is 80 bar, based upon the combined depth of the subsurface ocean and ice crust, along with gravitational data measurements [2], so these conditions were modelled. Further modelling was carried out at higher temperatures (up to 250 ℃) and higher pressures (up to 150 bar), to explore reactions that may occur deeper within the porous silicate interior. The resultant modern-day ocean fluid was then both cooled and depressurized (using CHIM-XPT) to study changes in the chemical composition as water ascends from the water-rock interface to the ice-water interface on Enceladus.
Finally, the ocean composition at the ice-ocean interface was frozen using FREZCHEM to replicate the freezing process in the plumes of Enceladus. The ice grain composition generated through thermochemical modelling was then critically compared to Cassini’s plume data. The ice grains generated through this study were dominated by water ice, with NaCl, NaHCO3, Na2CO3, KCl and a low concentration of Na2SO4, all of which have been detected in the plumes or E-ring, with the exception of Na2SO4, where the concentration may have been below the limit of detection of the instruments onboard Cassini [3].
These results suggests that a CI chondrite and a cometary ice composition may be suitable analogues for the silicate interior and the icy exterior of a proto-Enceladus. A complex modern-day ocean composition has been generated that is more complex that has been indicated by analysed ice grains. Additionally, this work may be able to constrain potential concentrations of aqueous species that have not been observed by Cassini, in particular trace species such as sulfates, transition metals and phosphates, that could be used to define the detection limits required to identify target chemical species on instruments onboard future missions. We will present the outcomes from this modelling, which includes a modern-day ocean composition and our findings from modelling of the cooling and freezing of ocean fluids as they are transported from the ocean floor to outer space.
[1] Thomas P. C. et al., (2016), Icarus, 264, 37-47
[2] Hsu H. W. et al., (2015), Nature, 519, 207-210
[3] Waite, J. H., et al., Nature, 460, 487-490, 2009
[4] Postberg F. et al., (2018) Nature, 558, 564-568
[5] Reed, M. H., Spycher, N. F., Palandri, J., (2010) User guide for CHIM-XPT, University of Oregon, Oregon
[6] Hamp R. E. et al., (2019), 50th LPSC 2019, Abstract 1091
[7] Hamp R.E et al., (2021), 52nd LPSC 2021, Abstract 2548
How to cite: Hamp, R. E., Olson Francis, K., Pearson, V. K., and Schwenzer, S. P.: Thermochemical modelling of the ocean composition of Enceladus from ocean floor to outer space, Europlanet Science Congress 2022, Granada, Spain, 18–23 Sep 2022, EPSC2022-1235, https://doi.org/10.5194/epsc2022-1235, 2022.
In 2005 data returned by the Cassini spacecraft showed that Enceladus’ southern polar region is highly active. The activity is concentrated along four fractures located close to Enceladus’ south pole commonly known as tiger stripes, which are also the source of Enceladus’ plumes. Accurately constraining the endogenic heat flow from this active region (often call South Polar Terrain, SPT) has proved challenging, and estimates of the SPT total heat flow vary from 5.8 ± 1.9 GW to 15.8 ± 3.1 GW (Spencer et al., 2006; Howett et al., 2011). One reason for these discrepancies is likely that the SPT has been in sunlight, and thus its emission is a combination of passive (reradiated sunlight) and endogenic components. Isolating the endogenic component is non-trivial and relies on either modeling (and removing) the passive component (as per the 15.8 GW estimate), or only counting as endogenic any emission at temperatures greater than likely maximum passive emission temperatures (as per the 5.8 GW, so this doesn’t include any low temperature, <80 K, endogenic emission).
Intriguingly another estimate of the heat flow from (only) Enceladus’ tiger stripes estimate their heat flow to be 4.2 GW (Spencer et al., 2018). This means that if the total heat flow is close to 15.8 GW (Howett et al., 2011) then a lot of the heat flow must be coming from somewhere else. The most logical place for this extra emission is the region between the stripes, called interstitial (or funiscular) terrain. Models of how this region formed require high heat flows: 200 and 500 mW m-2 (e.g. Barr and Preuss, 2008; Bland et al., 2015; Le Gall et al., 2017). To translate these heat flows to total power we assume the emission is uniform across the entire interstitial region, and the interstitial region is the area between Damascus and Alexandria but excludes the sulci themselves (which are assumed by 590 km long and 2 km wide) to total 16,067 km2. With these assumptions the predicted heat flows are equivalent to 3.2 and 8.0 GW of emission. This is an enormous amount of heat, which has never been quantified, and has huge implications for Enceladus’ total heat emission rate, and hence long-term thermal and orbital evolution. Quantifying this heat flow is the goal of our work.
Since 2009 Enceladus’ SPT has been in winter, which is important in this study for two reasons: 1) it reduces the magnitude of the passive emission and 2) it reduces the difference in passive emission predicted by thermophysical models using a variety of feasible surface parameters. This results in the uncertainty of the passive emission prediction dramatically reducing, from in winter (2015) assuming albedos between 0.70 and 0.80, and thermal inertias between 1 and 100 J m−2 K−1 s−1/2 (MKS). During winter and late-fall Cassini’s Composite Infrared Spectrometer (CIRS) took 5 observations of the SPT at a spatial resolution high-enough (<40 km) to put its fields of view between the stripes. These data, we propose to analyze, provide a “game-changing” opportunity to measure Enceladus’ heat flow, as the passive emission in them is minimized.
We present the results of our preliminary study to compare the surface temperatures derived from one swath from one of these CIRS observations (taken in 2015, chosen because it covered all four tiger stripes) to that predicted by a small number of passive models. The results, given in Figure 1, show the observed temperatures are much greater than ones the models predict. Depending on the model, interstitial heat flows between 279±48 to 380±36 mW m-2 are required to explain the difference (4.5±0.7 to 6.1±0.6 GW, assuming the same interstitial area described above). While these are high heat flows they are well within those predicted by terrain formation models, but cannot fully explain the discrepancy between the different endogenic emissions determined. These results clearly show Enceladus’ interstitial region have endogenic emission, and require more detailed future analysis.
References
Barr, A.C. and L.J. Preuss, On the origin of south polar folds on Enceladus. Icarus 208, 499–503, 2010.
Bland, M.T. et al., Constraining the heat flux between Enceladus’ tiger stripes: Numerical modeling of funiscular plains formation, Icarus 260, 232-245, 2015.
Howett, C.J.A. et al. High heat flow from Enceladus’ south polar region measured using 10–600 cm−1 Cassini/CIRS data, Journal of Geophysical Research 116, E03003, 2011a.
Le Gall, A. et al. Thermally anomalous features in the subsurface of Enceladus’s south polar terrain, Nature Astronomy 1, 0063, 2017.
Spencer, J.R. et al. Cassini Encounters Enceladus: Background and the Discovery of a South Polar Hot Spot, Science 311, 1401-1405, 2006.
Spencer, J.R. et al. Plume Origins and Plumbing (Ocean to Surface), in Enceladus and the Icy Moons of Saturn, Editors Schenk, Clark, Howett, Verbiscer and Waite, University of Arizona Press, 2018,
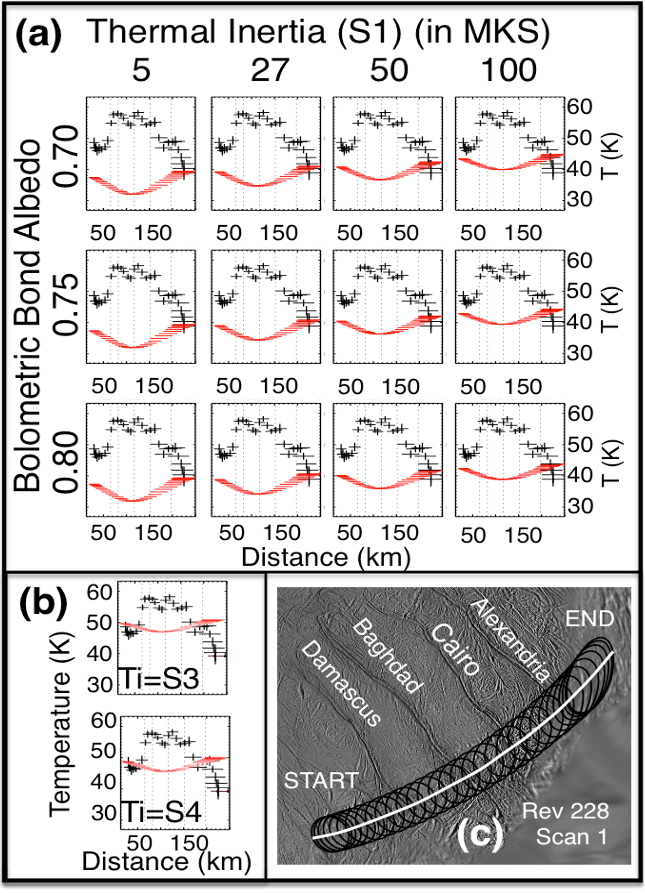
Figure 1: A comparison of passive modeled and CIRS derived surface temperatures, showing none of the models fit the interstitial temperatures. (a) Temperature derived from Rev 228 (Dec 2015) CIRS data (black) and those predicted by passive thermal models (red) for a range of albedo (rows) and thermal inertia (columns). In all models the thermal inertia is constant with depth (S1). “Distance” is calculated as the distance from the start of the white line in (c) to where the line intersects the nearest and furthest points of the field of view. Dotted lines indicate where the line crosses the tiger stripes, from left to right: Damascus (both branches), Baghdad, Cairo and Alexandria. (b) Same as the top plot, but for seasonal models with an albedo 0.80 and a thermal inertia profile that changes with depth (see Fig. 8 for details of S3 and S4). (c) Footprints of the CIRS FP1 field of view (black). Tiger stripe names are indicated.
How to cite: Howett, C., Nimmo, F., and Spencer, J.: Constraining Enceladus' heat flow between its tiger stripes, Europlanet Science Congress 2022, Granada, Spain, 18–23 Sep 2022, EPSC2022-219, https://doi.org/10.5194/epsc2022-219, 2022.
Observations from the Cassini spacecraft imply the presence of a global salty ocean underneath Enceladus’ ice shell, with ongoing hydrothermal activity at its seafloor. Previous numerical simulations showed that convection in Enceladus’ unconsolidated core generates enough dissipation to sustain the ocean and produces a strongly heterogeneous heat flow pattern at the seafloor that looks promising for explaining the surface ice topography. Yet, how the ocean in-between connects the deeper core to the surface ice shell is unknown. The dynamics of the ocean is thus the missing piece of the Enceladus puzzle towards a fully self-consistent model of the heat transfer in this moon. We fill this gap by performing 3D numerical simulations of the buried ocean of Enceladus. We show that, for the strongly heterogeneous heat flow pattern expected at the seafloor from the unconsolidated core model, azimuthal deflection of strongly localised plumes by the Coriolis force inhibits the heat transfer at low latitudes. The resulting heat flow pattern at the ocean/ice interface is qualitatively consistent with the surface ice topography and in decent quantitative agreement with an ice shell model derived from observations. Using passively advected tracers particles, we predict rising times for hydrothermal products of the order of 1-2 months, in line with previous observations-based predictions. We are thus now able to draw a complete self-consistent model of the heat transfer in Enceladus, explaining the global characteristics of this moon: global ocean, strong dissipation, reduced ice-shell thickness at the south pole and seafloor activity.
How to cite: Bouffard, M., Choblet, G., Tobie, G., Amit, H., Čadek, O., and Terra-Nova, F.: Heat transfer in the ocean of Enceladus: connecting unconsolidated core and surface ice shell, Europlanet Science Congress 2022, Granada, Spain, 18–23 Sep 2022, EPSC2022-1067, https://doi.org/10.5194/epsc2022-1067, 2022.
We revisit the 12 years of Cassini Composite InfraRed Spectrometer (CIRS) observations of Enceladus. Spectra from the CIRS FP1 and FP3 detectors (spanning 10 - 600 cm-1 and 600– 1100 cm-1) are used to evaluate whether endogenic “hot spots” might exist outside of Enceladus’ South Polar Terrain (SPT). These detectors afford contrasting spatial resolution and temperature sensitivity for detecting the temperature of very cold scenes. Significant endogenic heat is observed in the SPT principally from to the four long fissures or ‘sulci’, from which extensive cryovolcanic plumes of water vapour, volatiles, solid ice and organic species emanate (e.g. Porco et al. 2006; Spencer et al. 2006). This is considered to be the primary mechanism by which Enceladus dissipates energy from tidal heating (Spencer et al., 2018), with possible further conductive heat loss through the ice shell.
The evolution of Enceladus, particularly as it relates to the tidal heating and how long a global ocean might be sustained, depends on a fine balance of heating and dissipation processes.
We have conducted an extensive survey of the CIRS Enceladus observations from which we derive surface temperature and compared the observed results to a passive thermal model used to derive expected passive emission temperatures. We have improved the estimate of temperature uncertainty associated with the CIRS observations for the coldest scenes by extensive statistical modelling. For FP1, which is sensitive to colder temperatures than FP3, we find that temperature errors for the coldest scenes with higher signal to noise ratio (25 - 40 K) are still well characterised and appropriate for the expected sensitivity of the detector. Minimum bounds of temperature uncertainty are more challenging to establish below 30 K but upper error limits are considered robustly quantified. For FP3, temperature errors are well characterized down to 75 K, below which co-addition of spectra should be considered for confidence in temperature and error evaluation.
We attempt to quantify thermal model error by using perturbations that represent the uncertainty in thermal inertia and albedo, which themselves were derived from CIRS observations. This model uncertainty has multivariate dependencies that impact insolation, including local time, time of year, latitude and the occurrence of eclipses. Even with well quantified model and observation uncertainty, the unambiguous identification of anomalous CIRS observations is still challenged by the spatial paucity and limited temporal sampling. The results of this study and implications will be discussed.
CIRS observations have shown that some of the coldest scenes in the Solar System exist on the icy moons of Saturn. As such, it is possible – in the case of Enceladus – to use these observations to infer constraints on posited conductive heat flow through Enceladus’ icy shell. Several Saturn moon evolution models that allow for a variable Q factor as Saturn evolves predict conductive heat loss of 25-40 GW for Enceladus (Hemmingway and Mittal 2019, Lainey et al., 2012, 2017, Fuller et al., 2016, Nimmo et al., 2018), but potentially much more. The coldest CIRS temperatures of circa 30 K are found in the north polar region, where the ice shell is relatively thin. This indicates that conductive heat loss is unlikely to be more than 25 GW. This does not discount the possibility of highly spatially varying conductive heat flow, or temporal variation on timescales beyond Cassini’s observations. As such future observations (particularly of the north polar region) would be welcomed.
References
Fuller, J., Luan, J., Quataert, E., 2016. Resonance locking as the source of rapid tidal migration in the Jupiter and Saturn moon systems. Mon. Not. R. Astron. Soc. 458, 3867–3879. http://arxiv.org/abs/1601.05804 https://doi.org/10.1093/mnras/ stw609 arXiv:1601.05804.
Hemmingway, D.J. and T. Mittal, Enceladus's ice shell structure as a window on internal heat production Icarus, 332, 2019, https://doi.org/10.1016/j.icarus.2019.03.011
Lainey, V., Karatekin, Ö., Desmars, J., Charnoz, S., Arlot, J.-E., Emelyanov, N., Le Poncin-
Lafitte, C., Mathis, S., Remus, F., Tobie, G., Zahn, J.-P., 2012. Strong tidal dissipation in Saturn and constraints on Enceladus' thermal state from astrometry. Astrophys. J. https://doi.org/10.1088/0004-637X/752/1/14. http://stacks.iop.org/0004-637X/ 752/i=1/a=14?key=crossref.d68a903d62213eb4f281cc2f4669349f.
Lainey, V., Jacobson, R.A., Tajeddine, R., Cooper, N.J., Murray, C., Robert, V., Tobie, G., Guillot, T., Mathis, S., Remus, F., Desmars, J., Arlot, J.-E., De Cuyper, J.-P., Dehant, V., Pascu, D., Thuillot, W., Poncin-Lafitte, C.L., Zahn, J.-P., 2017. New constraints on Saturn's interior from Cassini astrometric data. Icarus 281, 286–296. http:// linkinghub.elsevier.com/retrieve/pii/S0019103516304183 https://doi.org/10. 1016/j.icarus.2016.07.014.
Nimmo, F., Barr, A. C., Běhounková, M., & Mckinnon, W. B. (2018). The thermal and orbital evolution of Enceladus: observational constraints and models. In P. M. Schenk, R. N. Clark, C. J. A. Howett, & A. J. Verbiscer (Eds.), Enceladus and the Icy Moons of Saturn (pp. 79–94). Tucson, Arizona: University of Arizona Press. https://websites. pmc.ucsc.edu/ fnimmo/website/Enceladus_in_press.pdf
Porco, C.C., Helfenstein, P., Thomas, P.C., Ingersoll, A.P., Wisdom, J., West, R., Neukum, G., Denk, T., Wagner, R., Roatsch, T. and Kieffer, S., 2006. Cassini observes the active south pole of Enceladus. science.
Spencer, J.R., Pearl, J.C., Segura, M., Flasar, F.M., Mamoutkine, A., Romani, P., Buratti, B.J., Hendrix, A.R., Spilker, L.J. and Lopes, R.M.C., 2006. Cassini encounters Enceladus: Background and the discovery of a south polar hot spot. science
How to cite: Miles, G., Howett, C., and Spencer, J.: Constraining Enceladus’ energy emission outside the South Polar Terrain, Europlanet Science Congress 2022, Granada, Spain, 18–23 Sep 2022, EPSC2022-1190, https://doi.org/10.5194/epsc2022-1190, 2022.
Enceladus has been recently identified as the second-highest priority target of Flagship-class missions in the coming decade [1], marking a culmination of growing scientific interest in the small yet geologically active icy moon. While Enceladus is now widely believed to contain a global subsurface ocean beneath its icy exterior, the relative radii and compositions of its ice shell, ocean, and rocky core are still uncertain. Varied methodologies have previously been used to construct models of interior structure, and suggest a total 50-70km of H2O, and 200-180km of rock. Ongoing debates discuss the depth of the ice/water transition and the extent of a potential porous or unconsolidated core; both these parameters have important implications for thermal energy budgets, ocean composition, and the search for extraterrestrial life.
A seismological mission to Enceladus would gather data to interpret interior structure and interface depths; the proposed Orbilander mission features a seismometer in its landed payload [2]. Seismology on Enceladus benefits from reliable anticipated seismic sources at its south pole, with extensive faulting in the Tiger Stripe Fractures (TSFs) which could be reactivated by tidal forcing [3], and venting of the subsurface ocean into space as plume activity through these fractures [4]. We simulate the seismic response of three proposed interior structures and assess our ability to distinguish between these using a single landed seismometer.

Figure 1: Representation of the three models selected for this study and the thicknesses of each layer presented therein.
Three structural models were selected from existing literature for interrogation, as displayed in Figure 1 [5,6,7]. Some simplifications are made for initial seismic modelling: holding seismic velocity constant in each layer; assuming lateral heterogeneity for one-dimensional computation; and discounting attenuation using fully elastic modelling. We locate the seismic source at the south pole to reflect likely seismic activity at the TSFs.
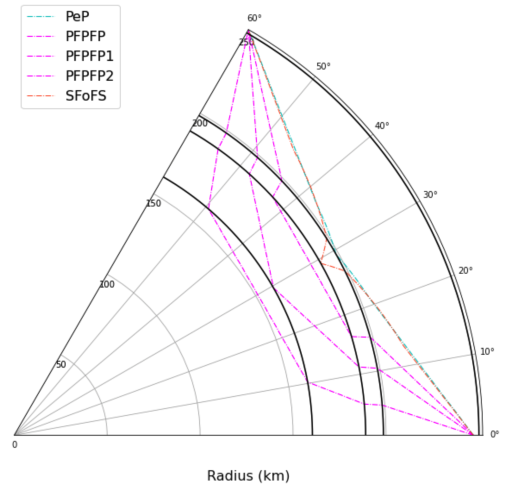
Figure 2: Phase naming in icy ocean worlds as set out by Stähler et al. (2018) [8]. Lowercase 'e' and 'o' denote reflections from the base of the ice and ocean, respectively. P waves travelling through the ocean are labelled as 'F', and through any depth of the rocky core as 'P' to distinguish from a metallic core composition.
Initial ray theoretical travel time predictions are conducted using the TauP Toolkit [9] in order to identify key phases to focus on in later modelling stages, and results are displayed in Figures 3 and 4. Transmitted phases in the ice shell are shown to terminate at shorter distances in a thinner shell, while ice shell thickness strongly affects the delay time between direct phases and those reflected once from the ice/ocean boundary. Meanwhile, the existence of a porous upper core layer, under the current assumed sharp transition to the consolidated central core, produces core multipathing, while the thickness of this layer controls the separation in distance and time between core-underside reflected phases.
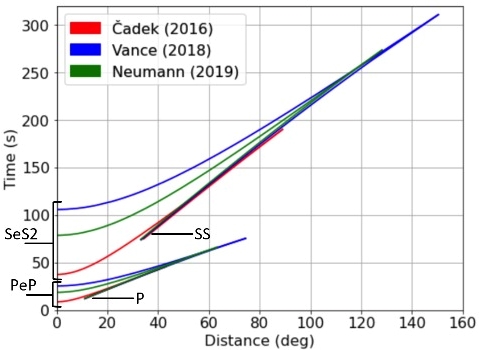
Figure 3: Ray theoretical ice shell phases.
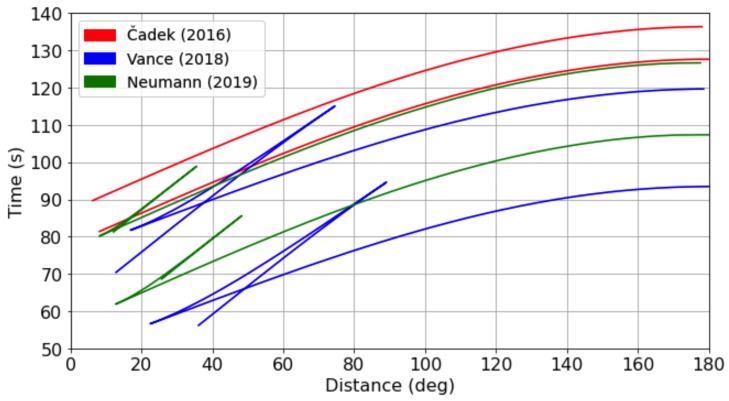
Full wavefield simulations were also carried out using the axisymmetric spectral element modelling tool AxiSEM [10]. This allowed for incorporation of source amplitudes and attenuation into the model. We used a dominant frequency of 2Hz and a source magnitude of Mw ~2.6 as suggested by Earth analogue studies and estimated tidal energy budgets [3,11]. We clearly observe arrivals sampling the ice shell such as S, SS, and SFoFS, and at large distances core-transmitted phases such as PFPFP can be observed before the higher-amplitude ice shell phases arrive. The location of a landed seismometer will affect which phases can be recorded; the value of detecting core phases, for which the seismometer must be far from the source, must be weighed against other mission priorities such as sufficient plume fallout rates.
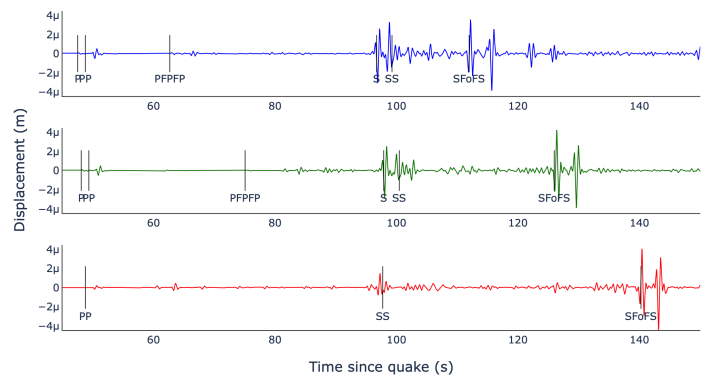
Figure 5: Three traces at 45 degrees from source, filtered to remove the dominant surface wave signal.
We further adapt the above models to account for attenuation of seismic energy in the ice shell and rocky core. Firstly, we consider temperature-dependent attenuation in ice Ih, as characterised mathematically in previous studies [12] and compared with measurements of quality factor in terrestrial glaciers, where temperatures can approach those found at Enceladus' south pole [13]. Attenuation quality factors calculated for Enceladus’ ice shell reach minima of around 100, occurring at the base of the ice shell, which is sufficiently high that ice shell asymmetry is likely to constitute greater uncertainty. Additionally, we calculate attenuation in the upper portion of the rocky core based on a maximum predicted porosity of 30% [14]. The introduction of attenuation to the models primarily serves to decrease the amplitudes of phases arriving at short times and distances from the source, particularly in models with thinner ice shells, where higher-temperature and therefore more attenuative ice is closer to the surface; core phases appear to be largely unaffected.
References:
[1] NASEM (2022) Origins, Worlds, Life: A Decadal Strategy for Planetary Science and Astrobiology 2023-2032. [2] MacKenzie, S. M. et al. (2021) Planet Sci. J. 2(2), 77. [3] Olsen, K. G. et al. (2021) JGR: Planets 126, e2021JE006862. [4] Spencer, J. R. et al. (2018) Enceladus and the Icy Moons of Saturn, 163-174. [5] Čadek, O. et al. (2016) Geophys. Res. Lett. 43, 5653-5660. [6] Vance, S. D. et al. (2018) JGR: Planets 123, 180-205. [7] Neumann, W. and Kruse, A. (2019) ApJ 882, 47. [8] Stähler, S. C. et al. (2018) JGR: Planets 123, 206-232. [9] Crotwell, H. P., Owens, T. J., and Ritsema, J. (1999) SRL 70, 154-160. [10] Nissen-Meyer, T. et al. (2014) Solid Earth 5, 425-445. [11] Hurford, T. A. et al. (2020) Icarus 338, 113466. [12] Cammarano, F. et al. (2006) JGR 111, E12009. [13] Peters, L. E. et al. (2012) JGR 117, F02008. [14] Roberts, J. H. (2015) Icarus 258, 54-66.
How to cite: Dapré, K. and Irving, J. C. E.: Preparing for Enceladus: What can seismology reveal?, Europlanet Science Congress 2022, Granada, Spain, 18–23 Sep 2022, EPSC2022-1072, https://doi.org/10.5194/epsc2022-1072, 2022.
Orals: Wed, 21 Sep, 15:30–18:30 | Room Andalucia 2
Icy bodies are the most numerous and diverse bodies in the Solar System, but only a few have been visited yet by space probes. Some of these icy bodies, mostly giant planet satellites like Callisto, are called ocean worlds as they likely host most of the liquid water of our Solar System within sub-glacial oceans [Sotin & Tobie 2004]. The presence of liquid water under the icy crusts of these bodies raises questions relative to exobiology. In the coming years and decades, these ocean worlds will be the focus of major planetary science missions, firstly with JUICE (ESA, launch scheduled in April 2023) and Europa Clipper (NASA, launch scheduled in October 2024) which will be targeting the Galilean moons, then with still conceptual missions as we speak such as (i) Uranus Orbiter and Probe and (ii) Enceladus Orbilander. Despite not being the prime target of any of these missions, Callisto will be investigated by JUICE and Europa Clipper through multiple flybys.
One way to get information about Callisto’s sub-glacial ocean is to look at the moon’s surface, which may highlight markers of past or current activity and could lift the veil on its chemical composition. Spectroscopy is a powerful technique for such study, especially in the near-infrared domain where spectral signatures of H2O-ices, silicates, salts are detectable. Consequently, in preparation for future infrared spectroscopic data, and specifically those of the infrared imaging spectrometer MAJIS of the JUICE mission, a ground-based campaign was led with an instrument sharing some similar and also complementary characteristics: SINFONI (SINgle Faint Object Near-infrared Investigation), which was mounted on the UT4 of the VLT at ESO. Here we present the results derived from the analysis and the modeling of four full-disk observations acquired with this instrument.
SINFONI combines an integral field spectrometer operating with different gratings with an adaptive optics module [Eisenhauer et al. 2003]. Our four observations were performed using the H+K grating, ranging from 1.46 µm to 2.41 µm, with a spectral resolution R = 1.500, but each spectrum acquired was automatically resampled in order to get a spectral sampling of 5 x 10⁻⁴ µm. The campaign took place from January 2015 from March 2016, and the observations were acquired near the opposition to optimize the angular resolution with Callisto’s angular diameter close to 1.5 arcsec. As SINFONI’s field of view is 0.8 x 0.8 arcsec2 divided into 64 x 64 pixels, one observation actually corresponds to a mosaic of ten overlapping acquisitions, as described in a paper about Ganymede using the exact same technique [Ligier et al. 2019]. All in all, after removing the high solar incident angle pixels we could not recover after applying photometric corrections (basically all pixels above latitude 60°, north and south), our dataset covers approximately 70% of Callisto’s entire surface with a spectral and spatial sampling (~40 km/pix) which allow to detect and map the spectral absorptions that may exist in this wavelength range of the Callisto’s spectrum. Spatial resolution is in par with that of the partial Callisto mosaic from the NIMS imaging spectrometer of the NASA Galileo probe.
The first results obtained concerns the physical properties of the moon’s surface directly derived from the reduction process and the photometric corrections; one obtains satisfactory results using the qualitative photometric model of Oren-Nayar, which is a generalization of the Lambertian model with the surface roughness (σ) as only additional parameter [Oren & Nayar 1994]. In the case of our study, the best results were obtained with ranging between 17° and 19° whatever the observation. These values are much lower than the values in the 30° – 45° range provided by previous studies [Buratti 1991, Domingue & Verbiscer 1997], however these values were obtained through the modeling of the solar phase curve via the Hapke model [Hapke 1984, Hapke 1986] using a combination of telescopic observations and Voyager data; the major differences between the approaches make the respective results hard to compare (our data are < 10° emergence angle).
Our second result concerns the global shape and spectral signatures in the surface spectra: overall, they are much flatter and more distorted than those of Europa and Ganymede, especially the quite large 2-µm H2O-ice band. To the exception of crystalline ice absorptions at ~1.50 µm, ~1.57 µm, ~1.65 µm and the 2-µm band, Callisto does not show other clear signatures (figure 1). However, very subtle signature(s), like the one at ~2.21 µm (figure 1), might actually be observed and are being investigated to confirm the detection(s). If confirmed it could suggest the presence of hydrated materials like salts or silicates. We will address this point during the meeting.
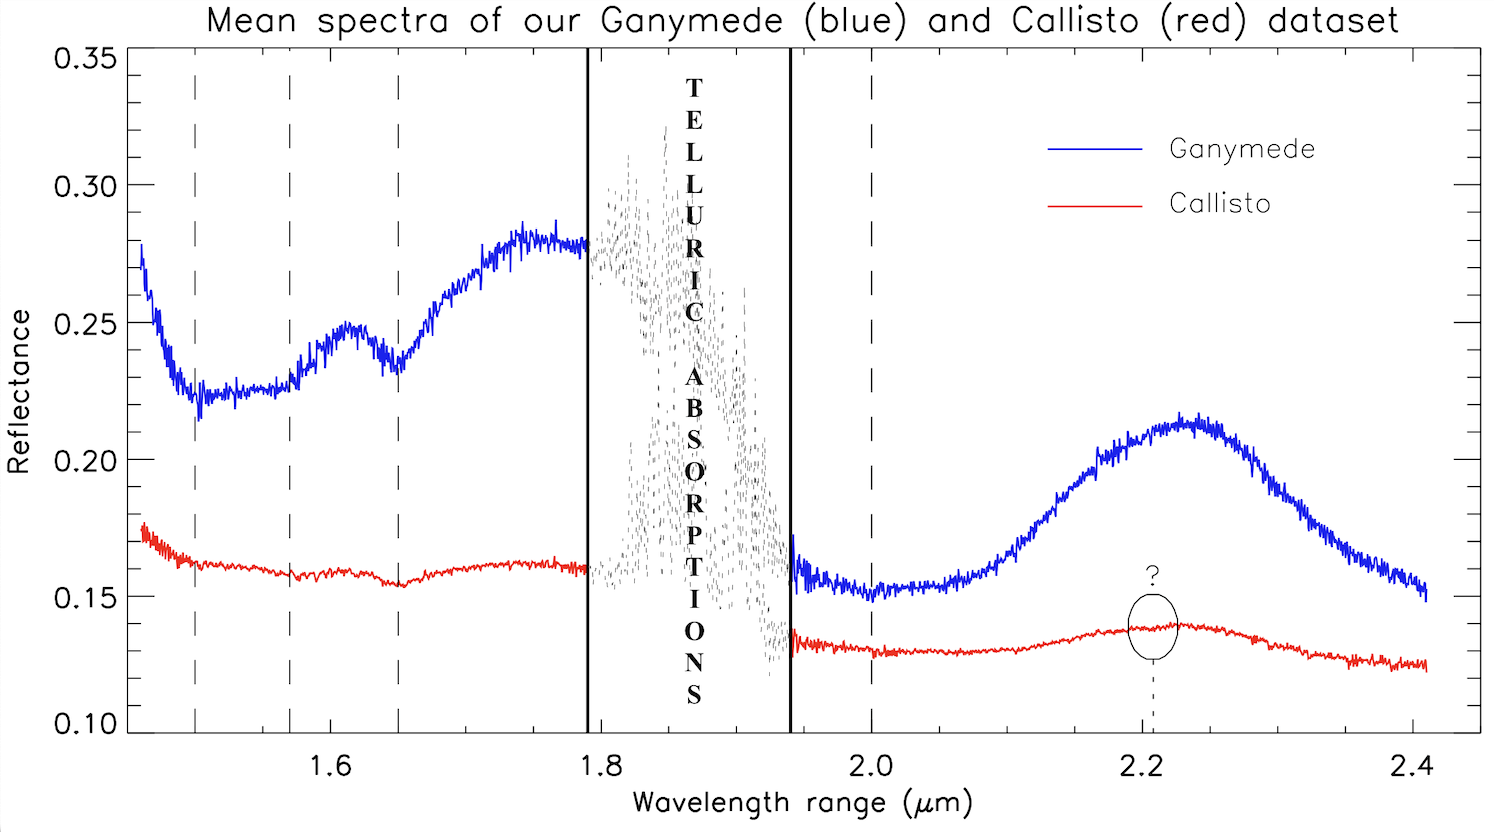
Figure 1: Comparison between Ganymede’s (blue) and Callisto’s (red) mean spectrum of the entire dataset.
And lastly our third main result comes from spectral modeling, where both linear and non-linear unmixing were performed. Unlike previous studies on Ganymede and Europa [Ligier et al. 2019, Ligier et al. 2016], the linear model shows that all of Callisto’s spectra are satisfactorily modeled without needing any hydrated salt and that the only two constituents would be (i) a darkening agent, with abundances always exceeding 80% even for the iciest spectra, and (ii) multiple grain sizes of the crystalline form of H2O-ice, with an average abundance of 7% and exhibiting a strong latitudinal gradient for the smallest grains typical of the influence of the Jovian magnetospheric environment (figure 2). Such a low concentration overall of H2O-ice challenged us about the legitimacy of the linear unmixing approach, so we decided to run the Shkuratov non-linear unmixing model [Shkuratov et al. 1999]. Tests are ongoing but very preliminary results show that the overall concentration of the crystalline ice should be much higher than the 7% coming from the linear model and hence much more representative of what should be the surface composition of an icy satellite. By the time of the meeting, we will be able to present the final results of the study.
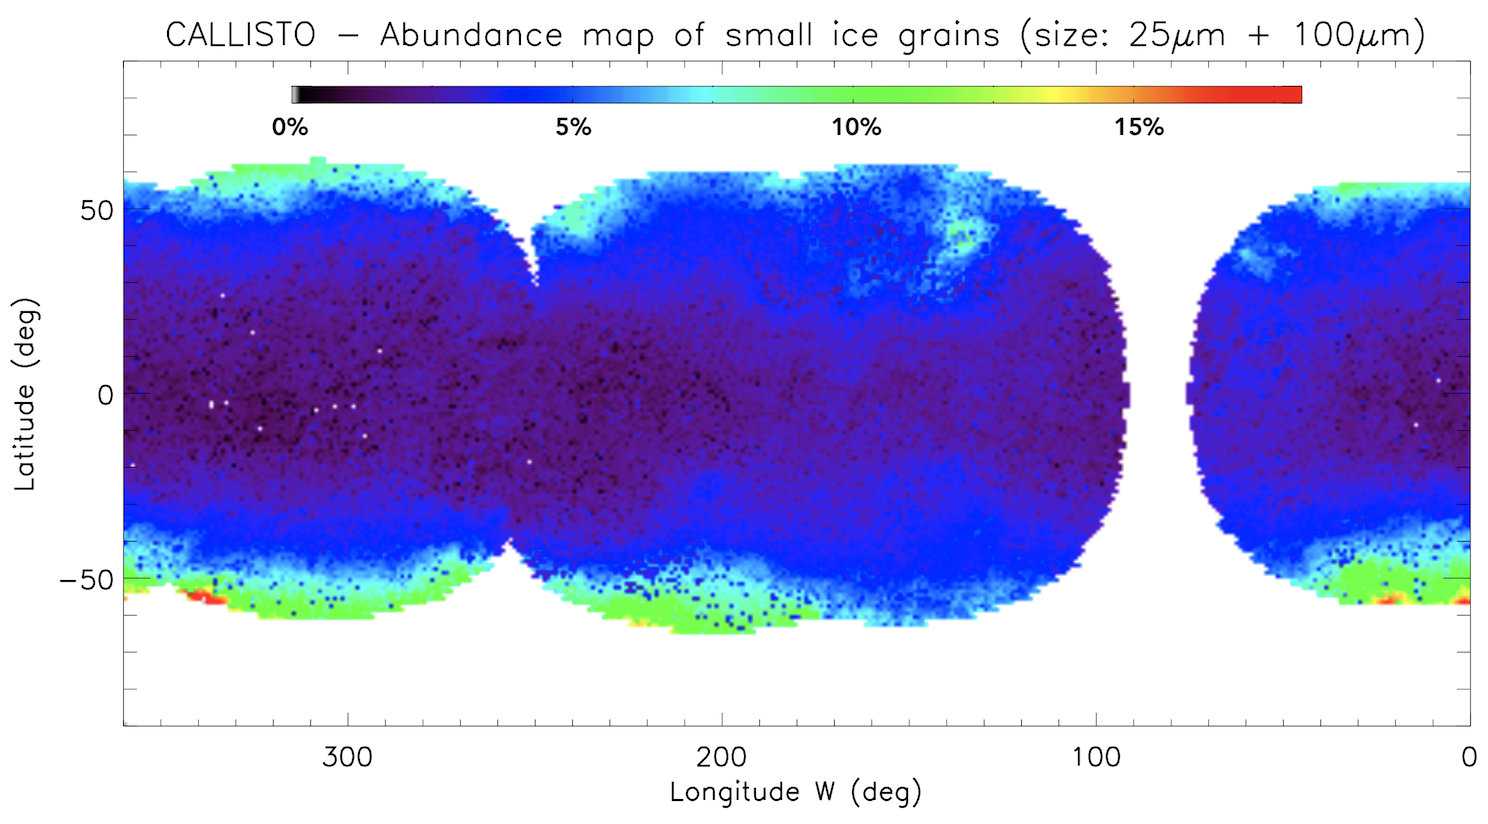
Figure 2: Distribution of the smallest grains of crystalline ice.
How to cite: Ligier, N., Riu, L., Carter, J., Calvin, W. M., Paranicas, C., and Poulet, F.: Pending the next "ocean worlds" missions: Callisto’s surface properties and composition from near-infrared telescopic data, Europlanet Science Congress 2022, Granada, Spain, 18–23 Sep 2022, EPSC2022-1050, https://doi.org/10.5194/epsc2022-1050, 2022.
The flyby of Pluto by the New Horizons spacecraft in 2015 revealed stricking features in a nitogen ice filled basin named Sputnik Planitia (SP). On the large (few 10 km) scale, irregular polygons [1] have been interpreted as resulting from solid-state convection [2, 3], with down-welling currents at the polygons’ edges [4]. It was first proposed that convection was driven by heating from below, associated with radioactivity in Pluto’s core but it produces a flow that is opposite to the observations with upwelling currents at polygons’ edges [5] (fig. 1a). At the small scale, we can observe pits that have been explained as produced by sublimation of nitrogen ice. The development of this pattern when getting toward the polygons’ sides has been used to estimate the flow velocity on several polygons, of the order 10 cm yr−1 [4]. We proposed [6] that sublimation is also at the origin of convection by cooling the surface: sublimation consumes latent heat which results in the surface of SP being ∼ 5 K colder than the surroundings [7].
We developed a theory to take into account sublimation in a convection model and showed that it leads to a mixed-type (Robin) thermal boundary condition which, in the case of SP is close to that of a fixed temperature. Starting from a uniform temperature in the ice layer, imposing a colder surface value leads to cooling and convection. With the best estimates of the various parameters for SP, a Rayleigh number of order 1 × 10⁵ can be obtained, justifying the possibility of convection. We used a mantle convection model to explore systematically the effect of surface cooling on convection in a temperature-dependent viscosity solid. Depending on the Rayleigh number and the viscosity contrast, we obtain different regimes (fig. 1b), including one with polygons that match the observations of SP (fig. 1c). The five cases that we obtained in that regime can be used to explore the relationships between observed quantities, like the polygonal sizes, and unconstrained ones, like the thickness of the ice layer or the amplitude of topography [6]. Such large-scale dynamics of a solid state layer driven by climate is unprecedented in the knowledge of planetary bodies but might also operate on other volatile rich moons and TNOs.
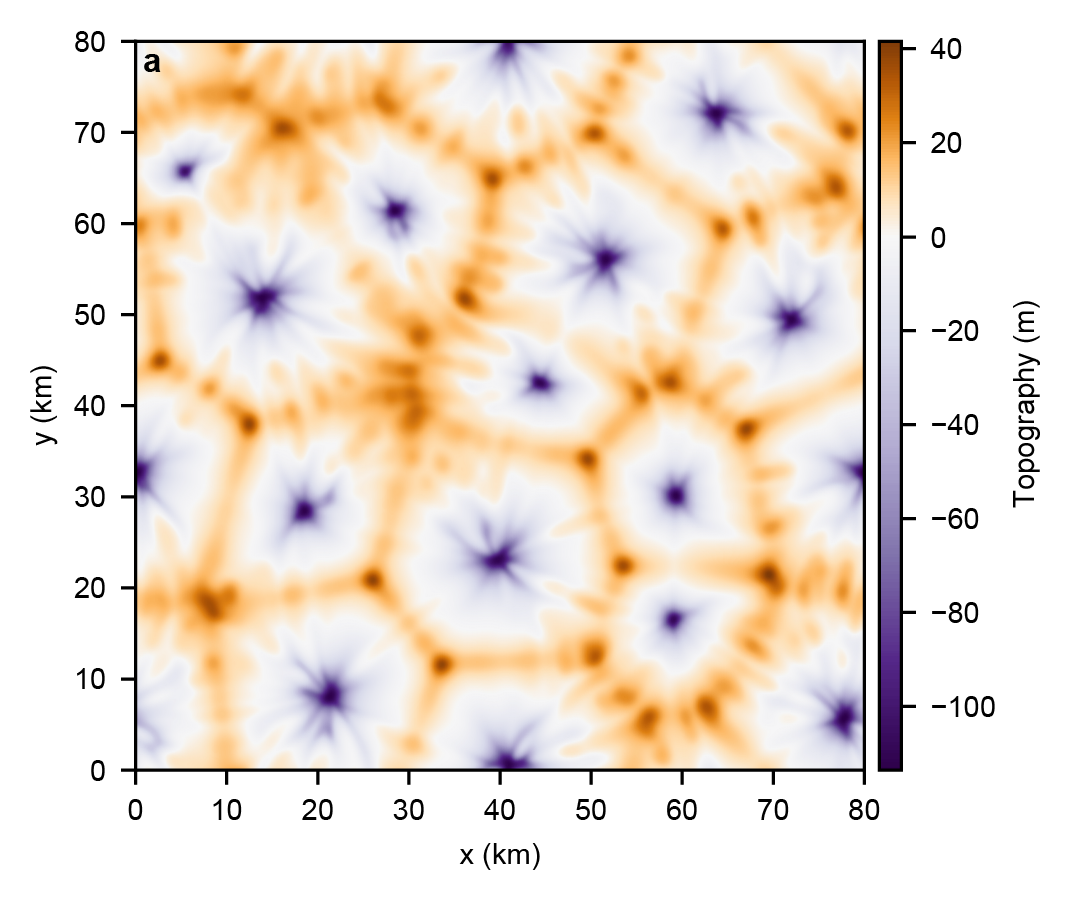

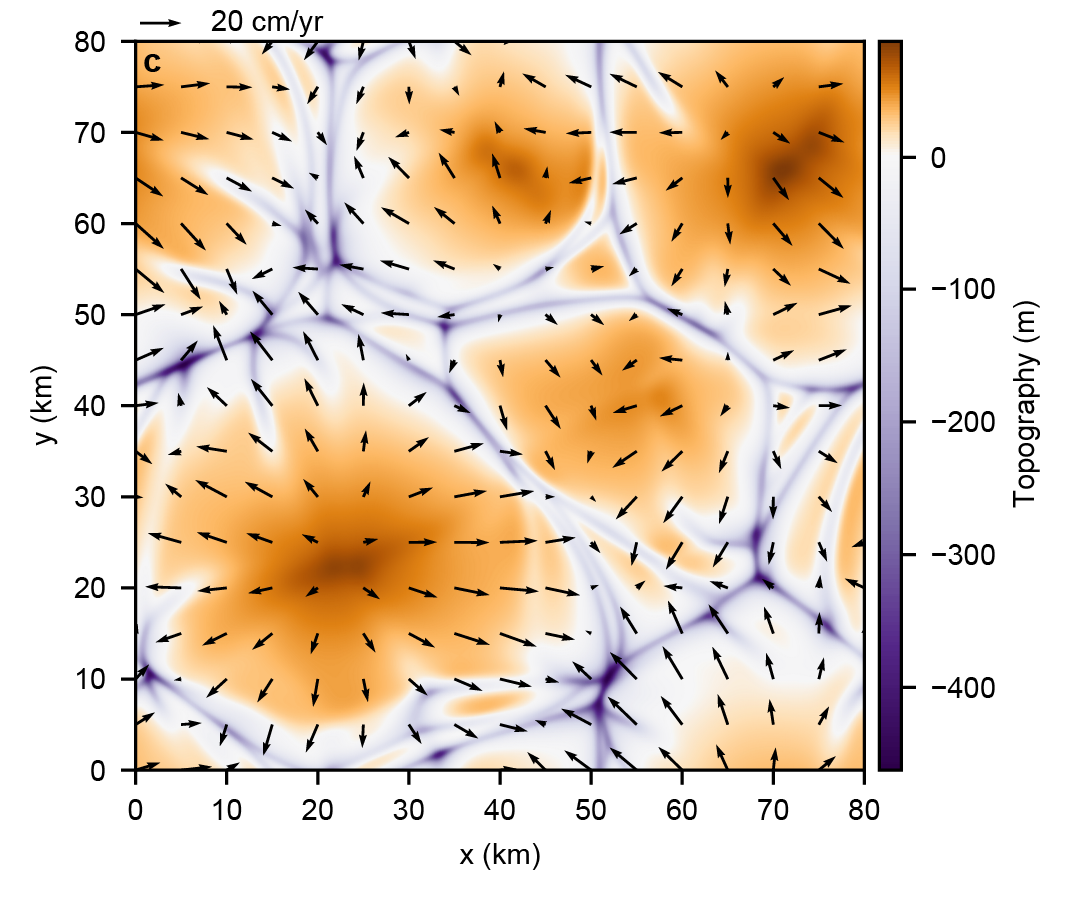
Figure 1: Convection pattern for bottom heated convection (a), convection driven by sublima- tion at the surface (c) and regime diagram as function of the Rayleigh number and viscosity contrast (b).
References: 1. White, O. L. et al. Icarus 287 (2017). 2. Trowbridge, A. J., Melosh, H. J., Steckloff, J. K. & Freed, A. M. Nature 534 (2016). 3. McKinnon, W. B. et al. Nature 537 (2016). 4. Buhler, P. B. & Ingersoll, A. P. Icarus 300 (2018). 5. Vilella, K. & Deschamps, F. J. Geophys. Res. 122 (2017). 6. Morison, A., Labrosse, S. & Choblet, G. Sublimation-driven convection in Sputnik Planitia on Pluto. Nature 600 (2021). 7. Gladstone, G. R. et al. Science 351 (2016).
How to cite: Morison, A., Labrosse, A., and Choblet, G.: Sublimation driven convection in Sputnik Planitia on Pluto, Europlanet Science Congress 2022, Granada, Spain, 18–23 Sep 2022, EPSC2022-434, https://doi.org/10.5194/epsc2022-434, 2022.
Introduction: The Wright Mons region of Pluto remains one of the most intriguing and enigmatic landscapes on the planet. Wright Mons is a large mountain ~150 km across that rises ~4 km above its surroundings, sports a central depression that is ~45 km across and ~4 km deep, and was tentatively assigned a cryovolcanic origin immediately following the New Horizons encounter in 2015 (Fig. 1) [1,2,3]. But the absence of obvious lateral flow features and the lack of unambiguously diagnostic characteristics of calderas or vents within the central depression have challenged the development of specific formation hypotheses. The pervasive cover of pillow-like hummocks, typically 7-20 km across, on the flanks and surroundings of Wright Mons have naturally figured into various working explanations for the formation of this region (Fig. 2). Individual hummocks themselves are covered by a km-scale blocky (or coalescing short ridge) texture. The similarity in size and shape of the convex hummocks and the style of their organization, such as forming a vaguely concentric fabric near the summit, potentially lend themselves to an endogenic origin.
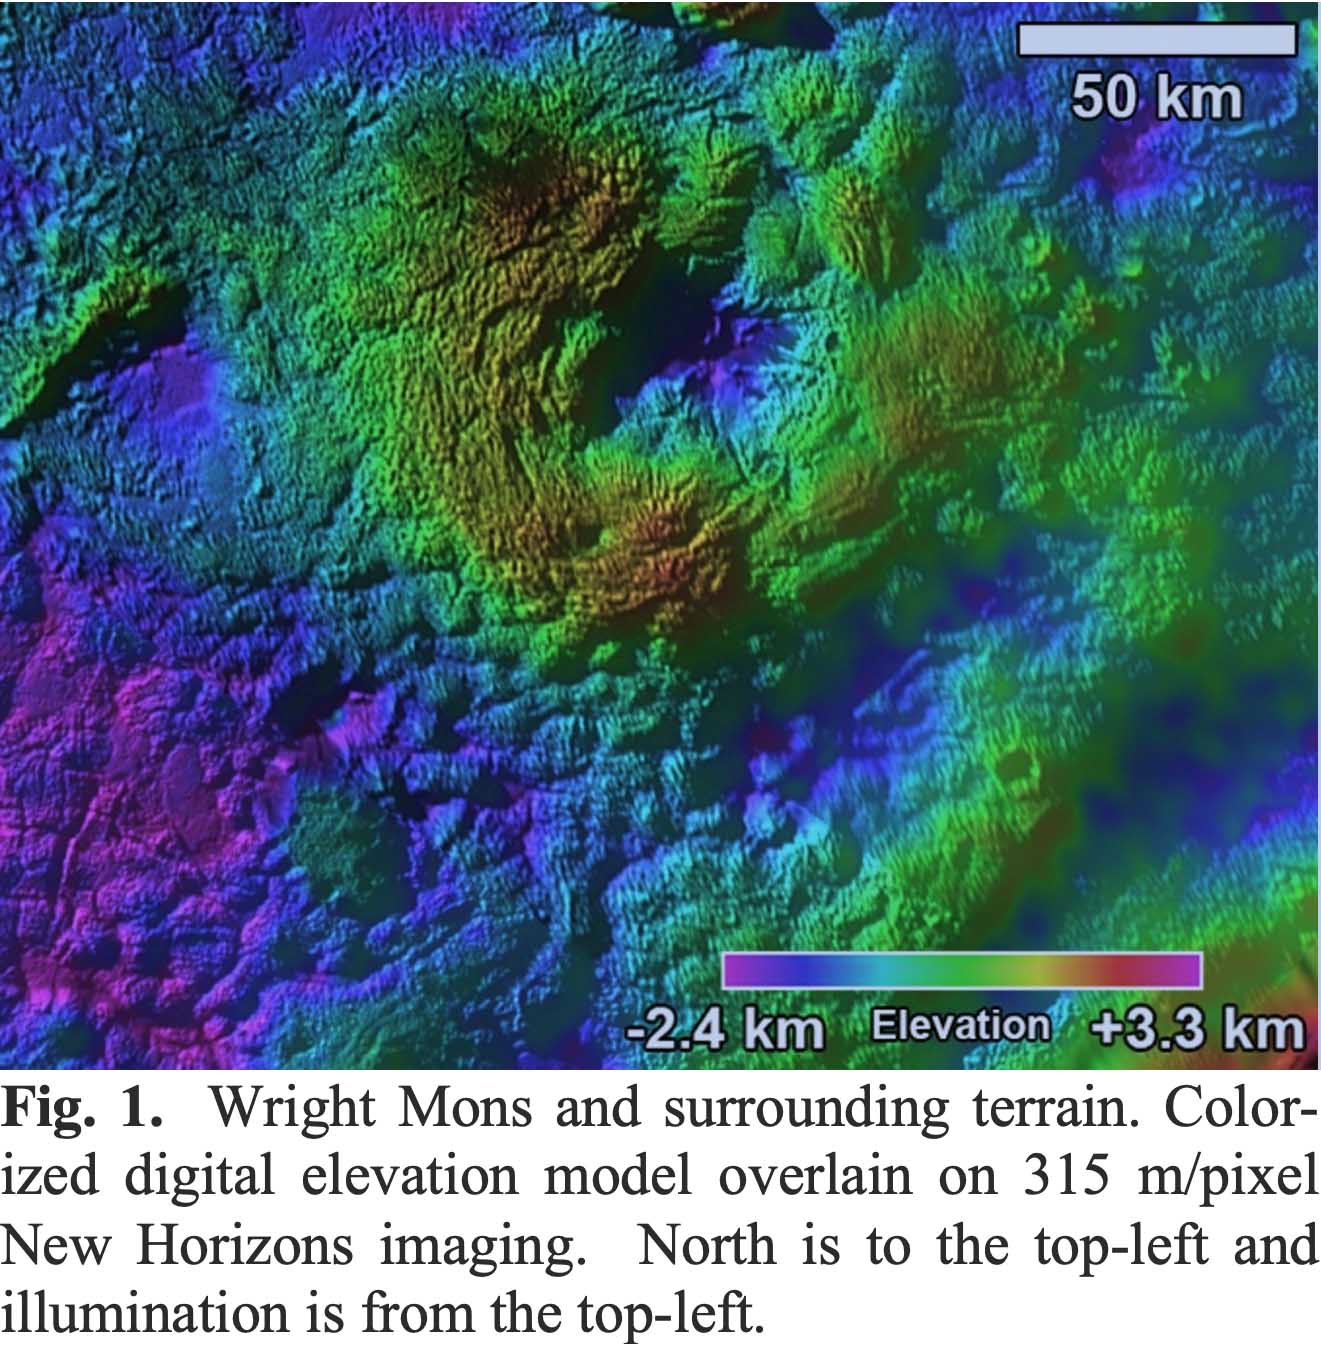
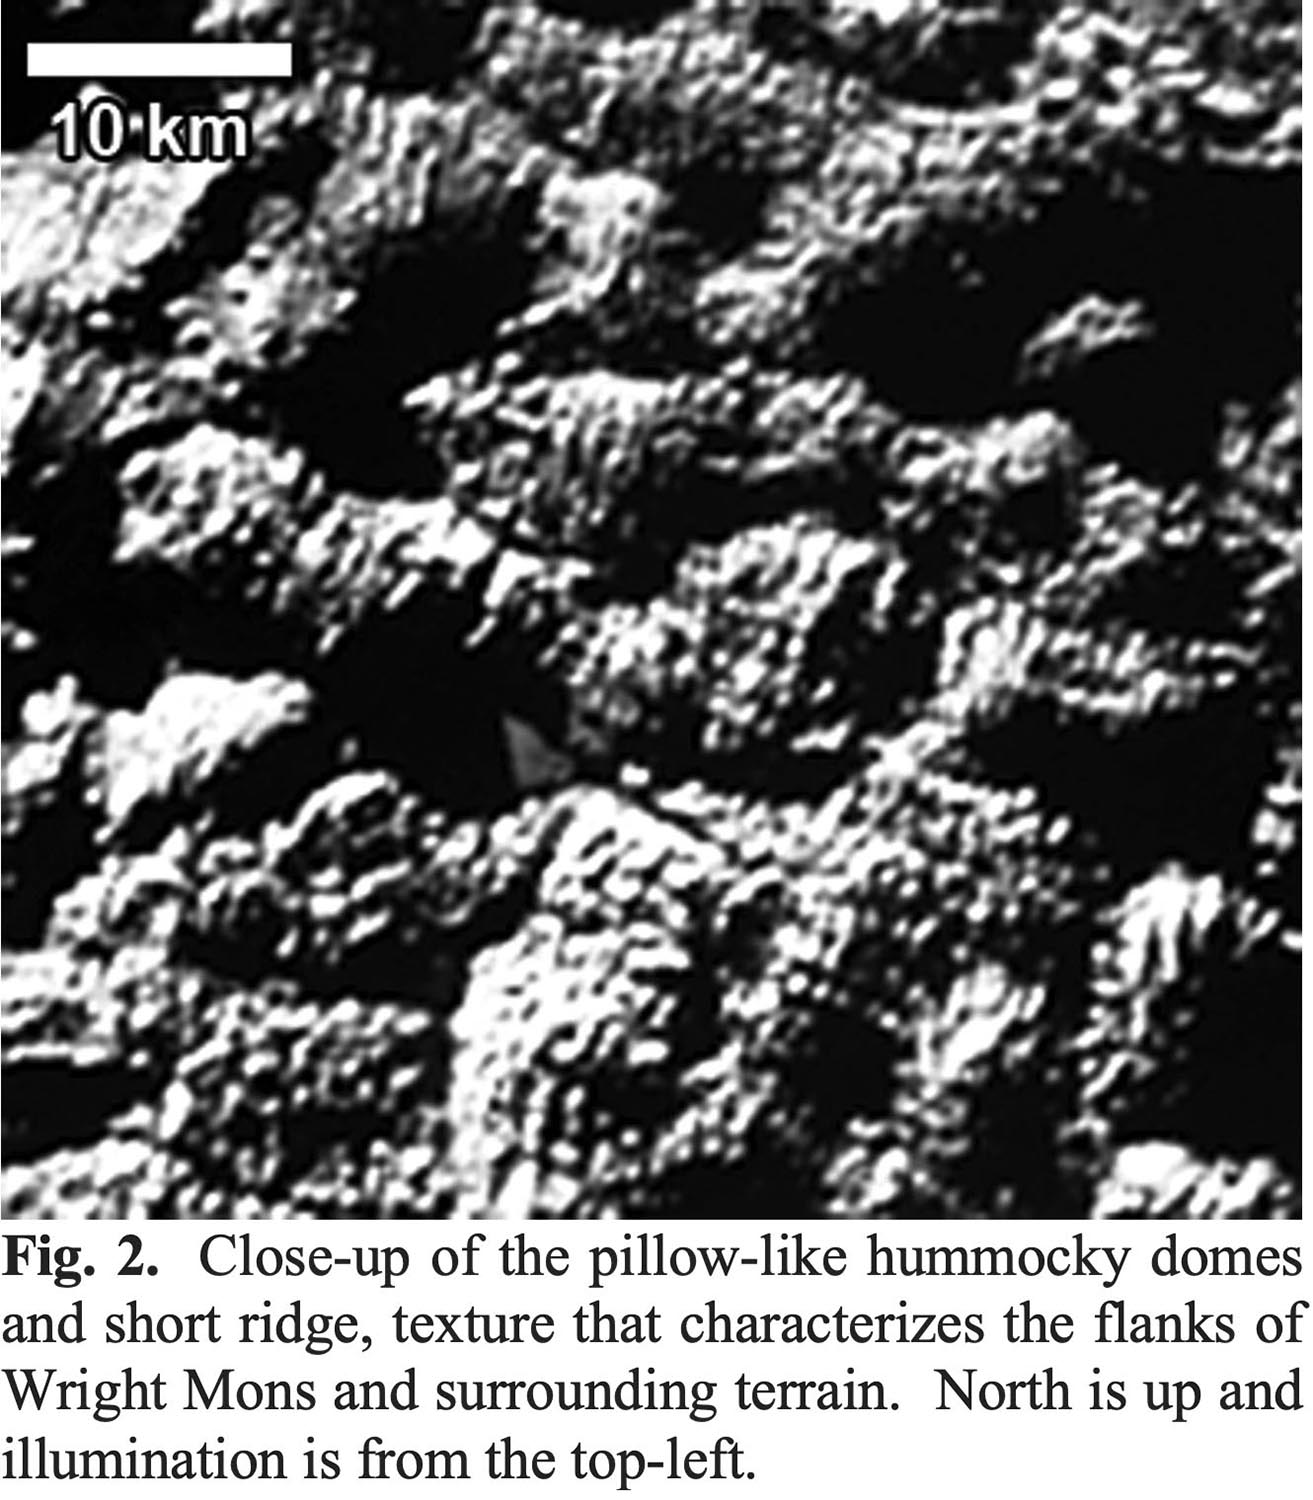
Observations: We mapped out the lineament traces and orientations of individual 1-10 km elements to evaluate any emerging patterns that might indicate which process may have been involved with their formation. First we mapped lineaments in 3 regions on and around Wright Mons then a separate set some distance from the Mons to look for variation (Fig. 3). A rose diagram (Fig 4) shows the plots of these orientations by region. Some generalities can be noted: 1. Ridges in Regions 1, 2 & 3 dominantly trend along a 30˚-210˚ axis (relative to 0˚N). Ridges in Region 4 trend nearly N-S, similar to the Bladed Terrain. 2. In Regions 2 and 3 there is a strong structural orientation trend parallel to the mapped ridges. 3. In Regions 2-4 there are numerous structures along trends within +/-45˚ of E-W. 4. Both ridges and structures are absent within +/-20˚ of the direction of Solar illumination. This is probably partly due to lack of discernability, but the visible ridges are too long and too parallel to be an artifact of illumination of random topography.
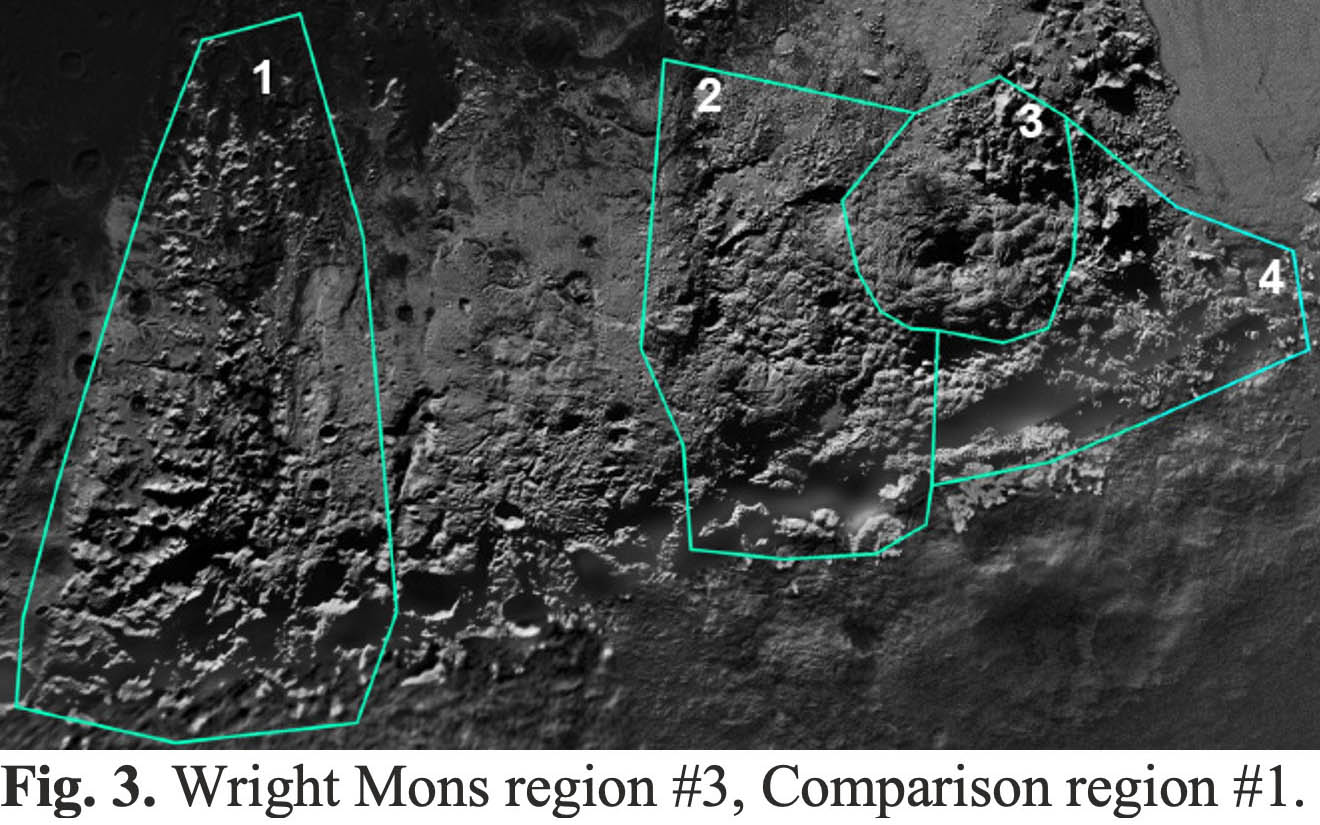
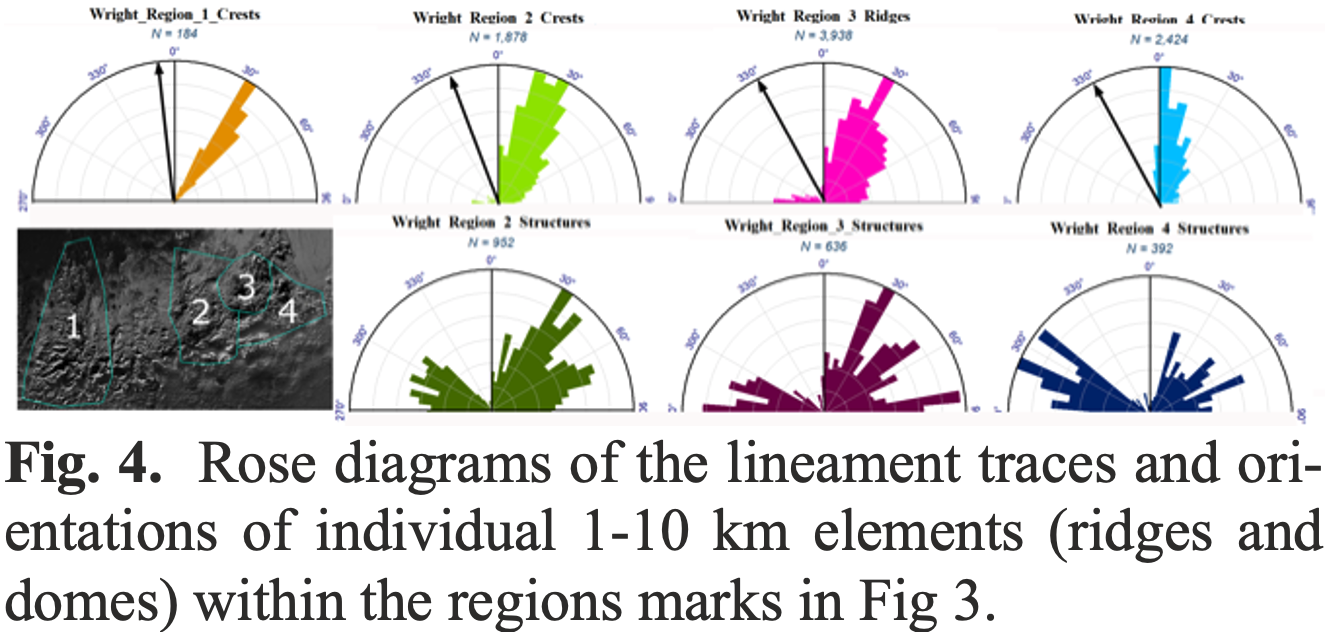
One possibility is that the ridges are simply high points between structural depressions. This would imply an erosional origin of the ridges as less eroded remnants between weathered and eroded fractures. It is uncertain what weathering and erosional processes would operate on Pluto. The lateral scale of the ridges would depend upon thickness of the surface unit and generally implies an underlying deformable unit and extensional tectonics. Other possible mechanisms forming aligned ridges: 1. Constructional, with scales dependent, perhaps, on atmospheric conditions (boundary layer thickness, wave structures). 2. Constructional or erosional with size and spacing due to sublimation or condensation length scales. 3. Formation as transverse dunes (e.g, parallel ridges in the north polar martian erg). 4. Erosional, due to thermal anomalies along fractures or weathering processes. The western margin of Region 2 has the appearance of erosional modification of an earlier deposit. 5. The ridges are primary features and the inferred structural lineations are actually primary constructional features.
All of these possible modes of origin of the topographic lineations implies a role of exogenic processes, either directly involved in construction of the domes and Mons of this region or through post-formation modification. Here we outline a possible mixed endo-exogenic origin for formation of Wright (and Piccard) Mons as well as the ~10 km scale hummocky domes and their km-scale knobby ridge texture.
Hypothesis: Perhaps the bulk of the deposits forming both the Mons and hummocky dome features were sourced by gaseous (or mixed gaseous-fluid) eruptions (gradual or episodic). Sources would include both the Mons depressions and fracture systems (many fractures are situated between domes). As gases and fluids escape, atmospheric and solar radiation processes control the deposition of the Mons and the smaller (10 km-scale) hummocky dome structures. In detail this process would involve cooling of erupted material encourages deposition by either or both of condensation on the surface or freezing in the atmosphere resulting in “snow.” Higher temperatures near sources and in depressions inhibits condensation in the center of the Mons and along fracture traces. Density currents of condensed eruptive material flow down Wright and Piccard Mons, forming the pronounced topographic structures. The density currents are not envisioned to be catastrophic, avalanching events. The km-scale knobby ridges are formed either during deposition or subsequently by sublimation as influenced by solar radiation – but the NNE-SSW dominant orientation remains an enigma. Perhaps this reflects the prevailing regional wind direction at the time of emplacement.
References: [1] Moore J. M. et al. (2016) Science, 351, 1284-1293. [2] Schenk P. M. et al. (2018) Icarus, 314, 400-433. [3] Singer K. N. et al. (2022) Nat Commun 13, 1542-1551.
How to cite: Moore, J. M., Howard, A. D., White, O. L., Umurhan, O. M., Singer, K. N., and Schenk, P. M.: Are the Surface Textures of Pluto’s Wright Mons and its Surroundings Exogenic?, Europlanet Science Congress 2022, Granada, Spain, 18–23 Sep 2022, EPSC2022-120, https://doi.org/10.5194/epsc2022-120, 2022.
The icy surfaces of Saturn's synchronous satellites exhibit variations in thermal properties across their leading and trailing hemispheres. They are qualitatively attributed to changes in grain size properties and/or chemical composition which may originate from exogenous pollution, alteration by solar UV rays, or plasma and energetic charged particles trapped in Saturn magnetosphere, or from the coating or sandblasting by the particle of the E ring (Howett et al. 2018). It is difficult to understand which of these weathering processes dominates and what are the effects actually induced on the regolith.
On the surface of Mimas, the famous so-called “Pacman” asymmetry is very contrasted, with an asymmetry in thermal inertia of Γin= 66 ± 23 SI within a lens-shaped oval centered on the leading hemisphere, against Γout < 16 SI outside of it, for Bond albedos Ain ∼ Aout ∼ 0.6 (Howett et al. 2010, 2011). These estimates were obtained thanks to the high spatial resolution offered by the FP3 plane of the CIRS spectrometer which operates at wavelengths between 9 and 17 μm. They were recently revised to Γin = 98 ± 42 SI and Γout = 34 ± 32 SI for albedos Ain = 0.45 ± 0.08 and Aout = 0.41 ±0.07 after analysis of the whole set of FP3 observations acquired during the Cassini mission (Howett et al 2020). FP3 data did not cover the trailing hemisphere of Mimas. The thermal anomaly discovered on the leading hemisphere correlates well with the region where the energy accumulation due to high energy electrons bombardment occurs the fastest (Howett et al. 2020). The Bond albedo are systematically lower than those derived from near-infrared observations (Pitman et al. 2010).
This gain in high spatial resolution was achieved at the cost of the assumption of an emissivity equal to one. The emissivity of an icy regolith is expected to vary with the size of grains, the topography and the mixing of temperatures within the footprint of the observing instrument. The heat transfer within the regolith also depends on composition and size of grains, and on its porosity (Ferrari and Lucas 2016). On the other hand, CIRS focal plane FP1 plane (17-1000 μm) can be used to derive both the temperature and the emissivity at the cost of spatial resolution. We have therefore developed a thermal model that takes into account the size, composition of grains and the porosity of the regolith (Ferrari et al. 2021). It also includes the effect of topography and temperature mixing within the footprints of FP1 focal plane along an observation. Confronted with FP1 data, the model therefore makes it possible to interpret the regional variations in thermal emission with the variations in physical properties of the regolith.
Two FP1 observations of Mimas in which significant regional variations of emissivity eF can be observed (figure 1), have been analyzed with this model. We have tested whether these regional variations observed on both the leading and trailing hemispheres around the predicted oval patterns of electrons energy deposition (Nordheim et al 2017) could be explained by variations in grain or regolith properties. Results obtained for both hemispheres will be presented and compared with constraints obtained thanks to near-infrared spectroscopy, in particular the variations in grain sizes and Bond albedo. The eventual sintering or amorphization of grains under MeV electrons bombardment on the leading side (Schaible et al 2016) or the competing processes of E ring deposition or sandblasting competing with eventual darkening by cold plasma on the trailing hemisphere will be discussed (Howett et al 2018).

Figure 1- Apparent Temperature TF versus emissivity eF within the footprints of one FP1 observation led in February 2005 on the trailing hemisphere of Mimas (Black full line). The red (dashed-dot) curve is the model best fit assuming uniform properties of the regolith. The green (dashed) curve yields a better fit assuming a lens-shaped pattern with maximum latitudinal extension of +/- 20 ° at the center of the hemisphere. Crystalline water ice and loose contacts between grains are considered here (Ferrari et al. 2021). Within the oval pattern, grains size may be Rin ∼ 100 μm with Bond albedo Ain ∼ 0.45, whereas grains outside of it, they may be much smaller, ∼ 15 μm with a brighter albedo Aout∼ 0.61. In the uniform case, grains size may be ∼ 20 μm in size with a Bond albedo A∼ 0.43.
Ferrari, C. and A. Lucas 2016, A&A 588, A133
Ferrari, C., Lucas, A., Jacquemoud, S., A&A, EDP Sciences, 2021, 655, pp. A
Pitman, K.M., B.J. Buratti and J.A. Mosher, 2010, Icarus, 206, 537
Schaible, M.J., R.E. Johnson, L.V. Zhigile and S. Piqueux, 2016, Icarus 0,1
Nordheim, T.A., Hand, K.P., Paranicas, C., Howett, C.J.A. et al., 2017, Icarus 286, 56
Howett, C.J.A., Spencer, J.R., Pearl, J. and M. Segura, 2010, Icarus 206, 573
Howett, C.J.A, Spencer, J.R., Schenk, P., Johnson, R.E.et al., 2011, Icarus 216, 221
Howett, C.J.A, Spencer, J.R., Nordheim, T., 2020, Icarus 348, 113745
Howett, C.J.A, et al. 2018, in: Schenk, P.M., Clark, R.N., Howett, C.J.A., Verbiscer, A.J., Waite, J.H (Eds.), Enceladus and the Icy Moons of Saturn. U. Arizona Press.
How to cite: Ferrari, C. and Lucas, A.: Properties of Icy Surfaces from their Thermal Emission: the Mimas case., Europlanet Science Congress 2022, Granada, Spain, 18–23 Sep 2022, EPSC2022-454, https://doi.org/10.5194/epsc2022-454, 2022.
Understanding the rheology of ice in the outer shells of ocean worlds is important for a variety of reasons. The mechanical behavior has long been studied to make sense of intriguing surface morphologies, some of which bear striking resemblance to rocky features on Earth and other bodies, some of which are totally unique. The mechanical behavior of planetary ice also is used to provide possible answers to questions related to transport and conveyance of melt and/or chemical species, which in turn addresses potential habitability. Finally, in the era of ocean world exploration, knowledge of the mechanical behavior of very cold and moderately impure ice provides critical information needed to manage expectations and inform protocols for future missions. In this presentation I will share results from experiments conducted in our lab on ice and ice-mixtures that are designed to measure the mechanical behavior at planetary conditions. In particular we use a custom cryogenic, servo-controlled biaxial apparatus to measure frictional response of ice sliding on ice to explore faulting behavior in the upper, brittle portion of an icy shell. Moving beyond simple Coulomb analysis, we measure fault stability as a function of temperature and velocity, which point to a predicted source region for icequakes at depth, a so-called “seismogenic zone” for icy worlds. We employ rate- and state- dependent frictional properties determined from experiments in numerical models to describe a variety of fault and boundary types, including thrust, subduction, and strike-slip faulting. We explore the nature of unstable frictional behavior by analyzing laboratory stick-slip events for frequency-magnitude, or recurrence, relations. Such information can inform expected seismic activity and be useful for planning instrument sensitivity and can be used ultimately to interpret results from a lander-based seismometer. Additionally we will present results from performance testing of communications hardware that may be deployed in the vicinity of such active faults. We will share mechanical and optical results from a series of shear-testing experiments on fiber optic communication tethers embedded in ice and will articulate the feasibility of their use in future probe missions that will descend into an icy shell. The experimental work coming out of our lab seeks to unravel the dynamic properties of ice on icy moons, identify challenges that may arise when spacecraft interact with it, and develop the technology required for assessing the habitability of ocean worlds.
How to cite: McCarthy, C., Zaman, M., Singh, V., and Skarbek, R.: Laboratory Research on Ice Rheology in support of Ocean World Exploration, Europlanet Science Congress 2022, Granada, Spain, 18–23 Sep 2022, EPSC2022-731, https://doi.org/10.5194/epsc2022-731, 2022.
INTRODUCTION
Material transport between the ice shell and the deep interior has recently received some attention since many Jovian and Saturnian icy moons, as well as some Kuiper Belt objects, are believed to harbor global subsurface oceans. Evidence in the form of volatile compounds indicates the existence of mechanisms that transport material from the ocean to the surface (for review, see [1]). The proposed mechanisms suggest either direct exchange due to shell damage (e.g., rupture due to tidal forces, break-through after an impact) in the case of thin shells or indirect transport by subsolidus convection in the case of thicker shells. However, the latter mechanism still needs to be accompanied by an additional shell disruption (e.g., large-scale tectonics or melt-induced collapse), since convecting ice shells are likely to have a stagnant conductive lid, preventing the upwelling material from reaching the surface [1,2].
Several studies have addressed the indirect transport of volatiles in ice [e.g., 2,3], including melt transport in high-pressure ice [4]. Here, we focus on the exchange between the outer ice shell and the ocean, triggered by a discontinuity in heat flux at the ice-water boundary [5]. The heat flux discontinuity, accompanied by melting and freezing, can result from many factors, e.g., uneven surface insolation or albedo, circulation of the ocean, tidal heating, or other temperature variations within the shell. The efficiency of material transport then depends on the mode of heat transfer within the shell because convective flow can carry the material into shallow depths of the ice shell.
METHOD
In this study, we investigate the particle trajectories in the ice shell for two modes of heat transfer – conduction and convection. In the case of conduction (diffusion creep with a grain size of 6 mm), we induce the ice-water boundary shape by a cosine-shaped variation in the heat flux coming from the ocean, resulting in melting in the middle of the domain and freezing on the sides. In the case of convection (grain size 1 mm), we do not impose any variation in the heat flux since they result naturally from convective upwellings and downwellings inside the ice shell.
The evolution of the ice-water boundary is determined by two factors. First, by the velocity of ice flow, v, obtained by solving the equations of thermal convection in the Boussinesq approximation

and, second, by the velocity of the phase change

proportional to the heat flux jump (qi - qw) at the ice-water boundary [5]. As these two factors compete with each other, the shape of the boundary will remain steady once they balance each other (u = -v). We solve the above equations by the finite element method in a rectangular domain of thickness 100 km and aspect ratio 16. We use a free surface boundary condition and temperature of 90 K on the top boundary, and hydrostatic pressure and temperature of 265 K on the bottom boundary. Considering that the ice deforms by diffusion creep, the viscosity only depends on temperature and grain size.
RESULTS
Figure 1 shows the trajectories of material particles near the ice-water interface for a convective case. The light blue lines represent particles entering and leaving the ice shell without rising higher than 200 m above the ice-water boundary. The orange lines represent particles coming from the ocean into the shallow depths of the ice shell, while the dark blue lines represent particles coming in the opposite direction. Finally, the gray lines represent particles trapped within the convection cell, unable to escape. Note that particles enter the shell beneath the downwelling and leave the shell under the plume (in the opposite way than one would expect from models without phase transition), corresponding to regions of freezing and melting maxima, respectively.
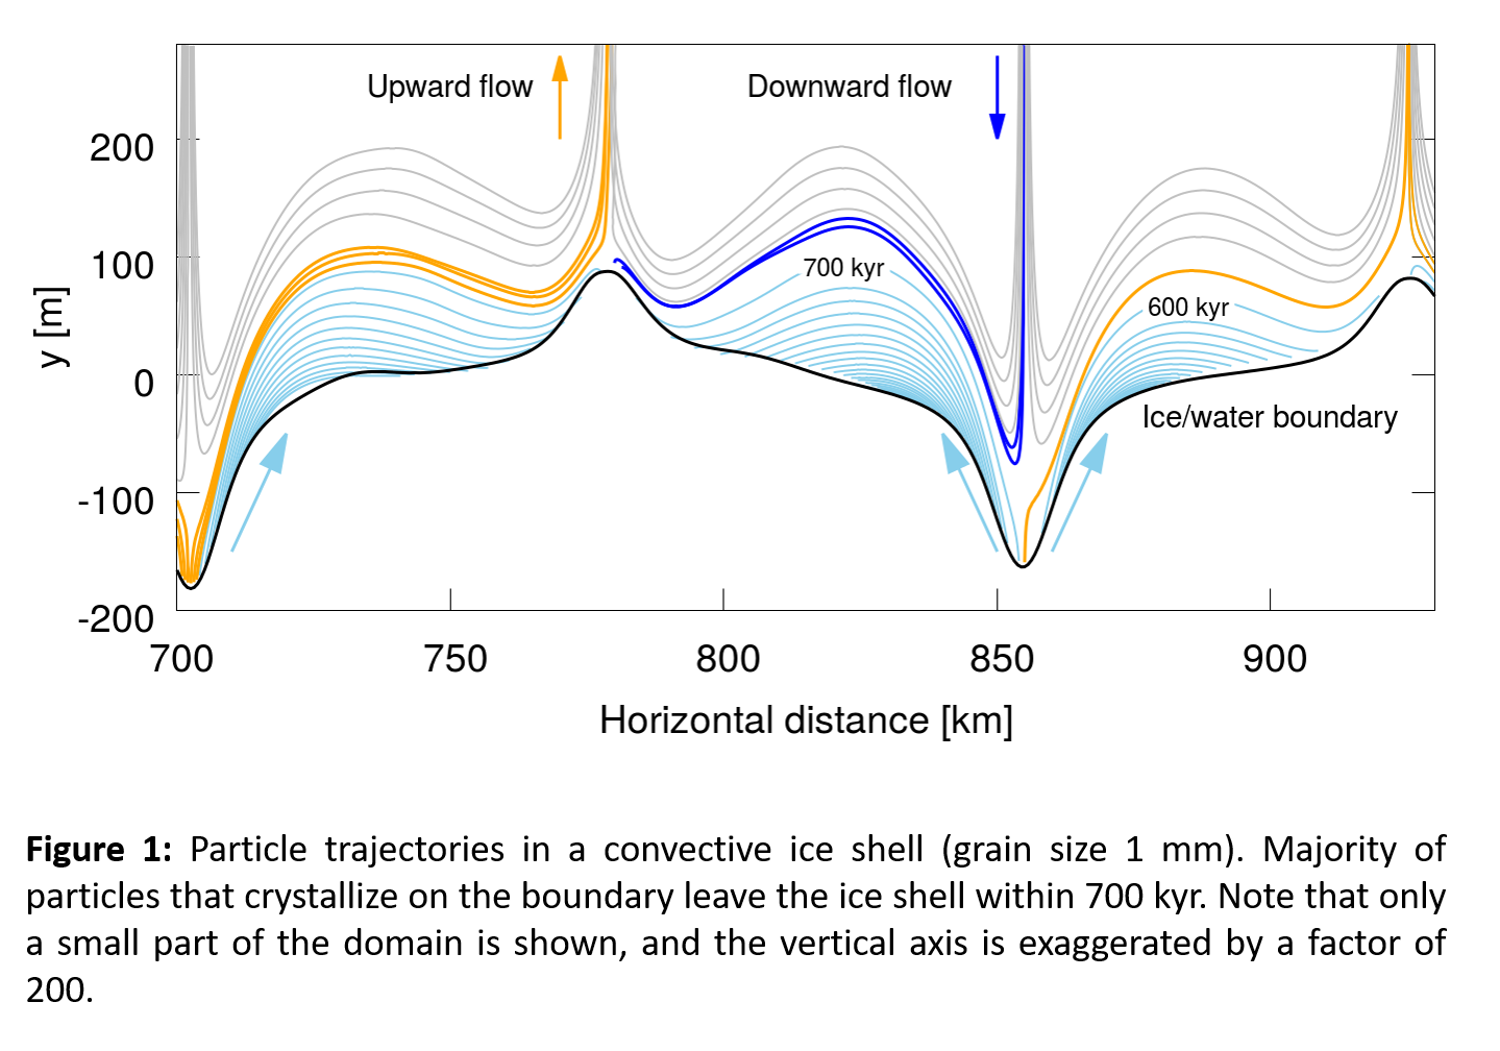
Figure 2 shows the trajectories of material particles near the ice-water interface for a conductive case. The color represents the time from entering the ice shell. We observe that only particles that enter the shell at the freezing maxima can rise into shallow depths. However, this process can take up to billions of years, which makes the material exchange in the conductive shell rather inefficient.
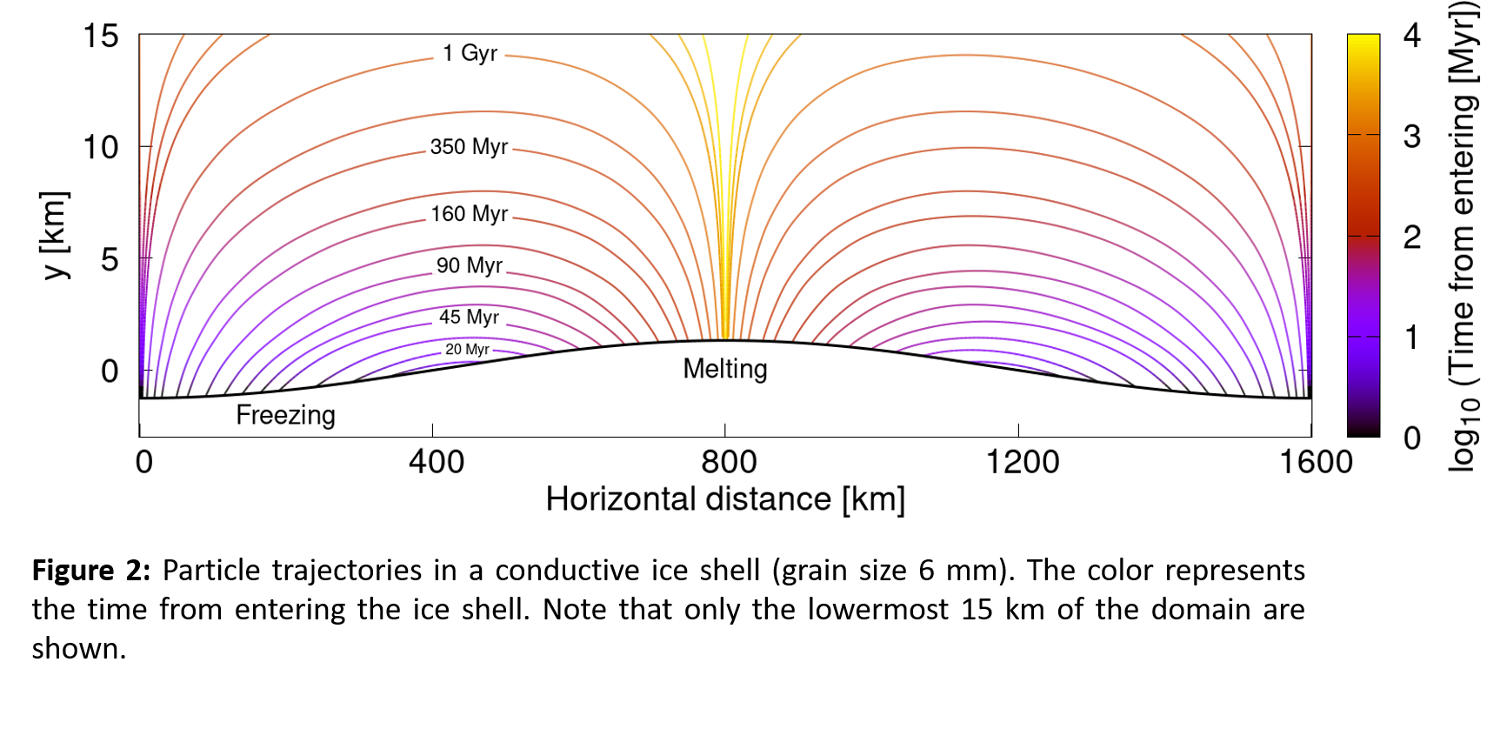
CONCLUSIONS
Our preliminary results show that the heat flux variation at the ice-water boundary is necessary to trigger material exchange between the ocean and the ice shell. Irrespective of the heat transfer regime, most of the material crystallizing on the ice-water boundary does not penetrate into shallow depths of the shell and returns to the ocean, making the material exchange inefficient. Furthermore, our results suggest that material in shallow depths of conductive shells might not be recycled on the time scale of the Solar System age.
Acknowledgements
M.K. acknowledges the support from the Czech Science Foundation through project No. 22-20388S and from the Charles University project 115-009/260581.
References
[1] Soderlund, Kalousová, Buffo et al., 2020, Space Sci. Rev., 216, 80.
[2] Kalousová and Sotin, 2020a, Geophys. Res. Lett., 47, e2020GL087481.
[3] Howell and Pappalardo, 2018, Geophys. Res. Lett, 45, 4701–4709
[4] Kalousová and Sotin, 2020b, Earth Planet. Sci. Lett., 545, 116416.
[5] Kvorka et al., 2018, Icarus, 310, 149–164.
How to cite: Kihoulou, M. and Čadek, O.: Effect of ice-water phase change on the material transport between ice shell and subsurface ocean on icy moons of Jupiter and Saturn, Europlanet Science Congress 2022, Granada, Spain, 18–23 Sep 2022, EPSC2022-967, https://doi.org/10.5194/epsc2022-967, 2022.
The existence of a high-pressure (HP) ice layer between the silicate core and the liquid ocean in large icy moons and ocean worlds is usually seen as a barrier to habitability, preventing a direct contact and therefore transfer of nutrients from the core to the liquid ocean (Figure 1). More recently, several studies [1-3] challenged that hypothesis and showed that exchanges were possible under specific conditions, allowing transport of salts toward the ocean. In the first part of our study, we considered an effect not taken into account in the previous works, which is the dynamical implications of the phase equilibrium at the ice-ocean interface allowing a non-zero vertical velocity at the surface of the HP ice layer. Convective stresses in the solid create a topography of the interface which can be erased by melting and freezing if flow on the liquid side is efficient. This effect, which can be modeled as a phase change boundary condition for the ice layer, has a significant impact on the flow dynamics and enables exchanges with the ocean by fusion and crystallization at the top interface of the HP ice layer, even without partial melting in the bulk of the ice layer [4]. For the same conditions as standard convective systems, it also leads to faster mass transfer in the bulk [5]. These exchanges are directly linked to the melting capacity of the ice at the interface between the HP ice layer and the core, depending on the efficiency of convection in the liquid ocean and quantified by a unique parameter, Φ. Considering this boundary condition at the interface between the HP ice layer and the liquid ocean, we propose a scaling of the bottom temperature and the top vertical velocity as function of the Rayleigh number (Figure 2), in the case of a fixed heat flux from the core, a rigid or free-slip bottom boundary and various values of the phase change parameter, Φ (Figure 1).
In the interest of separating the problems, we first started with a model that does not include partial melting and compositional variations. But, in the case where the heat flux from the core would be sufficient to reach the melting temperature at the boundary between the core and the HP ice layer, and because the temperature at the interface is laterally variable, a thin film of melt, or localized melt pockets, could exist along the bottom of the ice shell. This melt, containing salts from the core, could be transported into the ocean through the ascending hot plumes into the HP ice layer by successive melting and refreezing episodes. Then, we performed preliminary calculations based on the results of this first study, applied to Ganymede, and the conclusion is that in several conditions melt occurs at the bottom boundary and even in the bulk of the HP ice layer. Then, the partial melting and two-phase convection into the HP ice layer will be considered in further studies.
The second part of this study is to include impurities into the HP ice layer in order to study the ability of salt transfer by convection in the solid. Salts can enter the ice layer by diffusion, a very inefficient process. Otherwise, if melting occurs at the bottom of the ice layer, as mentioned above, liquid water can get enriched in salt and, since water is lighter than high pressure ice, it can rise by porous flow or fracking and refreeze. This results in a high concentration of salts in a layer of ice some height above the bottom boundary. This ice is denser than pure ice at the same temperature and can impede convection depending on the ratio of density increase associated to salts compared to the decrease associated to temperature, a ratio called buoyancy number Bi. We study this problem using Lagrangian tracers in the convection code and adding a flux of salts in a layer at the bottom of the ice layer. We study the effects of the buoyancy number on the heat and salt transfer efficiency in the layer, and the implications for the evolution of salt concentration in the ocean.
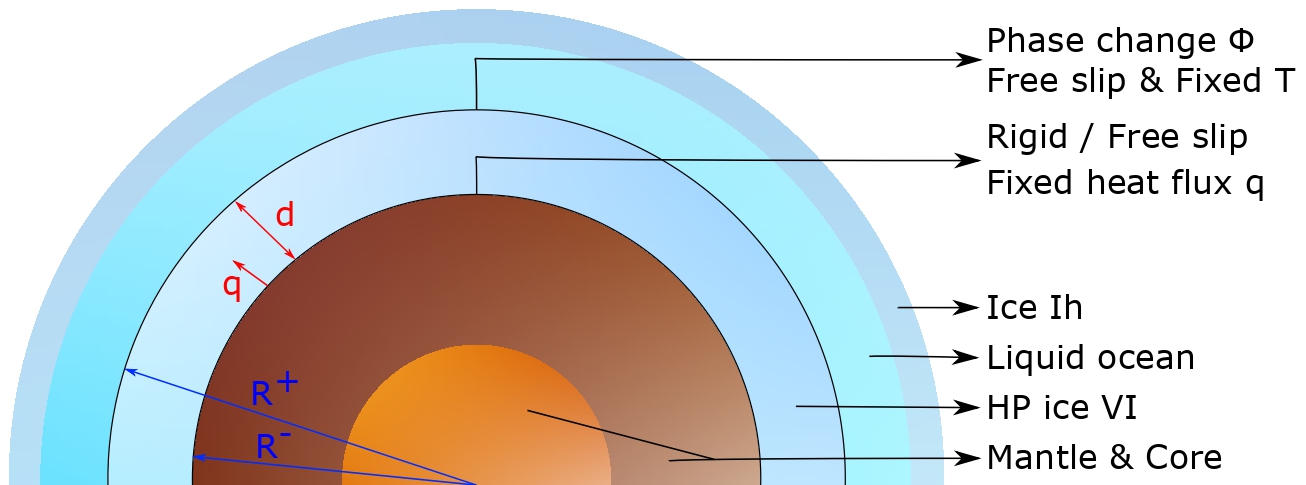
Figure 1 - Model illustration for the interior of an ocean world with an HP ice layer.
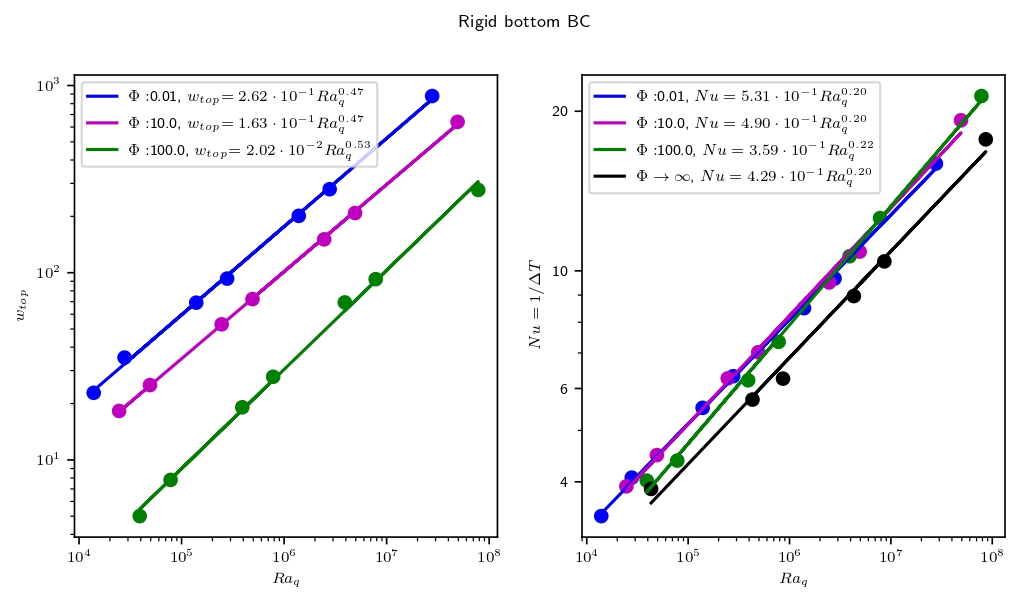
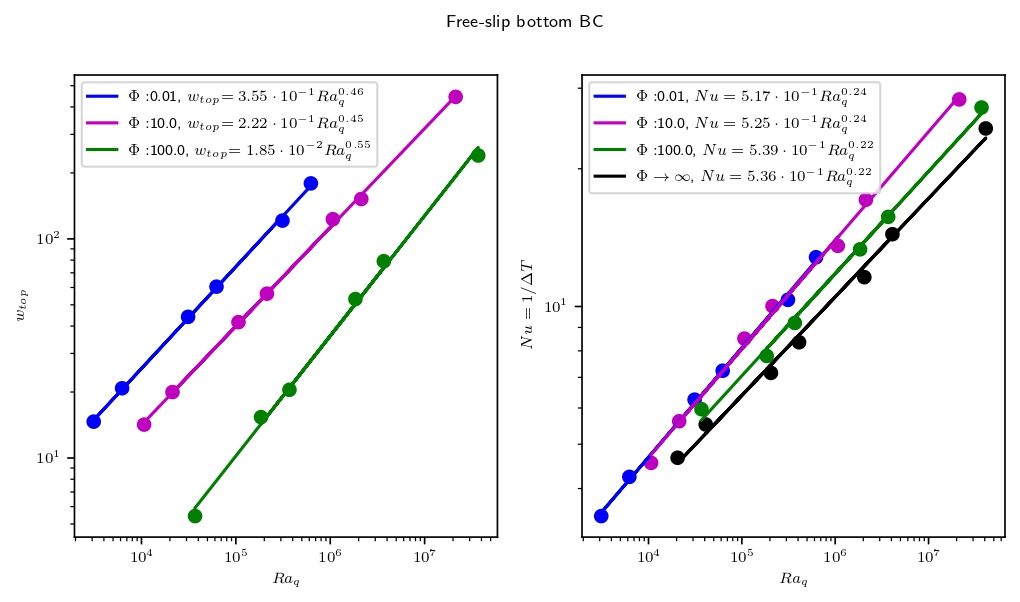
References:
[1] G. Choblet, G. Tobie, C. Sotin, K. Kalousová, O. Grasset (2017). Heat transport in the high-pressure ice mantle of large icy moons. Icarus, 285, 252-262
[2] K. Kalousová, C. Sotin, G. Choblet, G. Tobie, O. Grasset (2018). Two-phase convection in Ganymede’s high-pressure ice layer — Implications for its geological evolution. Icarus, 299, 133-147
[3] K.Kalousová, C. Sotin (2018). Melting in High-Pressure Ice Layers of Large Ocean Worlds—Implications for Volatiles Transport. Geophys. Res. Lett., 45, 8096-8103.
[4] Labrosse, S., Morison, A., Deguen, R., & Alboussière, T. (2018). Rayleigh–Bénard convection in a creeping solid with melting and freezing at either or both its horizontal boundaries. J. Fluid Mech., 846, 5–36. https://doi.org/10.1017/jfm.2018.258
[5] Agrusta, R., Morison, A., Labrosse, S., Deguen, R., Alboussière, T., Tackley, P. J., & Dubuffet, F. (2020). Mantle convection interacting with magma oceans. Geophys. J. Int, 220, 1878–1892. https://doi.org/10.1093/gji/ggz549
How to cite: Lebec, L., Labrosse, S., Morison, A., and Tackley, P. J.: Study of convection in high-pressure ice layers of large icy moons and implications for habitability, Europlanet Science Congress 2022, Granada, Spain, 18–23 Sep 2022, EPSC2022-650, https://doi.org/10.5194/epsc2022-650, 2022.
The water-rich layer of icy moons of the outer solar system contains a variety of organic (e.g. CH4, NH3, CO2) and inorganic (e.g. NaCl, MgSO4, Na2SO4, MgCl2) solutes detected by robotic mission like NASA Cassini and Galileo probes. Many of the geological processes on these moons, like cryovolcanisms, tectonics, oceanic evolution, involves processes of partial melting and fractional crystallization that are controlled by the stability of solid phases (ices and hydrates) and their eutectic. The ices and pure water thermodynamic are now accurately constrained at the high pressure and low temperature found inside these moons by the SeaFreeze numerical representation. However, the thermodynamics and equilibria in salty aqueous systems relevant for icy moons remains underexplored. SeaFreeze is used broadly in the planetary science community and beyond, the next logical step is the representation of the effect of salts (e.g. anti-freeze effects, eutectics, density, formation of hydrates, water activity), that requires important experimental effort. We will discuss new results from sound speed measurements, isochoric freezing and in-situ single crystal X-Ray diffraction experiments at high pressure and low temperatures that allowed us to constrain the equilibria (eutectics and phases stability) as well as solution thermodynamics in the H2O-(Na-,Cl+,Mg2+,SO42-) systems. We will present how these new data are implemented into SeaFreeze to allow for a comprehensive representation of water-salts systems from the cryogenic conditions at the surface to the incredible pressures found in icy worlds. We will discuss the implication for chemical physics/mineralogy as well as for the upcoming exploration of icy worlds of our solar system by NASA and ESA robotic space missions.
How to cite: Journaux, B., Brown, J. M., Pakhomova, A., Powell-Palm, M., Vance, S., Bollengier, O., and Tobie, G.: Salty SeaFreeze: new experimental efforts toward a comprehensive thermodynamic representation for icy moons hydrospheres., Europlanet Science Congress 2022, Granada, Spain, 18–23 Sep 2022, EPSC2022-756, https://doi.org/10.5194/epsc2022-756, 2022.
UP-FRONT SUMMARY
Canonically, researchers explore the outermost viscoelastic shells of the Galilean satellites as the layers primarily responsible for the diurnal dissipation of gravitational potential energy stored within their eccentric orbits around Jupiter. In this study, we find that tidal heating within solid, inner iron cores may be a first-order control on the heat budget of the resonant Galilean satellites.
This has widespread implications for body evolution, sustained geologic activity within the core and rocky mantles of these worlds, episodic resurfacing, magmatism, and their future exploration. Understanding the role of metallic core dissipation is key to understanding the habitability of Europa and Ganymede, the potential for a magma ocean on Io, and the history of Callisto. Future measurements by NASA’s Europa Clipper and ESA’s JUICE spacecraft will help to unravel the contributions of core dissipation to these global heat budgets.
DISSIPATIVE CORE PLAUSIBILITY
Observations of Io indicate a metal-rich core (e.g. Van Hoolst et al., 2020). At Europa, Schubert et al. (2009) infer that a metallic core is both permitted and likely, though a core is not uniquely required (Bills et al., 2009). Ganymede’s intrinsic magnetic field provides strong evidence for a metallic core (Schubert et al., 1996). Callisto, however, is likely only partially differentiated, with a dense rocky/metal core and a lighter silicate mantle (e.g. Bagenal et al., 2007). Figure 1 shows constraints on core state for Europa.
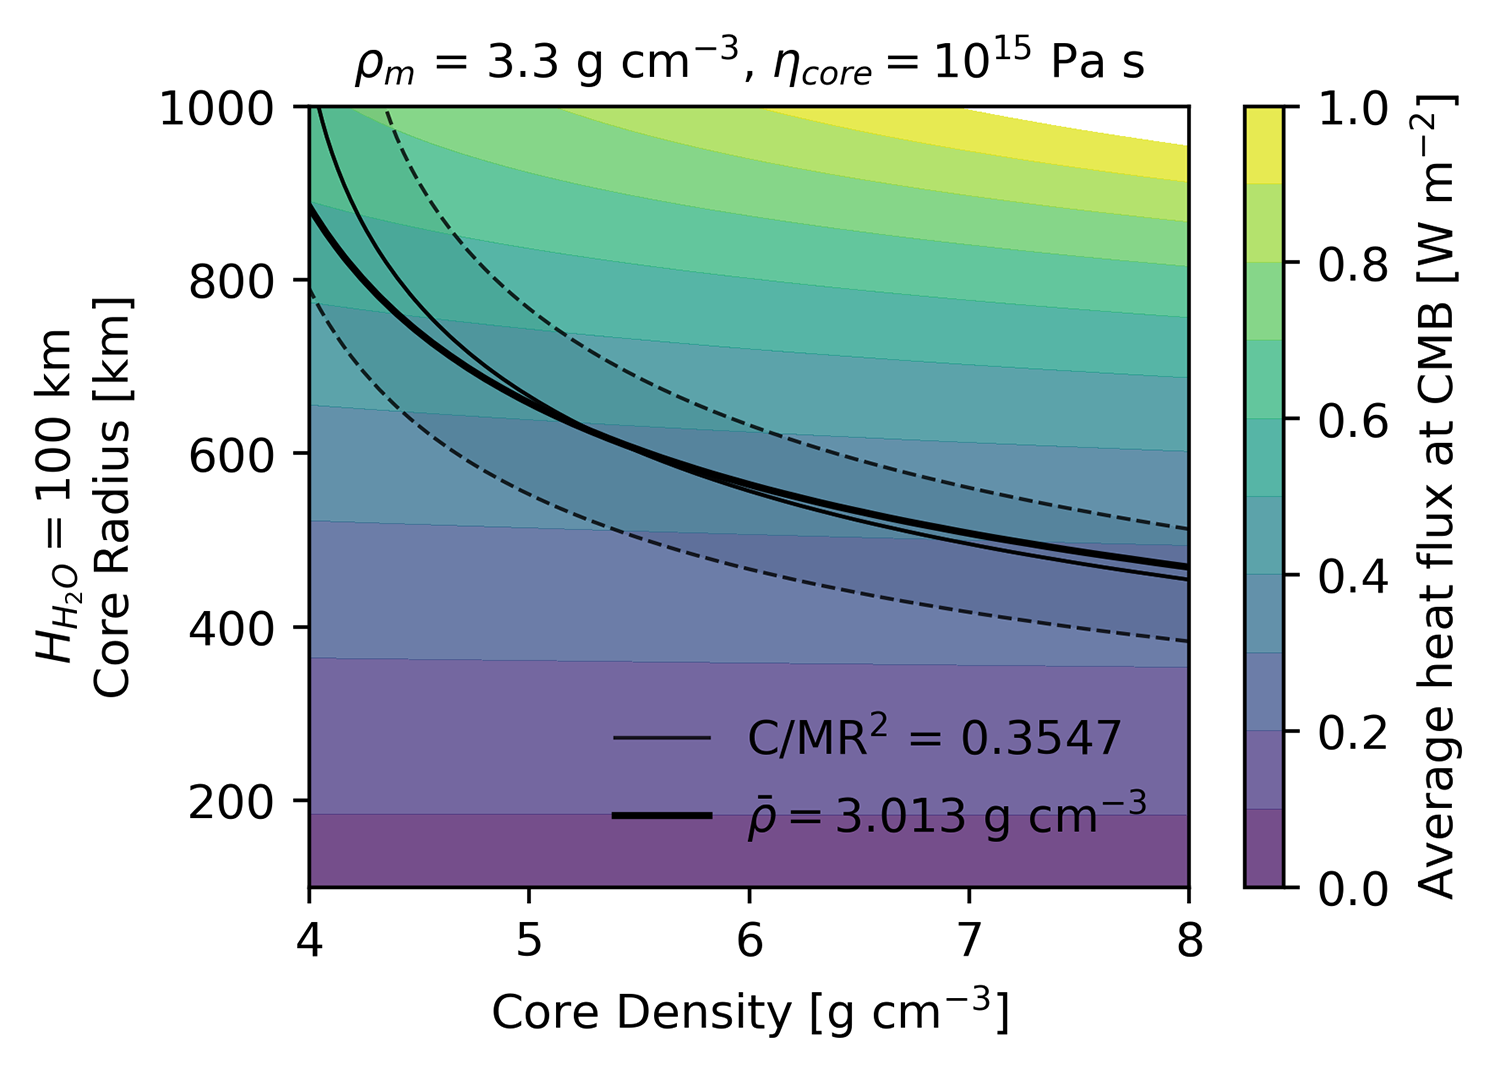
Figure 1: For an example Europa, Bulk density (thick) and Moment of Inertia (thin, dashed) constraints (Casajus et al., 2020). Colors show tidal heat flux at the CMB due to only core dissipation.
On Earth, there is a high plausibility that the solid inner core exhibits viscosities ranging from ~1013–1018 Pa s (Ritterbex and Tsuchiya, 2020), reflecting seismic (1013 Pa s), geodynamic (< 1016 Pa s; Buffett, 1997), and orbital constraints (~1013–1014 Pa s; Koot and Dumberry, 2011).
For the range of iron shear moduli applicable to the Galilean cores (~15–45 GPa; Birch, 1952), the viscosities that maximize dissipation are of the order ~1014–1016 Pa s. Newtonian creep likely dominates at the low pressures of the Galilean satellites cores (Van Orman, 2004), and pure iron viscosities (Birch, 1952) are in the range of 1010–1020 Pa s, depending on temperature and grain size (Figure 2).
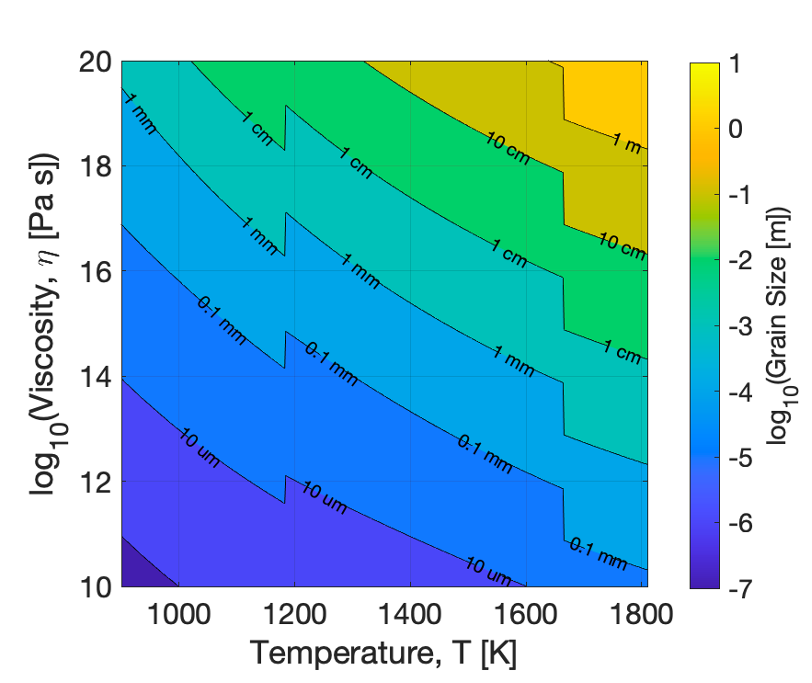
Figure 2: Pure iron rheology (Birch, 1952) as a function of temperature and grain size.
We estimate dissipated power from the tidal response of Io, Europa, and Ganymede using a Maxwell rheology (Figure 3). We find that core dissipation at Io and Europa can exceed that of their outer viscoelastic layers. At Ganymede, the heat flux contribution from the iron core is less than the radiogenic contribution. However, concentrated at the core-mantle boundary, the heat flux is likely sufficient to sustain continued or episodic melting of the metallic core.
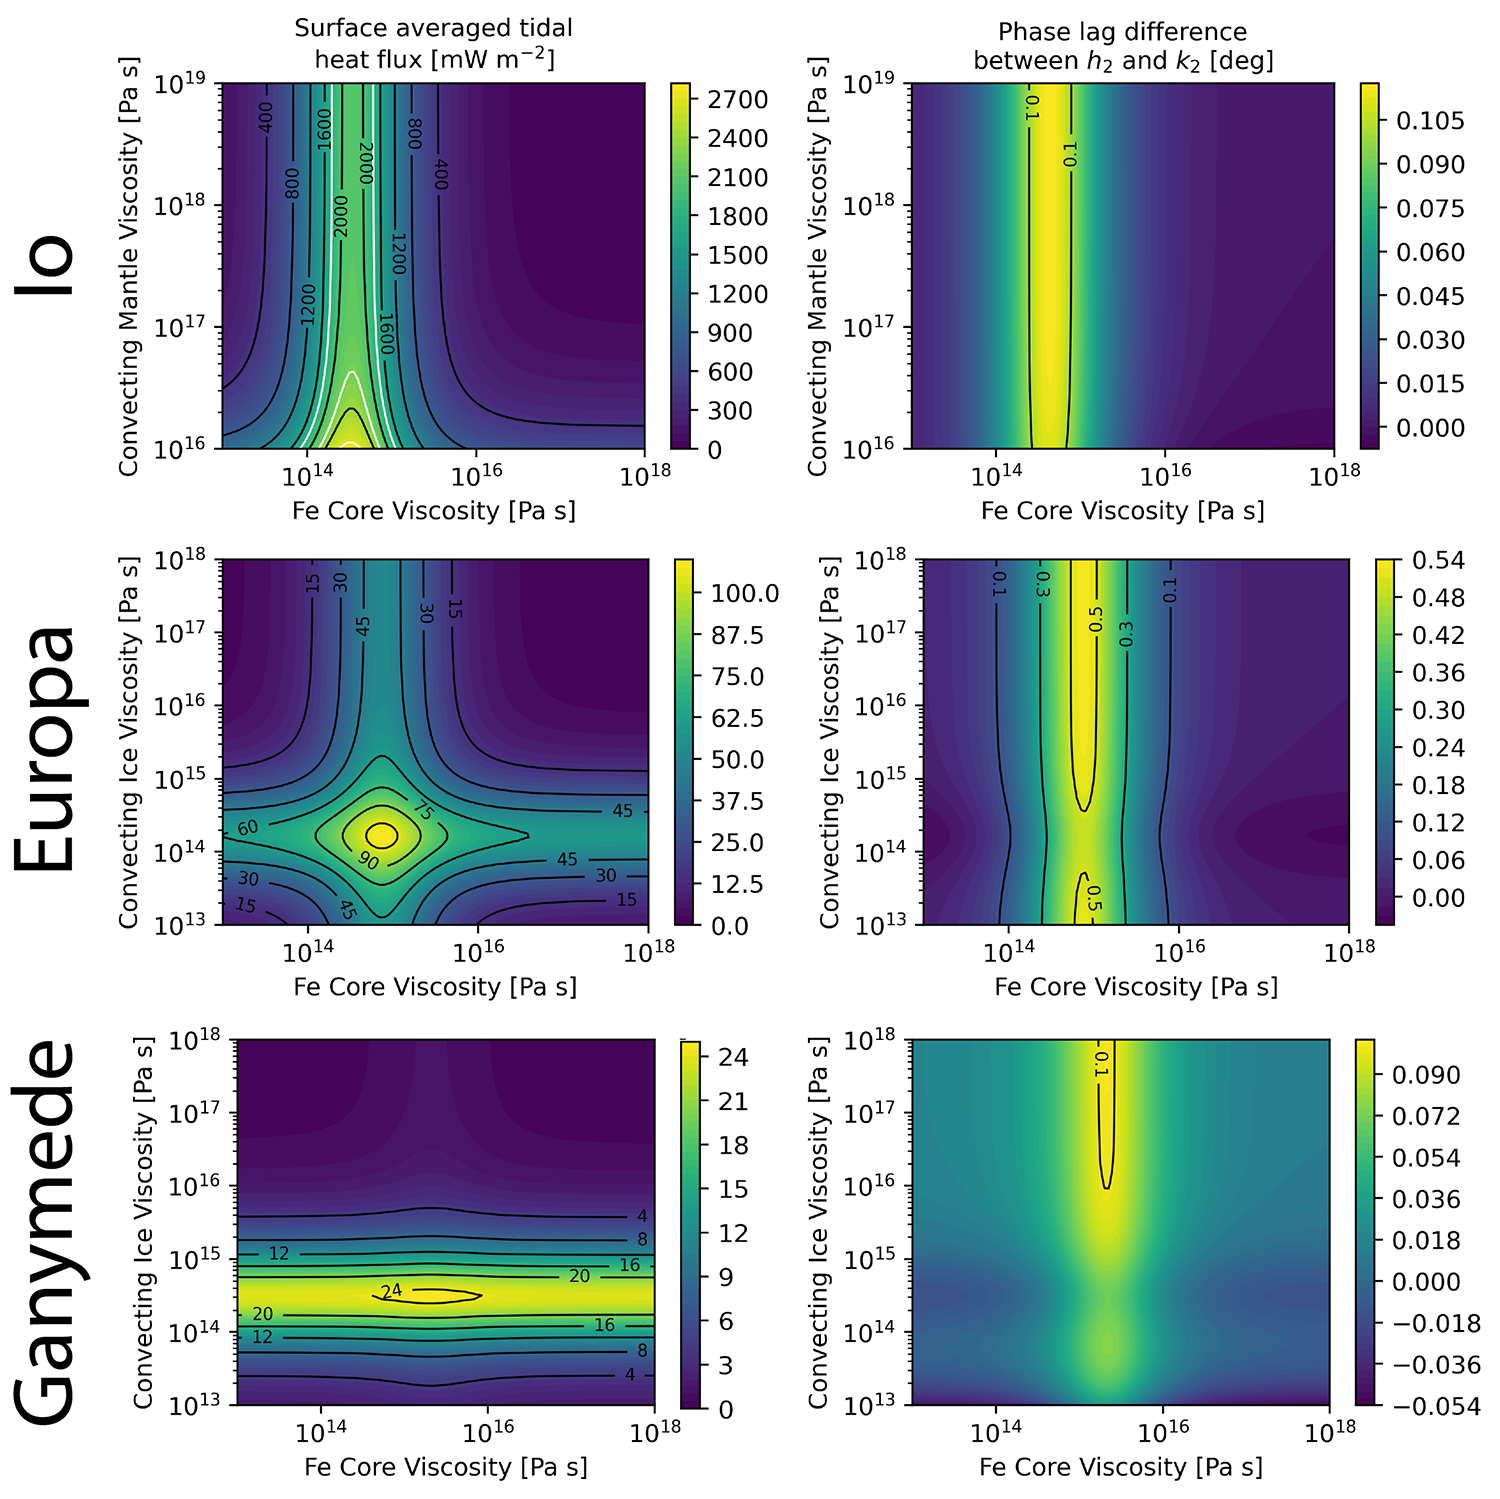
Figure 3: (Left) contours of surface-averaged tidal heat flux as a function of layer viscosity. For Io, white lines indicate constraints from observed dissipation (Lainey et al., 2009). (Right) Phase lag offset between h2 and k2.
ADDRESSING MYSTERIES / SEARCHING FOR ANSWERS
Io’s Magma Ocean: To match observed dissipation, Io’s average mantle viscosity should be ~1014–1013 Pa s (Segatz et al. 1988). However, these values are many orders of magnitude lower than the lowest inferred for Earth’s partially molten asthenosphere (~1019 Pa s; e.g. Dixon et al., 2004) and cannot support the mantle convection associated with high magma eruption temperatures (Moore et al., 2003). The presence of a pervasive “magma ocean” has been proposed to explain discrepancies (e.g. Khurana et al., 2011).
If Io experiences significant core heating, then a rock viscosity consistent with that of Earth’s mantle (1019 Pa s) and core viscosity of ~1015 Pa s can explain the observed heat flux without requiring a magma ocean or low-viscosity mantle (Figure 3).
Periodic Resurfacing and Dynamos at Europa and Ganymede: Europa’s young surface and Ganymede’s terrain dichotomy reflect episodic resurfacing. While dissipation within ice shell would allow rapid changes within those layers, heat conductively diffuses from the core slowly (~100–101 Gyr). Rapid transport may occur through solid-state mantle convection and/or rock melting and ascent from the CMB (Figure 4). Additionally, core melting causes the tidal response to decouple from the solid body (Henning and Hurford, 2014), decimating dissipation.
The timescales for core melting and freezing, the onset and cessation of thermal convection, and the onset and ascent of melting at depth may compete to create an episodicity in seafloor heat flux, and may modulate the response to episodic changes to the orbital configurations of the satellites. Changes in heat flux may drive resurfacing through induced changes in the ice shell thickness and geodynamic state (Nimmo, 2004), and rotational coupling to the interior.
Callisto’s lack of evidence for resurfacing and sustained (un-forced) orbital eccentricity may reflect the absence of a dissipative iron core, and inefficiency of icy dissipation within the satellite.
Observational Predictions: If core dissipation is meaningful today, it may be observable in the phase lag difference between k2and h2 (Figure 1). In the absence of a phase lag offset, we predict that the present-day core may be partially molten, decoupling it from the solid body and decreasing dissipation, potentially producing an intrinsic magnetic field. If an iron core is responsible for Io’s observed high heat flux, we expect the real part of k2 to reflect a solid body (~0.09) rather than a body with an internal fluid layer (~0.5) per Bierson and Nimmo (2016).
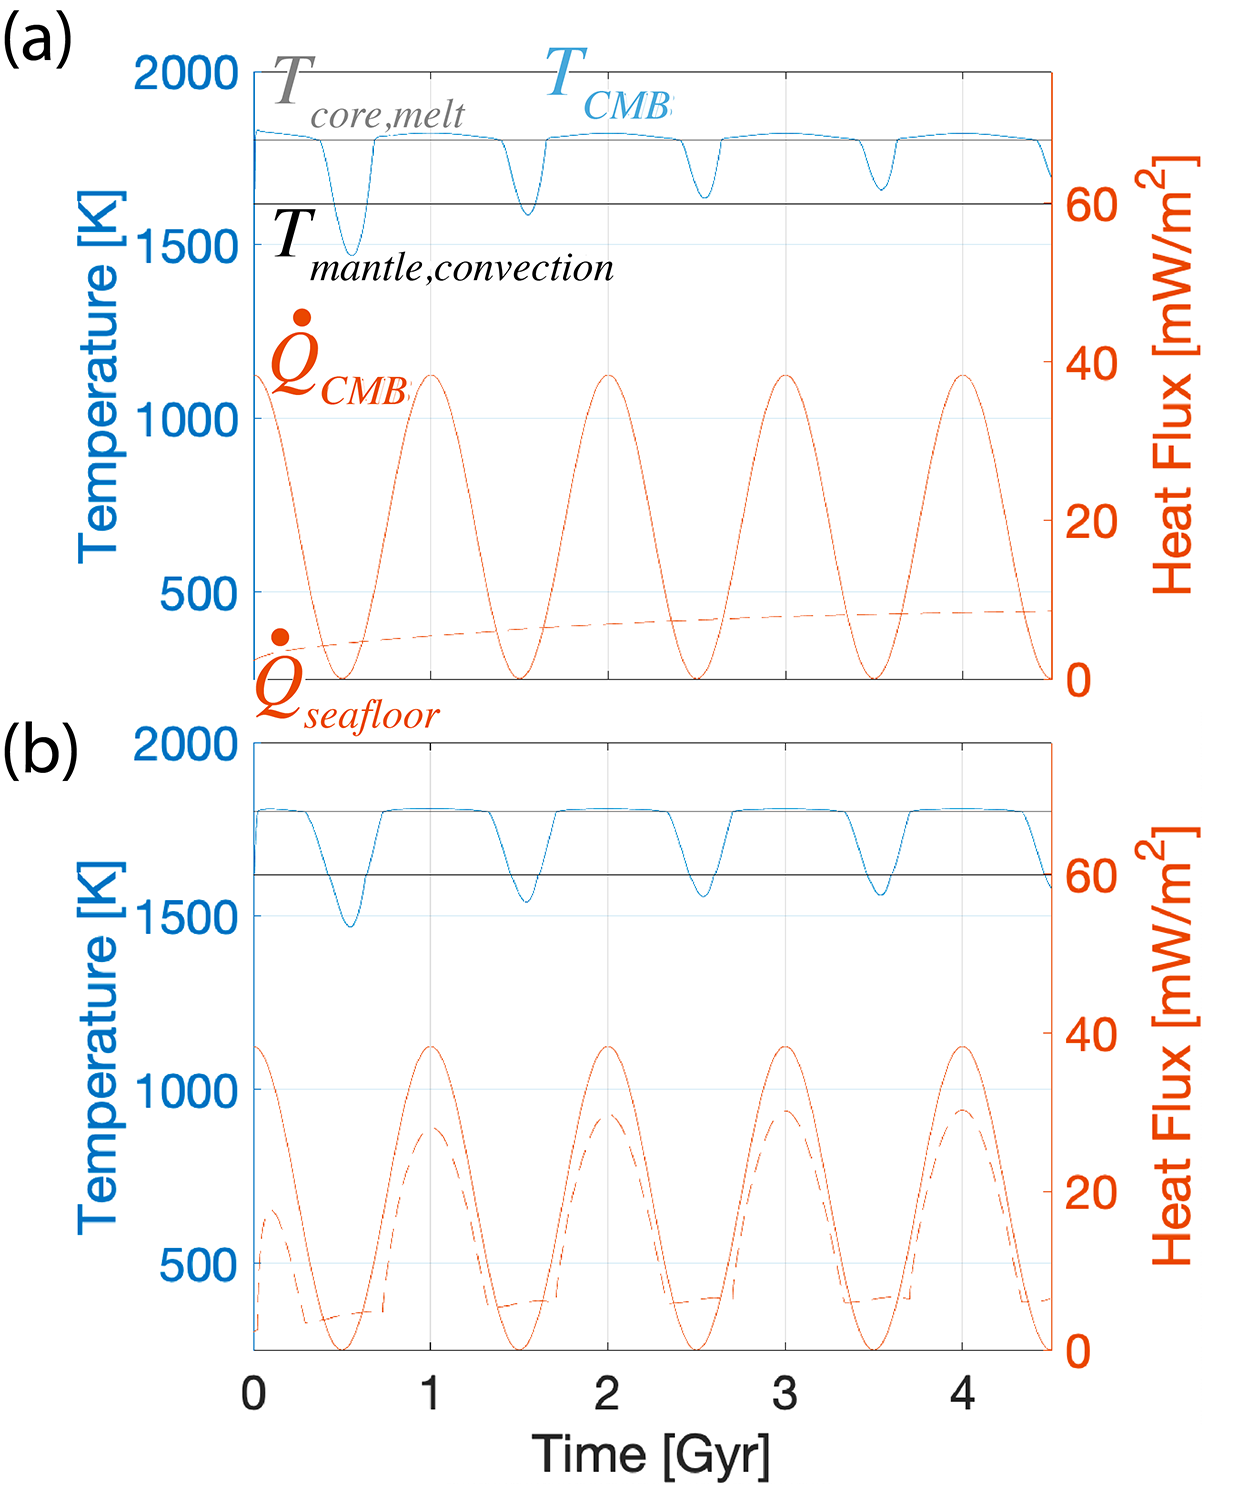
Figure 4: Europa’s (surface-averaged) seafloor heat flux (orange dashed line) responds to periodic changes in core dissipation (solid orange line). CMB temperatures (blue) vary from melting across the critical temperature for mantle convection. Heat transfer occurs through (a) diffusion, and (b) self-consistent melt migration and convection.
ACKNOWLEDGEMENTS
This work was performed at the Jet Propulsion Laboratory, California Institute of Technology, under contract with NASA, and supported through the NASA Habitable Worlds (80NM0018D0004), the Europa Clipper project, and the NASA Postdoctoral Program, administered by Oak Ridge Associated Universities under a contract with NASA (80HQTR21CA005).
How to cite: Howell, S., Vance, S., Bills, B., Melwani Daswani, M., Styczinski, M., and Hay, H.: Powering fire and ice with iron: Strong metallic core dissipation within the Galilean satellites, Europlanet Science Congress 2022, Granada, Spain, 18–23 Sep 2022, EPSC2022-729, https://doi.org/10.5194/epsc2022-729, 2022.
Introduction
Ocean Worlds, and their subsurface oceans, are prime targets in the search for exobiology. Access to these sub-ice oceans presents many engineering challenges. THOR (Thermal High-voltage Ocean-penetrator Research platform) is a prototype for a new class of Ocean World exploration vehicle which combines elements of an ice-penetrator (cryobot) and an ocean-profiler (sonde). This ice/ocean profiler (IOP) will carry a sampling subsystem and spatial, environmental, and life-detection sensors to characterize the ice and water column. Using the THOR platform and sensor suite, we are developing test strategies and behaviors for autonomous exploration and sampling as the vehicle descends through an ice column and into and through a subglacial lake. THOR is funded through the NASA PSTAR program (Grant 80NSSC18K1738).
THOR builds upon three breakthroughs in cryobot technology achieved in the NASA-funded VALKYRIE and SPINDLE projects: Onboard closed-cycle hot-water drilling (CCHWD); small-diameter high-voltage, high-power tether technology; and high voltage fluid-resistor water heating. These concepts were tested as sub-scale assemblies in the lab or in limited field tests. THOR scales up and integrates these approaches into a high-efficiency cryobot that is sized to incorporate the Kilopower fission reactor as its thermal power source. With hot water jets in the nose and tail, THOR can melt its way both downwards through ice as well as upwards through the refrozen ice behind it. The vehicle concept is the first to incorporate a Vertical Motion Control System (VMCS) that includes onboard servo spoolers to pay out or retrieve power, communications, and strength tethers as the vehicle descends or ascends. Our goal with THOR is to conduct the first cryobot descent into a terrestrial subglacial lake. Here we present the Phase I vehicle final design, key features of the operational core CCHWD system, and the recent results of lab testing of a simulated 700 m continuous descent in temperate glacier ice conditions and penetration tests through ice containing tephra deposits.
Vehicle Architecture
THOR is a flight-scale cryobot based on closed-cycle hot water drill technology. CCHWD has been demonstrated to achieve a melting metric (kWH/m3 of melted ice) of approximately twice that of passive thermal probes and can penetrate glacial debris in polar regions on Earth. THOR is sized to carry the NASA 40 kWth Kilopower reactor as the thermal and electrical power source for future sub-ice missions to Europa and other Ocean World targets. THOR Phase I work focused on the design and performance of the CCHWD melt head. Currently, the Kilopower reactor is not available for terrestrial cryobot testing, so we needed to emulate the Kilopower geometry and thermal output with a nuclear surrogate.
There are three key components to the THOR power transmission approach. To create a nuclear surrogate, surface power is currently provided by a diesel generator (50 kW single phase 240 AC; the system is designed to handle up to 100 kW). Power is then routed to an up-converter that raises the voltage to 10 kV AC. Finally, a small fraction of power is converted for use by the onboard pumps, computers, sensors, and valves. The full 10 kV is used directly in the thermal power conversion module, known as HOTSHOT. The estimated descent performance in temperate ice is approximately 10 m/hour at 50 kW input power.
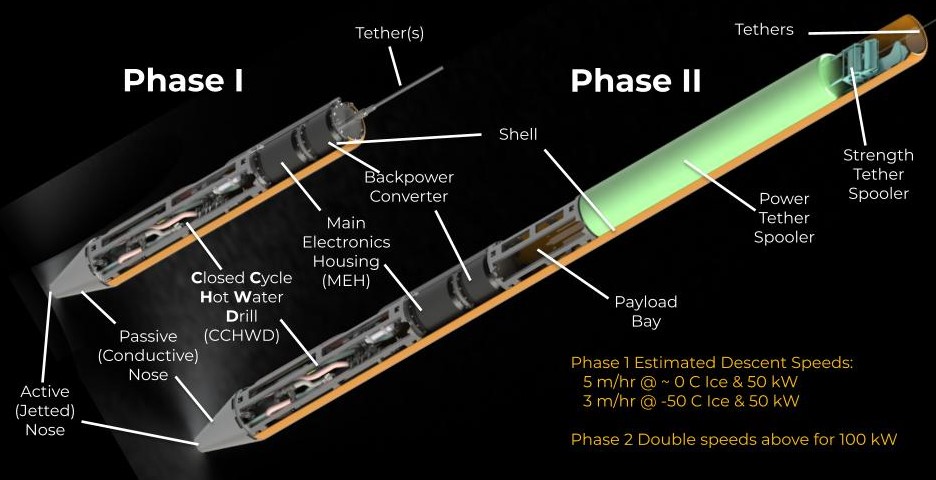
Figure 1. THOR Phase I and Phase II Vehicle Architecture
In general the cryobot descent speed will be inversely proportional to the square of the vehicle diameter and directly proportional to the ice temperature (which varies with depth) and the input power. On the basis of a kWH/m3 performance metric, THOR will compete with traditional terrestrial hot water drills in terms of speed. Its logistics footprint, however, is substantially smaller. Furthermore, bi-directional cryobots like THOR enable persistent subglacial science. Larger diameter cryobots can be used to transport, release, and retrieve science payloads as well as autonomous vehicles to subglacial aqueous environments.
HOTSHOT: Turning Lightning Bolts into Heat
The CCHWD system forms the core of the THOR technologies developed for Phase I. The goal of the system is to enable THOR to achieve high penetration rates by using high-pressure water jets to rapidly transfer heat into the ice from a novel direct high voltage heater system called HOTSHOT. The HOTSHOT technology is a critical enabler for terrestrial cryobot missions which are not able to use nuclear power sources. The HOTSHOT heater developed for THOR passes high-voltage (10 kV), low current, AC power through a moving conducting fluid. This creates resistive heating in the fluid with 100% efficiency without inducing electrolysis. Power densities as high as 600 kW/liter have been achieved with the HOTSHOT design. The overall system consists of two loops: a completely internal fully-closed process loop to allow for tight control of the fluid resistivity in HOTSHOT, and the environmental loop which heats the surrounding ice via jetting. The HOTSHOT concept has been extensively tested at Stone Aerospace and was used during the full power 72 hour burn test.
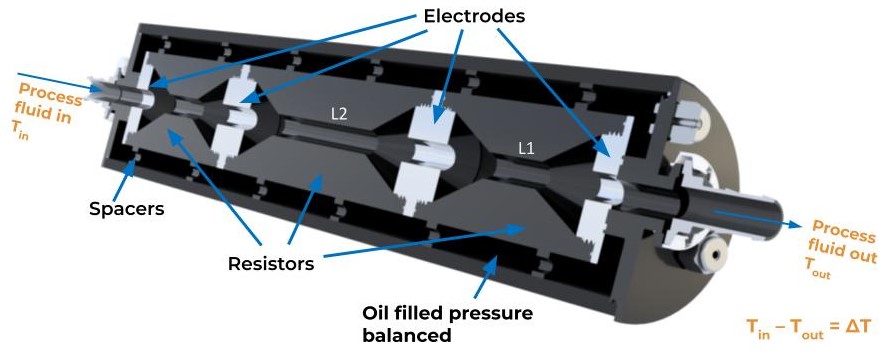
Figure 2. HOTSHOT, a novel direct high voltage heater system
Long Duration Testing: Simulating an Antarctic Mission
Due to the Covid-19 pandemic we were not able to perform field tests of THOR at the Matanuska Glacier (Alaska, USA) as we originally planned. Instead we tested the integrated THOR CCHWD melt head at full power in a simulated long duration mission. This Long Duration Test (LDT) simulated a 700 m ice penetrating mission by operating THOR in an insulated subzero (-0.5 C) water bath with a field-realistic power supply and high voltage (9.2 kV avg) delivery system. The vehicle achieved a peak thermal power of 45 kW and the HOTSHOT nuclear surrogate and sustained an average power of 37 kW over 72 hours of operation. The Closed Cycle Hot Water Drill (CCHWD) design delivered a 30 L/min flow from the nose jet at an average temperature 14C above the surrounding water. Optimizing the thermal distribution along the length of the cryobot is planned for Phase 2.
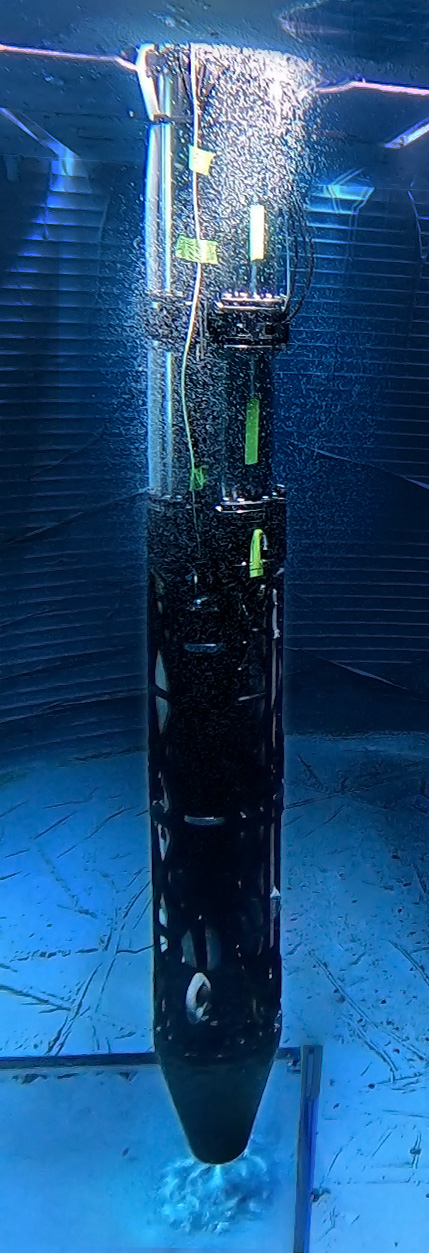
Figure 3. Underwater still image capture in the test tank during THOR jet firing
How to cite: Guerrero, V., Stone, W., Siegel, V., Hogan, B., Richmond, K., Harman, J., Myers, K., Lelievre, S., Flesher, C., Ralston, J., Tanner, N., Wright, N., Smith, J., Price, R., Moor, J., Alexander, M., and Lopez, A.: Project THOR: Test Results for a Full-Scale, Nuclear-Compatible Ocean World Ice Penetrator, Europlanet Science Congress 2022, Granada, Spain, 18–23 Sep 2022, EPSC2022-194, https://doi.org/10.5194/epsc2022-194, 2022.
Melting probe is an autonomous exploratory tool that uses heat, typically generated by a nuclear energy source, to penetrate through layers of ice. Working devices have been used in terrestrial conditions for some time, but the concept has a potential for space missions, especially those that aim to collect water samples from subsurface oceans on icy moons. This motivates computational study of the concept, one that could answer fundamental questions regarding time and power requirements of the melting probe mission.
In this talk, which presents results obtained in collaboration with Ondřej Souček, a multi-physics modelling approach will be introduced. The model couples a mechanical problem, governed by the Navier-Stokes equations with temperature dependent material properties, together with a thermal problem, in the form of a non-linear heat equation reformulated in enthalpy that is capable of capturing the phase-change phenomena. Though complex, the versatility of such model enables a study of the fully-convective regime of the melting probe. Preliminary results show that the coupled problem formulated in the axisymmetric two-dimensional approximation is (computationally) tractable and, at the same time, estimates the rate of ice penetration based on the external conditions, i.e., ice temperature and viscosity, gravitational acceleration, etc. The results form a foundation for possible kinematic models of ice sheet penetration that lead to estimates of mission time requirements.
So far, the problem was studied in the simple setting of a heated sphere with a fixed frame of reference (see Fig.1, Fig.2 for preliminary results of a test setting). The solution is approximated by the finite element method implemented within the FEniCS computational platform.
This stage, which serves as the model's proof of concept, permits straightforward generalizations (e.g., realistic cylindrical geometries, water jets boundary conditions, Arbitrary Lagrangian–Eulerian kinematic description). A brief discussion of the extensions will demonstrate the utility of the model.
Acknowledgement: The authors would like to express their gratitude toward Charles University Grant Agency, project GA UK n. 1062120 (J.M.) and Czech Science Foundation, project 22-20388S (O.S.).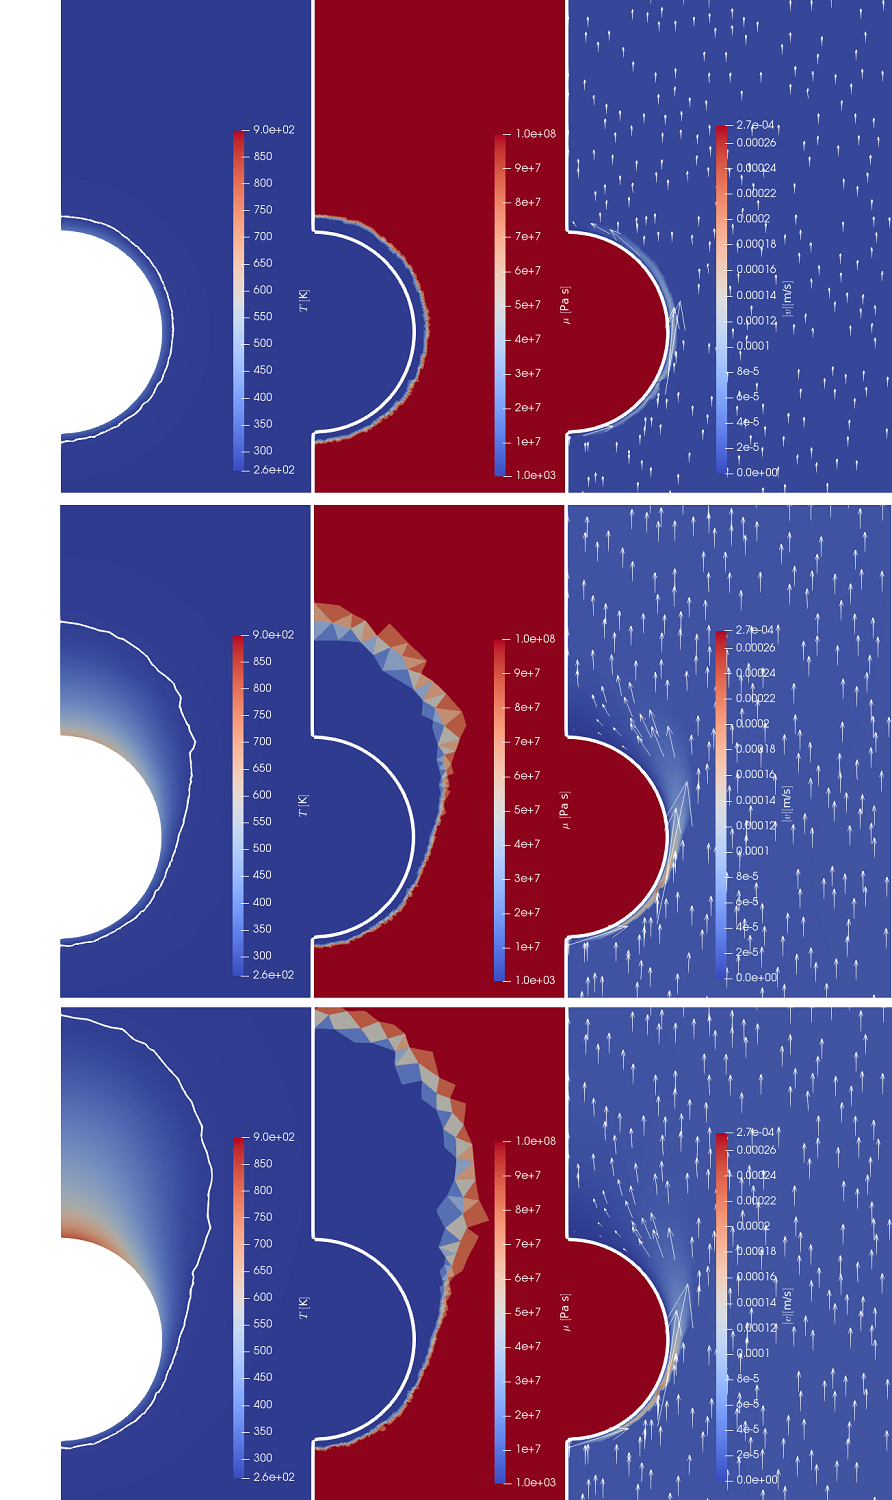
Figure 1. Preliminary results - three time stamps show the evolution of temperature (including melting temperature isotherm), dynamic viscosity, and velocity field around the heated sphere (test problem parameters setting).

Figure 2. Preliminary results - time evolution of probe descent velocity
How to cite: Malík, J. and Souček, O.: Melting probe - thermomechanical modeling of descent rate, Europlanet Science Congress 2022, Granada, Spain, 18–23 Sep 2022, EPSC2022-337, https://doi.org/10.5194/epsc2022-337, 2022.
Introduction: After orbiting and landing on an ocean world such as Europa or Enceladus, the next step will be to “rove”. However, rather than traveling along the surface, a cryobot probe would instead vertically traverse in order to reach the ocean and explore for signs of life. Many challenges exist for technologies to function within the harsh conditions at ocean worlds, including extreme temperatures, pressures, faulting, and the presence of potentially corrosive chemicals. Yet, these must be overcome. In order to return valuable science and engineering data, cryobot communication devices must be capable of transmitting data after deployment through ice shells of a few to 10s of km thick, and over mission lifetimes of several years.
A strategy for cryobot communication that employs both optical tethers coupled with radio frequency (RF) relays has been suggested as part an ocean world cryobot mission architecture (e.g. Oleson et al., 2019). Here we present work on a NASA Concepts for Ocean worlds Life Detection Technology (COLDTech) project called Signals Through the Ice (STI) Tech for Ocean Worlds (OW), that builds on previous NASA SESAME STI work, to develop communication hardware solutions (e.g. Craft et al., 2022).
Technology developments: Building on previous characterizations of optical tether robustness shear testing (Singh et al, 2022& in review; McCarthy et al., this meeting), RF relay antenna design (Lorenz et al, 2022), and modeling efforts to characterize Europa’s ice shell conditions (Walker et al., 2020), the OW STI Tech team is expanding efforts to consider conditions at Enceladus and other factors affecting cryobot communication technologies.
Optical Tethers. A main hazard for tethered communication is the potential faulting activity inducing strain on the tether and causing data transmission reduction, or even severance the tether. Numerical models have been performed to simulate fault slip resulting from tidal forcing at multiple time points during one Europa tidal cycle. Calculations at multiple time points allow consideration of motion throughout the orbital cycle and evaluates the accumulation of strain on a tether crossing a fault at a range of different strikes, angles, and depths (Lien et al., 2022 & in prep). Calculations have also been performed to constrain Europa's deformation induced by tidal forcing and how it affects the thermal equilibrium state of the ice shell (Walker and Rhoden, 2022). Improving our understanding of the temperature and heat profiles within ice shells provides important estimates of the specific temperature and pressure environments both tethered and RF technologies will encounter on their journey through an ice shell.
Also, a factor not yet constrained for ocean worlds is how a tether’s jacket material would potentially adhere to the ice. This ice-tether behavior would influence the resulting strain induced on the optical fibers during fault motion. Adhesion tests and design trades on candidate jacket and strength layer materials are in progress with a focus on making improvements for Europa and Enceladus temperatures, strain, and chemical conditions. Additionally, tethers are undergoing environmental chamber “soaks”, with tethers embedded in ice of different compositions for months. Material degradation and transmission performance is measured during and upon removal.
RF relays. An initial RF relay thermo-mechanical design is undergoing evaluation to assess if the essential elements that must be housed and thermally insulated in an Europa or Enceladus ice shell can be kept at the necessary operational conditions. Essential components include batteries, power/heating elements, electronics, and antennas. Prototypes are being built and will undergo thermal and mechanical environmental tests (including thermal balance and rapid & cyclic loading).
Summary: Development of optical tethers and RF relay devices for communication through ice on ocean worlds is underway by the OW STI Tech team. Through modeling of the extreme conditions at Europa and Enceladus, design and build of prototypes, and thermo-mechanical testing, these technologies will be robust to the environmental conditions and will therefore enable the search for extraterrestrial life in the subsurface of ocean worlds.
Acknowledgments: We would like to acknowledge funding from grants 80NSSC19K0613 and 80NSSC21K0995 for this work.
References:
Craft et al. (2022) 53rd LPSC, Abstract #2753.
Lien et al. (2022) AbSciCon, Abstract #518-05.
Lorenz et al. (2022) NETS, May, 2022, Cleveland.
Oleson et al. (2019) Europa Tunnelbot, NASA/TP—2019-220054.
Singh et al. (2022) AbSciCon, Abstract #518-02.
Walker and Rhoden (2022), PSJ, accepted.
Walker et al. (2020) 51st LPSC, Abstract #2448.
How to cite: Craft, K., Asenath-Smith, E., Coker, R., German, C., Jakuba, M., Lien, R., Lorenz, R., McCarthy, C., Patterson, G. W., Rhoden, A., Sequeira, H., Silvia, M., Singh, V., Stilwell, R., and Walker, M.: Enabling Subsurface Exploration of Ocean Worlds: Technology Developments for Sending Signals Through the Ice (STI), Europlanet Science Congress 2022, Granada, Spain, 18–23 Sep 2022, EPSC2022-760, https://doi.org/10.5194/epsc2022-760, 2022.
Introduction: A successful mission to the ocean of an icy ocean world will require penetrating the ice shell with instrumentation robust to thermal and mechanical conditions that are significantly variable, down to depths of kilometers to 10s of km, while maintaining communication with the surface. A robust communication strategy and hardware that can provide data transmission rates adequate to achieve science and exploration objectives are critical for any future mission to access an ocean world’s subsurface. Here, we explore the potential of RF communications to provide that capability
Background: The propagation of radio waves through ice is strongly dependent on both the wavelength chosen and the temperature, composition (including the nature and concentrations of any salts/other impurities), and texture of the ice. This has been the subject of extensive evaluation via interest in radar sounding of ice sheets on Earth and other planetary bodies [e.g. 1-4]. Early proposals for through-ice communication on Europa [e.g., 5,6] have advocated the use of RF relay modules and a recent NASA Compass concept study [7] discussed the use of tethers with coupled radio frequency (RF) repeater ‘pucks’. However, with the exception of analysis like that done by [6], work to determine if/how an RF communication system would operate reliably in an extreme environment like that expected at Europa or Enceladus has been lacking.
We recently evaluated potential antenna designs and performance for a through-ice RF communication system in a modeled Europa-like environment and chose a dual resonant loop antenna design with a circumference-to-wavelength ratio between 0.8 and 1 [8]. Considerations for choosing an antenna and operating wavelength included: maximizing gain in the vertical direction; balancing choice of operating frequency against background noise sources (galactic and planetary) and acceptable attenuation in ice (across expected temperature range, composition, and texture); and providing sufficient bandwidth to channelize communication by frequency while yielding sufficient data rate. In addition, available volume for housing and deploying RF relay modules at Europa, based on current cryobot concept studies [5,7], was used as a constraint.
Current Work: We are currently evaluating an RF module design (i.e., antenna, electronics, power source, etc.) that can function in a Europa- or Enceladus-like ice shell environment, for the anticipated lifetime of a cryobot mission. Previous RF relay module designs for cryobot architectures [5-7] have been conceptual in nature and have not adequately addressed fundamental thermo-mechanical constraints on RF module operation in an ocean world ice-shell. Primary among these are the need to operate for long durations at temperatures that range from < 80K to > 200K, under large hydrostatic pressures, and in the presence of periodic (tidal) or instantaneous (fracturing) forcing. We intend to model, build, and test a RF relay module notional design (Figure 1) to characterize its thermal and mechanical performance, under Europa- and Enceladus-like conditions. The notional design is cylindrical to maximize available volume in a cryobot and to help ensure a stable up-down antenna orientation when the module is deployed. Within the cylinder is a central core consisting of batteries, power/heating elements, electronics, and antennas. This is surrounded by insulating foam and encased in a ‘roll-cage’ outer structure.
Modeling of the relay module notional design is underway and is using relevant thermo-mechanical characteristics of currently available, high-TRL components. Analysis of that modeling effort will be used to inform the manufacture of 2 RF module mock-ups for testing. The modules used in testing will be manufactured with space-qualified RF-transparent materials and adhesives and will utilize ‘flight-like’ assembly seams/joint construction techniques. One or two styles of access panel and a representative attachment area to the cryobot will also be included. Structural components of the module and the thermal insulating material will be manufactured as intended for a ‘flight-like’ build. All other internal components (e.g. power, antennas, electronics, etc.) will be represented in the manufactured modules with mock-ups that simulate their placement and thermo-mechanical characteristics within the module (e.g., mass, strength, thermal dissipation, conductivity). This choice was made to reduce the cost, complexity, and time required for the manufacturing process and because active internal components are not required to address the thermal and mechanical performance characteristics that are being tested.

Figure 1. Notional design for a RF relay module concept that incorporates previous antenna design work [8] and considers thermal and mechanical needs for function in an ocean world ice shell.
References: [1] Martinez et al., 2009, In International conference on GeoSensor Networks, pp. 131-137, Springer, Berlin, Heidelberg; [2] Blankenship et al., 2009, in Europa, pp. 631–654, Univ. of Ariz. Press, Tucson, Ariz; [3] Miller et al., 2012, Icarus, 220, 877-888; [4] Kasoulová et al., 2017 Journal of Geophysical Research: Planets, 122(3), 524-545 [5] Zimmerman et al., 2001; [6] Bryant, 2002, In Proceedings, IEEE Aerospace Conference (Vol. 1, pp. 1-356); [7] Oleson et al., 2019, NASA/TP—2019-220054.; [8] Lorenz et al., 2022, in prep.
How to cite: Patterson, W., Craft, K., Lorenz, R., Sequeira, H., Coker, R., and Stilwell, R.: An RF Concept for Communicating with a Subsurface Cryobot on an Ocean World, Europlanet Science Congress 2022, Granada, Spain, 18–23 Sep 2022, EPSC2022-1010, https://doi.org/10.5194/epsc2022-1010, 2022.
Please decide on your access
Please use the buttons below to download the presentation materials or to visit the external website where the presentation is linked. Regarding the external link, please note that Copernicus Meetings cannot accept any liability for the content and the website you will visit.
Forward to presentation link
You are going to open an external link to the presentation as indicated by the authors. Copernicus Meetings cannot accept any liability for the content and the website you will visit.
We are sorry, but presentations are only available for users who registered for the conference. Thank you.
Posters: Mon, 19 Sep, 18:45–20:15 | Poster area Level 1
Ganymede is an emblematic moon: the largest in the solar system, it possesses an intrinsic magnetic field [1] and likely harbors an internal ocean. As such, it is the main planetary object that underlies the ESA JUICE mission, to be launched in 2023. Models of Ganymede’s internal structure have been developed and revived prior to the mission in order to propose plausible end-members that JUICE may discriminate. These include focus on the possibly exotic dynamo[2–4], the interaction of its thermal history with its orbital evolution involving a Laplace-like resonance [5], an allegedly complex sandwiched structure for the hydrosphere [6] or the specific heat and mass transfer that may occur within a thick “mantle” of warm high-pressure ice polymorphs [7–9].
In this context, a possibly overlooked portion of the interior is the crust, i.e. the layer that forms as the result of silicate mantle melting. Crustal rocks have a distinct composition as, upon melting, specific minerals enter the liquid phase preferentially. While the liquid phase is generally buoyant, the density of volcanic rocks that solidify from such melts depends on pressure (and temperature) [10] with potentially major consequences on interior dynamics: for example, the negative buoyancy of basaltic rocks relative to the ambiant mantle above a given pressure is proposed as the main contributor to the formation of Earth’s continental crust whose thickness is remarkably uniform (≃ 40 km) besides tectonically active regions[11]. Using numerical models for mantle convection, we assess the melting potential of Ganymede’s rock mantle. Magma emplacement occurs either directly at the base of Ganymede”s hydrosphere or, deeper, as intrusions beneath a crust that already formed. We investigate the stability of the crust in light of expected density variations: the downward mass transfer associated to foundering of mafic cumulates potentially enhances chemical exchanges between the rock layer and the hydrosphere.
References
1. Kivelson, M., Khurana, K. & Volwerk, M. The permanent and inductive magnetic moments of Ganymede. Icarus 157 (2002). 2. Bland, M. T., Showman, A. P. & Tobie, G. The production of Ganymede’s magnetic field. Icarus 198 (2008). 3. Kimura, J., Nakagawa, T. & Kurita, K. Size and compositional constraints of Ganymede’s metallic core for driving an active dynamo. Icarus 202 (2009). 4. Ru ̈ckriemen, T., Breuer, D. & Spohn, T. Top-down freezing in a Fe-FeS core and Ganymede’s present-day magnetic field. Icarus 307 (2018). 5. Bland, M. T., Showman, A. P. & Tobie, G. The orbital–thermal evolution and global expansion of Ganymede. Icarus 200 (2009). 6. Vance, S., Bouffard, M., Choukroun, M. & Sotin, C. Ganymede’s internal structure including thermodynamics of magnesium sulfate oceans in contact with ice. Plan. Space Sci. 96 (2014). 7. Choblet, G., Tobie, G., Sotin, C., Kalousova, K. & Grasset, O. Heat and melt transport in the high-pressure icy mantle of large icy moons. Icarus 285 (2017). 8. Kalousov ́a, K., Sotin, C., Choblet, G., Tobie, G. & Grasset, O. Two-phase convection in Ganymede’s high-pressure ice layer-implications for its geological evolution. Icarus 299 (2018). 9. Kalousov ́a, K. & Sotin, C. Melting in High-Pressure Ice Layers of Large Ocean Worlds: Implications for Volatiles Transport. Geophys. Res. Lett. 45 (2018). 10. Jull, M. & Kelemen, P. On the conditions for lower crustal convective instability. J. Geophys. Res. 106 (2001). 11. Jaupart, C., Mareschal, J.-C. & Roman, A. The Formation of Continental Crust from a Physics Perspective. Geochem. Int. 56 (2018).
How to cite: Choblet, G., Récalde, N., Kervazo, M., and Bezos, A.: An unusual fate for Ganymede’s silicate crust?, Europlanet Science Congress 2022, Granada, Spain, 18–23 Sep 2022, EPSC2022-884, https://doi.org/10.5194/epsc2022-884, 2022.
The JUpiter ICy moons Explorer (JUICE), the first large-class of the European Space Agency (ESA), is planned to launch in 2023, and one of its main goals is to make detailed observations of Jupiter’s moon Ganymede. The mission will investigate the past and/or recent cryovolcanic and tectonic activity of the moon and the exchange processes with the subsurface and possibly with the ocean. Recently, the science team defined “potential cryovolcanic regions” as a category of high interest for observation by JUICE (Stephan et al., 2021). For preparation of the scientific return of the mission, it is important to study in detail the regions that are considered to be good candidates for past/present activity. Light material areas on Ganymede imaged by Voyager have been suggested to represent dark terrain resurfaced by cryovolcanic flows (e.g., Parmentier et al., 1982), while the dark terrain’s speculated cryovolcanic origin was later disputed based on higher-resolution images of the Galileo mission. Additional Galileo data showed the significant role of tectonism in the formation of the light material areas, while the role of cryovolcanism remained inconclusive. Currently, small, isolated depressions called ‘paterae’, are the best candidate regions for cryovolcanic activity on Ganymede and suggested to be potential caldera-like cryovolcanic source vents (e.g., Spaun et al., 2001). Their nature has been interpreted as “possible cryovolcanic source vents for extrusion of clean icy material to form light material units” (Collins et al., 2013), and their small size is consistent with a cryovolcanic origin that operates on a local scale. The high-resolution JUICE camera, JANUS, in combination with other remote sensing instruments, is expected to resolve many of the mysteries concerning cryovolcanism on Ganymede and the origin of the moon’s varied geologic features. The “potential cryovolcanic regions” identified by the JUICE team includes 19 out of 30 paterae mapped by Collins et al., (2013) using Voyager and Galileo images. In this study, with the aim to enhance the preparation of the JUICE mission and its science return, we present: a thorough view of all 19 paterae regions; a detailed geomorphological characterization and comparison between the Ganymede paterae with paterae from other planetary bodies; and a spectral assessment using Galileo NIMS data.
How to cite: Solomonidou, A., Malaska, M., Stephan, K., Soderlund, K., Valenti, M., Lucchetti, A., Kalousova, K., and Lopes, R.: Ganymede paterae: a priority target for JUICE, Europlanet Science Congress 2022, Granada, Spain, 18–23 Sep 2022, EPSC2022-423, https://doi.org/10.5194/epsc2022-423, 2022.
Galileo Regio is a dark terrain of Ganymede extending approximately from 180°-120° W to 0°-60° N that shows high crater density and morphotectonic structures called furrows. Such structures are kilometric-scale brittle troughs bounded by high albedo rims and a low albedo floor, and arranged with circumferential and radial setting at the regional scale [1]. Furrows are generally interpreted as the remnants of a multi-ring impact basin similar to the Valhalla basin on Callisto [2]. Galileo Regio shows two main settings of the furrows, which allow their classification into two systems: the concentric furrows of Lakhmu Fossae system, which is crosscut by the radial furrows of the Zu Fossae system [3]. In addition, Galileo Regio shows local-scale structures that rework the pristine morphology of the Lakhmu Fossae furrows.
In this contribution, we investigate the furrows of Galileo Regio at both regional- and local-scale to unravel the tectonic evolution of the dark terrain. We perform a structural mapping and geostatistical analyses of the furrows in Galileo Regio, identifying their hierarchy and tectonic setting originated by regional-scale kinematics. Structure attributes such as structure length, sinuosity, azimuth, spacing within the adjacent structures, have been quantitatively characterized and allow to perform the azimuthal distribution, the Length/Spacing [5] and the paleo-stress analyses [6]. Such analyses allow to identify the structural systems and to infer the past stress fields that affected Galileo Regio (maximum and minimum horizontal stress, i.e., SHmax and Shmin, respectively). A total of four structural systems have been recognized within Galileo Regio: i) the already known Lakhmu and Zu Fossae; and ii) the Lineated system and Precursor system, proposed by this work for the first time (Fig. 1).
Such systems are the result of phases of the tectonic activity that affected Galileo Regio during the geologic history of Ganymede. We identify the sequence of such phases that allow to produce an evolutionary tectonic model (Fig. 2): i) t0 represents a NW-SE extension that formed the Lineated system; ii) t1 represents the impact that originated a multi-ring basin [3, 7], i.e., the Lakhmu Fossae; iii) t2 shows the extensional activity responsible for the formation of the light terrain of Uruk Sulcus [8] and for the formation of the extensional structures of the Precursor system; iv) t3 represents the kinematics consistent with the right-lateral transpression that has affected Uruk Sulcus [4] and formed the Zu Fossae; and v) t4 presents a right-lateral strike-slip that contributes to the formation of the Precursor system.
The obtained results and the presented model will be used for the scientific preparation of dedicated high-resolution observations that will be taken with the JANUS instrument [9] onboard the JUICE mission [10].
Acknowledgments: The activity has been realized under the ASI-INAF contract 2018-25-HH.0.
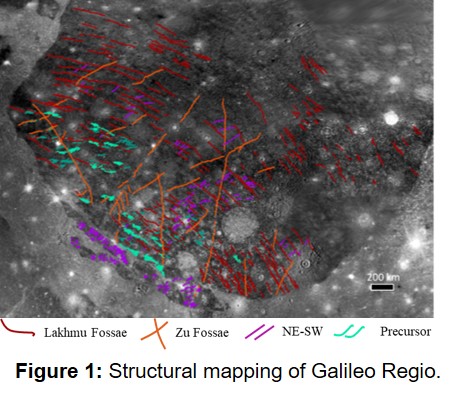
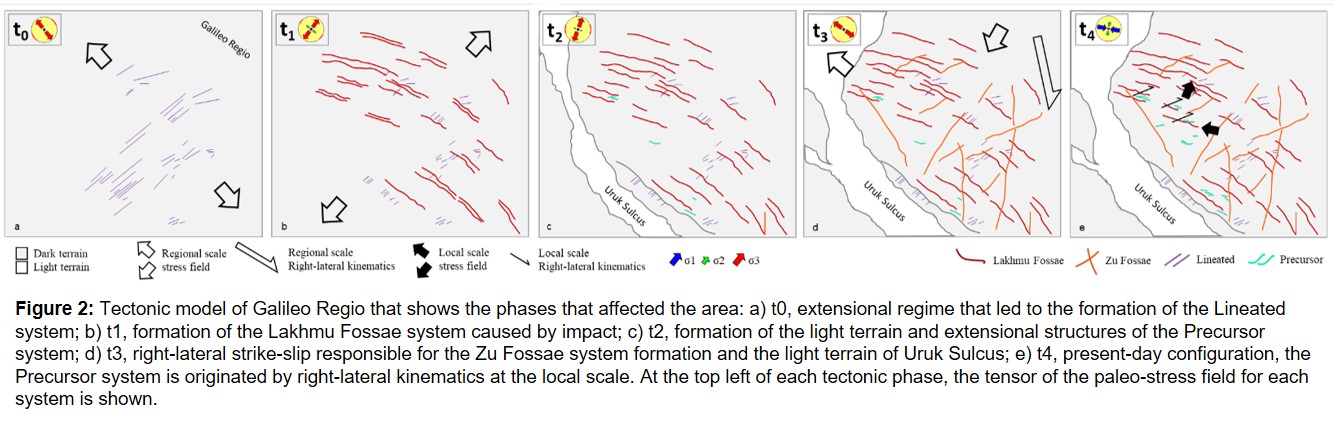
References:
[1] Patterson, W. et al. (2010). Icarus 207,845–867; [2] McKinnon, W.B. and Melosh, H.J. (1980). Icarus 44 (2), 454–471; [3] Prockter, L.M., et al. (2000). Journal of Geophysical Research: Planets, 105(E9), 22519-22540; [4] Kersten, E., et al. (2021). Planetary and Space Science, 206, 105310; [5] Rossi, C., et al. (2018). Tectonophysics 749, 72–87; [5] Delvaux, D., and Sperner, B. (2003). Geol. Soc., London, Special Publications, 212(1), 75-100; [7] Hirata, N., et al. (2020). Icarus, 352, 113941; [8] Pappalardo, R.T., et al. (1998). Icarus, 135(1), 276-302; [9] Palumbo, P., et al. (2014). 45th LPSC Meeting. Abstract #2094; [10] Grasset, O., et al. (2013). Planetary and Space Science, 78, 1–21.
How to cite: Rossi, C., Lucchetti, A., Massironi, M., Pozzobon, R., Penasa, L., Munaretto, G., and Pajola, M.: Structural evolution of Galileo Regio, dark terrain of Ganymede., Europlanet Science Congress 2022, Granada, Spain, 18–23 Sep 2022, EPSC2022-815, https://doi.org/10.5194/epsc2022-815, 2022.
Introduction
The formation of Ganymede’s light terrain and its possible interaction with a subsurface ocean, have made its investigation one of the top goals of the upcoming JUICE mission [1, 2]. In this study we present a detailed stratigraphic analysis of areas that were observed by the Galileo SSI camera at highest possible spatial resolution (scales of ~11 m/pxl) in order to see what information of the light terrain’s stratigraphic position in Ganymede’s surface evolution can be gained from mapping and crater counting results and to identify what still has to be done in order to prepare for the upcoming JUICE mission.
Study areas
Based on the available data set, we selected four major regions (Region A, B, C and D) that are covered by more than one high-resolution SSI image for our study (Fig. 1): Region A and D from the anti-Jovian hemisphere and Region B and C from sub-Jovian hemisphere. Region A comprises of Byblus Sulcus (G2GSGRVLNS01), Nippur and Philus Sulcus (G2GSNIPPUR01) and the Transitional region (G2GSTRANST01) with the context info provided by the SSI observation G8GSREGCON01. Region B is dominated by Arbela Sulcus (28GSARBELA01+02/ G7GSNICHOL01), Region C is the Harpagia Sulcus region (28GSBRTDRK02, 28GSCALDRA02 and 28GSSMOOTH02) and Region D comprises Erech Sulcus (G8GSERECH01), Mummu and Sippar Sulci (G8GSCALDRA01).
Mapping results
Geologic maps are prepared for the four regions using ArcGIS. The naming/categorization of geological units follows from [4, 5] but are refined and modified wherever necessary (Fig. 2). Among the light terrain units, ls and lg are the most commonly occurring than li.
Stratigraphic correlation:
On the whole, the relative ages from crater density measurements (Fig. 5) follow the mapping results. In brief, in Byblus Sulcus the two light terrain units are of similar age from crater counts while lg3 is younger than lg2 from crosscutting relationships. (Fig. 2). In case of Region B (Arbela Sulcus), we could find that the age relationship of the two light terrain units and two dark terrain units agree with the relative age inferred from crosscutting relationship (Fig. 3a) In more extensively resurfaced areas of the light terrain the situation appears to be more complex. In Region C, the terrain units ls also have comparatively higher age than lg terrain units (Fig. 3b-3d). In Region D the terrain units (Fig. 4) are highly interrupted by the secondary craters formed during the Osiris and Melkart impact events [6].
Discussion
We used two most favored chronology models LDM (Lunar Derived Model by [7]) and JCM (Jupiter Comets Model by [8]) (Fig.6). In general, based on the LDM ages the crater densities point to a relatively high age of the light terrain units not much younger that the ancient dark terrain and could imply a relatively short time period of formation for most of our mapped light terrain units. This relatively high age fits into the theory that the light terrain could have formed as a direct result of internal differentiation followed by a global expansion [9]. On the contrary, the JCM derived ages point to a longer formation period of light terrain units around 2 Ga [9]. While the impact chronology in the Jovian system and of its satellites is still not fully solved, newest results infer that the craters on these bodies were created from members of a collisionally evolved impactor family, similar to those in the inner solar system [10]. This does not straightforwardly support the lunar-derived chronology model (LDM) by [7] but allows to derive a Ganymede-specific crater production function empirically from the lunar one. We used this production function to fit our crater distributions and to derive absolute model ages for both model chronologies [7][8].
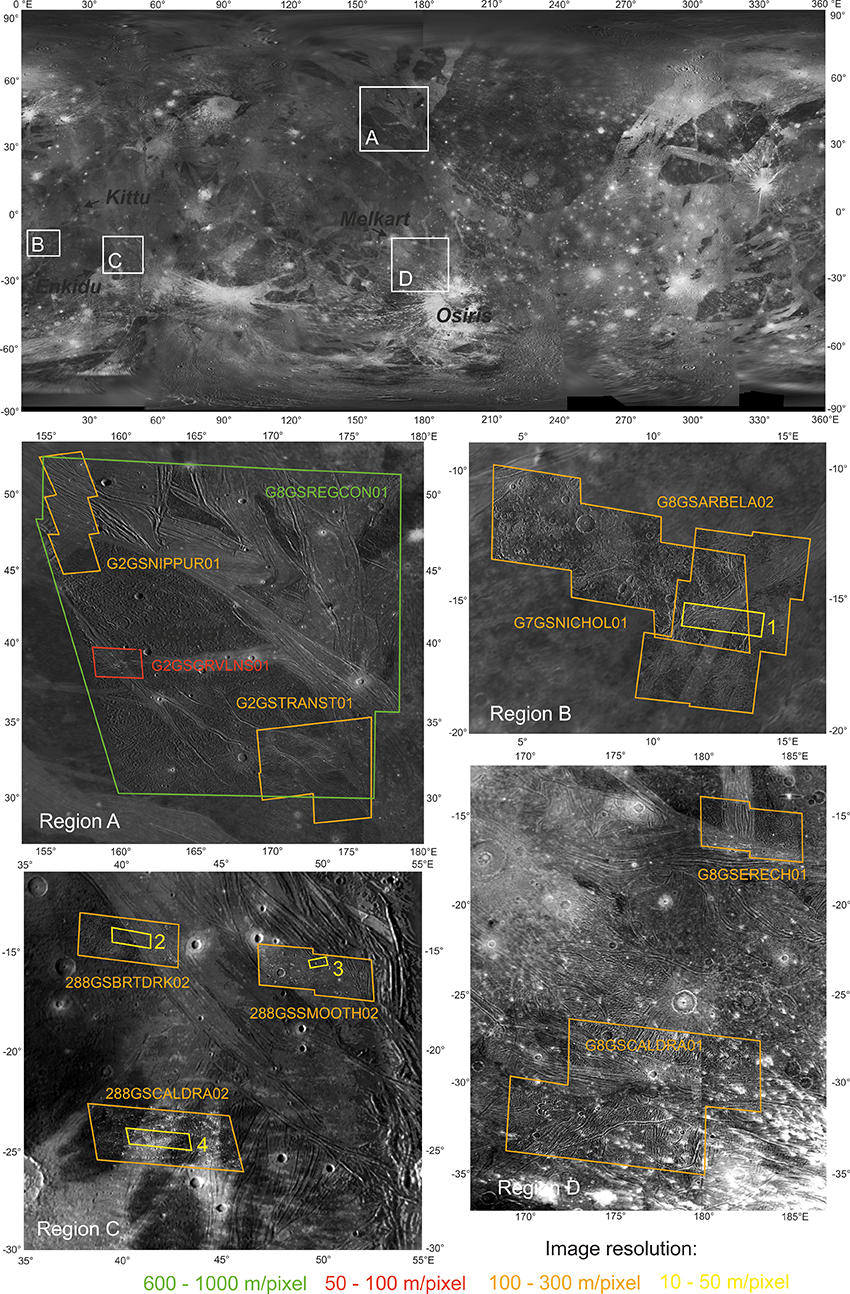
Figure 1: Regions of Interest in this study with the available Galileo SSI coverage indicated.
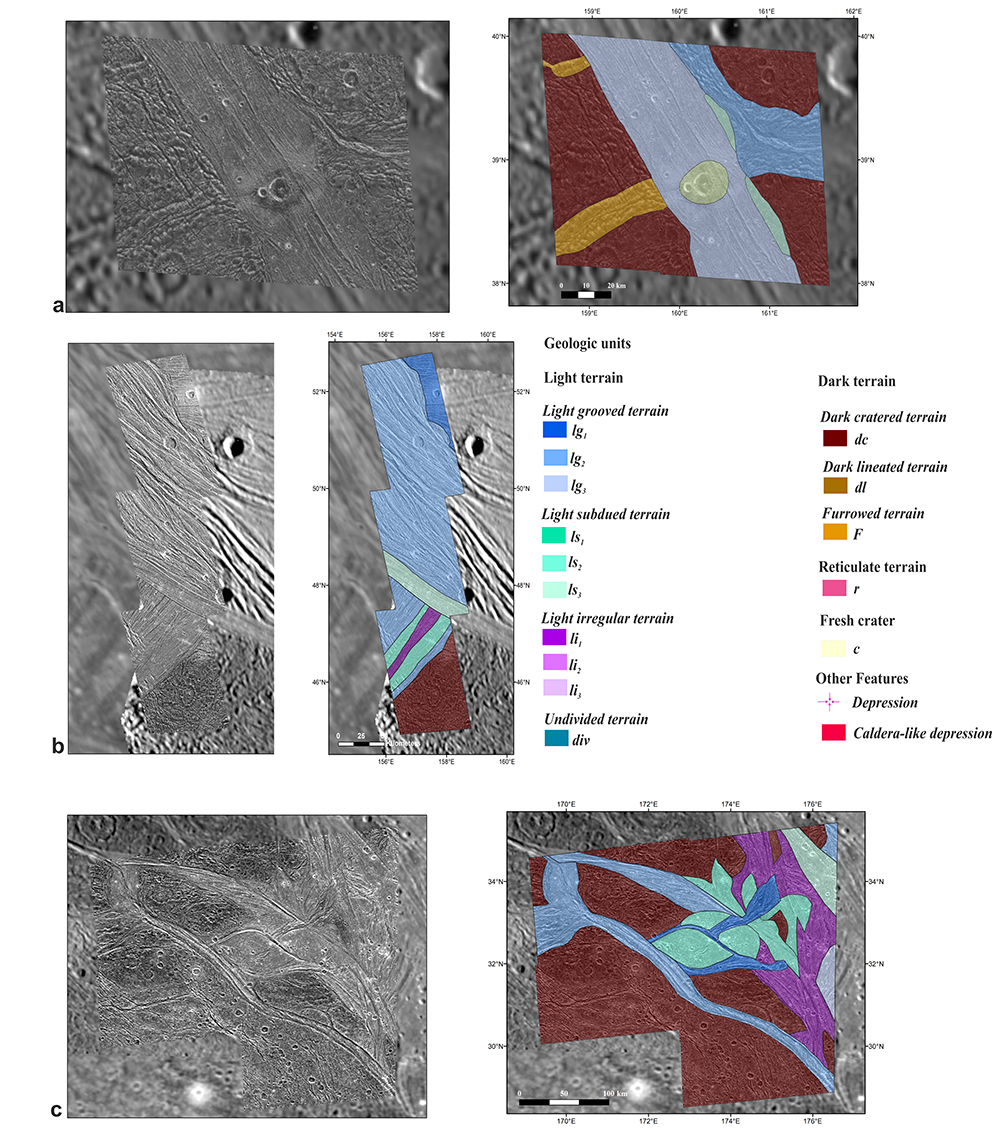
Figure 2: Geologic mapping results for Region A: a) Byblus Sulcus (G2GSGRVLNS01), b) Nippur and Philus Sulcus (G2GSNIPPUR01) and c) the Transitional region (G2TRANST01). The legend applies also to Figures 3 and 4.
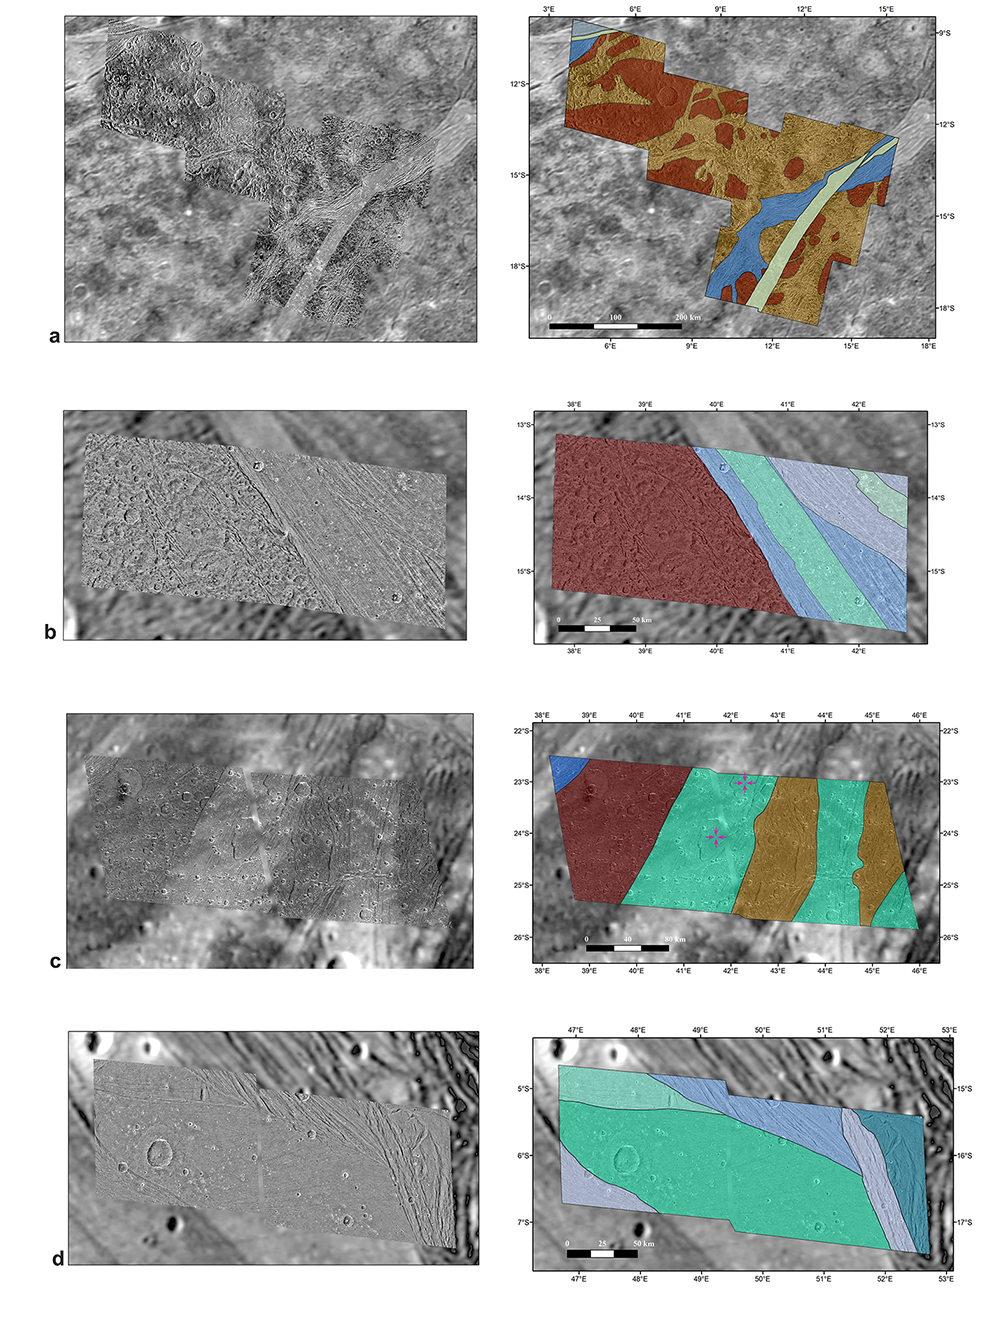
Figure 3: Geologic mapping results for Region B dominated by Arbela Sulcus (28GSARBELA01+02/ G7GSNICHOL01) and Region C by Harpagia Sulcus (b) 28GSBRTDRK02, c) 28GSCALDRA02 and d) 28GSSMOOTH02).
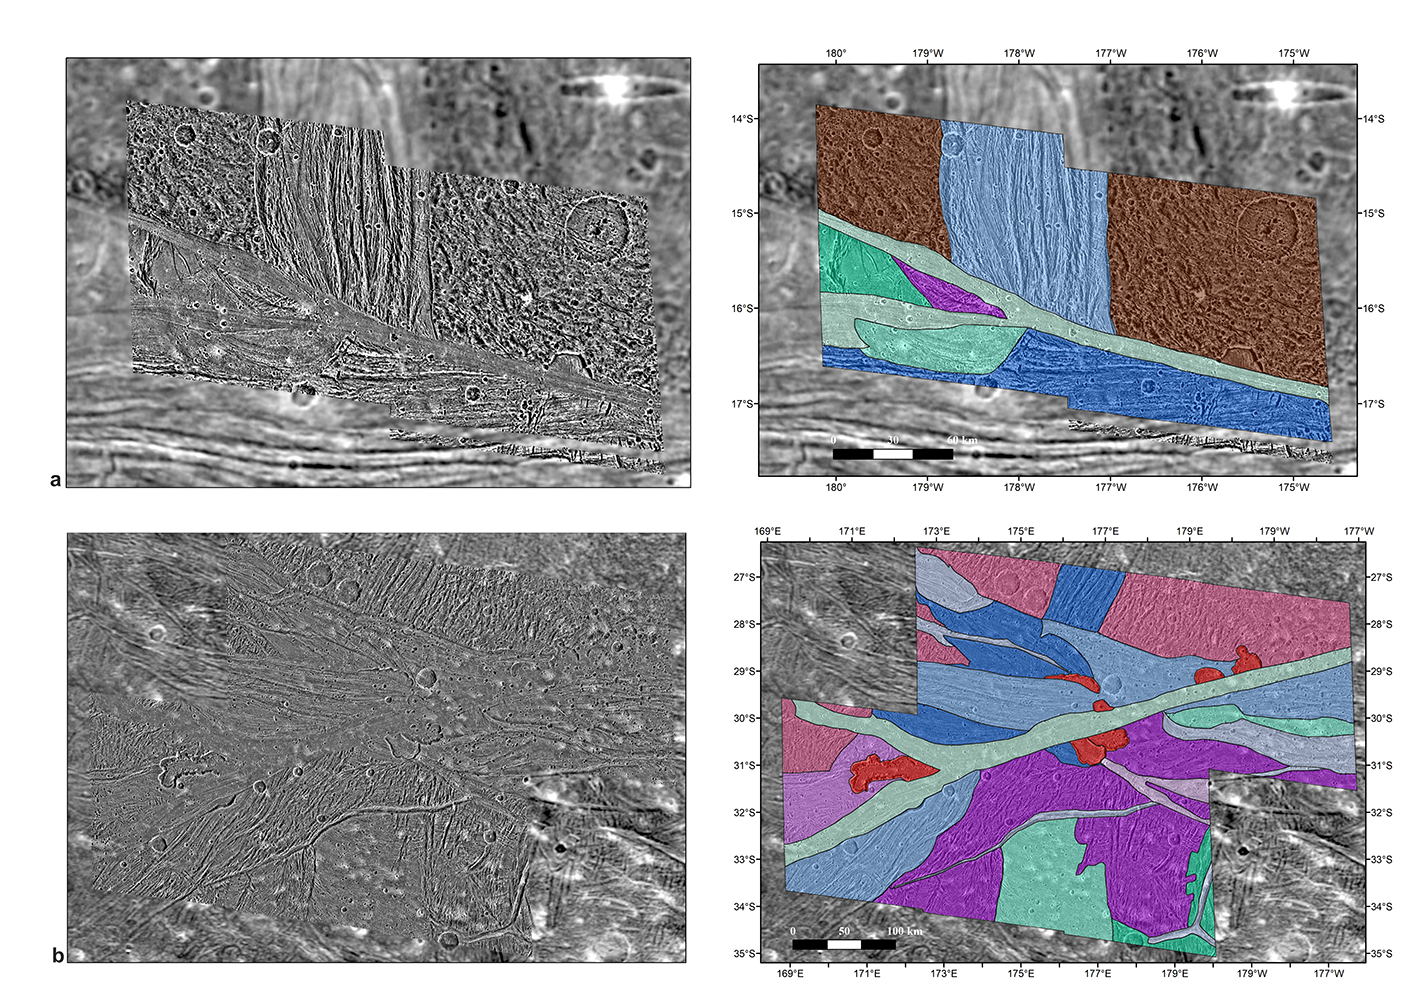
Figure 4: Geologic mapping results for Region D comprises of a) Erech (G8GSERECH01) and b) Mummu and Sippar Sulci (G8GSCALDRA01).
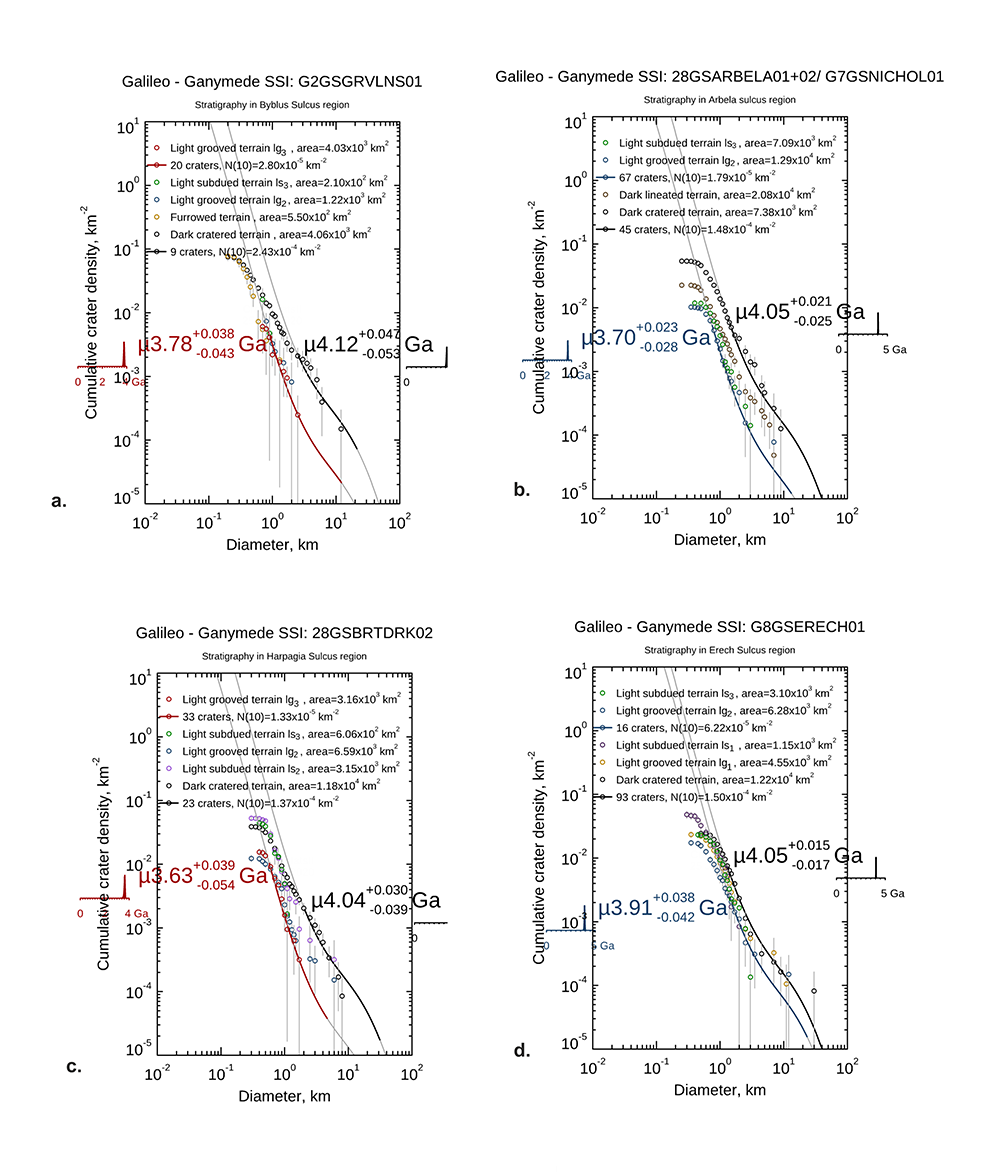
Figure 5: Comparison of relative ages of different terrain units from a) Region A (Byblus Sulcus), b) Region B (Arbela Sulcus), c) Region C (Harpagia Sulcus - 28GSBRTDRK02) and d) Region D (Erech Sulcus) based on crater size frequency distributions.
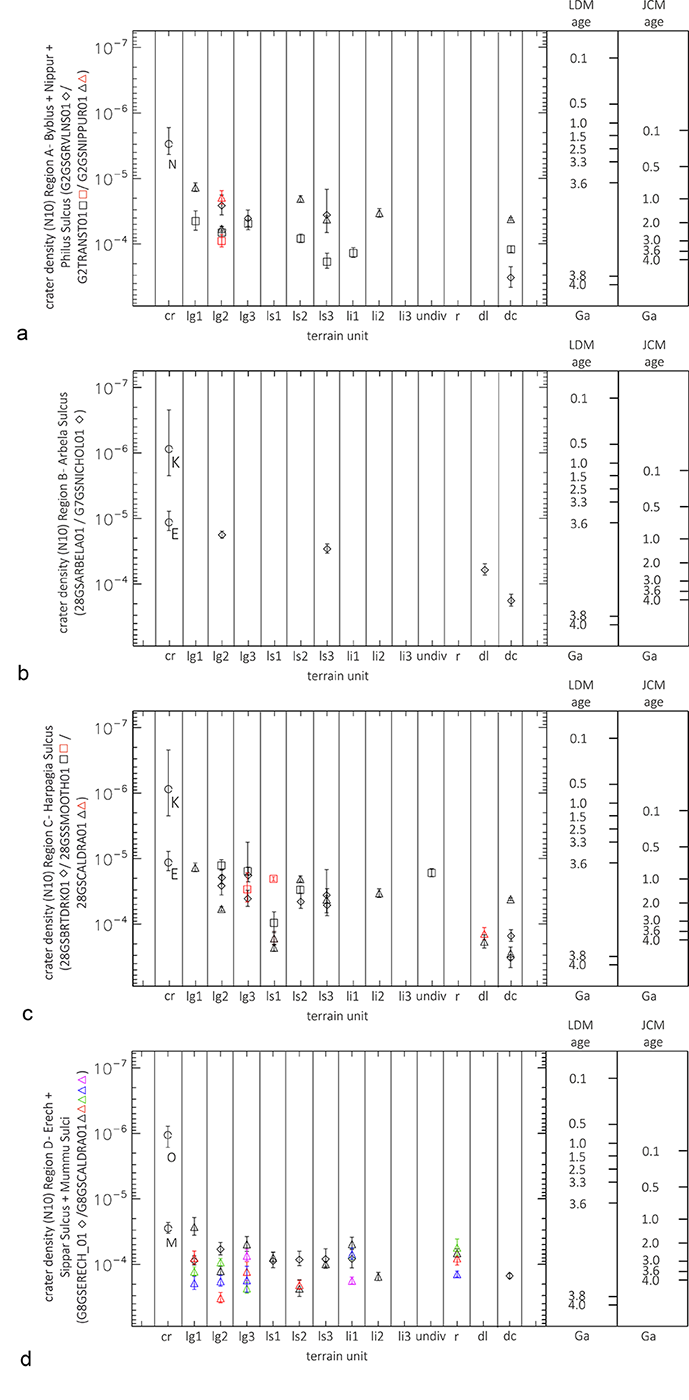
Figure 6: Stratigraphic correlation of Region a) A, b) B, c) C and d) D in which relative ages are determined by plotting the N(10) values with respect to each terrain units and corresponding ages based on LDM [7] and JCM [8]models. Please note that ages of fresh impact craters such as Nergal (N), Kittu (K), Enkidu (E), Melkart (M) and Osiris (O) have been added as additional stratigraphic markers. Since terrain types often appear more than one time in a geologic map the different facies are indicated by different colors.
References:
[1] Grasset, O., et al.: Planetary and Space Science, 78, 1-21, 2013. [2] Stephan, K., et al.: Planetary and space science, 208, 105324, 2021. [3] Pappalardo, R. T., et al.: Jupiter: The Planet, Satellites and Magnetosphere, 363-396, 2004. [4] Collins, G.C., et al.: Global geologic map of Ganymede (p. 3237), US Geological Survey, 2013. [5] Patterson, G. W. et al.: Icarus, 207, 845-867, 2010. [6] Baby, N. R., et al.: LPI Contributions, 2678, abstr. #1350, 2022. [7] Neukum, G., et al.: LPSC XXIX, abstr. #1742, 1998. [8] Zahnle, K., et al.: Icarus 163, 263-289, 2003. [9] Bland, M. T. et al. : Icarus 200, 207- 221, 2009. [10] Bottke et al.: LPSC, #2638, 2022.
How to cite: Baby, N. R., Stephan, K., Wagner, R., Kenkmann, T., Collins, G., Hauber, E., and Jaumann, R.: Stratigraphic relationships of different terrain units on Ganymede and possible implications towards their evolution, Europlanet Science Congress 2022, Granada, Spain, 18–23 Sep 2022, EPSC2022-1016, https://doi.org/10.5194/epsc2022-1016, 2022.
Summary. We focus on a portion of the Nippur Sulcus region on Ganymede, which is currently promising for a multisensor data analysis. We first combine data acquired by the Galileo/SSI framing camera and by the Galileo/NIMS imaging spectrometer. We then apply a self-similar clustering technique able to explain how the grooves visible on the surface are distributed inside the icy crust. Finally, we apply a simple model to obtain a synthetic topographic dataset based on the existing optical dataset, which is used to simulate radar echoes coming from the RIME instrument with the goal of evaluating the magnitude of clutter noise.
Geological and compositional context. We first focus on optical images obtained by the Galileo/SSI framing camera on a portion of Nippur Sulcus bordering Galileo Regio to the east and Marius Regio to the west (167.4°E–193.5°E and 16.8°N–38.2°N) (Fig. 1). This region includes different terrain units, such as dark terrains, grooved terrains, and the palimpsest crater Epigeus [1].
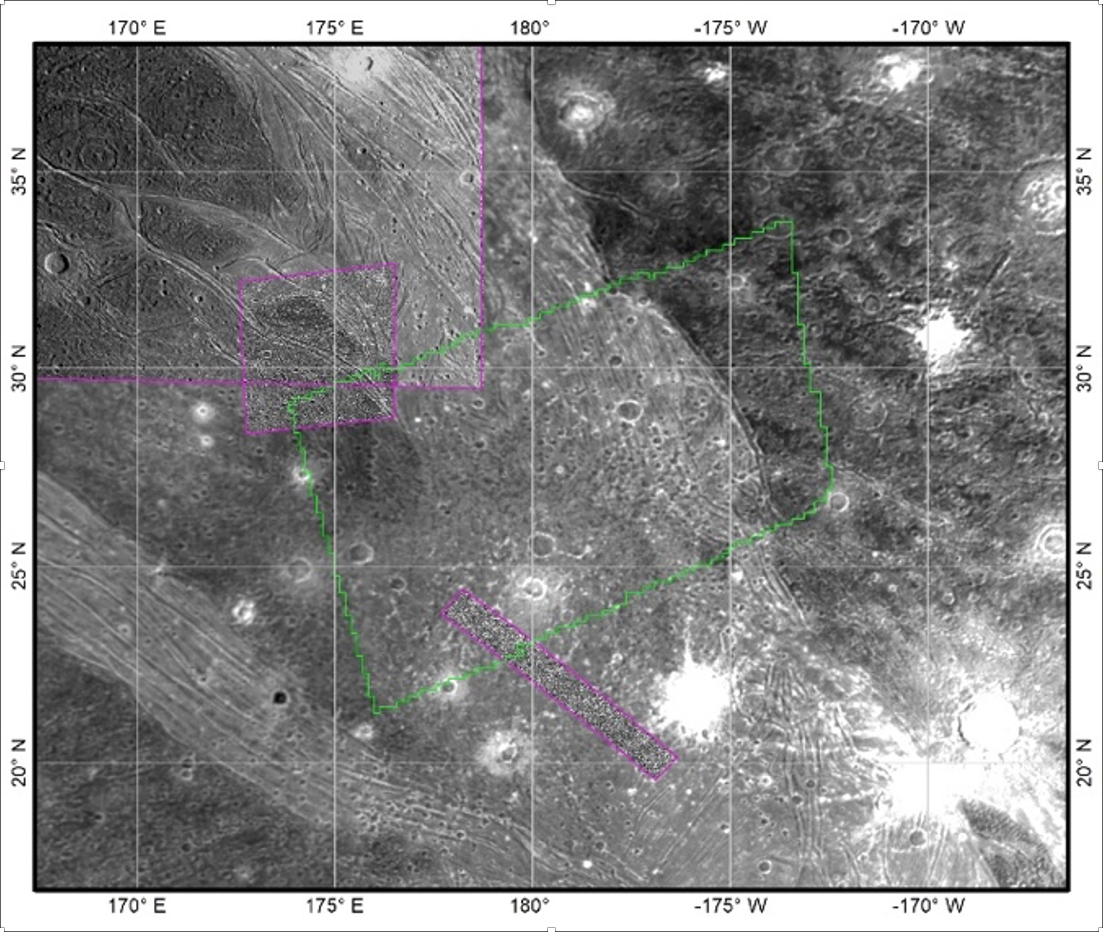
Fig. 1. Overview of the Nippur Sulcus region of inter-est used for our case study, from Ganymede’s optical basemap (1 km/px). The violet contours highlight the regions for which high-resolution optical imagery is available, while the green contour highlights the region covered by hyperspectral, near-infrared (NIMS) data (see Fig. 2).
The coverage obtained by the Galileo/NIMS imaging spectrometer [2] allows for the combination of geologic and compositional information, using specific spectral indices such as an IR slope, the 2-μm band depth, and a IR ratio, which can account for the distribution of contaminants, water ice, and grain size, respectively (Fig. 2).
Fig. 2. NIMS Color composite map covering the Nip-pur Sulcus region at a spatial resolution of 6.7 km/px (R: IR slope 1.10-2.25 µm, G: 2-µm band depth, B: IR ratio between 3.6 µm and 1.82 µm). In the adopted color scheme, green marks high albedo, large (100s µm) regolith grains and stronger water ice band, while magenta is associated with dark terrain where the 2-µm water ice band is shallower and the grain size is smaller (10s of µm).
Grooves’ length and fractal analysis. On the selected region of interest within Nippur, we establish a link between geology and geophysics, namely between what is seen on the surface at visible to infrared wavelengths, and Ganymede’s shallow subsurface, which is still largely unknown today. To do so, we analyse the grooves’ length and spatial distribution to estimate the potential thickness of the icy crust above the deep ocean required to develop the grooves. A fractal approach, namely a self-similar clustering method, allows us to determine the maximum depth at which grooves can penetrate the icy subsurface [3, 4]. As a result, the grooves mapped in the Nippur Sulcus region in principle could penetrate the ice crust up to 130-145 km (Fig. 3).
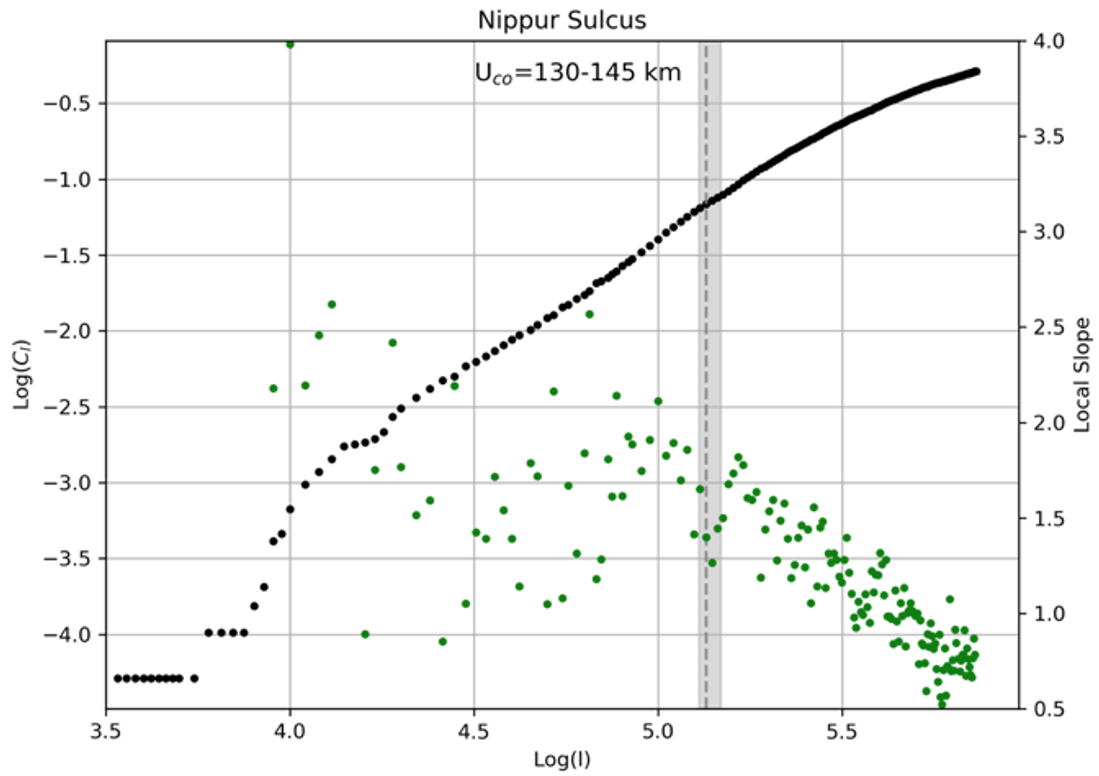
Fig. 3. A self-similar clustering method allows us to determine the maximum depth up to which grooves can penetrate the icy subsurface. To do this, we calcu-late an integral correlation coefficient within certain length ranges. In this plot, the x axis is the logarithm of these threshold lengths, while the y axis represents the logarithm of the correlation coefficient (on the left) and what is called the local slope (on the right, which is the point-by-point measurement of the slope of the tangent to the curve). As a result, the grooves mapped in the Nippur Sulcus region in principle could pene-trate the ice crust up to 130-145 km, which is in agreement with independent estimates of the average thickness of the icy shell.
Simulation of radar surface scattering at RIME frequencies. The Radar for Icy Moon Exploration (RIME) is one of the payload instruments aboard the JUICE spacecraft [5]. Operating at a central frequency of 9 MHz, and transmitting either a 3-MHz or a 1-MHz bandwidth (corresponding to a range resolution in water ice of about 30 m and 90 m respectively), RIME is tasked to explore the subsurface of Ganymede, Europa and Callisto down to a depth of several kilometres. However, clutter noise from rougher terrains is a limiting factor in the detectability of deeper, weaker reflections from the subsurface. The application of a coherent model of surface scattering to a roughness model of Nippur Sulcus demonstrates that clutter decays much slower than on Mars for a Ganymede-like topography (Fig. 4), which creates a challenge for the scientific interpretation of future RIME data.
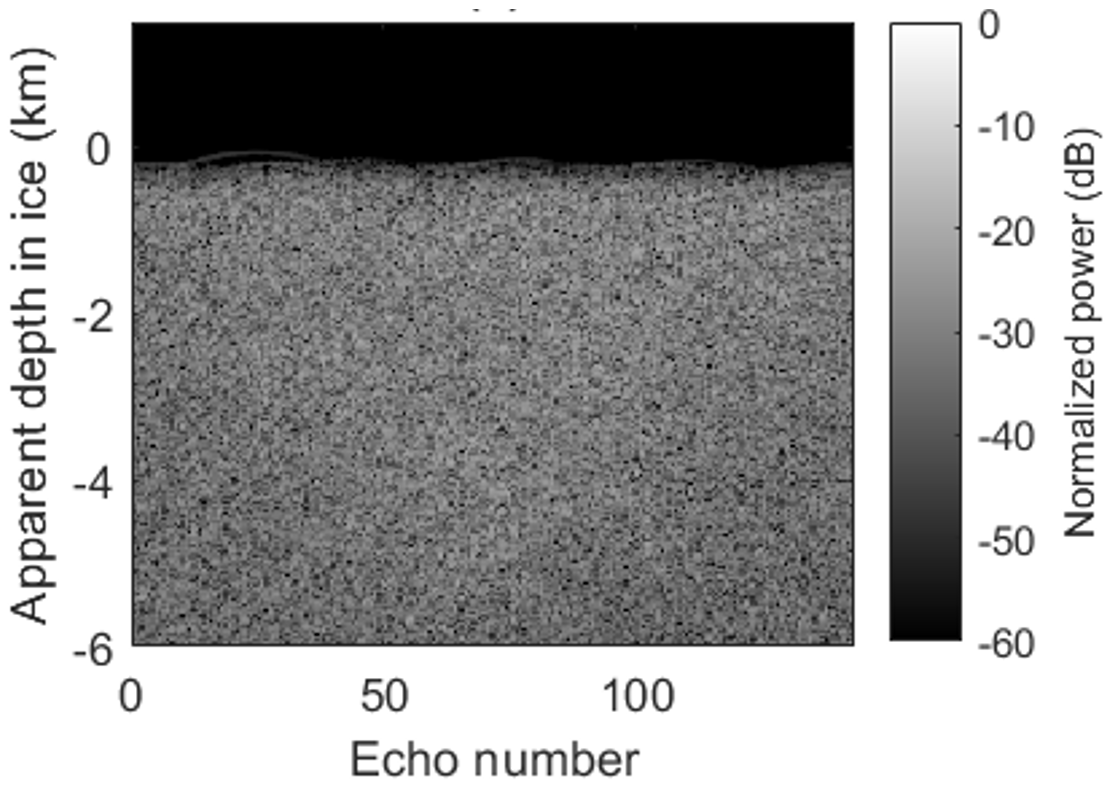
Fig. 4. Radargram of simulated surface echoes pro-duced for a subset of Nippur Sulcus, for a 3-MHz bandwith pulse. The time delay of echoes has been converted to the depth in water ice from which a radar echo would have the same time delay. The radargrams have been cropped to show only the part of the echoes that is unaffected by the finite size of the pseudo-topographic model.
Conclusions. The case of Nippur Sulcus is well suited to test what could be closely observed in the future by different instruments onboard the JUICE mission, combining remote sensing data probing the surface and theoretical modeling aimed at the geophysical study of the satellite’s subsurface. The merits and issues brought to light by our study should be taken into account to achieve a broader understanding of the physical processes linking Ganymede’s surface and subsurface.
Acknowledgements: We acknowledge support from the research project: “Ganymede from 2D to 3D: A multidisciplinary approach in preparation for JUICE”, selected in 2019 in the framework of an “INAF Mainstream” call.
References: [1] Collins G. C., et al., Global geologic map of Ganymede: U.S. Geological Survey Scientific Investigations Map 3237, pamphlet 4 p., 1 sheet, scale 1:15,000,000 (2013). [2] Carlson R. W, et al., Space Sci. Rev. 60, 457-502 (1992). [3] Lucchetti A., Pozzobon R., Mazzarini F., Cremonese G., Massironi M. (2017). Icarus 297, 252-264. [4] Lucchetti A., Rossi C., Mazzarini F., Pajola M., Pozzobon R., Massironi M., Cremonese G. (2021). Planet. Space Sci. 195, article id. 105140. [5] Bruzzone L., Croci R. (2019). Proceedings of the 2019 IEEE 5th International Workshop on Metrology for AeroSpace, Turin (Italy), 19-21 June 2019.
How to cite: Tosi, F., Filacchione, G., Galluzzi, V., Lucchetti, A., Orosei, R., Zambon, F., Cremonese, G., Palumbo, P., and Piccioni, G.: Nippur Sulcus from 2D to 3D: A Multidisciplinary approach in preparation for JUICE, Europlanet Science Congress 2022, Granada, Spain, 18–23 Sep 2022, EPSC2022-215, https://doi.org/10.5194/epsc2022-215, 2022.
The Galileo spacecraft, which orbited the Jovian system between 1995 and 2003, allowed the most detailed investigation to date of the morphology and spectral properties of the surface of Io, Europa, Ganymede, and Callisto. The Near-Infrared Mapping Spectrometer (NIMS, Carlson et al. [1992]) onboard Galileo operated nominally in the near-infrared from 0.7 to 5.2 micrometres using 17 detectors, producing infrared spectra of up to 408 wavelengths. In practice, the instrument was operated in different modes, reducing the spectral dimension, and unfortunately suffered from detector failures, a stuck grating, and changes in the wavelength calibration over the course of the mission. This resulted in a heterogeneous, yet valuable, data set to use to explore the surfaces of the Jovian moons.
In this work, we present our current approach to revisit the Galileo/NIMS data in order to investigate the spectral and photometric properties of Jupiter’s icy moons. The calibrated and georeferenced Galileo/NIMS archived data were gathered from the PDS Imaging Node and decomposed into a MySQL relational database. The database consists in a series of related data tables where, for each surface pixel of the calibrated g-cubes, we extract a series of key parameters of interest such as: radiance factor (I/F) and radiance (I), varying wavelengths, viewing geometry (incidence, emission, phase, and recomputed azimuth), and the location of the observations (pixel geographic latitudes and longitudes, spatial resolution). In addition, we store useful metadata inherited from the PDS3 data labels such as the sensitivity, dark levels, solar flux, temperatures, observation descriptions, detector numbers and original bands in order to support our investigations. The smallest object that can be retrieved from the NIMS database is a single spectrum.
All the data are linked within this framework, in such a way that the spectral data can be extracted from any geographical queries in latitude/longitude, per target, or per individual g-cube, within seconds. Coverage analyses of the full data set per target can easily be performed in view of spectroscopic or photometric regional studies, by defining regions of interest on a target based on their angular and/or spectral coverage across data cubes (Figure 1). This allows for an efficient and comprehensive exploration of the data set and can be used for different types of studies. Our effort currently focuses on the spectral and photometric properties of Europa’s terrains coupling these database capabilities and advanced data analysis techniques [Belgacem et al., 2022; Cruz-Mermy et al., 2022].
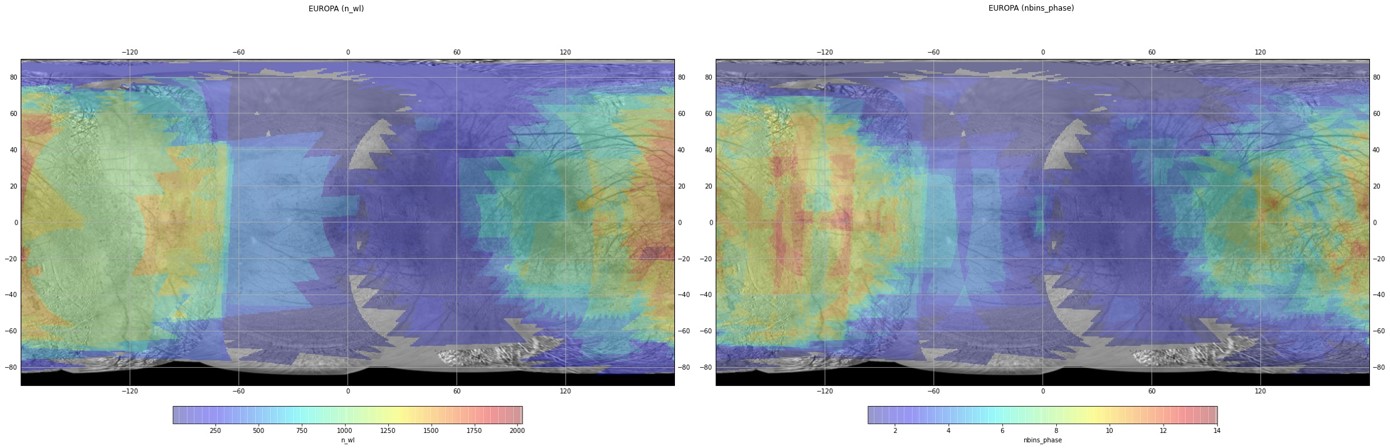
Figure 1: (Left) Spectral and (right) angular coverage of the NIMS data set on Europa. Colour coding: (left) number of unique wavelengths, and (right) number of 5degrees phase angle bins in a given 1deg x 1deg gridded area of Europa. Basemap: USGS Galileo SSI global mosaic.
References
Carlson et al., Space Science Reviews, 60, 457-502, 1992.
Belgacem et al., 53rd LPSC, 1985, 2022.
Cruz-Mermy et al., 53rd LPSC, 2141, 2022.
How to cite: Cornet, T., Cruz-Mermy, G., Andrieu, F., Schmidt, F., Belgacem, I., and Altobelli, N.: Revisiting the Jovian moons' surfaces in the infrared using the Galileo/NIMS database, Europlanet Science Congress 2022, Granada, Spain, 18–23 Sep 2022, EPSC2022-497, https://doi.org/10.5194/epsc2022-497, 2022.
Events which deposit fresh material onto Europa’s surface may be irregular and catastrophic, such as large-scale impacts, or localized, and potentially extant, processes in which faults, fractures, or brine transport bring subsurface liquid onto the surface. This liquid may originate from shallow reservoirs within the ice shell or directly from the subsurface ocean [1]. Emplacement may be a slow, extrusive process, or quicker, potentially with the formation of cryovolcanic plumes (e.g. [2,3,4]). Plume deposits or any other surface material can also be transported to high altitudes by another mechanism: when hypervelocity interplanetary micrometeoroids, or larger objects, impact the surface of an atmosphereless planetary body like Europa, these can generate impact ejecta with high enough velocities to reach altitudes of hundreds of kilometres [5]. Most of these ejecta particles are gravitationally bound, moving on ballistic trajectories lasting up to hundreds of seconds and producing an almost isotropic dust exosphere around Europa [6,7]. Subsurface oceans, in the Jovian and in other planetary systems, can therefore be characterized using the particles they emit, via either indirect or direct routes: 1) Detection and analysis of ejecta particles lofted by micrometeoroid impacts from those parts of the surface that recently interacted with subsurface water (e.g. certain landforms, such as chaos terrains on Europa, or plume deposits); 2) Direct sampling of plume particles in space (where plumes are present, as perhaps possible on Europa).
The SUrface Dust Analyzer (SUDA), onboard the Europa Clipper spacecraft, is designed to measure the composition and trajectories of such impact ejecta particles and/or plume material. SUDA is an impact ionisation time-of-flight mass spectrometer, which uses the ions generated by hypervelocity impacts of dust grains onto the instrument target to generate mass spectra of the impinging particles. Depending on the altitude, SUDA will be able to detect up to tens of ejected surface particles per second during each flyby, each likely to contain a wide variety of organic and/or inorganic compounds, and via trajectory reconstruction, map them to their origins on the surface [8].
At global scales, landform evolution on atmosphereless bodies is primarily driven by impact gardening and tectonics. The tectonic regime that dominates within Europa’s ice shell is likely to be extensional, a hypothesis supported by numerous lines of evidence, such as the widespread presence of dilational bands that represent >40% of the total surface area [9]. Several types of geological features generated within such a tectonic regime, including chaos terrains and fossae, might affect the emplacement of buried material and subsequent exposure of fresh volatiles on Europa’s surface.
Chaos Terrains are, on Europa, geologically very young and extensively disrupted surface features, interpreted as reflecting recent interaction with subsurface material [10]. Leading-hemisphere chaos regions have recently been shown to be compositionally distinct from their surroundings, probably indicating contributions from endogenous sodium chloride sourced from the subsurface ocean [11,12]. Fossae are long, narrow depressions (troughs). The term is used for topographic features that occur on extraterrestrial planetary surfaces, whose exact origin is uncertain, although they are thought to be the result of extensional tectonic processes [13].
Here we investigate two neighboring features on Europa, Ménec Fossae and Thrace Macula (a chaos terrain), for which we produced high-resolution photoclinometrically-derived [14] digital terrain models (DTMs, Fig. 1) and geomorphological-structural maps (Fig. 2). Our preliminary results suggest that this area of Europa has undergone transtensional (strike-slip paired with extension) tectonic activity, as indicated by the orientation and relationship of the faults and fossae. Such tectonic style has possibly created a pathway facilitating the ascent of subsurface material, especially volatiles, that play an important role in the formation of chaos terrain. These results will help ascertain the most likely regions on Europa in which to find fresh material, representative of the subsurface ocean, and be used as input data for dust ejecta trajectory models that will ultimately assist the mass spectrometer Surface Dust Analyzer (SUDA), onboard the upcoming Europa Clipper mission, in compositionally mapping Europa’s surface [15].
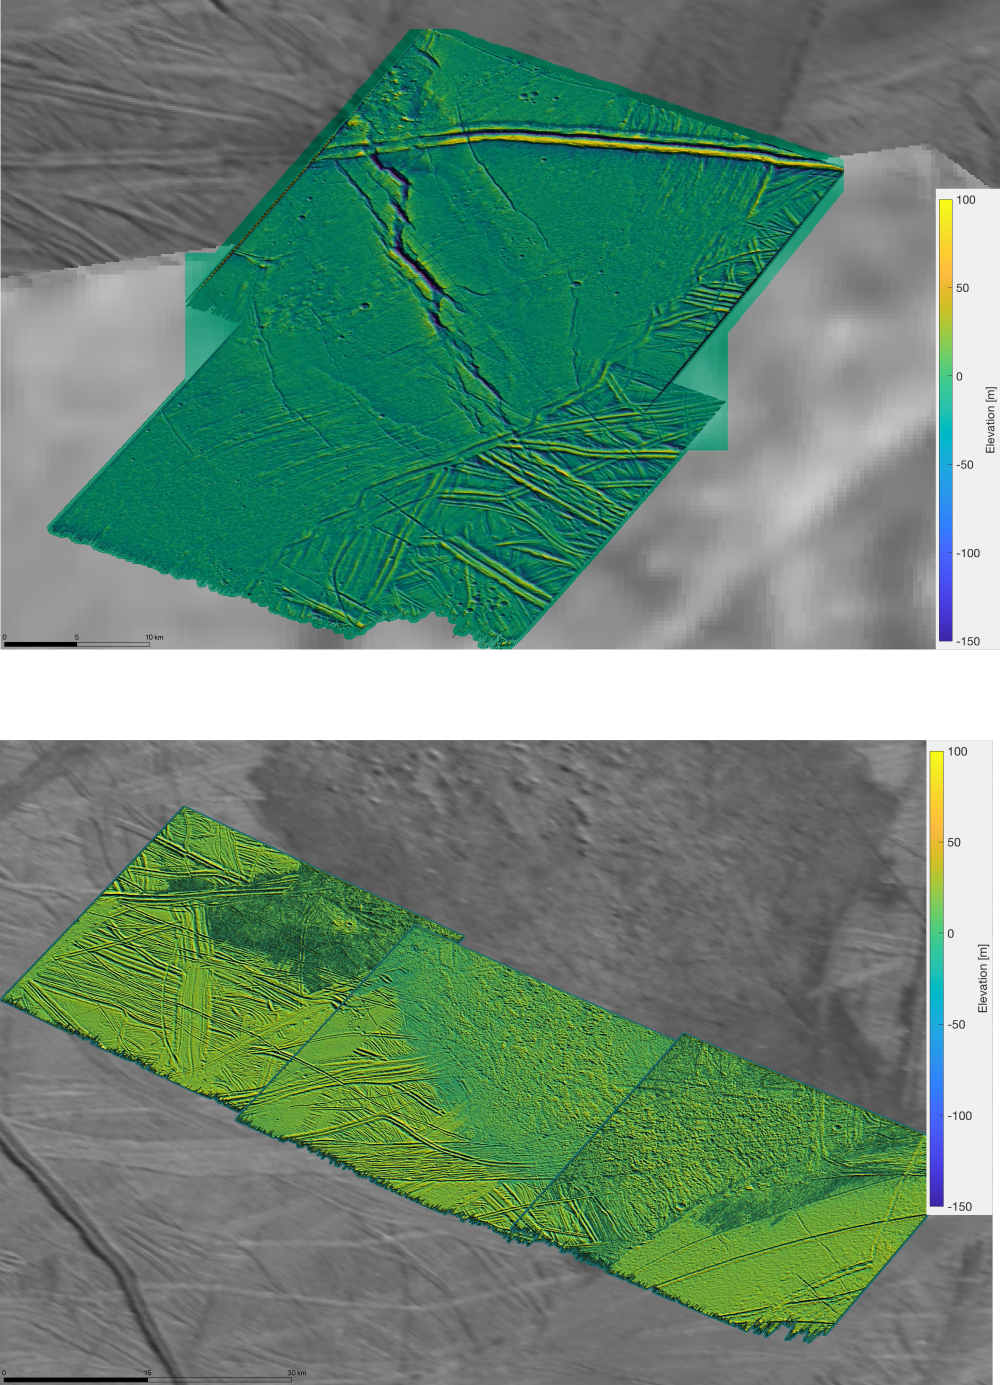
Figure 1. Regional DTMs, Ménec Fossae (top) and Thrace Macula (bottom)
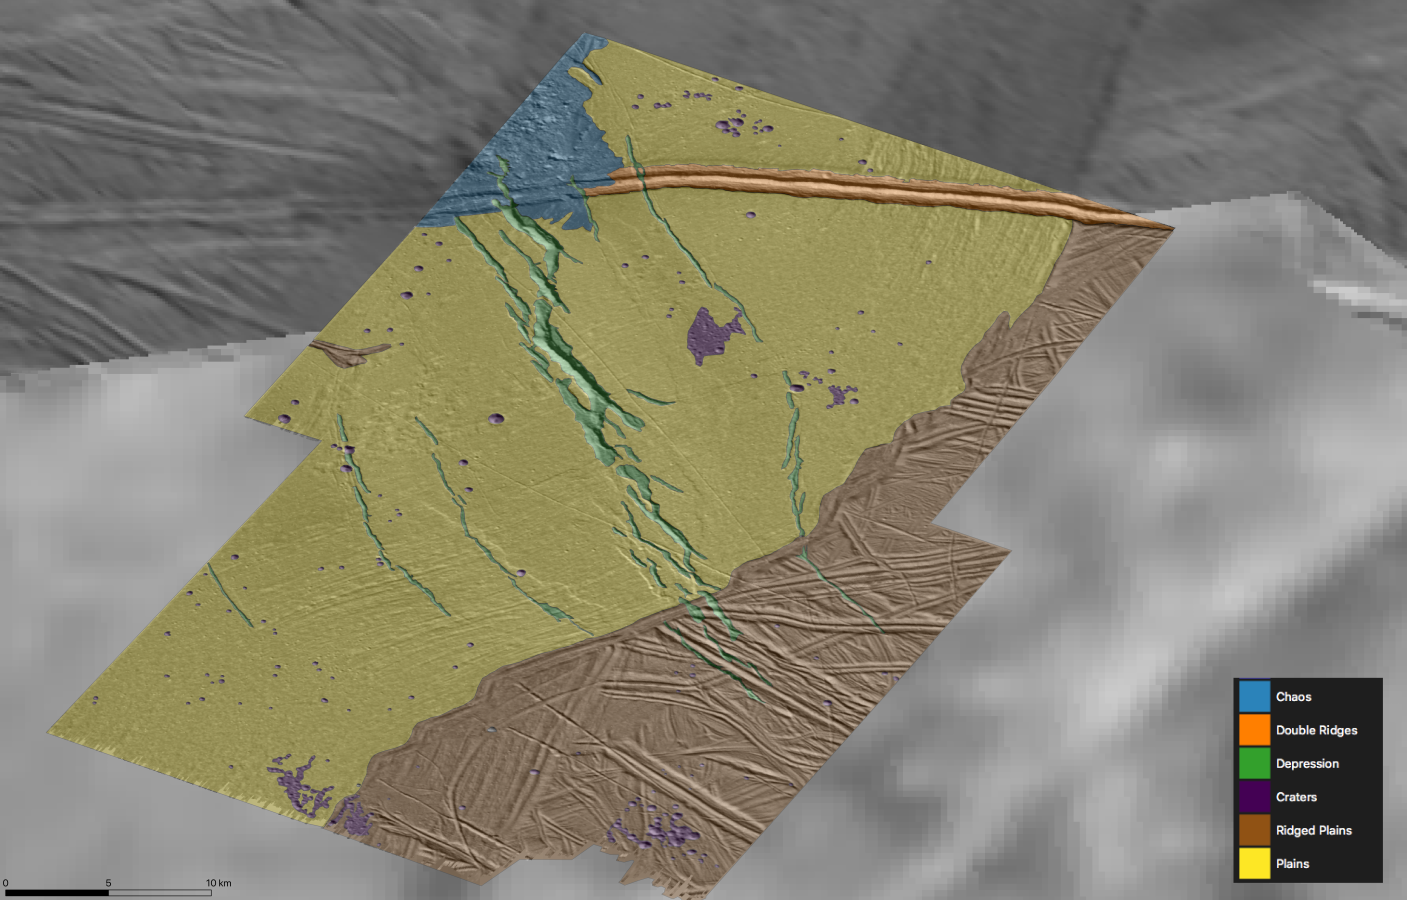
Figure 2. Geomorphological map of Ménec Fossae
- 1. Head, J.W., & Pappalardo, R.T., (1999). J. Geophys. Res. 104, 27143–27155.
- 2. Roth, L., et al., (2014). Science 343, 171.
- 3. Sparks, W.B., et al., (2017). The Astrophysical Journal Letters, 839(2), L18.
- 4. Jia, X., et al., (2018). Nat. Astron. 2, 459.
- 5. Koschny, D., & Grün, E., (2001). Icarus, 154(2), 402-411.
- 6. Krivov, A. V., et al., (2003a). Planetary and Space Science 51, 251-269.
- 7. Postberg, F., et al., (2011). Planetary and Space Science, 59(14), 1815–1825.
- 8. Goode, W., et al., (2021). Planetary and Space Science, 208, 105343
- 9. Kattenhorn, S.A. & Hurford, T.A., (2009). In: Europa, 199-236.
- 10. Schmidt, B. E., et al., (2011). Nature 502, v. 479
- 11. Trumbo, S. K., et al., (2019). SciA, 5, aaw7123
- 12. Trumbo, S. K., et al., (2022), PSJ, 3, 27
- 13. Schenk, P., et al., (2020). Geophys. Res. Let., 47, e2020GL088364
- 14. Lesage et al., (2021). Icarus, Volume 361, 114373.
- 15. Kempf, S., et al., (2019). AGU Fall Meeting 2019, abstract #P53D-3500
How to cite: Matteoni, P., Neesemann, A., Schmidt, J., Hillier, J., and Postberg, F.: Geomorphology and topography of Ménec Fossae and Thrace Macula on Europa: Insights on formation processes, Europlanet Science Congress 2022, Granada, Spain, 18–23 Sep 2022, EPSC2022-914, https://doi.org/10.5194/epsc2022-914, 2022.
The main objective of this research project is to develop super-resolution mapping methods to increase the spatial resolution of surface maps of icy moons of the Solar System by combining all the overlapping observations acquired during a given planetary mission. Cassini-Huygens was the first dedicated mission to Saturn, where it spent 13 years studying the gas giant and its system of moons and rings creating a treasure-trove of data. The focus of this study is to create global surface cartographic products in the infrared by evaluating the Cassini’s Visual and Infrared Mapping Spectrometer (VIMS) hyperspectral dataset in its entirety. We will first focus our efforts on developing, testing and validating the methods on Enceladus, a prime astrobiological candidate, which, in contrast to Titan, does not require any atmospheric corrections. We offer a new module in Python for creating the navigation cubes necessary in merging individual cubes into global mosaics, increasing the accuracy of the covered area and maximising the number of pixels used (e.g. limb-crossing pixels). Moreover, this new module, allows us to explore the Enceladus VIMS dataset in its entirety. We then determine a surface photometric function which mitigates variations in the brightness due to the changing geometric conditions of the flybys. With a precise and comprehensive navigation and an accurate surface photometric correction, we can apply the super-resolution method and present some preliminary maps with enhanced spatial resolution and signal-to-noise ratio.
How to cite: Ntinos, C., Rodriguez, S., Altobelli, N., Le Mouelic, S., Robidel, R., Seignovert, B., Tobie, G., Cornet, T., and Vallat, C.: First results of super-resolution mapping of Enceladus’ surface, based on new navigation and photometric correction function, Europlanet Science Congress 2022, Granada, Spain, 18–23 Sep 2022, EPSC2022-476, https://doi.org/10.5194/epsc2022-476, 2022.
Introduction
CO2 clathrate is one of the possible compounds in the crust of ice moons. The analysis of the data provided by the NASA Galileo mission revealed that the Jovian moons have both, the chemical and the physical conditions required for clathrate hydrates to be formed from the surface to deeper layers (Prieto-Ballesteros et al. 2005, Hand et al. 2006, Izquierdo-Ruiz et al. 2020).
The study of the dielectric properties of water-related minerals is key to understand the results of future missions to Jupiter and its satellites. The JUICE (ESA) and Europa Clipper (NASA) missions will try to determine the internal subsurface structure of these Jovian icy moons with the radar instruments onboard: RIME and REASON respectively. These instruments will operate both at a frequency of 9 MHz, with capacity to penetrate from 1 to 30 km depth. REASON has an extra antenna of 60 MHz to explore shallow depths (that is, 300 m to 4.5 km).
There are many works about the physical properties of clathrate hydrates (for instance: Sloan et al, 2007), but just a few of them are focused on their electrical properties in planetary conditions. Davidson (1973) and Davidson & Ripmeester (1978) determined the high frequency permittivity (εꚙ) of several clathrates, finding a value of 2.85 at 233 K for clathrates of simple guest molecules such as argon and nitrogen. This value increases over 7.7 for other guest molecules and structures such as ethylene oxide and acetone. So far, only Stern et al. (2021) investigated CO2- and CH4- clathrate hydrates to determine their electrical conductivity, but not their permittivity.
In this work we present novel results for CO2 clathrate including a combined electrical conductivity and permittivity study.
Methodology
We use a stainless-steel high pressure chamber with an internal volume of 60 ml for the formation of clathrate hydrates. In this cell we mixed distillated water with CO2 gas at 30 bar of pressure.
The conditions of temperature and pressure are recorded at fixed time intervals by sensors inserted into the cell during all the testing period. For the electrical measurements we used a Teflon cell inside the pressure chamber with two polished stainless steel electrodes. Data were taken in isothermal conditions, stabilizing the sample during 10 minutes at each temperature step, when the conductance (G) and parallel capacitance (Cp) were measured, in the frequency range from 20 Hz to 106 Hz in several steps using an LCR precision meter (IM3536-01 Hioki).
The electrical measurements were taken at different temperatures inside the boundaries of the CO2 clathrate equilibrium curves, where several phases such as water, CO2 dissolved, CO2 gas, water ice, and/or CO2 clathrate, can co-exist, following the phase diagram H2O-CO2. We have performed in situ Raman spectroscopy through the sapphire window of the chamber, in order to determine the specific phases stabilized at each temperature step before collecting the electrical data measurement..
Results
We measured the electrical conductivity and real permittivity values for samples of 1) CO2 clathrate and, 2) water with CO2. The results allowed us to discriminate the presence of the CO2 clathrate phase respecting to other phases that could also be formed during the experiments.
When CO2 clathrate is formed, the electrical characterization shows the conductivity and the real part of the permittivity constant with frequencies higher than 100 kHz, with smooth variation with the temperature. At 255 K the real permittivity (εꚙ) was 2.5, and the conductivity (σ) was 1.5·10-6 S/cm. Both obtained values are in good agreement with Stern et al. (2021).
The conductivity and real permittivity of the two phases sample H2O+CO2 with no clathrate formation showed a steeper dependence with frequency and temperature in comparison with the CO2 clathrate. At 265 K, εꚙ was 1.5, and σ was 1.04·10-6 S/cm.
The attenuation of the signal was calculated from the experimental values of conductivity and real permittivity according to the next equation (Petinelli et al., 2015) at 10 kHz.
𝛼 ≅ 𝜎/(2𝑐𝜀0( √𝜀´))
The attenuation showed clear differences between CO2 clathrate, icy water with dissolved CO2, and ice water itself, with attenuation obtained values of 10.99, 1.35 and 0.34 dB/km at 265 K, respectively.
Conclusions
The different phases of the H2O-CO2 system have appreciable differences in their electrical properties, which means that differences in the physical state could be identifiable by radar measurements. The possible relation with surface morphological features could eventually help to understand the geological activity of the moons, such as the mechanism of jets formation proposed for Europa (Shibley & Laughlin, 2021) or the formation of the double ridge structures (Culberg et al., 2022).
Acknowledgments
This work was supported by the ESA contract 4000126441/19/ES/CM, and the MINECO Projects PID2019-107442RBC32, and PRE2020-093227.
References
Prieto-Ballesteros, O. et al. 2005 Icarus, 177, 491-505.// Hand, K. et al. 2006, Astrobiology Vol 6, 3. 463-482. // Izquierdo-Ruiz, F. et al. 2020 ACS Earth and Space Chemistry 2020 4 (11), 2121-2128 // Sloan Jr, E.D. et al. 2007. Clathrate Hydrates of Natural Gases (3rd ed.). CRC Press // Davidson, D.W. 1973 The Physical Chemistry of Water Vol2 115-234. // Davidson D.W. & Ripmeester J.A. 1978. Journal of Glaciology, 21, 33-49. // Stern L. A. et al. 2021, Geophysical Research Letters, 48 // Petinelli et al. 2015. Reviews of Geophysics 53, 593-641 // Shibley, N.C. & Laughlin, G. 2021. The Planetary Science Journal, 2:221 // Culberg et al. 2022. Nat Commun 13, 2007
How to cite: Ercilla Herrero, O., Sanchez-Benitez, J., Muñoz-Iglesias, V., and Prieto-Ballesteros, O.: Dielectric properties of CO2 clathrate hydrates for the exploration of the jovian icy moons, Europlanet Science Congress 2022, Granada, Spain, 18–23 Sep 2022, EPSC2022-438, https://doi.org/10.5194/epsc2022-438, 2022.
There is a volatiles enrichment in planetary bodies with the distance from the Sun because the lower temperatures caused their condensation during the solar system formation. As a consequence, the role of volatiles in the geochemistry and thermal evolution became important on certain bodies of the outer solar system, such as the ocean worlds. In order to understand both, physico-chemical interactions between volatiles and salts or other minerals also present in the internal aqueous reservoirs should be characterized. In this regard, the H2O-CO2-Na2CO3-NH3-CH3OH system is a potential candidate to be present within some ocean worlds, such as Enceladus, Titan and Triton. Whereas carbon dioxide (CO2) has been widely detected on icy satellites [e.g., 1-3], signatures of other volatiles such as ammonia (NH3) and methanol (CH3OH) are scarce and have only been found in low concentrations [4], despite their presence is theoretically expected [5-8]. A plausible explanation for the absence of these volatiles on icy moon surfaces is that they reacted at the interior with other substances, forming new compounds [9]. In addition, we included carbonates in our experiments since they are found in carbonaceous chondrites that have suffered low-temperature hydrothermal alteration, and therefore might be considered to come from the outer region of the solar system [10].
In this presentation we will show the results of the Raman spectroscopy kinetic study of the systems H2O-CO2-NH3, H2O-CO2-NH3-CH3OH, H2O-Na2CO3-NH3, and H2O-Na2CO3-NH3-CH3OH, which were exposed to temperatures down to 230 K and pressures up to 50 MPa. From the Raman spectra taken in situ throughout the experiments performed in a high-pressure cell, we were able to monitor the changes in pH of the systems by analyzing the carbonate-bicarbonate ion peak intensity ratio at each time step due to variations in aqueous chemical speciation and precipitation of solids. Our experiments also allowed us to evaluate the active role of CH3OH in the redox equilibria of the systems over time. Finally, the solubility of the carbonates formed was also investigated first, in a CO2 atmosphere, and then at high-pressure water.
This study is the progress of a previous work carried out by differential scanning calorimetry (DSC) [11], where we confirmed that CO2 clathrates stabilize in coexistence with carbonates. In this work, we observed that the presence of salts and volatiles during clathrate formation affect their level of cage occupancy, resulting in less-stable partially-filled structures with low dissociation enthalpies.
This work is funded by the Spanish State Research Agency (AEI) Project No. MDM-2017-0737 Unidad de Excelencia "María de Maeztu"- Centro de Astrobiología (CSIC-INTA). We also acknowledge support from the Spanish MINECO project PID2019-107472RB-C32.
References:
[1] Hansen and McCord. Geophys. Res. Lett. 2008, 35 (1), L01202.
[2] Cruikshank et al. Icarus 2010, 206 (2), 561–572.
[3] Grundy et al. Icarus 2006, 184 (2), 543–555.
[4] Grasset et al. Space Sci. Rev. 2017, 212 (1), 835–875.
[5] Sohl et al. Space Sci. Rev. 2010, 153 (1), 485–510.
[6] Deschamps et al. Astrophys. J. 2010, 724 (2), 887–894.
[7] Dougherty et al. J. Geophys. Res. Planets 2018, 123 (12), 3080–3087.
[8] Tobie et al. Icarus 2005, 175 (2), 496–502.
[9] Kargel. Icarus 1992, 100 (2), 556–574.
[10] Johnson and Prinz. Geochim. Cosmochim. Acta 1993, 57 (12), 2843–2852.
[11] Muñoz-Iglesias and Prieto-Ballesteros. ACS Earth Space Chem. 2021, 5 (10), 2626–2637.
How to cite: Munoz-Iglesias, V., de Dios-Cubillas, A., and Prieto-Ballesteros, O.: Physico-chemical evolution of the H2O-CO2-Na2CO3-NH3-CH3OH system at low temperatures and high pressures. Implications for icy ocean worlds., Europlanet Science Congress 2022, Granada, Spain, 18–23 Sep 2022, EPSC2022-393, https://doi.org/10.5194/epsc2022-393, 2022.
Introduction. The Cassini spacecraft’s encounters with ice grains within the plumes of Enceladus have implied that they originate as droplets of ocean fluid (aerosols), produced by vigorous bubbling at the liquid-vapour interface [1],[2]. Seawater aerosols on Earth, also formed through bubble-bursting, exhibit strong size-dependent differences in their composition and organic content [3],[4]. Compositionally distinct populations of grains detected by Cassini suggest that analogous processes may operate to segregate ocean constituents within the plumes [1]. We used a purpose-built experimental plume aerosol facility to investigate the size-dependent flux and composition of aerosols produced via bubble-bursting under conditions relevant to Enceladus. Our findings show how rates of volatile exsolution influence aerosol size distributions, revealing mechanisms that shape plume stratification. Ongoing work is establishing the efficiency of transfer of organic compounds into aerosols under biological and non-biological scenarios, and how this varies across size fractions relevant to the ice grain profiles encountered by Cassini.
Methods. Plume simulation facilities. Aerosols are generated in a temperature-controlled reaction vessel that holds between 5 and 40 litres of fluid, through which mixes of gases are bubbled (Fig. 1). Fluid and gas compositions can be adjusted to simulate any desired chemical conditions. Gas flow rates and bubble injection dynamics can be varied between endmember states of small diffuse bubbles, representative of steady exsolution of volatiles, and vigorous jets of large bubbles, representative of violent boiling. Aerosols are fed into the inlet of a Dekati ELPI+ cascade impactor with real-time enumeration via a gas stream. Particle numbers and size distributions are recorded per second. Aerosols are physically separated into 14 size fractions with diameters between 0.01 and 10 µm and collected onto polycarbonate or aluminium foils, which are then recovered for downstream analyses.
Experimental approach. We conducted experiments using both simple NaCl fluids, and fluids designed to fully simulate Enceladus ocean chemistry [5]. To investigate endmember ‘controlled boiling’ scenarios [6], bubble injection dynamics were altered between diffuse and violent bubble jets, while absolute gas flow rate was maintained at 14.2 litres s-1 m-2 of surface area. Aerosol size distributions were monitored for 25 minutes. In ongoing work, collected aerosols fractions are recovered and analysed for their inorganic and organic composition and biomass content, and compared across biological and non-biological simulations. Extracellular polysaccharides produced by the facultative anaerobic bacterium Halomonas ventosae [7] are used as a biological analogue of the insoluble organic layer inferred to exist at the surface of the liquid reservoir at Enceladus [1]. This allows us to investigate how the presence of such a layer affects the flux and size-dependent organic content of aerosols.
Results and discussion. Our preliminary data show that contrasting bubble dynamics can result in dramatically different aerosol profiles (Fig. 2). Both bubbling styles led to the production of high numbers of extremely small (< 0.031 µm) particles. In the peak size range of ice grains encountered by Cassini (1 – 4 µm), bubbling styles produced aerosols with similar efficiencies [8]. However, between 0.031 and 1.006 µm aerosols produced by violent bubble jets exceeded those produced by diffuse bubbling by at least an order of magnitude. Because Cassini did not encounter high numbers of such particle sizes, this finding suggests that diffuse bubbling is a more likely plume origin, or that some other process within the plumes efficiently removes particles in this size range.
Our experiments provide new insights into the size-dependent flux of aerosols produced at the liquid/vapour interface at Enceladus, and how this ultimately defines the composition of ice-grains ejected to the altitude of spacecraft fly-throughs. Ongoing work is investigating the efficiency of transfer of organics into plume aerosols under biological and non-biological scenarios. Findings will enable new insights into Cassini plume fly-through data and can be leveraged to predict plume behaviour and composition at other planetary bodies with active plumes, such as Europa.
References. [1] Postberg F, et al. Nature. (2018) 558(7711):564-568; [2] Porco CC, et al. Astrobiology (2017) 17(9):876-901; [3] Salter ME, et al. Geophys Res Lett. (2016) 43(15):8277-8285; [4] Rastelli E, et al. Sci Reports (2017) 7(1):1-10; [5] Fox‐Powell MG, Cousins CR. J. Geophys Res. Planets. (2021) doi:10.1029/2020je006628; [6] Ingersoll AP, Nakajima M. Icarus (2016) 272:319-326; [7] Mata JA, et al. Res Microbiol (2006) 157(9):827-835; [8] Spahn F, et al. Science (2006) 311(5766):1416-1418
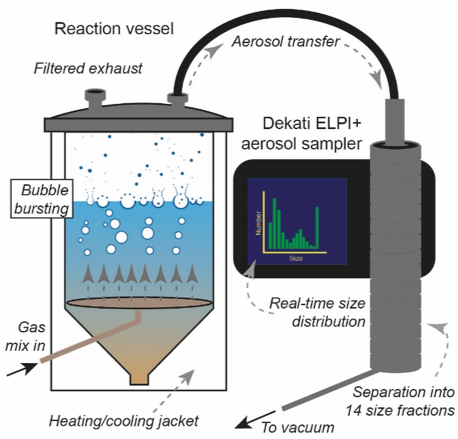
Figure 1. Schematic of experimental plume aerosol facility.
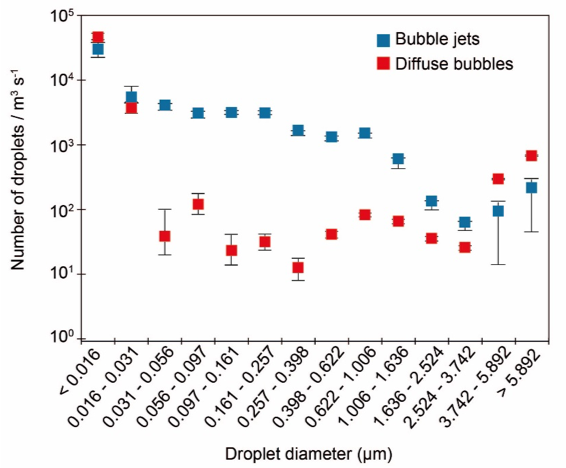
Figure 2. Aerosol size distributions recorded over 25-minute experimental runs. Data points represent median values, error bars indicate minimum and maximum counts.
How to cite: Fox-Powell, M., Slade, D., Siggs, D., and Olsson-Francis, K.: Experimentally probing the origin of Enceladus’s plume: bubble-bursting and aerosol formation at the liquid/vapour interface , Europlanet Science Congress 2022, Granada, Spain, 18–23 Sep 2022, EPSC2022-1231, https://doi.org/10.5194/epsc2022-1231, 2022.
Introduction
Tidal dissipation is an important source of heat for several icy moons of Jupiter and Saturn. While the evaluation of tidal heating in the solid parts of the moons is straightforward, with the only limitation being the lack of knowledge about anelastic properties of ice and silicates, modeling the tidal dissipation in subsurface oceans is challenging and the issue of how much it contributes to the total heat production has not yet been fully resolved. The standard approach to modeling the tidal dissipation in a subsurface ocean is based on the solution of hydrodynamic equations in the shallow water approximation [e.g., 1– 4]. Numerical studies addressing the tidal deformation of the ocean in a three-dimensional geometry have appeared only recently [5,6]. Although these studies represent significant progress, they have one important limitation: they do not take into account the mechanical coupling between the flow in the ocean and the viscoelastic deformation of the ice shell and the core. To overcome this limitation, we have developed a new method that allows the tidal deformation to be solved simultaneously in all three parts of the icy moon.
Method
The problem of tidal deformation is solved in a spherical computational domain corresponding in size to Saturn’s moon Enceladus and consisting of three sub-domains (the viscoelastic ice shell, the viscous ocean, and the viscoelastic core), which are coupled by the boundary conditions. The Navier-Stokes equation is integrated in time and solved using a pseudo-spectral method based on spectral decomposition in angular coordinates and finite differences in radius. The spherical harmonic coefficients are discretized in 800 unevenly spaced grid points guaranteeing a sufficiently high sampling density in the boundary layers. Self-gravitation and the Coriolis force are included. The thickness of the ocean is varied from 10 m to about 50 km and its viscosity is considered in the range 1–106 Pa s. Calculations are performed for two end-member cases, recently discussed in literature: a weakly deformable elastic core and a highly deformable Maxwell viscoelastic core [7].
Results and Conclusion
Our results confirm the conclusions of previous studies that tidal dissipation in the present day ocean on Enceladus is negligible compared to the expected heat production [e.g., 8]. However, unlike some previous models, we find less pronounced resonance peaks, suggesting that the mechanical coupling between the ocean and the solid parts of the moon tends to reduce the resonance effects. Our results indicate that dissipation in the ocean strongly depends on the ocean thickness, reaching the maximum value for a thickness of 1 km when the ocean viscosity is 106 Pa s and less than 0.1 km when the viscosity is smaller 10 Pa s. The maximum dissipation predicted in the ocean (1 GW for the weakly deformable core and 20 GW for the highly deformable core) is independent of the viscosity prescribed in the ocean. This suggests that although the tidal dissipation currently plays a negligible role in Enceladus’ heat budget, it can effectively hinder the freezing of the ocean when the ocean is thin.
References
[1] Tyler, 2011, Icarus 211, 770–779.
[2] Chen et al., 2014, Icarus 229, 11-30.
[3] Matsuyama, 2014, Icarus 242, 11–18.
[4] Hay and Matsuyama, 2019, Icarus 319, 68–85.
[5] Rovira-Navarro et al., 2019, Icarus 321, 126–140.
[6] Rekier et al., 2019, J. Geophys. Res.: Planets 124, 2198–2212.
[7] Choblet et al., Nat. Astr. 1, 841–847.
[8] Čadek et al., Icarus 319, 476–484.
How to cite: Aygün, B. and Čadek, O.: A new approach to modeling the tidal dissipation in subsurface oceans of icy moons of Jupiter and Saturn, Europlanet Science Congress 2022, Granada, Spain, 18–23 Sep 2022, EPSC2022-968, https://doi.org/10.5194/epsc2022-968, 2022.
Since being first visited by the spacecraft Cassini in 2005, the Saturnian moon Enceladus has attracted far more attention than could be guessed from its modest size and lack of atmosphere, compared to its giant neighbour Titan. The reason for this state of affairs is the surprising geophysical activity observed at Enceladus’s south pole: a large thermal anomaly crossed by parallel faults ejecting huge plumes of water vapour and icy particles. From the start, it has been suspected that this anomalous activity results from solid tides caused by the eccentricity of the orbit, although the localisation of the heat source remains a puzzle. The simplest explanation consists in dissipating energy either within the icy shell or in the subsurface ocean, but it fails by more than one order of magnitude to match the measured power or to account for the 20 km-thickness of the icy shell. Dissipation within the core could provide enough power if the core is very soft, but this assumption is hardly consistent with laboratory measurements of material properties.
Alternatively, power could be episodically released if the orbit undergoes periodic variations. Enceladus and the neighbouring moon Dione are currently in a 2:1 mean motion resonance. This mechanism protects their orbital eccentricities against damping due to dissipation within the satellites, while it does not forbid periodic variations of the eccentricity around a long-term equilibrium value. Coupling orbital evolution to dissipative eccentricity tides is however not sufficient to induce significant variations of the orbit and thermal output. Besides eccentricity tides, libration is another cause of viscoelastic deformations. Although libration now contributes little to Enceladus’s energy budget, its amplitude is enhanced by a free libration mode as the icy shell decreases in thickness, and could thus become the major contributor to dissipation if the shell is thin enough. We report here the results of a thermal-orbital evolution model including eccentricity tides and libration of a viscoelastic icy shell above a subsurface ocean.
How to cite: Beuthe, M., Rivoldini, A., Baland, R.-M., and Van Hoolst, T.: Thermal-orbital evolution of a librating Enceladus, Europlanet Science Congress 2022, Granada, Spain, 18–23 Sep 2022, EPSC2022-1042, https://doi.org/10.5194/epsc2022-1042, 2022.
The María de Maeztu Academy of the Centro de Astrobiología is a two year-long (2019-2020, 2020-2021), tailor-made capacity-building activity implemented within the frame of the “Maria de Maeztu” excellence programme. It aims to strengthen and develop new capacities and stimulate the training of young researchers. The first edition of the transdisciplinary challenges is a training activity of the María de Maeztu Academy intended to develope new skills and generating relevant scientific-technical solutions in the field of Astrobiology. The training program started in September 2021 by forming teams with volunteers from different CAB and INTA departments and different areas of expertise. Throughout 2020-2021, several periodic reviews of the proposals were carried out, passing different milestones and receiving expert comments in each evaluation. Then, the CAB’s MdM Executive Committee decided to financially support the four teams to develop the proposed projects in the 2021/2022 academic year, until the end of the María de Maeztu programme. One of those challenges is “NEXT (iN situ EXploration of planeTary objects): EUROPA” and its objective is to identify the optimal Raman technique for the exploration of the surface of Jupiter´s moon Europa in future missions:
- conducting tests of various Raman techniques (using both commercial and flight models) on representative samples from Europa
- characterizing these samples with the different Raman techniques
- generating a database of pros and cons of each technique, which can minimize risks and optimize expected results

Figure 1 - “NEXT (iN situ EXploration of planeTary objects): EUROPA” logo
In the search for life on other bodies within the Solar System, the top candidates are the icy moons, including Saturn’s moon Enceladus and Europa. These icy moons are target of study as they will help us in the task of assessing possible habitability zones in our neighborhood.
The choice of instruments that can answer these questions and also allow us to understand other factors is key. Raman spectroscopy has the versatility to be used to obtain those answers. It has been widely used in the analysis of terrestrial and planetary samples due to its advantages in rapid and non-destructive analysis of the mineralogy and mineral chemistry of rock and/or soil samples. For planetary explorations it exhibits great potentials for unambiguous phase identification due to its narrow and non-overlapping peak profiles, fast analysis without sample preparations, robust behavior and low mass, etc.
To achieve the stated objectives, a work plan has been established in different stages, subdivided into three phases:
- Samples preparation
- Tests conduction of various Raman techniques on the samples (first is carried out exclusively at the INTA facilities and in the second, the collaborating laboratories will take part)
- Analysis of the test results and database generation of pros and cons of each technique
The samples prepared consist in a saline solution with a molecular organic component. The salt used was MgSO4 that was detected by the Galileo mission [1]. The organic molecule selected was the amino-acid alanine. This amino-acid was discovering in several meteorites as the Murchison meteorite [2]. The sample solutions were prepared with proportions in weight of 5, 10 and 17 % for the salt, and 0.5, 1.0 and 1.5 for the alanine.
The following figures show the multisamples compositions of the nine samples (1 to 9), as a result of the prepared sample vials.

Figure 2 - Multisamples concentrations
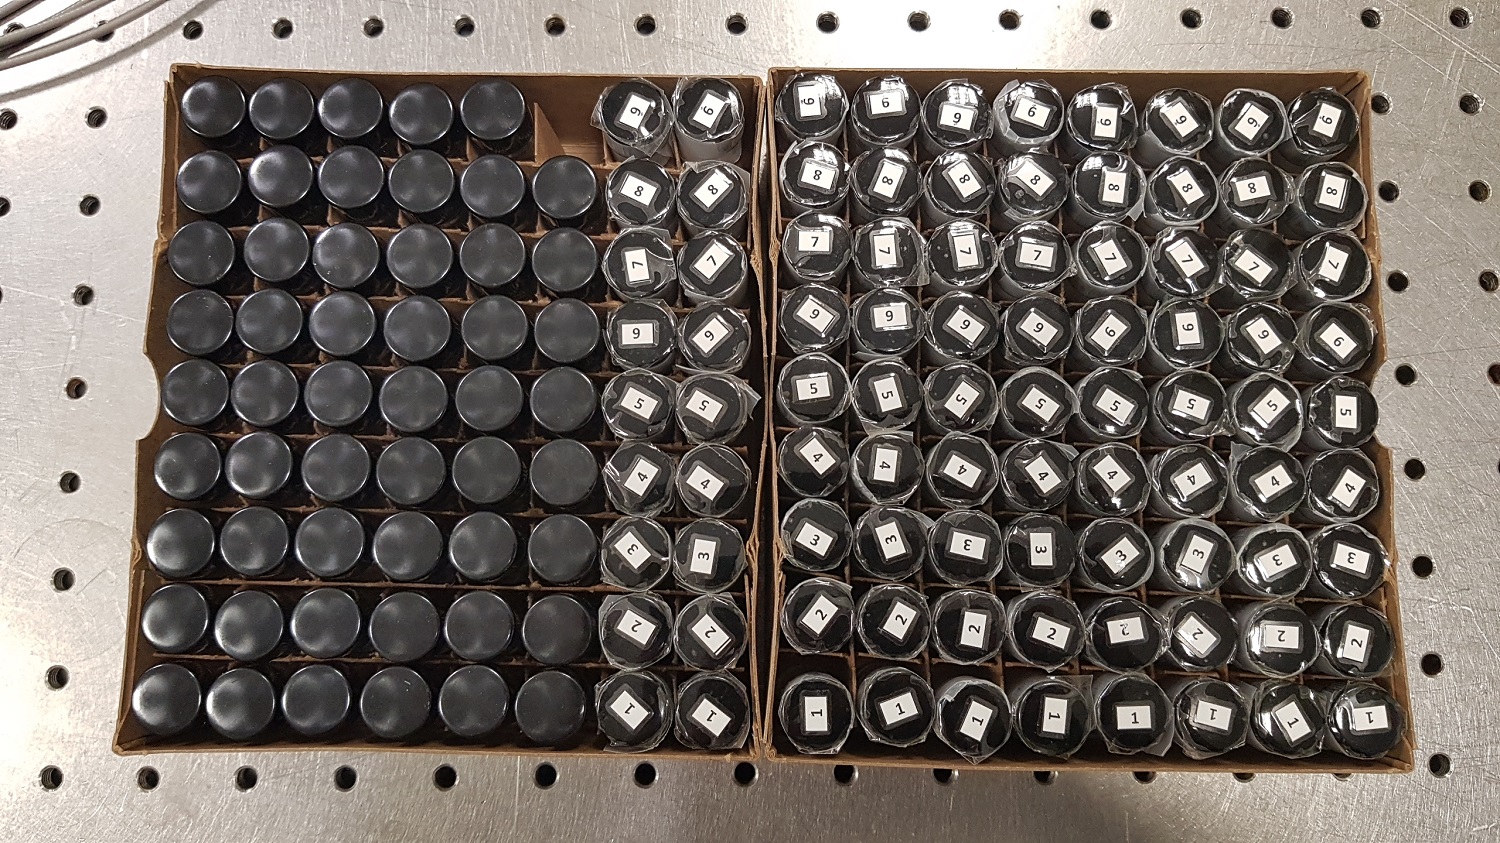
Figure 3 - Prepared multisamples vials
In the second phase, the prepared samples will be analysed in liquid and frozen state with different Raman technologies in four laboratories including the ExoMars RLS [3] Flight Spare model located at INTA. RLS [4] was the first Raman spectrometer qualified for space applications. This phase will be completed in June 2022.
The laboratories where the tests will take place together with the Raman technology to be tested are as follows:
- Centro de Astrobiología (CAB): iHR550 Horiba with an in-situ 532nm laser and portable i-Raman BWTEK with an in-situ 532nm laser
- INTA: ExoMars RLS Flight Spare (in-situ visible green laser). GSE (control and scientific analysis) automated by SW
- University of Valladolid: Raman in-situ Exemplar® Plus LS High Performance Spectrometer with an 785nm (IR) laser and Raman with remote pulsed laser
- Instituto de Micro y Nanotecnología (IMN): LabRaman HR with two possibilities: 532 nm Solid State Diode Laser and 632 nm (HeNe) Solid State Diode Laser
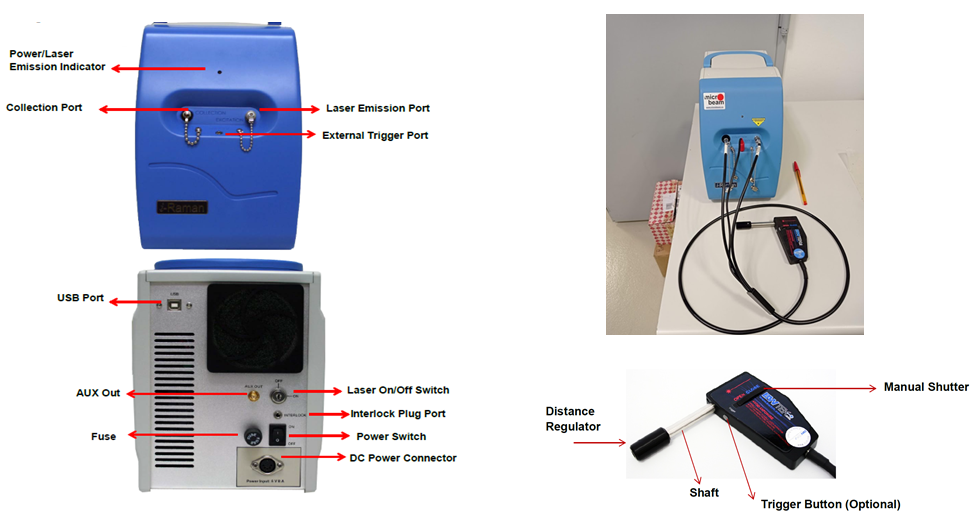
Figure 4 - portable i-Raman BWTEK at CAB facilities
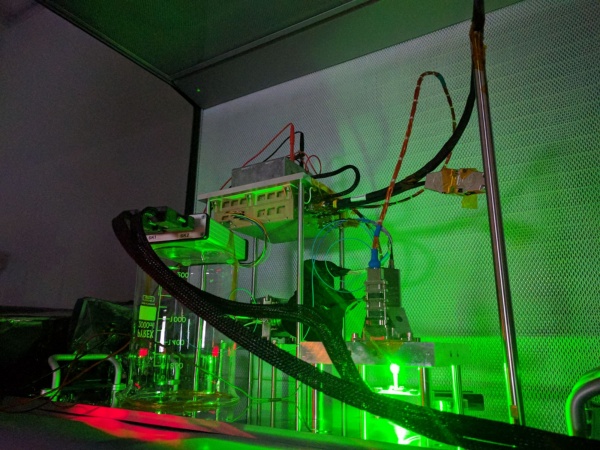
Figure 5 - RLS Flight Spare Model at INTA facilities
With all the information provided by the Raman tests with Raman technology, an analysis of the results will be carried out in July 2022 and conclusions will be issued on the different techniques used to determine and argue which technology (remote or in-situ Raman technology, which excitation laser wavelength: visible / infrared spectrum) would be the most suitable for meet the scientific requirements to address whether life exists or has ever existed in Europa.
[1] Thomas B. McCord, Gary B. Hansen, Jean-Philippe Combe, Paul Hayne, Hydrated minerals on Europa’s surface: An improved look from the Galileo NIMS investigation, Icarus, Volume 209, Issue 2, 2010, Pages 639-650
[2] Engel, M., Nagy, B. Distribution and enantiomeric composition of amino acids in the Murchison meteorite. Nature 296, 837–840 (1982)
[3] Rull, F., et al, The Raman Laser Spectrometer for the ExoMars Rover Mission to Mars, Astrobiology, 2017, vol. 17(6-7), 627-654
[4] Moral, A.G., et al, A Raman Spectrometer for the ExoMars 2020 Rover, European Planetary Science Congress 2017, 17-22 September, 2017, Riga Latvia, id. EPSC2017-1001
How to cite: Zafra, J., Ercilla, O., Sanz, R., Benito, M., Rodriguez Prieto, J. A., Cabrero, J., Moral, A., Prieto Ballesteros, O., and Estrada, A.: “NEXT (iN situ EXploration of planeTary objects): EUROPA”, a challenge to identify the best Raman technique to explore the surface of Jupiter's moon Europa for future missions., Europlanet Science Congress 2022, Granada, Spain, 18–23 Sep 2022, EPSC2022-1088, https://doi.org/10.5194/epsc2022-1088, 2022.
Abstract
The Europa Imaging System (EIS; Fig. 1) for NASA's Europa Clipper Mission combines a narrow-angle camera (NAC) and a wide-angle camera (WAC) to explore Europa and address high-priority geology, composition, ice shell and ocean science objectives. Both cameras have framing and pushbroom imaging capability, including broadband color filters. EIS data will be used to generate: cartographic and geologic maps; regional and high-resolution topography; GIS, color, and photometric data products; a database of plume-search observations; and control points tied to radar altimetry. Our science goals are to:
- constrain the formation processes of landforms by characterizing geologic structures, units, and global cross-cutting relationships;
- identify relationships between surface and sub-surface structures and potential near-surface water detected by ice-penetrating radar;
- investigate compositional variability between and among landforms and correlate composition be-tween individual features and regional units;
- search for evidence of recent or current activity, including potential erupting plumes;
- constrain ice-shell thickness from global shape measurements via limb fits;
- characterize surface clutter (off-nadir surface reflections that may appear to be subsurface interfaces) to aid interpretation of deep and shallow radar sounding;
- characterize scientifically compelling landing sites and hazards by determining the nature of the surface at meter scales.
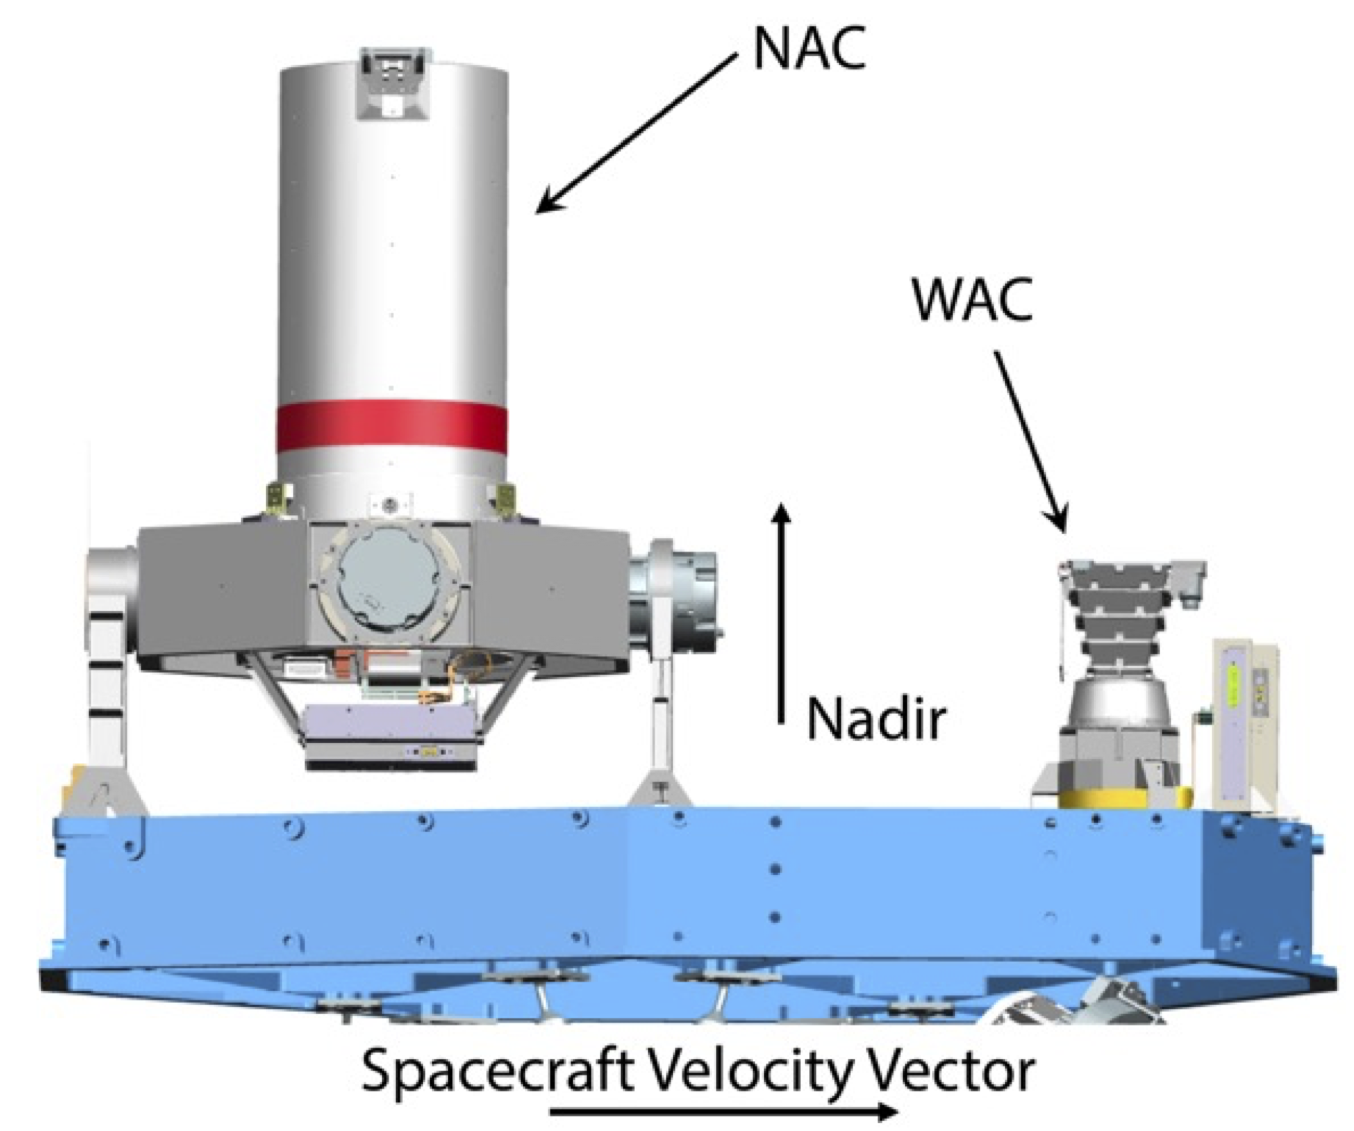
Figure 1: EIS NAC (left) and WAC (right) on the spacecraft nadir deck. The NAC is mounted on a 2-axis gimbal. The DPUs are in the spacecraft vault.
EIS Narrow-angle Camera (NAC)
The NAC has a 2.3° x 1.2° field of view (FOV) with a 10-μrad instantaneous FOV (IFOV), and from an altitude of 50-km achieves 0.5-m pixel scale over a 2-km-wide swath. Its 2-axis gimbal, ±30° cross- and along-track, enables targeting independent of spacecraft orientation, allowing near-global (>90%) mapping of Europa at ≤100-m pixel scale (to date, only ~14% of Europa has been imaged at ≤500 m/pixel), as well as regional stereo imaging. The gimbal slew rate is designed to be able to perform very high-resolution stereo imaging from as close as 50-km altitude during high-speed (~4.5 m/s) flybys to generate digital topographic models (DTMs) with ≤4-m ground sample distance (GSD) and ≤0.5-m vertical precision. The NAC will also perform high-phase-angle observations to search for potential erupting plumes; a pixel scale of 10 km from 106 km range means that the NAC can take advantage of good illumination geometry for forward scattering by potential plumes even when the spacecraft is distant from Europa.
EIS Wide-angle Camera (WAC)
The WAC has a 48° x 24° FOV with a 218-µrad IFOV, and is designed to acquire 3-line pushbroom stereo and color swaths along flyby ground-tracks. From an altitude of 50 km, the WAC achieves 11-m pixel scale over a 44-km-wide swath, generating DTMs with 32-m GSD and 4-m vertical precision. These data also support characterization of surface clutter for interpretation of radar deep and shallow sounding.
Detectors and Electronics
The cameras have identical rapid-readout, radiation-hardened 4k x 2k CMOS detectors and can perform both pushbroom and framing imaging. Color observations are acquired by pushbroom imaging using six broadband filters (Table 1; Fig 2), allowing mapping of surface units and correlation with geologic structures, topography, and compositional units from other instruments. Radiation-hard data processing units (DPUs) take advantage of the CMOS rapid, random-access readout and use real-time processing for pushbroom imaging, including: WAC 3-line stereo, digital time delay integration (TDI) to enhance signal-to-noise ratios (SNR), and readout strategies to measure and correct jitter.
Table 1: NAC and WAC broad-band, stripe filters
|
Filter |
Wavelength (nm) |
Key Uses |
|
Clear |
NAC: 350–1050 WAC: 370–1050 |
Mapping, stereo, context imaging, best SNR for faint targets, e.g., plume searches |
|
NUV |
NAC: 355–400 WAC: 375–400 |
(See Figure 2) |
|
BLU |
380–475 |
(See Figure 2) |
|
GRN |
520–590 |
(See Figure 2) |
|
RED |
640–700 |
(See Figure 2) |
|
IR1 |
780–920 |
(See Figure 2) |
|
1µm |
950–1050 |
(See Figure 2) |
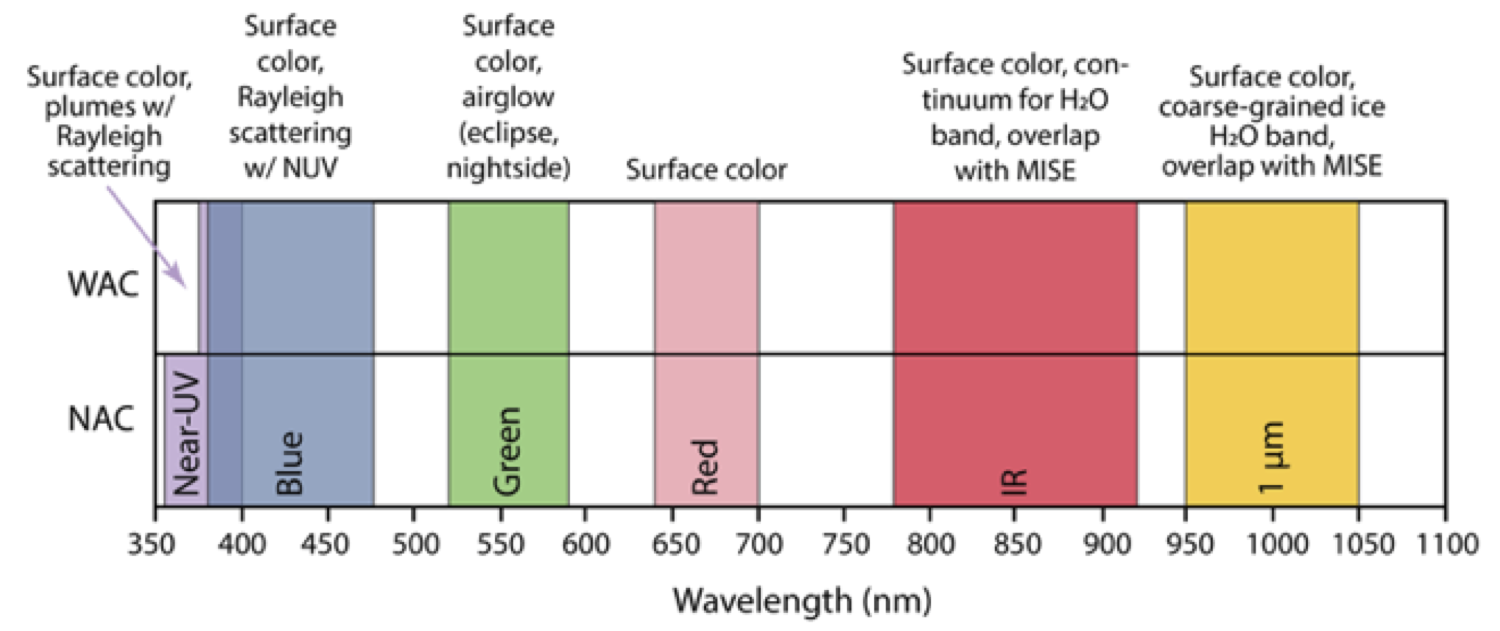
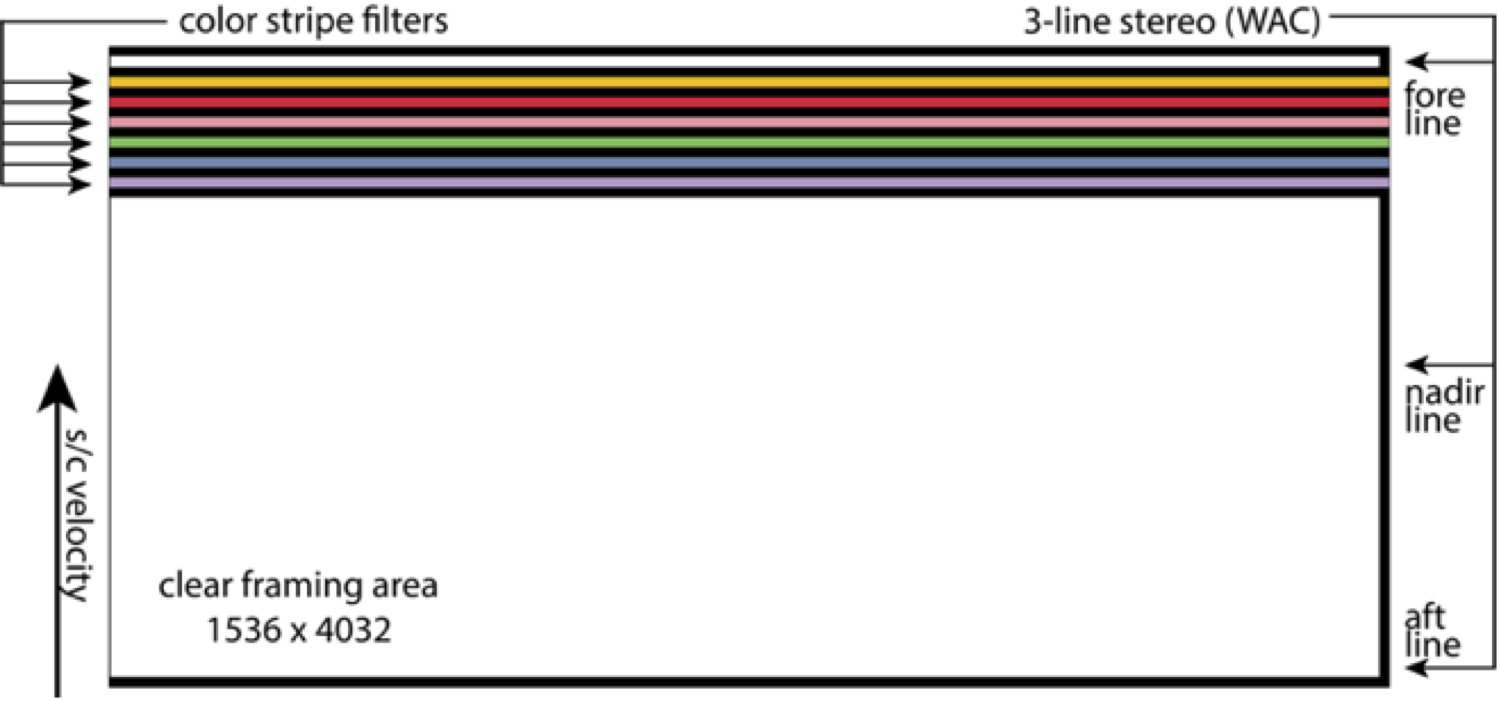
Figure 2: EIS broadband filter wavelengths (top) and WAC filter layout (bottom).
Summary
EIS data sets and collaborative science with other investigations will provide insight into Europa’s global geology, ice shell, and the potential for recent or current activity, to fulfill the goal of exploring Europa to investigate its habitability. Updates will be provided on flight instrument performance from ground testing and expected datasets from the planned tour at Jupiter.
How to cite: Turtle, E. and McEwen, A. and the EIS Team: The Europa Imaging System (EIS): High-Resolution, 3-D Insight into Europa’s Geology, Ice Shell, and Potential for Current Activity, Europlanet Science Congress 2022, Granada, Spain, 18–23 Sep 2022, EPSC2022-598, https://doi.org/10.5194/epsc2022-598, 2022.
1. Introduction
With a launch readiness date of late 2024, NASA’s Europa Clipper will set out on a journey to explore the habitability of Jupiter’s moon Europa. Among others, observations by Europa Clipper’s in-situ instruments will provide an understanding of the satellite’s interior structure and compositional makeup. The variability of Jupiter’s magnetic field at Europa induces electric currents within the moon’s conducting ocean layer, the magnitude of which depends on the ocean’s location, extent, and conductivity. Europa is also embedded in a flow of corotating plasma, which continuously impacts and sputters the surface to produce the moon’s atmosphere. In addition, micrometeorite impacts eject particles of the surface to wrap Europa in a cloud of dust. The neutral atmosphere is readily ionized by energetic particles to produce an ionosphere, which gives rise to current systems electromagnetically connecting Europa to Jupiter. The in-situ instruments comprise the Europa Clipper Magnetometer (ECM), the Plasma Instrument for Magnetic Sounding (PIMS), the SUrface Dust Analyzer (SUDA), and the MAss Spectrometer for Planetary Exploration (MASPEX). We present the highlights of these instruments’ development on their path to delivery to assembly, test, and launch operations (ATLO), which have begun in March 2022.
2. Relevant Investigations
2.1. Europa Clipper Magnetometer
The Europa Clipper Magnetometer (ECM) will measure magnetic fields generated by currents induced in Europa’s subsurface ocean and the electromagnetic coupling of the moon to Jupiter. Jupiter’s tilted dipole magnetic field and Europa’s eccentric orbit expose the moon to time-varying magnetic fields inducing eddy currents in the ocean. By measuring the induced field response at multiple frequencies, the ice shell thickness and the ocean layer thickness and conductivity can be uniquely determined. The ECM consists of three fluxgate sensors mounted on an 8.5-m-long boom and a control electronics hosted in a vault shielding it from radiation damage. The use of three sensors allows for dynamic removal of higher-order spacecraft-generated magnetic fields. The flight-model (FM) sensors (Figure 1) have been delivered to Instrument Integration and Testing, and the instrument is awaiting calibration in the fall of 2022.

Figure 1. ECM FM fluxgate sensor.
2.2. Plasma Instrument for Magnetic Sounding
The Plasma Instrument for Magnetic Sounding (PIMS) will measure ions and electrons in Europa’s ionosphere to quantify magnetic fields associated with electric currents driven by dynamic pressure gradients, which are produced by the interaction of corotating Jovian plasma with Europa and its neutral atmosphere. PIMS will further measure the particle population precipitating onto Europa to model surface sputtering rates and constrain the effects of space weathering. In addition, PIMS will characterize the distribution of electrons carrying field-aligned currents coupling Europa to Jupiter’s ionosphere. The PIMS instrument consists of two sensors each hosting two Faraday cups with a 90° field of view. The instrument measures electrons and ions with energies of up to 2 keV and 7 keV/q, respectively, with an energy resolution of <15% and a temporal resolution of 1−4 s. The instrument, including sensor assemblies (Figure 2), is scheduled for delivery to ATLO in June 2022.

Figure 2. PIMS FM Fully Integrated Sensor Assemblies
2.3. Mass Spectrometer for Planetary Exploration
The MAss Spectrometer for Planetary Exploration (MASPEX) measures trace neutral species to determine the composition of Europa’s atmosphere. The atmosphere is produced by particles sputtering off the surface, is augmented by possible contributions from plumes, and is altered by radiolysis. MASPEX will determine the distribution of major volatiles and key organic compounds with respect to latitude and longitude, altitude, solar local time, and will distinguish endogenic and exogenic sources. MASPEX is a multi-bounce time-of-flight mass spectrometer for species with atomic mass ranging from 2 to 500 u. The instrument’s mass resolution m/Dm of 4275 at mass 50 enables measurement of individual fragment ions generated by electron impact ionization of parent molecule. The FM instrument is presently undergoing testing (Figure 3) and is scheduled for delivery to ATLO in August 2022.
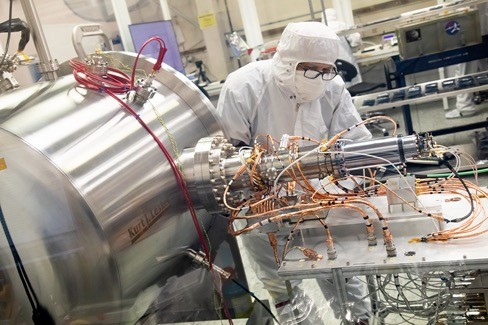
Figure 3. Testing of FM MASPEX instrument.
2.4. Surface Dust Analyzer
The SUrface Dust Analyzer (SUDA) will map the chemical composition of particles ejected from Europa’s surface by hypervelocity impacts of micrometeoroids. The dust particles have a typical size of 0.5−1 μm and exhibit a near isotropic distribution and only weak temporal variations. Small fluctuations are expected from variability of exogenous sources, resulting, e.g., from the orbital motion of sources on Io and the stochastic nature of volcanic activity. SUDA is a time-of-flight mass spectrometer for species with atomic mass ranging of up to 200 u and is capable of detecting up to 40 ejecta per second. Owing to the deterministic nature of the ballistic trajectories of the ejected particles, the composition measurements at spacecraft altitude can be correlated with geologic features on the surface. It has been demonstrated that trace amounts of complex organic species embedded in ice grains with abundances <0.1 ppm can be detected. In addition to micrometeorite ejecta, SUDA will measure the makeup of potential plumes by directly sampling microscopic particles. The FM sensor assembly (Figure 4) will be delivered to ATLO in August 2022 as part of the instrument.

Figure 4. SUDA FM sensor assembly.
3. Mission Concept
The current mission design consists of 49 flybys of Europa executed over a ~3.5 year period while the spacecraft is in orbit about Jupiter. The altitudes of closest approach typically range from 25 km to 100 km. The tour is divided into two principal campaigns, visiting first the anti-Jovian hemisphere followed by observations of the sub-Jovian hemisphere. The flybys occur over a wide range of latitudes and longitudes (Figure 5), and they are widely distributed in true anomaly and solar local time. The tour is thus well suited for characterization of the ice shell and ocean and of the atmosphere and ionosphere created through Europa’s interaction with Jupiter’s magnetosphere.
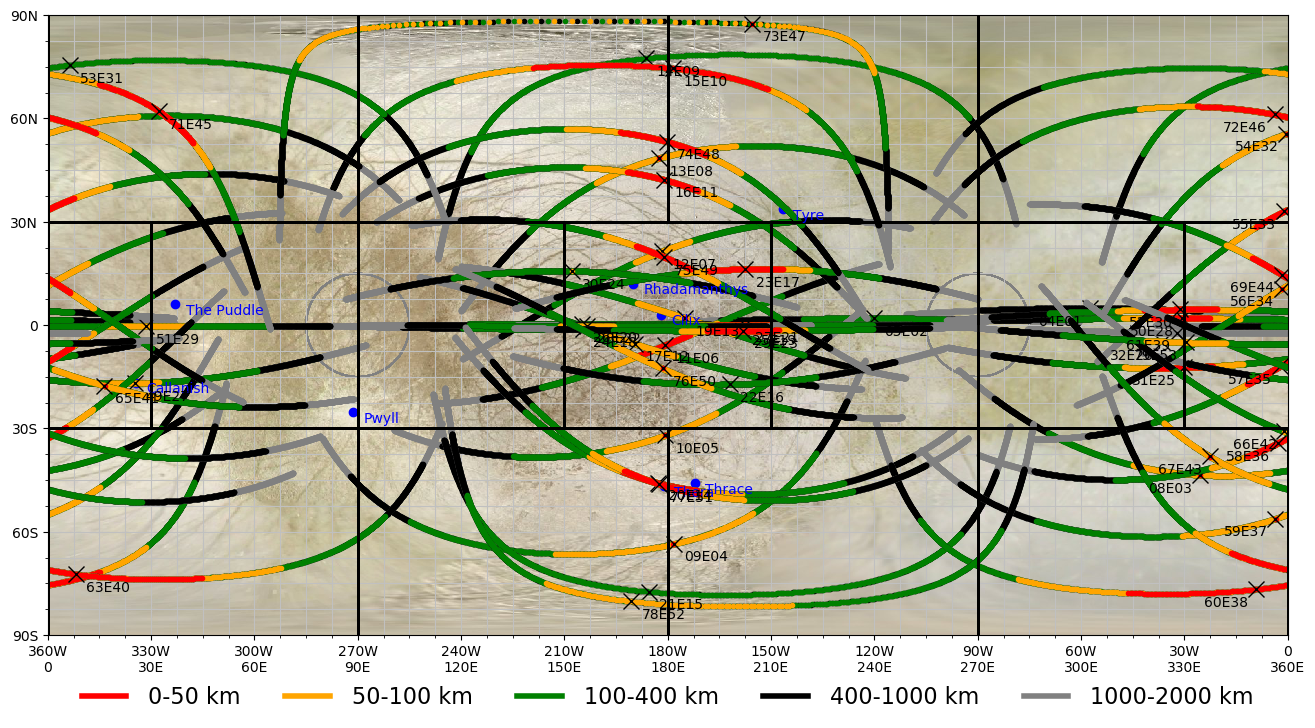
Figure 5. Planned Europa Clipper close approach ground tracks below 1000 km altitude (black), 400 km (green), 100 km yellow, and 50 km (red).
How to cite: Korth, H., Pappalardo, R., Buratti, B., Kempf, S., Kivelson, M., Burch, J., and Westlake, J.: In-situ Investigations of the Europa Clipper Mission, Europlanet Science Congress 2022, Granada, Spain, 18–23 Sep 2022, EPSC2022-429, https://doi.org/10.5194/epsc2022-429, 2022.
Introduction: The habitability of Europa is a property within a system, with many interdependent physical and chemical parameters, among a number of processes, of which no single measurement or investigation can characterize. Therefore, investigating Europa as an integrated system must occur to understand the complete picture. To accomplish this, the Europa Clipper mission has three main mission objectives to assess Europa’s habitability: (1) characterize the Ice Shell and Ocean: including their heterogeneity, properties, and the nature of surface–ice–ocean exchange; (2) characterize the Composition: understanding Europa’s ocean through investigations of the composition and chemistry; (3) and characterize the Geology: including surface features and high-science-interest localities. Europa Clipper will also assess any current or recent activity by searching for evidence of thermal anomalies and plumes and will perform high resolution observations to provide reconnaissance for a future potential landed mission. Synthesizing the mission’s science measurements in such a way as to constrain Europa’s habitability is a complex task and is being guided by the Habitability Assessment Board (HAB).
The HAB is charged with providing a high-level, cross-instrument and cross-discipline, habitability-driven science perspective. All members of the Europa Clipper Science Team are considered members of the HAB and so contribute to addressing the overarching goal of the mission. Rotating members of the science team serve as leadership of the HAB and convene regular meetings to discuss and formulate recommendations to the project’s science leadership. Particularly, HAB works to connect activities and measurements across the Europa Clipper Geology, Composition, and Interior Working Groups to investigate habitability and can recommend formation of focus groups of experts on the team to address scientific and technical problems related to habitability.
System Science: To achieve mission level 1 requirements and assess Europa’s habitability, investigations will contribute observations towards science themes. Themes that support the Ice Shell and Ocean characterization include Full Depth Subsurface Exchange, Shallow Subsurface Structure, Ice Shell Properties, and Ocean Properties. For Composition characterization, themes that contribute include Global Composition Surface Mapping, Regional Composition, Atmospheric Composition, and Space Environment Composition. The Geology objective has contributions of Global Surface Mapping, Landform Geology, and Local Scale Surface Properties (which also contributes to reconnaissance). Current activity is supported by Remote Plume Search (and Characterization, if applicable), In-Situ Plume Search (and Characterization, if applicable), Surface Thermal Anomaly Search, and Surface Activity Evidence.
Current Activity: Searches for and characterization of any recent activity would greatly contribute to assessing Europa’s habitability. Europa Clipper plans observations for potential activity through remote observations including: the Europa-Ultraviolet Spectrograph (Europa-UVS) instrument through occultations, aurora, and UV scans; the Europa Imaging System (EIS) Narrow Angle Camera (NAC) through high resolution imaging; and the Europa Thermal Imaging System (E-THEMIS) through thermal infrared mapping. Additionally, in-situ measurements by the SUrface Dust Analyzer (SUDA) will also make observations of activity through detections of positive and negative ions and characterization of particle compositions and their locations of origin on the surface. Contributions by the other instruments will also inform on current/recent activity through remote and in-situ observations through magnetic, plasma, radar, and compositional measurements.
Remote observations to search for (and characterize if present) current activity at Europa by ground based, near-earth orbiting observatories, and other spacecraft could also occur, even while Europa Clipper is in transit to Jupiter. Recent observations by the Hubble Space Telescope (HST) have made putative detections of plume activity at Europa (Roth et al., 2014; Sparks et al., 2016) and future observations by the James Webb Space Telescope (JWST) and ground-based observatories may be able to confirm these findings. JWST can make measurements in the mid-infrared, for which the Galilean moons are relatively poorly characterized, enabling further constraints on composition and mechanisms driving the activity. Other observatories including the Very Large Telescope (VLT), the Atacama Large Millimeter/submillimeter Array (ALMA), and measurements by the Juno spacecraft and future JUICE mission could all contribute further to assessing Europa’s potential activity and habitability. The Europa Clipper science team is currently working to informally coordinate efforts with the JUICE team to enhance our science as possible at Europa on a non-interference basis.
Summary: Europa Clipper will assess the habitability of Europa as a system, guided by the HAB, through the synergy of multiple measurements and incorporation of remote observations by JWST and other remote observatories and spacecraft. Potential detections (and subsequent characterization) of any activity would greatly contribute to understanding Europa’s habitability and potential to harbor life. Discovery awaits!
References:
Roth et al. (2014), Transient water vapor at Europa’s south pole. Science, 343(6167), 171-174.
Sparks et al. (2016), Probing for evidence of plumes on Europa with HST/STIS. The Astrophysical Journal, 829(2), 121.
Acknowledgments: This work was supported by NASA through the Europa Clipper Project. Portions of this work were performed at the Jet Propulsion Laboratory, California Institute of Technology, under contract with the National Aeronautics and Space Administration.
How to cite: Craft, K., Pappalardo, R., Vance, S., McKinnon, W., Korth, H., Buratti, B., Daubar, I., Howell, S., Klima, R., Leonard, E., Matiella Novak, A., and Phillips, C.: Is Europa Active and Suitable for Life? - How Europa Clipper and its Habitability Assessment Board (HAB) are working to synthesize observations to characterize Europa and its potential activity., Europlanet Science Congress 2022, Granada, Spain, 18–23 Sep 2022, EPSC2022-768, https://doi.org/10.5194/epsc2022-768, 2022.
Jupiter’s moon Europa is a prime target in our exploration of potentially habitable worlds and of ocean worlds in the outer solar system. Europa’s subsurface ocean has likely existed for much of the history of the solar system and may provide a persistent, stable environment rich in the elements and energy needed for life. The ocean is likely in contact with a rocky, silicate seafloor. And, tectonic activity in the ice shell may allow oxidants produced at the surface via radiolysis to cycle into the ice shell and ocean below. All of these factors make Europa exploration key for both astrobiological and comparative oceanography goals.
Europa Lander is a mature mission concept that has brought together the expertise of scientists and engineers, across NASA centers, ESA centers and industry, who have extensive experience in both Outer Planets missions and landed Mars missions. A highly capable, partially autonomous lander weighing in excess of approximately 500 kg, would excavate into the Europan surface to directly acquire samples. The high-level science goals of Europa Lander are: (1) search for evidence of biosignatures on Europa, (2) assess the habitability of Europa via in situ techniques uniquely available to a lander and (3) characterize surface and subsurface properties of the ice shell. The lander would collect and process ≥3 separate samples, each at least 7 cm3 in volume, acquired from a depth of ≥10 cm. Using primary batteries, a lander could operate for 60 days or more on the surface.
To maximize the efficiency of the Lander and get the very best science from such a mission, the Europa Lander team has invested a significant amount of time and effort to study how the mission could operate on the surface. The mission could utilize a high degree of autonomy to continually sample the surface, process samples with the instrument payload, and relay data back to Earth. However, getting the most from this autonomy requires efficient interaction with the science and operations teams on the ground. The Europa Lander team has held multiple evaluations, called design simulations, that have explored how human scientists and engineers would interact with an autonomous spacecraft and respond to the discoveries that it makes as the mission unfolds. Groups of scientists and engineers, including members of the Europa Lander pre-project team, as well as people unaffiliated with the pre-project, worked through multiple scenarios, including the detection of nominally positive biosignatures, issues related to sampling arm access to tight spaces, and end-of-life decisions. Lessons learned during the simulations could help inform the operations team and serve to maximize science return.
Likewise, the team has explored how physical constraints imposed by the environment and by the spacecraft itself could impact scheduling details. These constraints include, but are not limited to, the length of the Europan night (42.5 hours), limited downlink bandwidth, thermal constraints on the spacecraft and battery life. The team investigated multiple conops scenarios to develop detailed, realistic timelines that depict all facets of spacecraft surface operations -- including uplink and downlink, sample excavation and transfer, data analysis, and even spacecraft-imposed sleep cycles -- under a variety of assumptions regarding the capabilities of the notional spacecraft and payload. The detailed strawman timelines that the team has produced convincingly demonstrate the feasibility of collecting, processing, and returning data from at least 6 samples, and possibly as many as 11 or more, to investigate Europa's habitability and search for biosignatures.
In this presentation, we will describe the detailed work by the Europa Lander team that will help enable Europa Lander science planning and operations to work seamlessly with an autonomous spacecraft in a unique environment.
This research was carried out at the Jet Propulsion Laboratory, California Institute of Technology, under a contract with the National Aeronautics and Space Administration (80NM0018D0004). Copyright: 2022. All rights reserved.
How to cite: Brooks, S., Hand, K., Blackwood, K., Bridge, C., Kim-Castet, S. Y., Laubach, S., Phillips, C., Pitesky, J. E., Reeves, G., and Tan-Wong, G.: Efficient Science Return at Europa: Advance Operations and Science Planning for the Europa Lander Mission, Europlanet Science Congress 2022, Granada, Spain, 18–23 Sep 2022, EPSC2022-755, https://doi.org/10.5194/epsc2022-755, 2022.
The Planetary Radio Interferometry and Doppler Experiment (PRIDE) technique utilize signal recording and processing technology developed originally for Very Long Baseline Interferometry (VLBI) to determine spacecraft lateral position in ICRF, as an extension of conventional radio-tracking techniques [1]. The essence of the PRIDE technique is in observing the spacecraft radio signal with a network of Earth-based radio telescopes. The PRIDE technique, developed at the Joint Institute for VLBI ERIC (JIVE), has been used for numerous experiments with several ESA planetary science missions. PRIDE has been selected by ESA as one of the eleven science experiments of the Jupiter Icy Moons Explorer (JUICE), the L-class mission scheduled for launch in 2023.
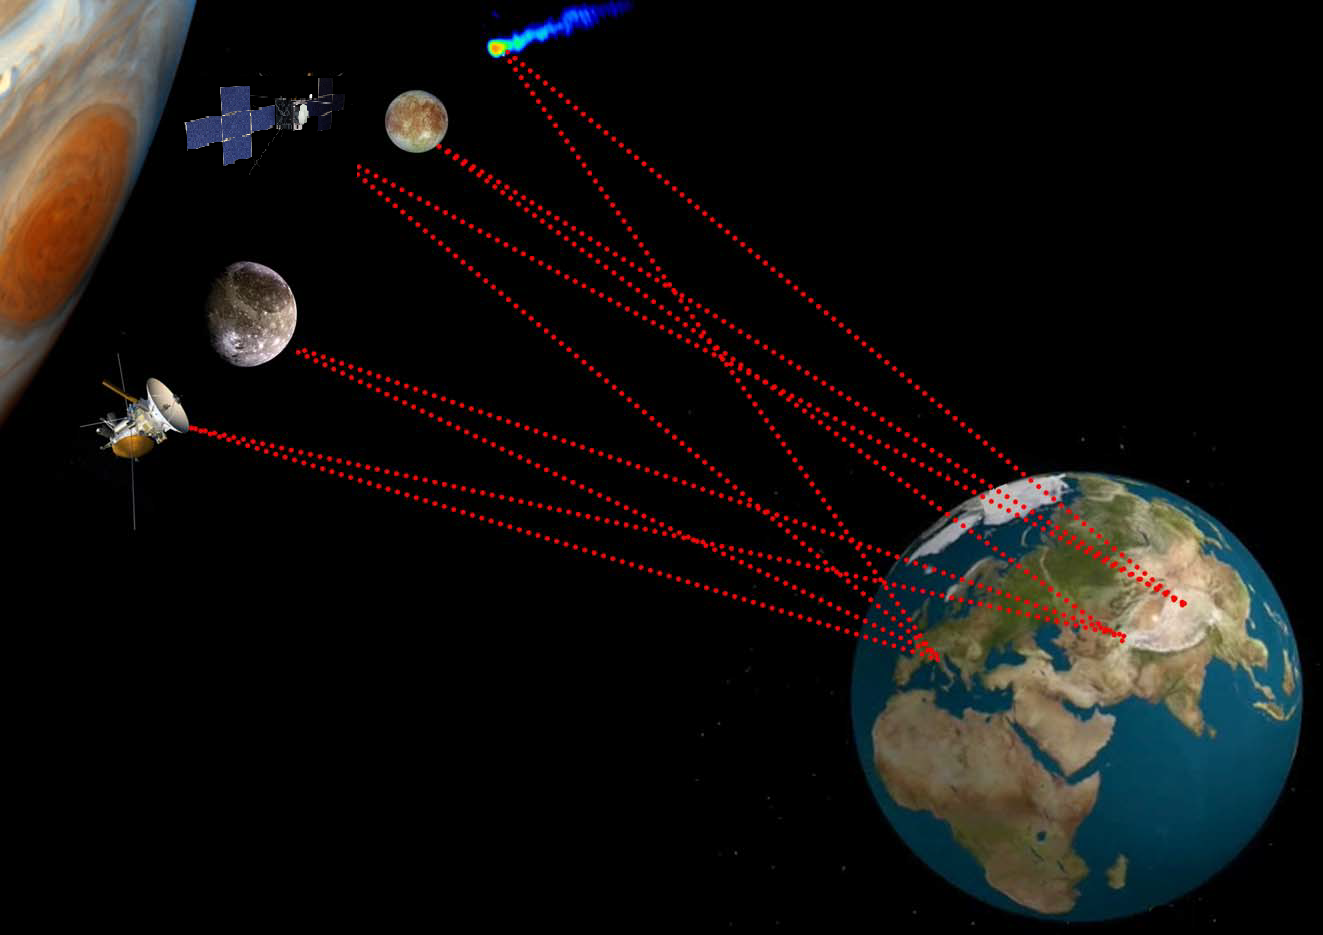
Figure 1: PRIDE Experiment for the JUICE Mission
The main observables of PRIDE are ultra-precise estimates of spacecraft lateral position based on the phase referenced VLBI tracking and radial Doppler measurements [3,7,8]. The methodology of PRIDE has been proven and validated with the ESA's Venus Express & Mars Express [1,2,4,7,8,9]. PRIDE will contribute to the determination of the JUICE spacecraft state vector and the improvement of the Galilean satellite ephemerides [4,5,10]. It is worth noticing the synergistic nature of PRIDE measurements to other key experiments of the JUICE mission, in particular addressing the major science goals of the mission.
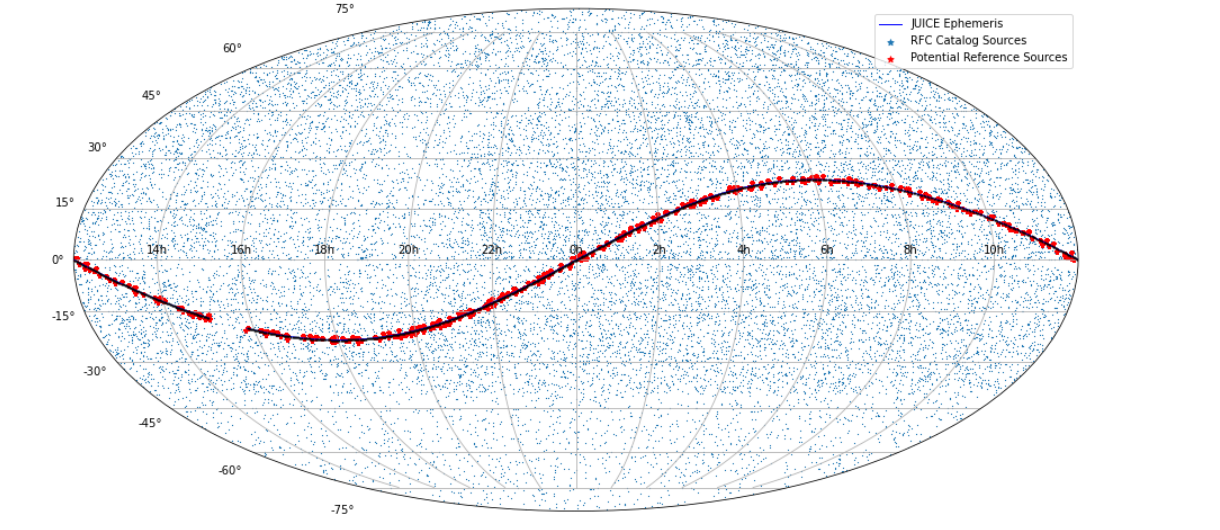
Figure 2: PRIDE Experiment Planning chart during the cruise phase of the JUICE Mission. Blue dots indicate celestial positions of radio sources with well-defined coordinates suitable for phase-referencing VLBI [reference on the Petrov's online catalogue]. Red dots show those potential reference sources located within 1 degree to the celestial track of the JUICE spacecraft.
The paper will describe the analysis and implementation of system engineering methodologies of the PRIDE inputs into the operational design of the JUICE mission. A particular emphasis will be given on cross instrumental analysis and consolidation of top synergies of PRIDE with other JUICE experiments using the ESA science planning tools. The paper will demonstrate advanced methods of efficient experiment planning and block scheduling. The identification of celestial areas of interest in near-field VLBI (PRIDE) observations of interplanetary spacecraft on all phases of their missions, especially during the cruise phase will also be covered in this paper.
References
1) D. A. Duev. et al.: Spacecraft VLBI and Doppler tracking: algorithms and implementation, Astronomy & Astrophysics, 541, A43, 2012
2) G. Molera Calves. et al.: Observations and analysis of phase scintillation of spacecraft signal on the interplanetary plasma". In: A&A 564, A4, 2014
3) D. A. Duev. et al.: Planetary Radio Interferometry and Doppler Experiment (PRIDE) technique: A test case of the Mars Express Phobos fly-by, Astronomy & Astrophysics, Vol. 593, 2016
4) Dirkx D. et al.: Dynamical modeling of the Galilean moons for the JUICE mission, Planetary and Space Science 134 (2016) 82–95
5) Dirkx D. et al.: On the contribution of PRIDE JUICE to Jovian system ephemerides, Planetary and Space Science, 14–27, 2017
6) G. Molera Calves. et al.: Analysis of an Interplanetary Coronal Mass Ejection by a Spacecraft Radio Signal: A Case Study, Space Weather, 15
7) T. M. Bocanegra-Bahamón. et al.: Planetary Radio Interferometry and Doppler Experiment (PRIDE) technique: A test case of the Mars Express Phobos Flyby II. Doppler tracking: Formulation of observed and computed values, and noise budget, Astronomy & Astrophysics, 609, A59, 2018
8) T. M. Bocanegra-Bahamón. et al.: Venus Express radio occultation observed by PRIDE, Astronomy & Astrophysics, 624, A59, 2019
9) G. Molera Calvés. Et a.: High spectral resolution multi-tone Spacecraft Doppler tracking software: Algorithms and implementations, Publications of the Astronomical Society of Australia (PASA), 2021
10) Fayolle et al., Decoupled and coupled moons’ ephemerides estimation strategies - Application to the JUICE mission, submitted to Planetary & Space Science, 2022
How to cite: Pallichadath, V., Cimò, G., Dirkx, D., Fayolle Chambe, M., I. Gurvits, L., Lainey, V., Molera Calvés, G., Masdiana Md Said, N., and Vermeersen, B.: Planetary Radio Interferometry and Doppler Experiment (PRIDE) with the JUICE mission as a case study, Europlanet Science Congress 2022, Granada, Spain, 18–23 Sep 2022, EPSC2022-342, https://doi.org/10.5194/epsc2022-342, 2022.
Context: Enceladus, an icy moon of Saturn, possesses an internal water ocean and geysers expelling ocean material into space. Cassini investigations indicated the ocean could be habitable and has a complex interaction with the rocky core. Further investigation of the composition of the plume formed by the geysers is necessary to fully understand the ocean, its possible habitability, and what it tells us about Enceladus’ origin.
Mission profile: Moonraker has been proposed as an ESA M-class mission designed to orbit Saturn and perform multiple flybys of Enceladus, focusing on traversals of the plume. Moonraker consists of an ESA-built platform, with strong heritage from JUICE (and Mars Sample Return for solar power), and carrying a suite of instruments dedicated to plume and surface analysis. The nominal Moonraker mission includes a 23-flyby segment, with the possibility of expanding the mission with additional similar segments, depending on available resources.
Objectives and expected impact: Moonraker is devoted to the investigation of i) the habitability conditions of present- day Enceladus and its internal ocean, ii) the mechanisms at play for the communication between the internal ocean and the surface of the South Polar Terrain, and iii) the formation conditions of the moon in the context of the formation of the Saturnian system. Moonraker, thanks to state-of-the-art instruments that represent a vast improvement over Cassini’s payload, would quantify the abundance of key species in the plume, isotopic ratios, and physical parameters of the plume and the surface. Such a mission would allow to solve the standing questions left by Cassini on the aforementioned topics as well as pave the way for a possible future lander mission.
How to cite: Mousis, O., Bouquet, A., Langevin, Y., André, N., Durry, G., Hartogh, P., Helbert, J., Iess, L., Kempf, S., Masters, A., Postberg, F., Renard, J.-B., Vernazza, P., Vorburger, A., and Wurz, P. and the Moonraker team: Moonraker - an Enceladus Multiple Flyby Mission Submitted to the ESA 2021 M-class Call, Europlanet Science Congress 2022, Granada, Spain, 18–23 Sep 2022, EPSC2022-329, https://doi.org/10.5194/epsc2022-329, 2022.
The NASA program exploring habitability places in the outer Solar System searches for simple forms of life in icy moons of Giant Planets, with internal oceans off thermal equilibrium between cold, iced surface and rocky center warmed, possibly by dissipation of tides from the Planet; H2O molecules might lose oxygen to reduced bottom minerals, and get oxygen back when moving upwards. This Ocean World concept was confirmed in Jupiter’s moon Europa, and Saturn’s moons Titan and Enceladus, the last one ejecting a local plume through ice, though not Titan, with the Europa-plume case apparently confirmed. In 2017, H2 molecules, considered sign of life, were detected at the Enceladus plume. We here propose a mission to explore the only large Neptune moon, Triton, which is usually considered an important Kuiper Belt Object as captured dwarf planet. More relevant, here, is that Voyager 2, in 1989, found evidence of Triton ejecting a kind of plume.
Ice Giants, however, have only received flyby missions, at difference with Gas Giants: An effective orbiter-type mission to faraway Neptune is acknowledged as extremely expensive, trip-average solar power is almost nil, chemical capture leads to high wet-mass, with scientific load and orbital maneuvers very constrained. NASA had set a nuclear reactor in space for on-board S/C power in April 1965 but afterwards, for safety considerations, it always used a Radioisotope Pu 238 power system (helpful in mission Cassini). In a sense constraints trade occurred in 2009, between proposed Triton missions a) with full modern technology but just a flyby (EPSC/Potsdam) and b) captured orbiter though with minimum technology (National Research Council / Planetary Science Decadal Survey). Aerocapture and Radioisotope, for propulsion and power, have been considered for Neptune missions, but decayed consideration.
Magnetic Solution to Power and Propulsion Issues
Icy moon missions could use, however, thin, multi-kilometer conductive tethers, with no power or propulsion needs, available to a S/C if passing near the planet. The planetary magnetic dipole allows free –thermodynamically dissipative- S/C capture, and afterwards maneuvering: The relative S/C velocity induces a motional electric field Em (in the tether frame) in the highly conductive plasma around, which polarizes the tether and drives a current I inside, with I ·Em > 0, the field B then exerting Lorentz drag on the current. Driving, however, was ineffective in tethers standard in the 90`s such as TSS1 and TSS1R, insulated all along, with a conductive sphere large enough at the anodic end, typically implying radius much greater than ambient Debye length and thermal electron gyroradius, strongly reducing electron collection. Bare tethers [1] eliminated sphere and insulation to allow electron collection over a resulting anodic tether segment, as a giant cylindrical Langmuir probe, in the optimal OML (orbital-motion-limited) regime. Laframboise and Parker [2] had proved that OML current to cylindrical probes of convex cross-section and equal perimeter p are equal. Thin tape cross-section will reduce tether mass when compared to an equal p tether with round cross-section. Bare tethers, which made standard tethers rapidly obsolete, will thus be characterized by all 3 dimensions, length, width and thickness, widely differing, allowing particular design easier.
Lorentz drag decreasing as the inverse 6th power of radial distance to dipole, capture periapsis would need be very close to the Planet. Keeping current on following capture would hardly affect it, whereas apoapsis could be lowered to finally reach 1:1 Laplace resonance of S/C and moon of interest.
Bare Tether Validation and Use
Bare-tether analysis was validated in early 2001 in an unintended way [3]. Measurements at the International Space Station involving 3 NASA Centers, NOAA/Boulder. Univ-Houston and SAIC, showed on-board plasma-contactors ejecting substantial electron current as if ISS structure had become very negative. Authors acknowledged in the Abstract that tensioning rods of solar array masts could collect ambient electrons as bare-wire tethers, with modeling “based upon J.R. Sanmartin’s bare-wire collection theory’, which was incorporated into the complex ISS computer code, Environment Work Bench, including models of Station, orbital motion, earth’s magnetic field, and ionosphere.
Further, in 2007, Vlasov-code simulations in the high–bias OML regime, at an Unuversity of Michigan PhD Thesis by E. Choinière on the electron density versus radial distance [4] were shown equal to a high approximation when compared [5] with detailed results from the bare-tether theory.
To date, the bare tether analysis has been applied in considering missions to moons Europa [6] and Enceladus [7], and to Ice Planet Neptune [8]}
References
[1] JR Sanmartin, M Martinez-Sanchez, E Ahedo, J. Prop & Power 9, 353-360, 1993
[2] JG Laframboise, LW Parker, Phys. Fluids 16 629-636, 1973
[3] EA Bering et al, Paper 2002-0935, 40th AIAA Aerospace Sciences Meeting and Exhibit, Reno, NV, 14-17 Jan 2002
[4] E Choinière, BE Gilchrist, IEE Trans on Plasma Science 35, 7-22, 2007
[5] JR Sanmartin, E Choinière, BE Gilchrist, J-B Ferry, M Martinez-Sanchez, IEE Trans in Plasma Science 36, 2851-2858, 2008
[6] JR Sanmartin et al, J. Prop & Power 33, 338-342, 2017
[7] JR Sanmartin, J Pelaez, Acta Astronautica 168, 200-203, 2020
[8] JR Sanmartin, J Pelaez, Acta Astronautica 177, 906-911, 2020
How to cite: Sanmartin, J. and Pelaez, J.: Exploring moon Triton, Europlanet Science Congress 2022, Granada, Spain, 18–23 Sep 2022, EPSC2022-39, https://doi.org/10.5194/epsc2022-39, 2022.
Please decide on your access
Please use the buttons below to download the presentation materials or to visit the external website where the presentation is linked. Regarding the external link, please note that Copernicus Meetings cannot accept any liability for the content and the website you will visit.
Forward to presentation link
You are going to open an external link to the presentation as indicated by the authors. Copernicus Meetings cannot accept any liability for the content and the website you will visit.
We are sorry, but presentations are only available for users who registered for the conference. Thank you.
Please decide on your access
Please use the buttons below to download the presentation materials or to visit the external website where the presentation is linked. Regarding the external link, please note that Copernicus Meetings cannot accept any liability for the content and the website you will visit.
Forward to session asset
You are going to open an external link to the asset as indicated by the session. Copernicus Meetings cannot accept any liability for the content and the website you will visit.
We are sorry, but presentations are only available for users who registered for the conference. Thank you.