
 ,,,,,
,,,,,- Roma Tre, Geology, Roma, Italy (andrea.apuzzo@uniroma3.it)
The ExoMars rover mission will be looking for biosignatures (i.e. signs of past and present life) in Oxia Planum, Mars [1]. The landing site is located between 16° and 19° N and 334° to 337° E where the ancient cratered terrains transition into the low-lying plains of Chryse Planitia. The area of interest is situated between Ares Vallis and Marwth Vallis in a wide basin at the outlet of Cogoon Vallis. The fractures, extensively spread over the terrains of the landing site, range from meters to decameters in spacing and length and have been preliminary interpreted as desiccation cracks or the result of burial and unloading of sediments [2,3]. We mapped these fractured terrains and we tested an automatic method for alignment tracing which contributes to our study in an effort to evaluate the directional aspects of fracturing and their spatial distribution within the study area.
The data we used come from VNIR pushbroom imager camera HiRISE, which produces the highest resolution images of the martian surface (25 to 60 cm/pixel) [4]. 31 greyscale HiRISE RED products (25 cm/pixels) and three HiRISE colour product (60 cm/pixel) covering the landing ellipse were selected and downloaded from the Planetary Data System (PDS) [5], and imported into QGIS (version 3.24.1 Tisler) [6]. To map these fractures over a submeter resolution basemap within the ≥1000 km2 landing ellipse area, we opted to use a 1:5000 scale. We mapped the boundaries of the fractured area as lines, generating category areas from the boundaries of the mapped area through the Mappy QGIS plugin [7]. We classified the fractures by their association with sand, dunes, TARs and ridges. Using the resulting map of the fractured terrains, we placed a 200 m2 Scan Area on a place where fracturing was more evident: we extracted HiRISE data that was input into the Slope Intersect Discrete Analysis (SID) software version 3.04-10 for automatic tracing of the fractures. The results of automatic tracing, whose algorithm is based on a modified Hugh transform [8], was further processed in to GRASS GIS [9]: the GRASS Toolset v.clean was used to snap vertices of SID output. To compare the manual and automatic methods, the Scan Area input by SID has been used to manually trace fractures at 1:1000 scale, whose orientation in the space was obtained using Daisy software version 3-5.51-3. The map of the fractured terrains was then used to place multiple Scan Areas where fracturing is more evident (Fig.2). The automatic fracture tracing method will be applied on other areas of interest in future studies.
We classified fractured terrains into three categories where we placed 28 Scan Areas (Fig.1) : we placed nine of them in terrains characterized mainly by fractures (MF, lower portion of the map), 10 in terrains associated with the presence of linear topographic rises (ridges) (RF, central portion of the map) and nine in fractured terrains with an abundance of sand and dunes (SF, upper portion of the map). 507 fractures were traced manually ranging 1.14-68.4 m in length (Fig.2, b). In the automatic method, SID mapped 1712 elements between 2 and 21 m in length (Fig.2, a). Regarding the directional Azimuth-Frequency analysis carried out by Daisy, the average orientation is very similar: fractures traced manually indicate a value of 92.26° (sd: 12.5°) and fractures traced via SID correspond to a value of 93.06° (sd: 15.97°) (Fig.2, a, b below).
The spatial distribution of fractures traced manually is homogeneous, including both the longest and the shortest fractures. The few areas where the absence of fractures is observed are those where there is a strong cover of sand. The longer fractures do not create intersections, if not with the shorter ones, which cross each other, forming small networks. The homogeneous distribution of manually traced fractures is the same as those traced unsupervised via SID. The differences instead occur mainly in the number and in the length of lines traced in the two methods: SID’s sensitivity to low variations of DN result in a greater number of identified fractures through segments with a defined minimum and maximum length. However, not all manually traced fractures have been identified by SID. No matter how efficient the GRASS GIS toolset is, fractures traced by SID too far apart from eachother were not considered a single element, which the human interpretation would have done. As far as orientation is concerned, the two methods show very similar values.
This study shows how, although the clear differences between manually and automatic method, the latter may prove to be efficient, even considering their limitations. SID’s fracture tracing in fact guarantees a strong effectiveness for the calculation of their orientations. Further analysis in the Scan Areas placed on the fractured terrains of the landing ellipse will verify whether or not there are anisotropies in the orientation of the fractures, which will help improve our knowledge about the formation and evolution of Oxia Planum.
References
[1] Vago et al.(2017), Astrobiology, Vol. 17, No. 6-7. [2] Quantin-Nataf et al. (2021) Astrobiology 21, 345. [3] Bowen et al. (2022) Planetary and Space Science Volume 2014. [4] McEwen et al. (2007) Journal of Geophysical Research: Planets Volume 112, [5] McMahon (1995) Planetary and Space Science Volume 44 [6] Casagrande et al., (2014) Dario Flaccovio Editore p. 220 [7] Penasa et al. (2020) European Planetary Science Congress, Volume 14 [8] Hough (1959) HEACC, Proceedings of the 2nd International Conference on High-Energy Accelerators and Instrumentation [9] Neteler and Mitasova (2013) The Springer International Series in Engineering and Computer Science
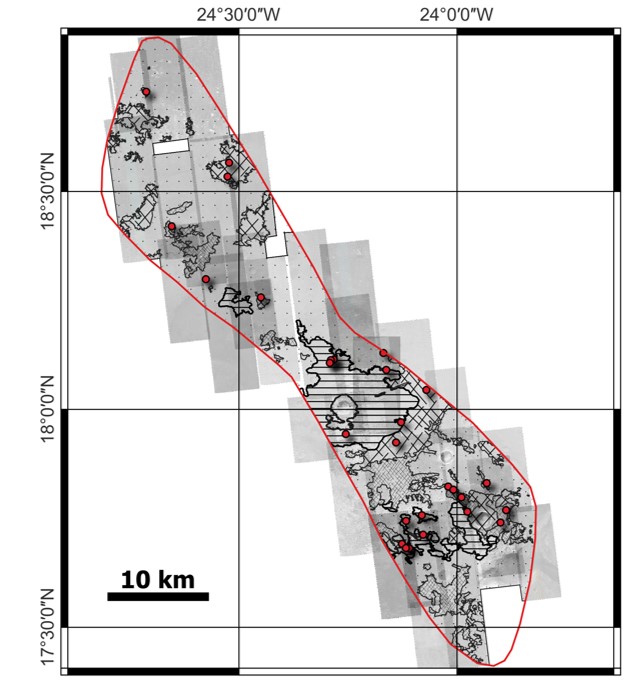

Figure 1 – Fractured terrains mapping and Scan Area locations within the ExoMars landing ellipse. Geospatial data is in simple cylindrical projection, considering Mars Sphere (IAU2018:49910).
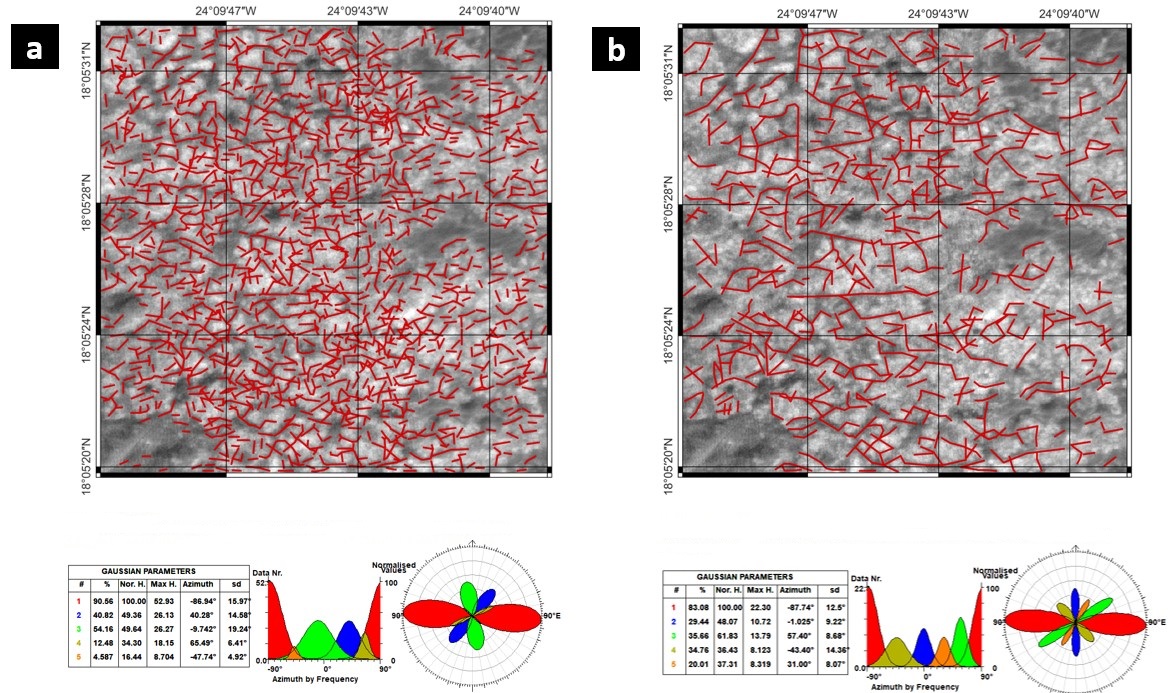
Figure 2 - Comparison between automatic (a) and manual tracing (b). The tables show results of the directional analysis effectuated by Daisy.
How to cite: Apuzzo, A., Frigeri, A., Salvini, F., Brossier, J., De Sanctis, M. C., Costa, N., and Schmidt, G. W.: Automatic Fracture Tracing by Image Processing on Oxia Planum, Mars, Europlanet Science Congress 2022, Granada, Spain, 18–23 Sep 2022, EPSC2022-350, https://doi.org/10.5194/epsc2022-350, 2022.