
Spectral variation of Europa’s regional photometry
 1,2,3,4,3,3,
- 1European Space Agency (ESA), European Space Astronomy Centre (ESAC), Madrid, Spain. (ines.belgacem@esa.int)
- 2Aurora Technology BV for ESA.
- 3Université Paris-Saclay, CNRS, GEOPS, 91405, Orsay, France.
- 4Institut Universitaire de France.
Introduction
Europa's surface is the youngest of the icy satellites and shows signs of recent activity [1]. The main driver of this activity is Jupiter’s tidal forces which are responsible for the existence of a global water ocean underneath Europa’s icy crust [2]. This ocean is thought to be in a direct contact with the rocky mantle [3] creating a potential environment for the emergence of life.
This places Europa at the center of future space exploration with NASA’s Europa Clipper mission [4] as well as ESA’s JUpiter ICy moons Explorer (JUICE) that will more generally study the Jovian icy moons [5].
To prepare for those missions, it is crucial to get the most out of the data we currently have. Photometry plays a key role in deriving remote sensing science products. As such, photometric correction is often the first step of any remote sensing analysis such as mapping or spectroscopy. In itself, photometry is closely linked to the surface microtexture and can help us better understand its physical state [e.g. 6, 7].
In this work, we are deriving photometric parameters for selected areas of Europa - we analyze their spectral dependency and how that can be translated into physical properties.
Dataset
We are revisiting data from Galileo’s Near Infrared Mapping Spectrometer (NIMS) [8] that operated between 0.7 – 5.2 m.
Calibrated and georeferenced data cubes (g-cubes) archived in the PDS Imaging Node have been stored in a database [9] with relevant information such as longitude, latitude, wavelengths, reflectance value, photometric angles etc. This tool allows for a comprehensive view of the dataset and quick exploration to assess the surface and angle coverage available for our study.
Due to changes in the wavelengths calibration and detector failures during operations, the phase angle coverage is very variable across the spectrum (from one cube to the other) with ranges from a few degrees to 80 degrees. We favor spectral intervals with a dense phase coverage. Moreover, to accommodate the shift in the wavelengths reference over time as well as to maximize our geometric diversity, we will not be looking at specific wavelengths but at 40 nm wide ranges of wavelengths across the spectrum.
We retrieved the reflectance and geometry information for a selection of regions of interest across the surface (Figure 1) by finding a compromise between interesting regions and relevant phase angle and spectral coverage.
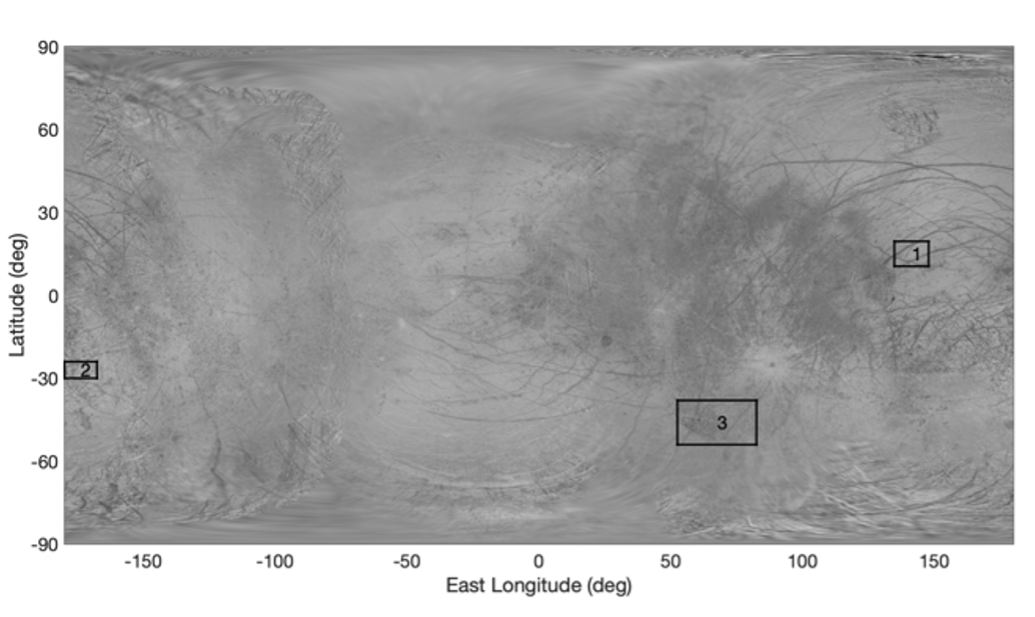
Figure 1: Map of Europa (credits: Björn Jónsson) with studied areas highlighted
Estimation of photometric parameters
For each area we are considering, we estimated a set of photometric parameters for every 40 nm wavelength interval we have defined. For this work, we are considering Hapke’s direct model detailed in [10] and [11]. Six parameters are to be estimated: phase function (b, c), single-scattering albedo (ω), rugosity (θ ̅), opposition effect (h and B_0).
We used an estimation method based on Bayesian statistics and that we developed for our regional studies of Jupiter’s icy moons in the visible [12, 13, 14]. This allows for of the parameters was inferred except for their physical domain of variation. The posterior Probability Density Functions (PDFs) are sampled with a Monte Carlo Markov Chain algorithm.
Results
We analyzed the different parameters over our three areas of study. Results were very heterogeneous in terms of accuracy across the spectrum but it is clear that the photometric parameters do vary somewhat with the wavelength, as also observed in laboratory experiment [15].
Figure 2 shows the example of the single-scattering albedo and macroscopic roughness estimations between 700 nm and 5 μm for ROI#1 in the leading hemisphere and a sample of wavelengths for which we have well constrained results.
Even though with naïve theoretical considerations we would expect a constant roughness - independent of wavelength - we found here that θ ̅ seems to become more important with higher wavelengths and lower reflectance. This could be related to specific absorption patterns or the presence of certain inclusions that would influence the photometric behavior in preferred wavelengths. In addition, roughness, as observed at various scales determined by the wavelength, may differ in natural material. This phenomenon is known as scale dependence roughness and may play a role here. Here we confirm the first-order dependence of absorptivity and roughness, determined in laboratory measurements [15].
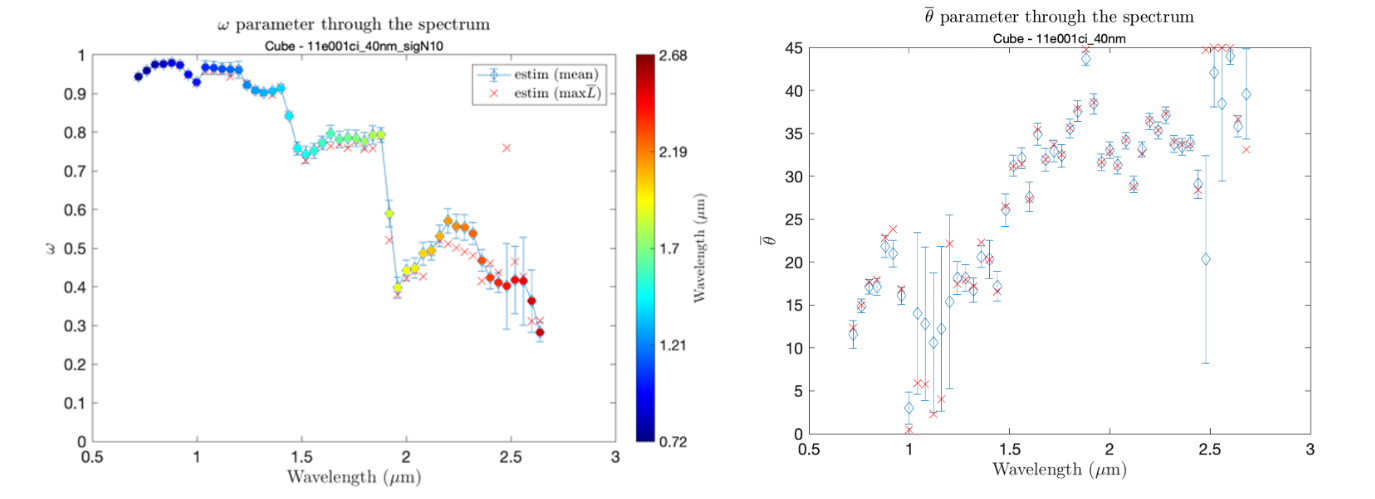
Figure 2: Spectral evolution of the single scattering albedo (left) and the macroscopic roughness (right) for ROI#1 estimated via mean of posterior distribution (blue) and maximum likelihood (orange)
Conclusion and future work
Based on this work, we aim at locally derive photometric corrections that can be used for other remote sensing products like mapping and spectroscopy. The physical implications of a spectrally dependent macroscopic roughness or phase function might also contribute to a better understanding of the history of Europa’s surface and will be our primary focus going forward.
Studying the spectral dependence of the Hapke parameters specifically is interesting as this model is one of the most widely used to investigate radiative transfer in relation to planetary surfaces. Nonetheless, a lot of different photometric models could also be considered. We plan to complement this work by studying the spectral dependency of other photometric models [e.g. 14, 16].
References
[1] Pappalardo, R. T. et al. (1999) JGR: Planets, 104 (E10) :24015_24055. [2] Carr, M. H. et al. (1998) Nature. [3] Vance, S. D. et al. (2018) JGR: Planets, 123. [4] Phillips, C. B. and Pappalardo, R. T. (2014) Eos, Transactions American Geophysical Union. [5] Grasset, O. et al. (2012) Planetary and Space Science. [6] A. McGuire, A. and Hapke, B. (1995) Icarus. [7] Souchon, A. et al. (2011) Icarus. [8] Carlson, R. W. et al (1992) Space Science Review. [9] Cornet, T. et al. EPSC 2022. [10] Hapke, B. (1993) Cambridge University Press. [11] Hapke, B. (2002) Icarus, vol. 157. [12] Schmidt, F. and Bourguignon, S. (2019) Icarus. [13] Belgacem, I. et al. (2019) Icarus. [14] Belgacem, I. et al. (2021) Icarus, vol 369. [15] Pilorget, C. et al., (2016) Icarus [16] Oren, M., Nayar, S. K. (1994) SIGGRAPH94.
How to cite: Belgacem, I., Cornet, T., Schmidt, F., Cruz Mermy, G., Andrieu, F., and Altobelli, N.: Spectral variation of Europa’s regional photometry, Europlanet Science Congress 2022, Granada, Spain, 18–23 Sep 2022, EPSC2022-359, https://doi.org/10.5194/epsc2022-359, 2022.