
 1,1,1,1,1,1,1,
- 1INAF - IAPS, Rome, Italy (lorenzo.rossi@inaf.it)
- 2Italian Space Agency (ASI), Italy
Introduction
We developed a simple model to simulate Ma_MISS data acquisition and visualization and to support the development of acquisition strategies.
The Ma_MISS instrument
Ma_MISS (Mars Multispectral Imager for Subsurface Studies) is the miniaturized VNIR spectrometer embedded in the drill system of the ExoMars rover[1]. Ma_MISS will perform spectral reflectance measurements inside holes drilled into the surface of Mars up to a depth of 2 m. It will characterize the mineralogy and stratigraphy of the borehole walls and will allow the in-situ study of the subsurface environment, before any samples are collected and extracted. Taking advantage of the finely controllable drill tool motion, Ma_MISS can map the borehole walls. In addition to single point acquisitions, Ma_MISS can also be programmed to acquire “Ring” and “Column” scans, where the spectrometric acquisitions are interleaved with step rotations or translations of the drill tool.
Borehole stratigraphy model
To easily simulate Ma_MISS surveys, we first developed a simple model of a borehole. As further described in [2], six different simulant samples were prepared. Reflectance spectra were acquired on each of the samples with DAVIS-MOT, the new Ma_MISS laboratory model[3]. The reflectance spectra of these samples are shown in Figure 1. Six different regions were drawn as polylines on a 2D projection of the cylindrical borehole walls. Out of the six simulants, a different one was assigned to each region. As shown in Figure 2, this model was made to represents a 250 mm deep section of a borehole, exhibiting a varied stratigraphy with 5 different layers and a vertical vein.
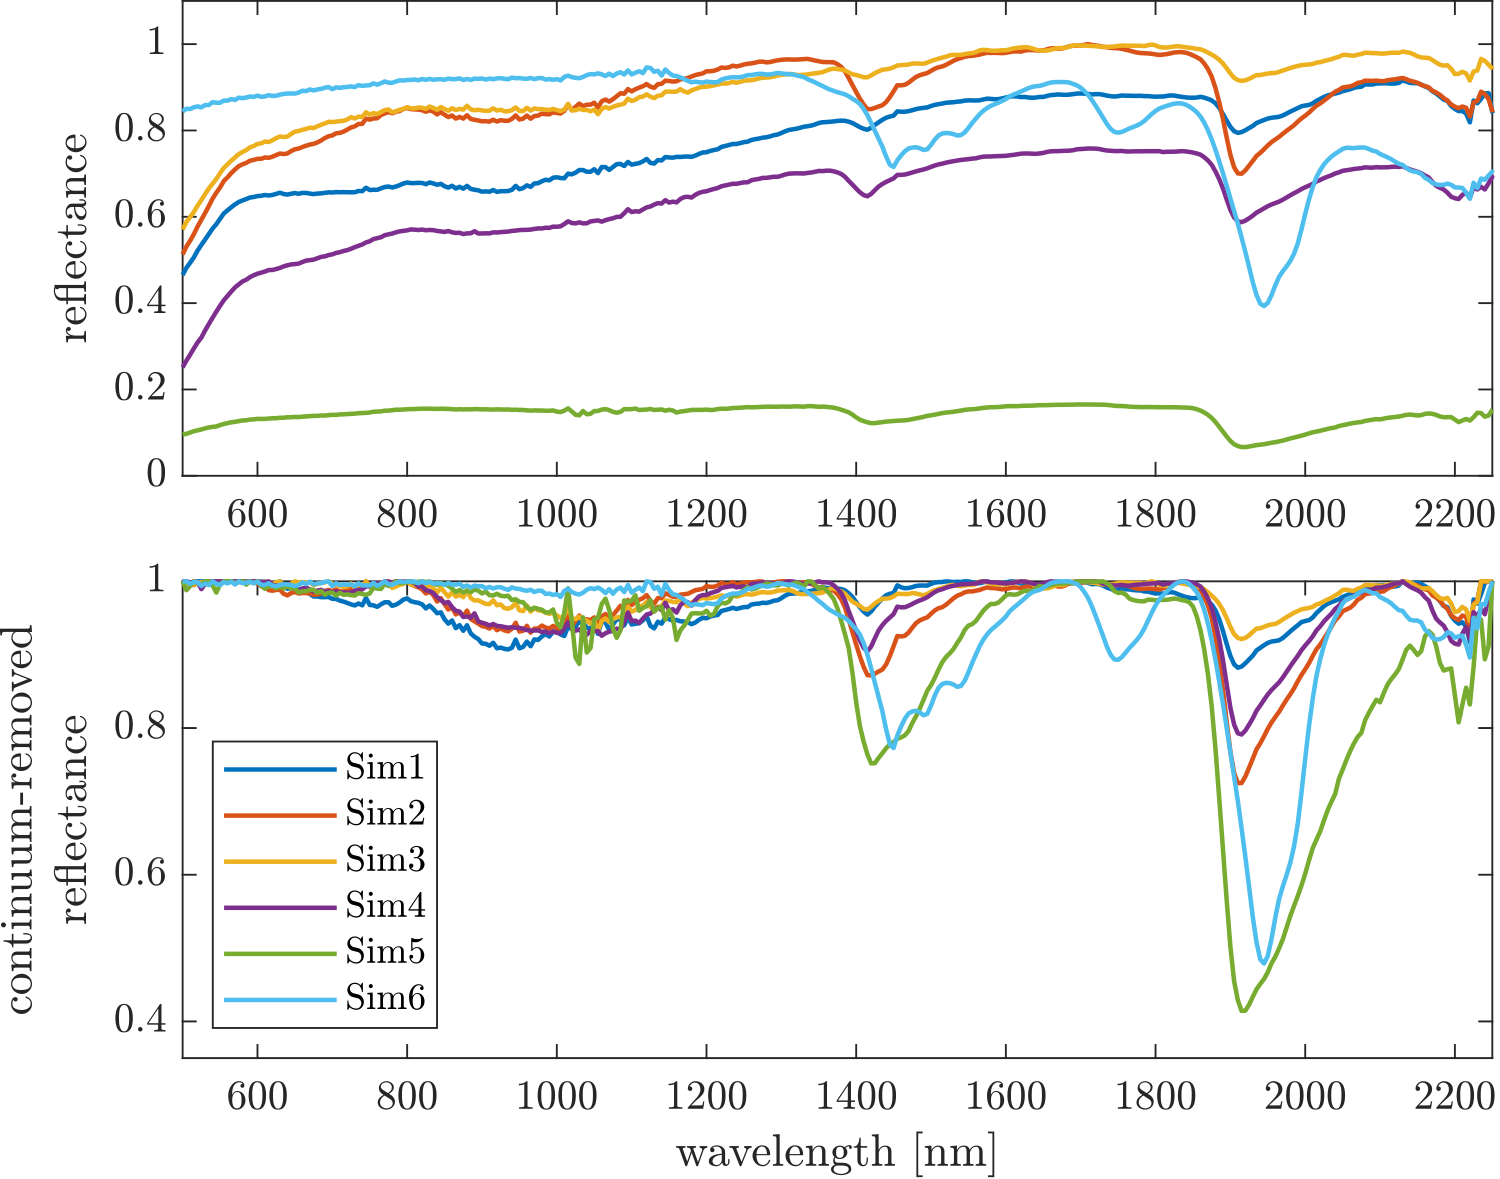
Figure 1: Reflectance spectra of samples.
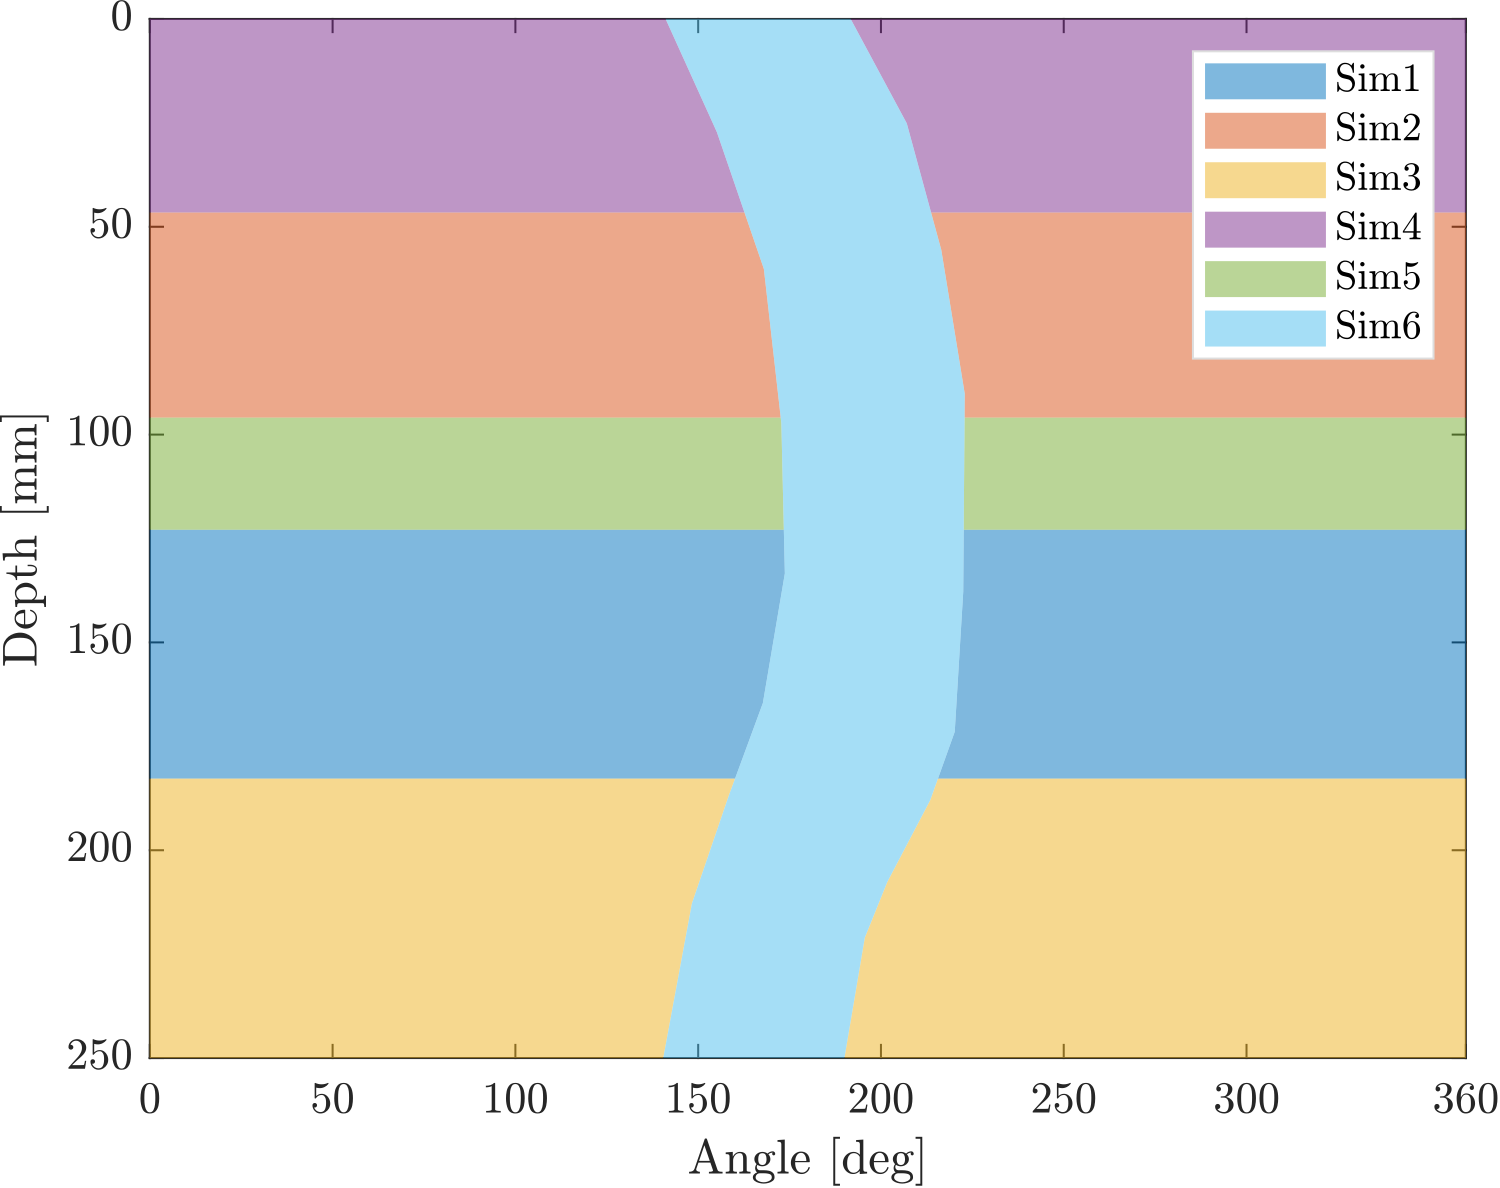
Figure 2: Borehole stratigraphy model
Survey simulation
The borehole model can be used to quickly simulate a Ma_MISS survey. Once the acquisition strategy of the survey is defined, the coordinates of the points where spectrometric acquisitions are to be simulated are computed. Small random errors can be added to the coordinates to simulate the accuracy of the drill tool actuators and sensors. For each point of this set, we generate a spectrum that simulates the real acquisition. Each simulated spectrum is generated from the measured spectra of one of the six simulants, based on its region in the stratigraphy model, with the addition of random shifts, slopes, and noise to simulate out-of-focus acquisitions and instrumental noise.
Development of acquisition strategies
The simulated data can be used to develop acquisition strategies, aimed at maximizing the information gained while limiting the time required to complete a survey of a drilled borehole. The time required to complete the survey depends on both the spectrometer acquisition settings and the drill tool motion. For example, the duration of a drill movement depends on angular and vertical step sizes (hereafter referred to as Δθ and Δz respectively), with vertical translations generally taking longer than rotations. Multiple combination of these parameters can be tried out on the same stratigraphy model to evaluate which strategy can provide the best compromise between spatial resolution and time required.
Simulated data examples
For the 4th RSOWG (Rover Science Operations Working Group) Simulation, held in November 2021, we provided data from a simulated Ma_MISS acquisition survey. The simulated Ma_MISS survey (“survey A”) consisted of:
-6 rings of 360 points each, with Δθ=1° and displaced vertically by Δz=50mm;
-8 columns made up of 126 points each, taken with Δθ=45° and a vertical step of Δz=2mm.
This amounts to a total of 3168 individual spectra. A view of the simulated data is shown in Figure 3 and Figure 5A. This acquisition strategy provides a high angular resolution in the rings with Δθ=1° (which can be useful to identify small vertical features or individual grains) and a good vertical resolution in the column with Δz=2mm (useful to reconstruct the stratigraphy of the subsurface).
Another survey (“survey B”) that was simulated with the same model is shown in Figure 4 and Figure 5B-C. In this case the acquisition was made up of 35 rings of 72 points each, with Δθ=5° and Δz=6.25 mm, for a total of 2952 spectra. This strategy offers worse spatial resolution in both the vertical direction and along the circumference but can nonetheless provide a more regular overall view of the borehole stratigraphy.
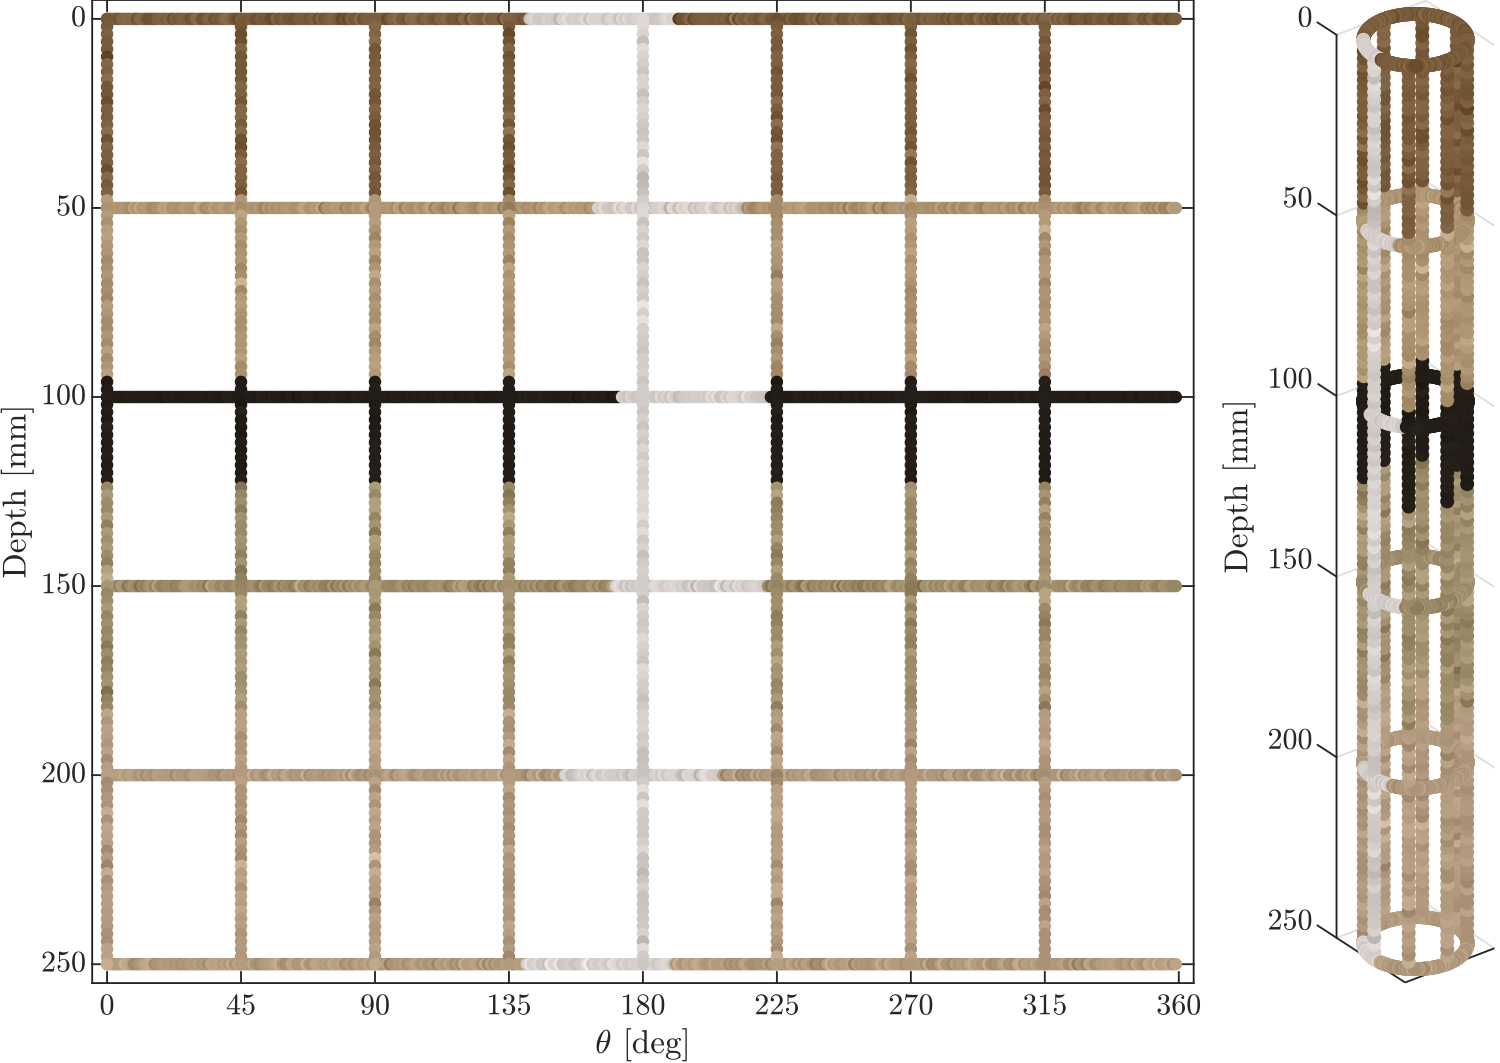
Figure 3: Simulated survey A
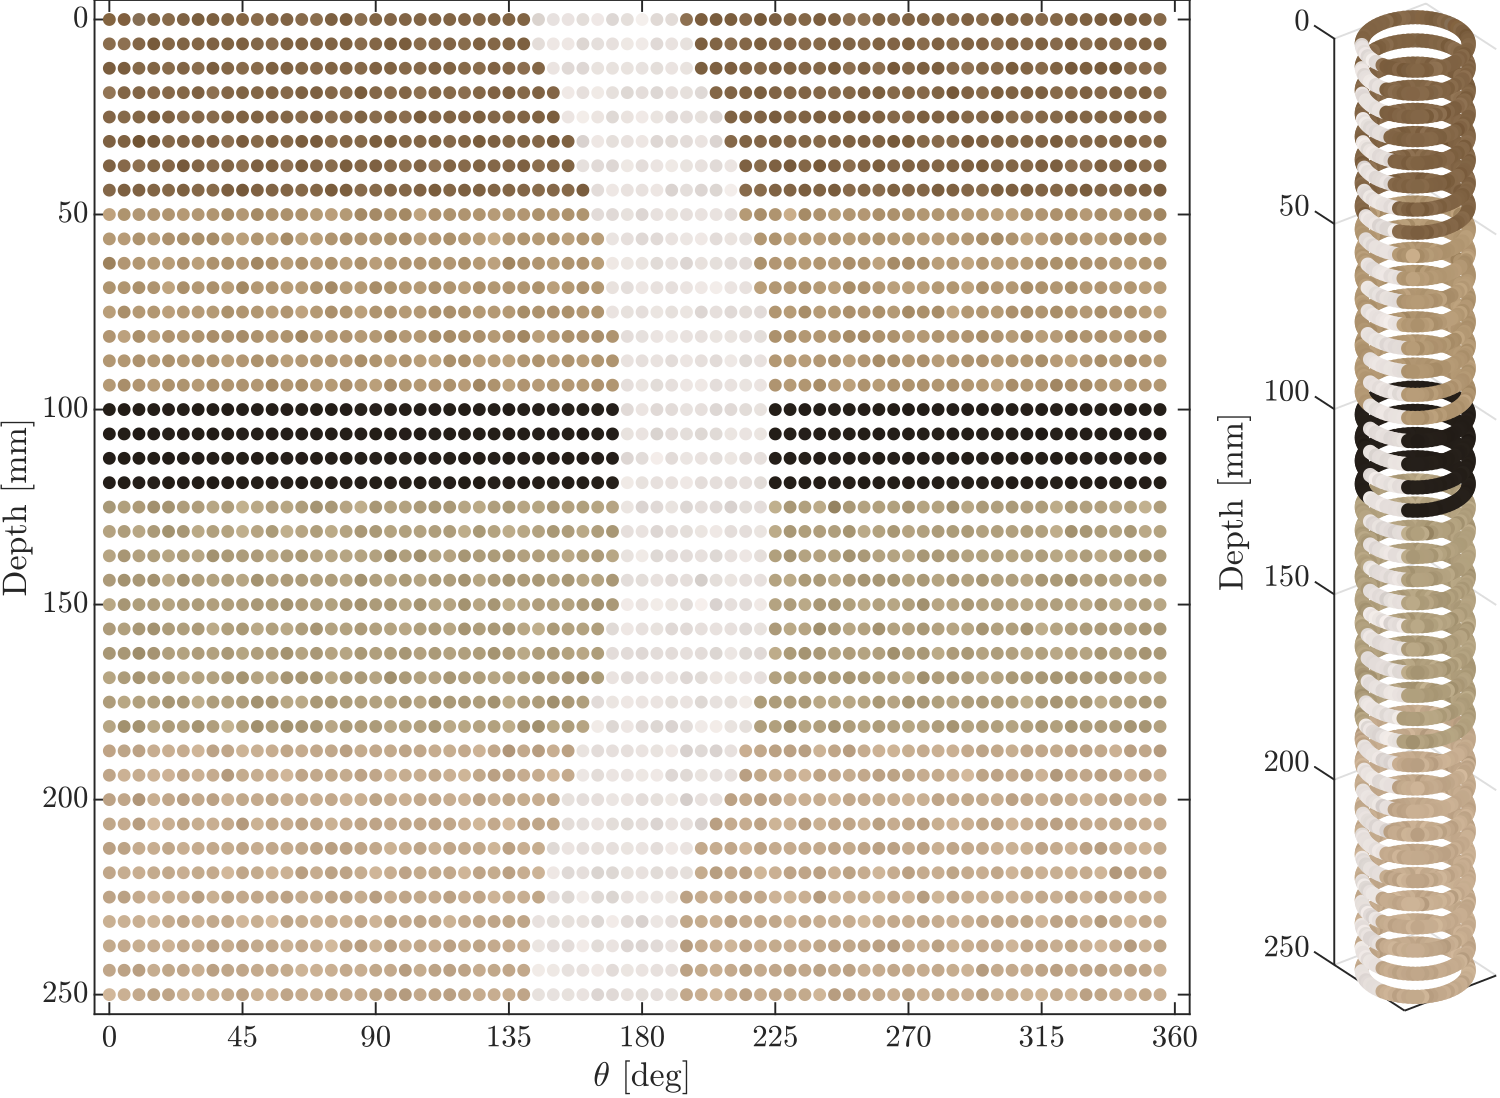
Figure 4: Simulated survey B
Data visualization
In Figure 3 and 4, each dot represents a simulated spectrum. In this case the colour of each dot was computed from its spectrum such that it looks somewhat like it would appear to the human eye. The same colours were interpolated across the surface (with a scattered data bicubic interpolation method) to obtain views like those shown in Figure 5A-B. Other useful visualizations of these spectra can be obtained by highlighting other spectral features, e.g., band depths, band ratios or specific IR bands. An example is shown in Figure 5C, where the 1.95 µm band depth is computed on the simulated spectra of survey B and its value is interpolated across the cylindrical surface.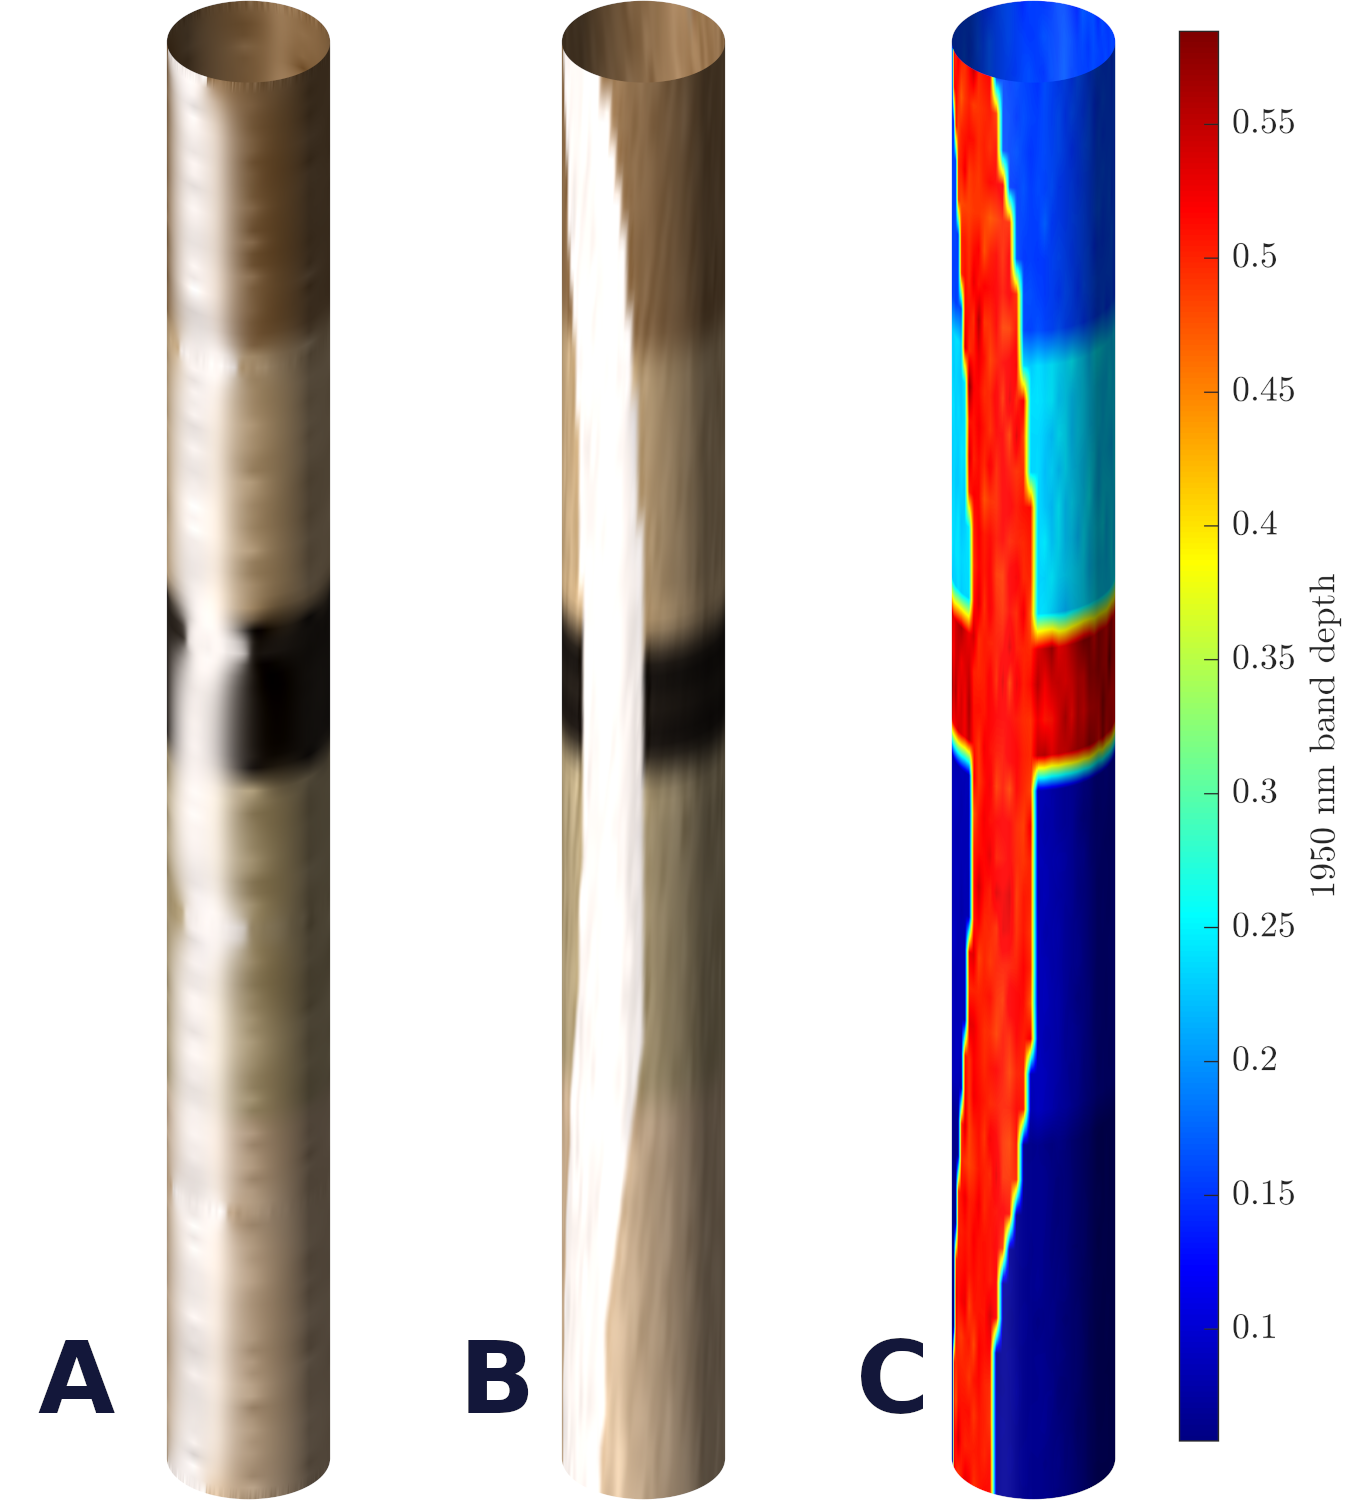
Figure 5: Visualization of simulated data on the borehole surface
Future work
The developed simulation model can be easily extended to other borehole stratigraphy models, with different geometries and spectra. It will also be complemented with tools to estimate the time needed to perform each simulated survey, which will make it a useful tool for the optimization of acquisition strategies. The developed data visualization tools can also be used with real, measured data. We are planning to verify the simulated data on real surveys. In fact, we can perform a complete survey with the Ma_MISS laboratory breadboard on an actual drilled sample. The acquired data will be visualized and used to reconstruct the sample stratigraphy.
Acknowledgments
This work is supported by the Italian Space Agency (ASI) grant ASI-INAF n. 2017-412-H.0.
References
[1] De Sanctis M.C. et al. (2017): Astrobiology, 17, 6-7
[2] Ferrari M. et al. (2022): LPSC53, Abstract#1339
[3] De Angelis S. et al. (2022): LPSC53, Abstract#1796
How to cite: Rossi, L., Ferrari, M., De Sanctis, M. C., Frigeri, A., De Angelis, S., Costa, N., Altieri, F., Formisano, M., and Ammannito, E.: Simulation and optimization of Ma_MISS surveys, Europlanet Science Congress 2022, Granada, Spain, 18–23 Sep 2022, EPSC2022-391, https://doi.org/10.5194/epsc2022-391, 2022.