TP5
Session assets
Orals: Thu, 22 Sep, 10:00–18:30 | Room Manuel de Falla
Introduction
Bright basal reflections detected by MARSIS at Ultimi Scopuli (Orosei et al., 2018; Lauro et al., 2021) started a wide scientific debate on the possible materials capable to generate such strong echoes from the base of the South Polar Layers Deposits (SPLD). Different interpretations were suggested: some involving the presence of briny water at the base of the SPLD (Orosei et al., 2018; Lauro et al., 2021; Mattei et al., 2022; Stillman et al., 2022) and others the existence of conductive materials, like saline ice and hydrated clays (Bierson et al., 2021; Smith et al., 2021) or ilmenite-rich basaltic rocks (Grima et al., 2022).
The original study (Orosei et al., 2018) was based on an inversion approach of MARSIS data (Lauro et al., 2019) from which the basal permittivities were retrieved. Such permittivity values are estimated from the amplitude of the reflected signal (Orosei et al., 2018), which does not allow to separately compute real and imaginary parts of the complex permittivity but only the apparent permittivity (ea) (Mattei et al., 2022). This is a real single quantity (to not be confused with the real part of permittivity, e’) that accounts for both polarization and conductive processes and fully describes the dielectric property of a material. In other words, the apparent permittivity is the physical quantity associated to a material lying below the SPLD that MARSIS measure.
The analysis of MARSIS data at Ultimi Scopuli defined the presence of two distinct distributions of apparent permittivity values. A distribution with high values, inside the so-called bright area, which were interpreted as evidence of basal salty liquid water and a distribution with low values typical of dry rocks/soil, outside the bright area (Orosei et al., 2018). The presence of other wet areas was subsequently confirmed applying a different analysis based on a signal processing approach commonly used in terrestrial Radar Echo Sounding (RES) studies to discriminate between wet and dry subglacial basal conditions (Lauro et al., 2021). Moreover, other indirect evidence supports the existence of liquid water below the ice at Ultimi Scopuli (Carrer and Bruzzone, 2021).
Results and discussions
The main argument against the possible presence of basal briny water is the very low temperature inferred from thermal models at the base of the SPLD (~180K), which was believed to require a large amount of salt to maintain the water in a liquid state (e.g., Sori and Bramson, 2019). Based on laboratory measurements, however, recent papers have discarded such requirement showing that few hundreds of mM of perchlorate salts are capable to maintain the water liquid at temperature lower than 200K (Mattei et al., 2022; Stillman et al., 2021; Stillman et al., 2022). Moreover, neither dielectric theory nor extensive experimental data support the hypothesis that saline ices or hydrated salts and clays can produce the bright basal reflections detected by MARSIS at the base of the SPLD (Mattei et al., 2022; Stillman et al., 2022). On the other hand, the largest amount of ilmenite content detected so far on Mars is £5% (e.g., Morris et al., 2006) which is largely insufficient to create strong radar basal reflections (Hansen et al., 1973). Another puzzling aspect in this controversy, is the presence of other bright areas detected by MARSIS below the South polar cap, sometime where the ice is thinner than 1.5 km (Khuller and Plaut, 2021). It should be notice, however, that the data analyzed by Khuller and Plaut (2021) are not the same (on-board standard mode) as those used in Orosei et al. (2018) and Lauro et al. (2021) (super frame and flash memory mode).
We present here the results of a large literature review on the dielectric properties of the materials suggested to be present at the base of the SPLD, as a function of temperature and composition. For these materials we computed the apparent permittivity which we compared to the apparent permittivity values retrieved by MARSIS (Fig.1). The results are discussed in the framework of the thermal state at the base of the SPLD and show that only perchlorates solutions can generate the basal bright reflections detected by MARSIS at Ultimi Scopuli.
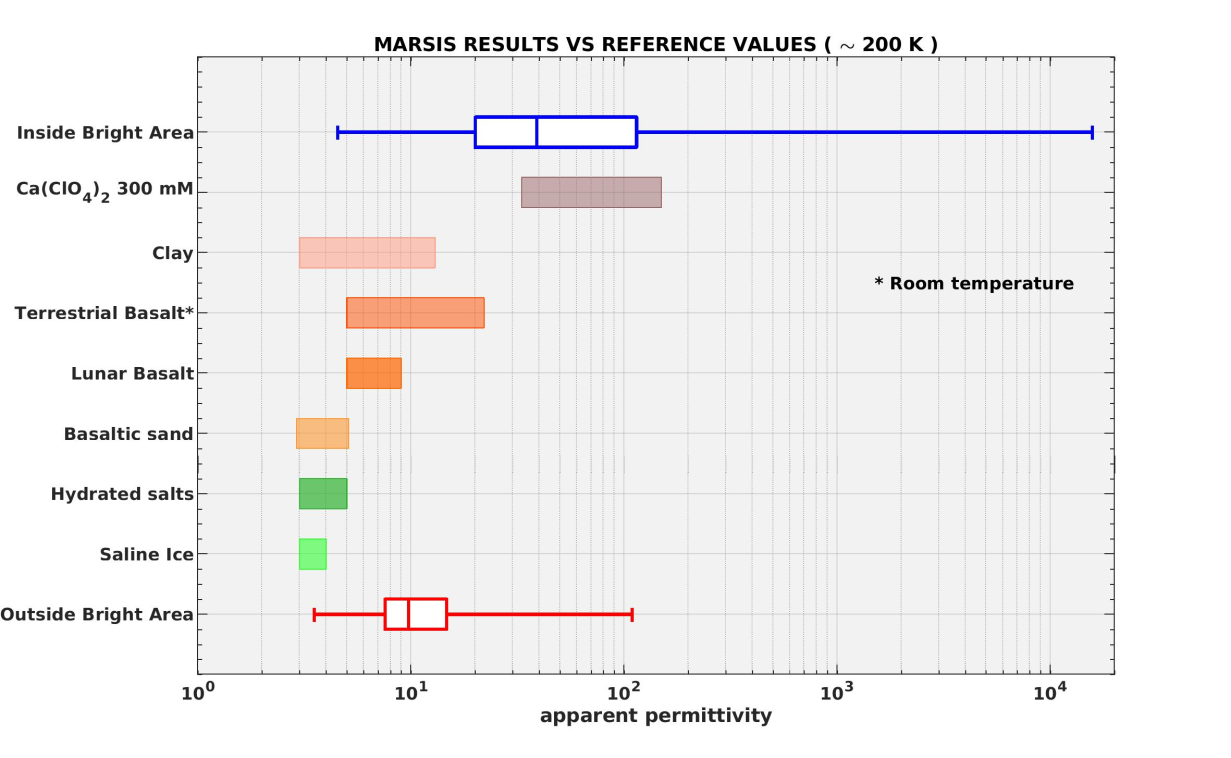
Fig.1 Box plot of the apparent permittivity. The plot indicates the basal apparent permittivity retrieved inside the main bright area (blue) and outside the bright areas (red). Color bars indicate a range of apparent permittivity values for several lithologies potentially present at the base of the SPLD, measured mostly at MARSIS frequencies and 200 K.
References
Bierson, C. et al. Geophysical Research Letters, 48(13), doi.org/10.1029/2021GL093880, (2021).
Carrer L. and L. Bruzzone, IEEE Transactions on Geoscience and Remote Sensing, vol. 60, pp. 1-15, 2022, Art no. 4600915, doi: 10.1109/TGRS.2021.3111814.
Grima, C., et al. (2022). Geophysical Research Letters, 49(2), e2021GL096518, doi.org/10.1029/2021GL096518.
Khuller, A. R., & Plaut, J. J. (2021). Geophysical Research Letters, 48(13), e2021GL093631, doi.org/10.1029/2021GL093631
Lauro, S. E., et al. (2019). Remote Sensing, 11(20), 2445. Remote Sens. 2019, 11(20), 2445, doi.org/10.3390/rs11202445.
Lauro, S.E., et al.
Mattei, E., et al. (2022). Earth and Planetary Science Letters, 579, 117370, doi.org/10.1016/j.epsl.2022.117370.
Morris, R. V., et al. (2006). Journal of Geophysical Research: Planets, 111(E2).
Orosei, R., et al. (2018). Science, 361(6401), 490-493, doi: 10.1126/science.aar7268.
Smith, I. B., et al. (2021).
Sori, M. M., & Bramson, A. M. (2019). Geophysical Research Letters, 46(3), 1222-1231, doi.org/10.1029/2018GL080985.
Stillman, D. E., et al. (2022). LPI Contributions, 2678, 2133.
Stillman, D. E., et al.(2021).LPI Contributions, 2614, 6028.
How to cite: Pettinelli, E., Lauro, S., Mattei, E., Cosciotti, B., Stillman, D., Caprarelli, G., and Orosei, R.: The search for liquid water below the South Polar Layer Deposits: where we stand?, Europlanet Science Congress 2022, Granada, Spain, 18–23 Sep 2022, EPSC2022-1024, https://doi.org/10.5194/epsc2022-1024, 2022.
Introduction
The presence of liquid water at the base of the Southern polar cap of Mars has been inferred from exceptionally strong radar echoes detected by MARSIS aboard the MEX spacecraft [1]. The identification of water from strong radar reflections is based on the high value of the dielectric permittivity of water-bearing materials compared to that of dry rocks. This identification has been challenged based on thermal models of the Martian polar cap, which could not produce basal temperatures compatible with the presence of liquid water, and alternative interpretations have been proposed like wet clays and iron-rich basalts [2-4]. However, a quantitative determination of which hypothesis best explains the strong radar echoes detected by MARSIS requires a careful modelling of electromagnetic propagation within the Martian South Polar Layered Deposits (SPLD), the dust-laden ice sheet covering most of the Martian polar regions. In addition to the dielectric properties of the material beneath the Martian ice cap, the main factor determining the strength of basal radar echoes is the attenuation experienced by the radio waves as they propagate within the SPLD. Here we estimate the bulk loss tangent (ratio of imaginary to real part of the complex dielectric permittivity) of the SPLD from differential attenuation of basal echoes detected by MARSIS at different frequencies.
Data and Methods
The used MARSIS dataset consists of 132 radar observations collected at 3MHz and 4MHz or 4MHz and 5MHz, acquired at Ultimi Scopuli between 2010 and 2019 (Fig.1): 36 at 3 MHz, 132 at 4MHz and 96 at 5MHz. Such observations have been collected on a large region, were both bright and non-bright areas were detected [5]. The basal reflectivity is lower at higher frequencies, with a systematic difference between each frequency pair (3/4 MHz and 4/5 MHz) regardless the acquisition inside or outside the bright area (Fig.2). This behavior can be ascribed to different causes: the attenuation in the SPLD; the scattering generated by the basal interface which, in turns, depends on the interface roughness and the dielectric contrast between the SPLD and the underlying material. From data analysis, it is possible to ascribe the frequency behavior of the MARSIS observations mostly to the signal attenuation in the SPLD. Under these assumptions, loss tangent is computed from the measurements of the normalized basal echo power observed at different depths and frequencies.
(Pb/Ps)dB ≃ R0−𝜉 𝜈 tan𝛿 𝜏,
where Pb is the basal echo power, Ps is the surface echo power, 𝜉=2𝜋 10log10(e), and R0 is a constant which depends on surface and basal Fresnel reflection coefficients, 𝜈 is the frequency and 𝜏 is the two-way travel time.
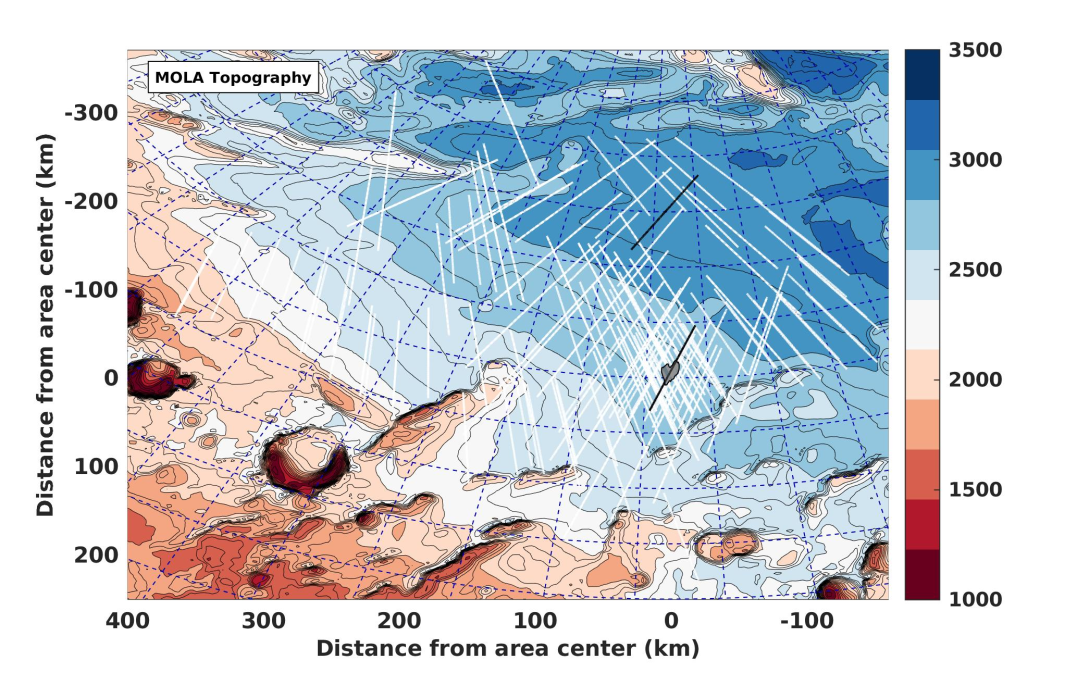
Fig.1 Mars Orbiter Laser Altimeter topographic map of the investigated area at Ultimi Scopuli. The white lines represent the MARSIS observations in the region. The gray region indicates the main bright area studied in [1]. Black lines are the observations illustrated in Fig.2.
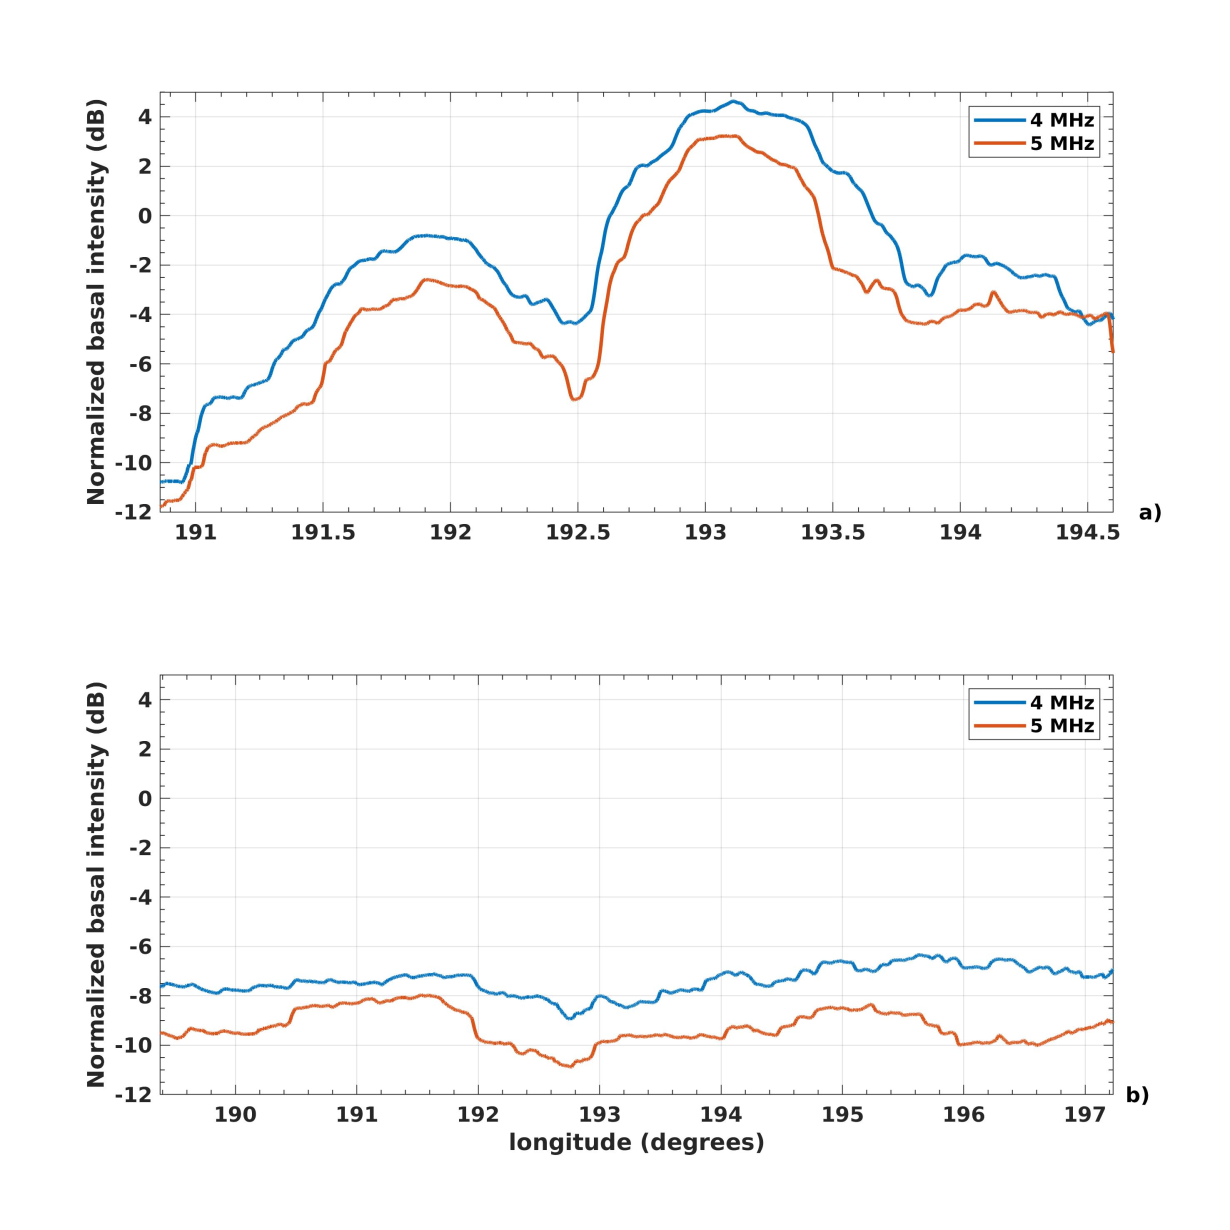
Fig. 2 The plots refer to observations collected inside (a) and outside the bright areas (b) of Fig. 1, after applying an along track average.
Results
In the entire investigated region, the estimated loss tangent value is of the order of 10−3 . This value implies an attenuation of several dB's over the thickness of the SPLD in the area where strong echoes were detected by MARSIS, thus increasing the value of the dielectric permittivity of the basal material required to produce such echoes. The observed frequency behavior of basal echoes requires the presence of a significant amount of dust within the SPLD, similar to what has been deduced from gravity measurements, and puts an upper limit to the basal temperature of the SPLD. Furthermore, the extrapolation of the observed attenuation at higher frequencies explains why SHARAD, the other radar sounder at Mars, is unable to detect the strong basal echoes found by MARSIS. The upper limit on basal temperature retrieved in this analysis, when compared with literature data about the electrical conductivity of geomaterials at low temperature, rules out the possibility that clays or other dry minerals can produce the strong echoes detected by MARSIS. The most likely explanation for such echoes thus remains the presence of perchlorate brines at the base of the SPLD.
References
Orosei, R., et al., (2018). Science, doi: 10.1126/science.aar7268.
Sori, M. M., & Bramson, A. M. (2019). GRL, doi.org/10.1029/2018GL080985.
Smith, I. B. et al., (2021). GRL, doi.org/10.1029/2021GL093618.
Grima, C., et al., (2022). GRL, doi.org/10.1029/2021GL096518.
Lauro, S.E., et al.. Nat Astron, doi.org/10.1038/s41550-020-1200-6
How to cite: Lauro, S., Pettinelli, E., Caprarelli, G., Baniamerian, J., Mattei, E., Cosciotti, B., Stillman, D., Primm, K., Soldovieri, F., and Orosei, R.: Using MARSIS signal attenuation to constrain SPLD basal temperature and composition , Europlanet Science Congress 2022, Granada, Spain, 18–23 Sep 2022, EPSC2022-1052, https://doi.org/10.5194/epsc2022-1052, 2022.
Abstract
The SHAllow RADar (SHARAD) is a synthetic aperture radar (SAR) onboard Mars Reconnaissance Orbiter, in Martian orbit since 2006 [1]. With its 20MHz frequency, it can fathom the first hundreds of meters of the subsurface with a range resolution of about 10m in typical Martian materials. In order to detect subsurface interfaces with radars, we need to eliminate the echoes coming from the surface : as the design of most radars in orbit gives them a large antenna lobe, off-nadir echoes could arrive at the same delay as a subsurface nadir reflection. The classical method to remove this so called “clutter” consists in comparing the radar signal to simulations of the surface echoes using Digital Terrain Models (DTMs). Our aim is to study the first tens of meters of the Martian subsurface with SHARAD. To do so, we need high resolution DTMs because in theory, the higher we get in resolution, the more detailed the simulation will be and the clearer the discrimination between surface and subsurface features will be. We will present results on high resolution simulations performed with SPRATS, our coherent simulator. We will show that while being high resolution, models obtained by photogrammetry sometimes contain artifacts that can be misleading for radar data interpretation.
Simulations with SPRATS : first study with MOLA DTMs
SPRATS is a toolset developed at IPAG that allows to perform both coherent radar simulations of surfaces and 3D SAR processing of them [2], [3]. Those capabilities enable the simulation of the actual signal sensed by SHARAD, with the same processing applied to it, in order to get as close as possible from the instrument results. It allows for a direct power comparison and thus finer analysis. To begin, we performed simulations with DTMs generated with MOLA, a laser altimeter [4]. While having a relatively low resolution, the nature of the acquisition method give those DTMs a high accuracy and precision, resulting in very low artifacts. To study deep reflectors in areas of relatively low rugosity (i.e. the northern plains [5]), those models are sufficient. But the low resolution is a limiting factor when studying close subsurface, or simply to reproduce surface roughness effects on the radar signal. To improve the simulations, higher resolution models are necessary.
HRSC models, higher resolution but sometime containing artifacts
With a resolution of 50 to 100m, HRSC DTMs [6] yield better results in simulating smaller details. It allows to confirm or discard reflectors identified with MOLA [7]. However, these models are acquired by photogrammetry, a technique that is an estimation of the surface topography, compared to MOLA which is a direct measurement. Photogrammetry introduces artifacts that are not easy to estimate, because they depend on the actual topography. We will show a comparative study of simulations with HRSC and MOLA models on a region of interest located in Terra Cimmeria, following a study made by [8]. The amplitude of the artifacts on the HRSC models is too high to study the first tens of meters of the subsurface with SHARAD. Following the idea of getting as close as possible to the actual SHARAD data, we need models that describe the surface at a resolution better that the radar’s wavelength.
Simulations with models at wavelength-scale resolution (CTX)
We will present a comparative study of simulations using CTX models — with a resolution of 12m — and HRSC models. We will also show that the scale of the artifacts on these DTMs being below the SHARAD’s wavelength, CTX DTMs yield near perfect surface echoes simulation, allowing for a fine detail comparative analysis of the SHARAD data. However, given their acquisition method [9], CTX DTMs have a relatively poor surface coverage compared to HRSC, so we used photoclinometry with CTX images on lower resolution models [10] to keep the high resolution information. Comparing high resolution simulations using these models to SHARAD data allowed to highlight small-scale artifacts on the CTX DTMs, as they introduce noise in the radargram.
Conclusions
This study shows that wavelength-scale or smaller artifacts on DTMs are needed to perform shallow subsurface analysis of SHARAD data. It also showed that high resolution models acquired by photogrammetry are prone to artifacts, which can perturb the simulated signal. This artifacts issue can prove to be helpful for DTM quality estimation, especially for missions where no laser altimeter is present to validate the altimetry measurements.
References
[1] R. Seu et al., « SHARAD sounding radar on the Mars Reconnaissance Orbiter », 2007, doi: 10.1029/2006JE002745.
[2] Y. Berquin, A. Herique, W. Kofman, et E. Heggy, « Computing low-frequency radar surface echoes for planetary radar using Huygens-Fresnel’s principle: COMPUTING RADAR SURFACE ECHOES », oct. 2015, doi: 10.1002/2015RS005714.
[3] J.-F. Nouvel, A. Herique, W. Kofman, et A. Safaeinili, « Radar signal simulation: Surface modeling with the Facet Method: RADAR SIGNAL SIMULATION » , febr. 2004, doi: 10.1029/2003RS002903.
[4] M. T. Zuber et al., « The Mars Observer laser altimeter investigation », 1992, doi: 10.1029/92JE00341.
[5] C. M. Stuurman et al., « SHARAD detection and characterization of subsurface water ice deposits in Utopia Planitia, Mars: SHARAD DETECTION OF ICE UTOPIA PLANITIA », sept. 2016, doi: 10.1002/2016GL070138.
[6] G. Neukum et R. Jaumann, « HRSC: the High Resolution Stereo Camera of Mars Express », 2004.
[7] C. W. Cook et al., « Sparse subsurface radar reflectors in Hellas Planitia, Mars », sept. 2020, doi: 10.1016/j.icarus.2020.113847.
[8] S. Adeli, E. Hauber, G. G. Michael, P. Fawdon, I. B. Smith, et R. Jaumann, « Geomorphological Evidence of Localized Stagnant Ice Deposits in Terra Cimmeria, Mars », juin 2019, doi: 10.1029/2018JE005772.
[9] M. C. Malin et al., « Context Camera Investigation on board the Mars Reconnaissance Orbiter », 2007, doi: 10.1029/2006JE002808.
[10] S. Doute et C. Jiang, « Small-Scale Topographical Characterization of the Martian Surface With In-Orbit Imagery », janv. 2020, doi: 10.1109/TGRS.2019.2937172.
How to cite: Desage, L., Herique, A., Kofman, W., and Zine, S.: SHARAD Data Analysis with High Resolution Digital Terrain Models, Europlanet Science Congress 2022, Granada, Spain, 18–23 Sep 2022, EPSC2022-457, https://doi.org/10.5194/epsc2022-457, 2022.
For more than a year now, the Perseverance rover of the Mars2020 mission has been exploring the Jezero crater in the northern hemisphere of Mars. This landing area was notably selected due to the presence of a large-scale fan-shaped sedimentary edifice in its western part at the mouth of Neretva Vallis (NV, Fig. 1a, e.g., [1]), that was interpreted to be a fossil deltaic system. Upon arrival in the crater in February 2021, remote observation from the ground were performed, allowing to answer this question with long-distance imaging using Mastcam-Z and SuperCam’s Remote Micro-Imager. Indeed, these observations allowed to identify with certainty structures characteristic of a Gilbert-type delta, confirming the fluvio-deltaic origin of this western fan [1].
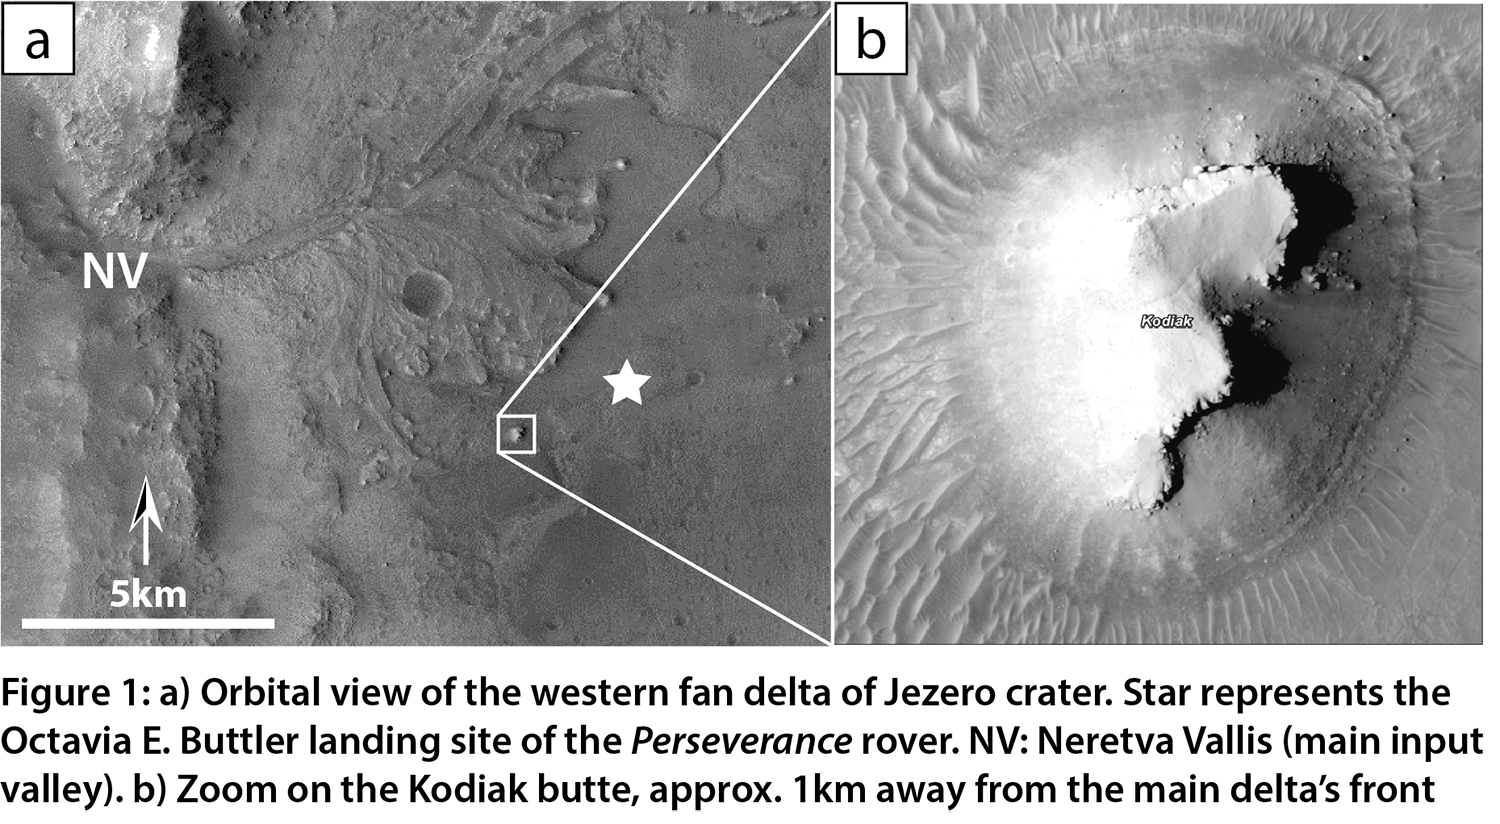
In this work, we focus on the Kodiak butte (Fig. 1b) situated ~1 km away from the current main delta front. This butte exhibits Gilbert-type structures of bottomsets, foresets and topsets characteristic of the deltaic suite, and as therefore been identified as being a remnant of a past distal extension of the western delta [1; 2]. This butte was imaged from the east during the earliest part of the mission (Fig. 2a), but we also took advantage of the “Rapid Traverse” route to the delta foot to gather images of its northern-facing side (Fig. 2b), giving us data to study the 3D geometry of the sedimentary rocks that make this butte. Here, we provide an overview of the facies and stacking pattern of the deltaic series observed at Kodiak.
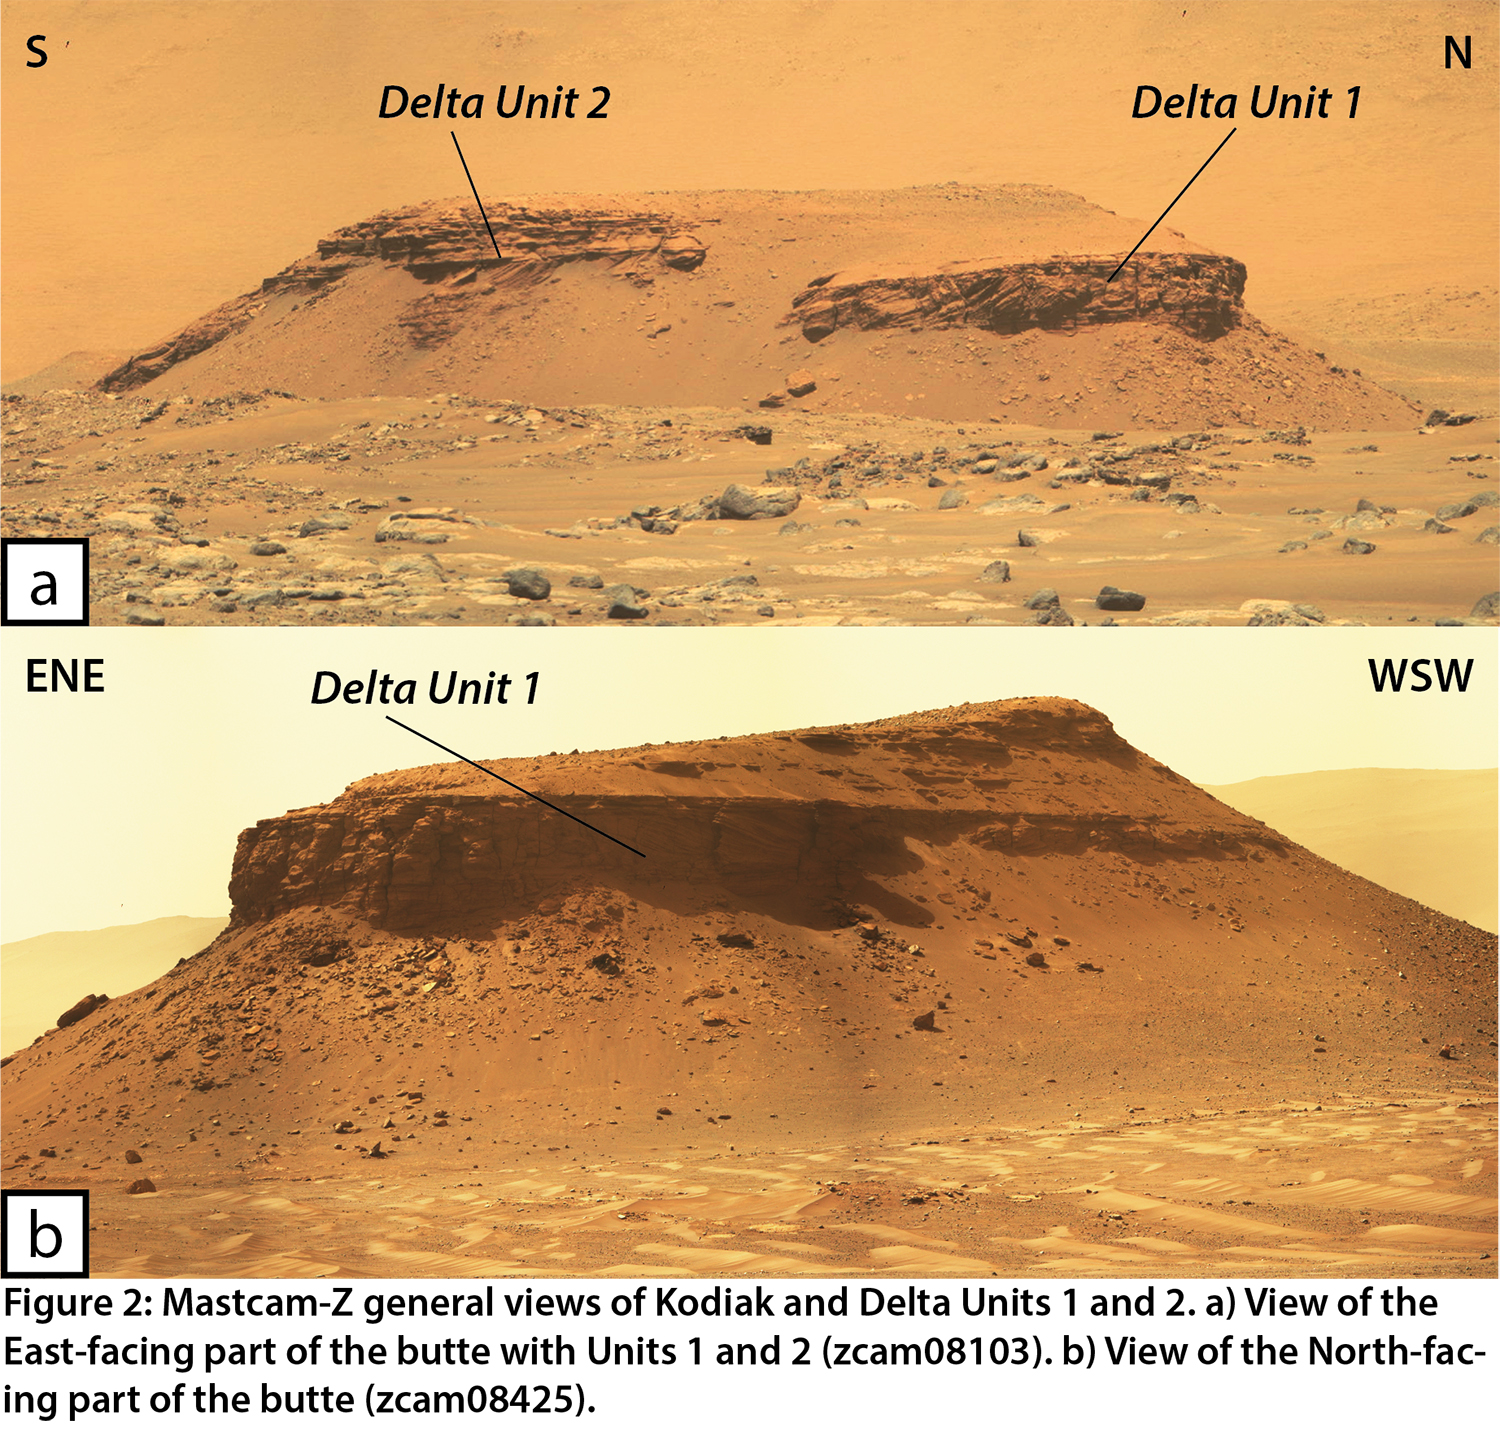
We use both 2D high-resolution image data acquired by Mastcam-Z and SuperCam’s RMI instruments, but also 3D Digital Outcrop Model (DOM) reconstructed from RMI remote observations (e.g., [2], visible online at: https://skfb.ly/o89yU). While both views help us in determining the stratigraphic architecture of the butte, the later being critical in assessing with more precision the sediment transport directions, and especially their temporal variations within distinct units [2]. That is, we are able to describe at least two main depositional episodes recorded at Kodiak, with Delta Units 1 and 2 (Fig. 2). Both units are characterized by a well-evidenced Gilbert-type succession of bottomsets, foresets and topsets, of a similar size and extension. The lower elevation and position further north of Delta Unit 1 (Fig. 2) indicates that it predates Delta Unit 2. An overall direction of transport toward the south-west is observed for this unit from the dip of foresets observed from both east and north faces.
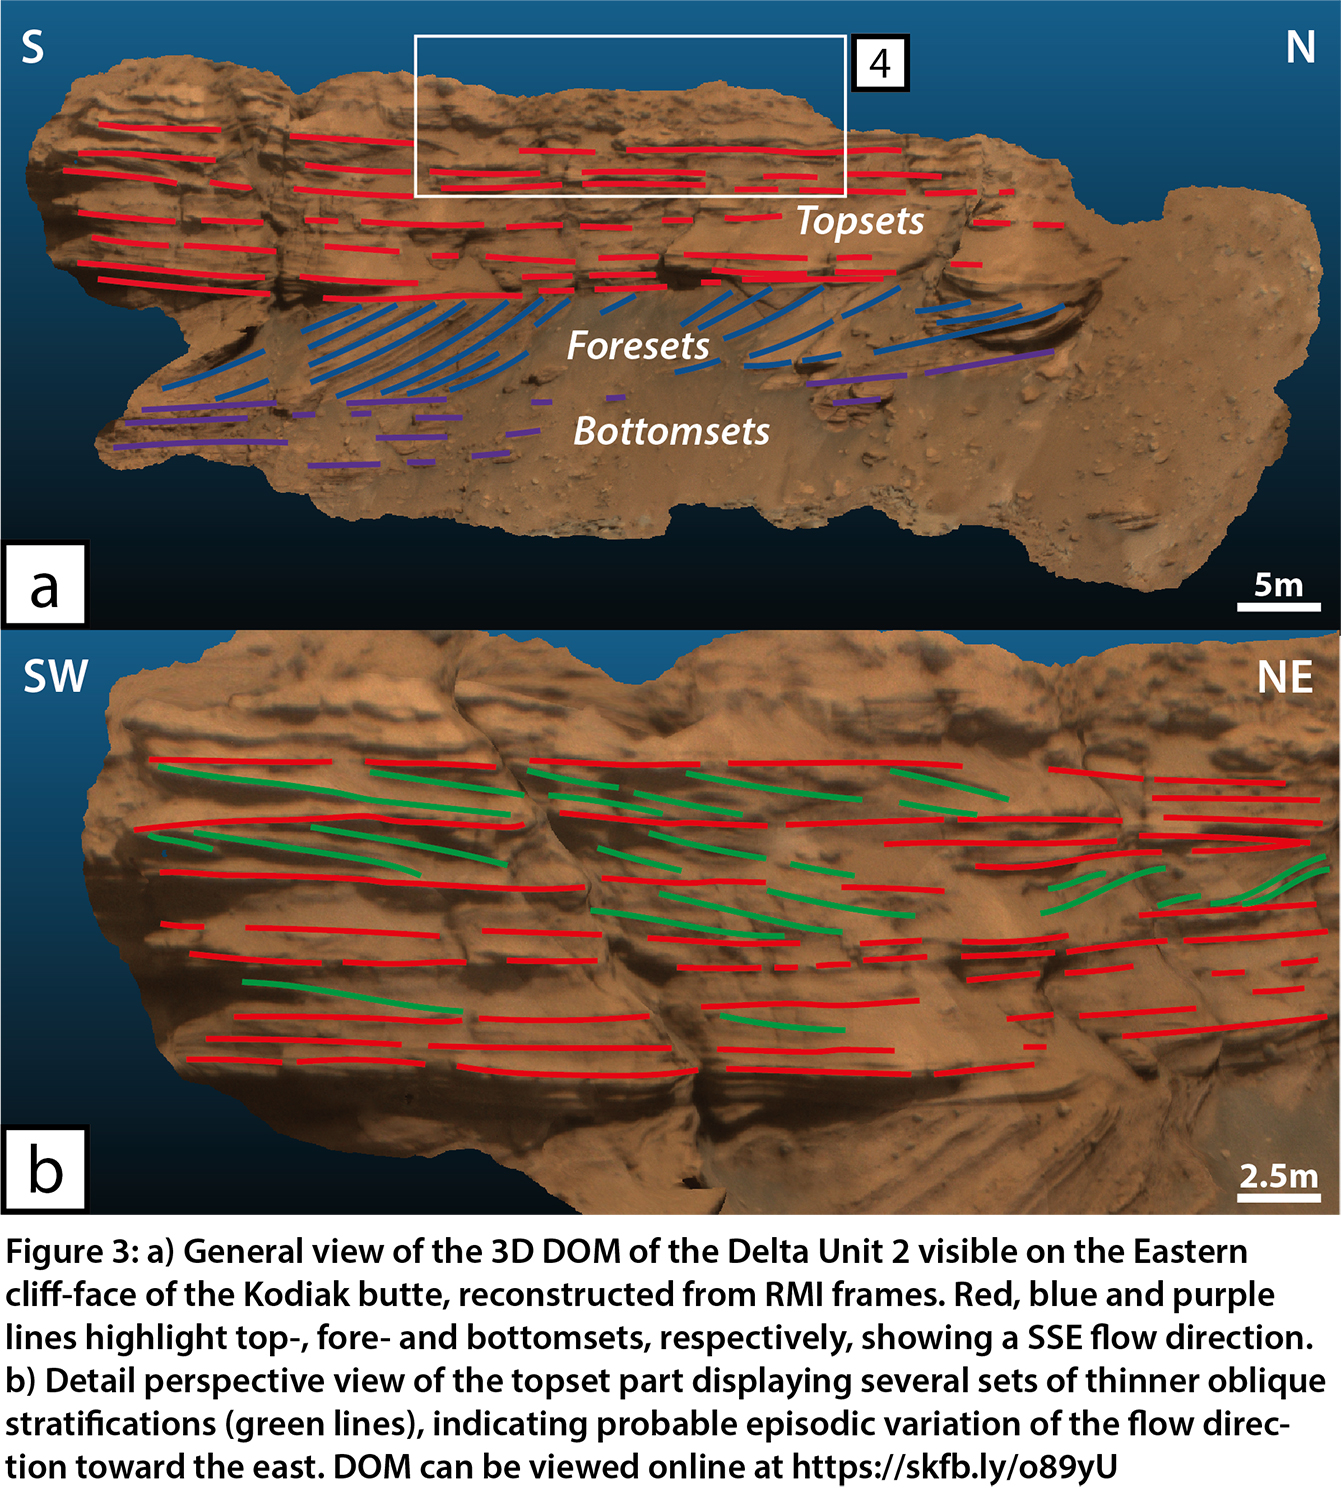
Delta Unit 2 was observed in the first part of the mission, when the rover was positioned about 2 km away to the east, and was first characterized in [1]. High-resolution RMI images [3] allow us to characterize a sedimentary succession made of rocks whose texture ranges from coarse sandstones to (boulder) conglomerates, which is common for deltaic systems. A closer observation of the sedimentary architecture was possible using a 3D DOM made from RMI images [2] (Fig. 3). On this model, we were able to precisely delimits the different bottomsets, foresets and topsets (Fig. 3a), but also to provide measurements of the individual bed thicknesses within each interval with an average of 15 cm, 17 cm and 19 cm for bottomsets, foresets and topsets, respectively. After close observation, it appears that the topsets of Unit 2 also show that at least three sets of oblique stratifications do not follow the same transport direction than the other beds, evidencing a transport clearly toward the east (green lines in Fig. 3b). Also, individual beds exhibit a reduced thickness with an average of 13.5 cm per bed (Fig. 3b). While the overall unit 2 follows a usual stacking pattern for the deposition of a prograding delta, it appears that local and recurring variations in the energy and direction of transport occurs during the late-stages of the delta’s deposition, probably following onset of meandering beds or varying direction braided bars, an observation not dissimilar to the “curvilinear unit” observed on the main delta front at equivalent elevations [4].
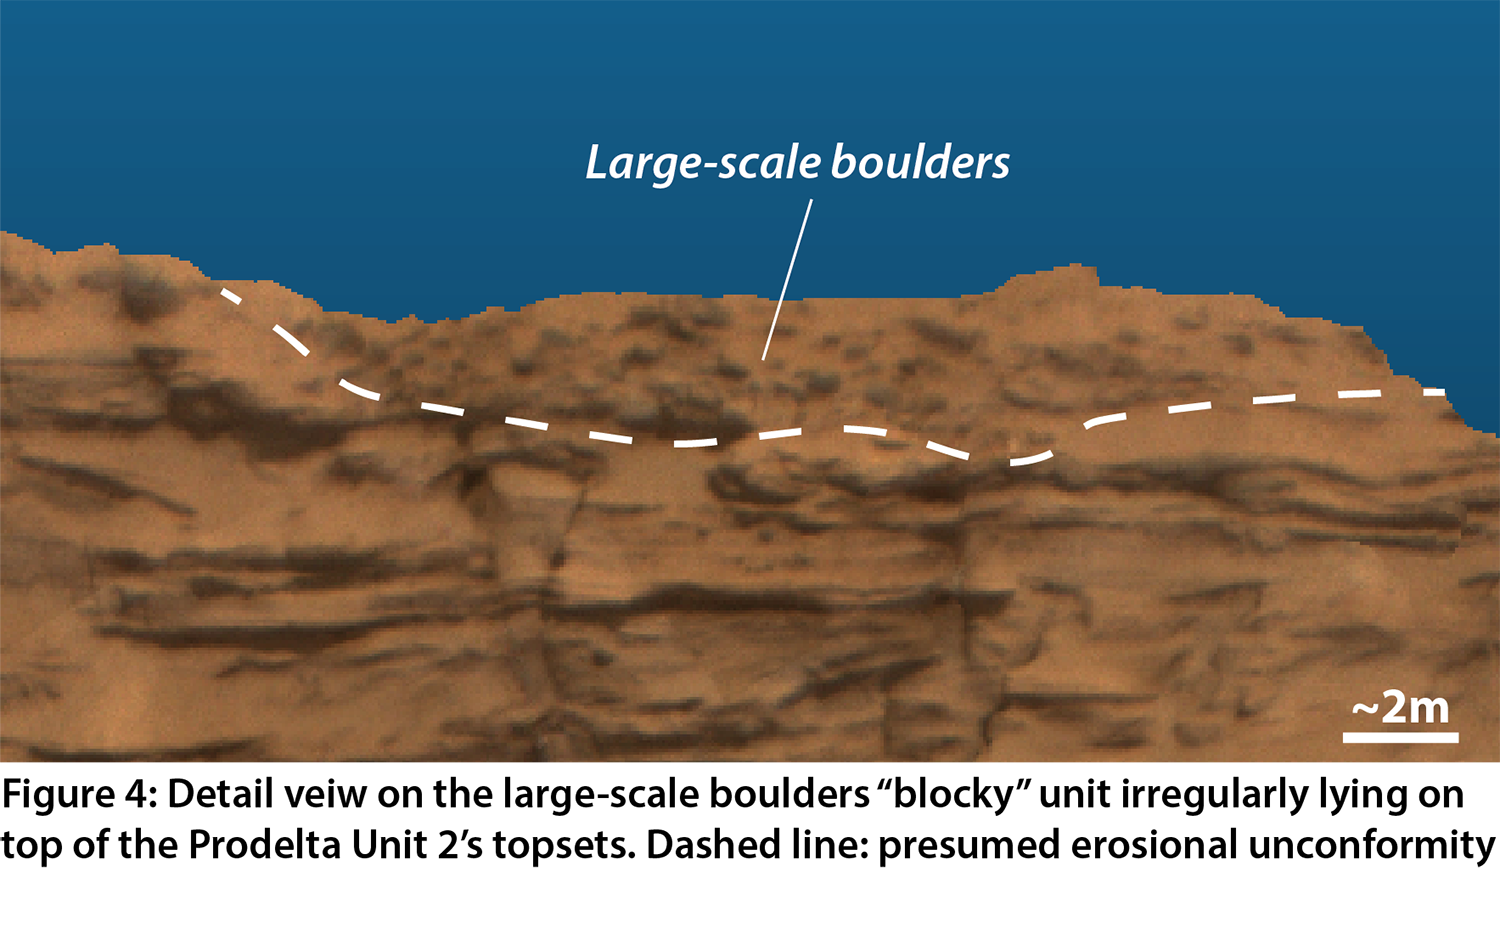
Finally, large-scale boulders are observed to irregularly and unconformably overlie both Delta Units 1 and 2 (Fig. 4) on top of the butte. These clasts have been measured on top of Unit 2 have an average long-axis size of ~52 cm, and range from 22 to 104 cm (Fig. 4). These poorly sorted and angular clasts are part of a clast-supported unit that seem to have deposited episodically a certain amount of time after the deposition of the main delta. This implies a strong decoupling between both settings, implying a complex history of the area, whose timely relations are yet to be ascertained.
While the exploration of the main delta of Jezero crater is just beginning, the characterization of the Kodiak butte, a remote distal remnant of the past deltaic fan, is already a “gold mine” of geologic information about the aqueous past of this area. The two different episodes in the delta’s history, represented by Delta Units 1 and 2, their inner variations, but also the presence of the later boulder conglomerate unit, are informing us about the late-stage evolution of the hydrological history of the Jezero crater. This is notably important since we are observing the foresets/topsets transition to occur at ~-2490 m in elevation, that is about 100 m lower than the modeled lake level from the craters’ outlet valley [1]. Following work to precisely characterize Delta Unit 1 and the (co-)relations to the main delta units [5, 6] will therefore be paramount in assessing the paleoenvironmental evolution of the basin, its fluvial activity, and its link to the regional to global climate of ancient Mars.
References: [1] Mangold et al., 2021, Science, 374, 6568. [2] Caravaca et al., 2022, LPSC, Abstract #1189. [3] Gasnault et al., 2021, LPSC¸ Abstract #2248. [4] Stack et al., 2020, Space Science Reviews, 216, 127. [5] Mangold et al., 2022, LPSC, Abstract #1814. [6] Gupta et al., 2022, LPSC, Abstract #2295.
How to cite: Caravaca, G., Dromart, G., Mangold, N., Gupta, S., Le Mouélic, S., Gasnault, O., Maurice, S., and Wiens, R. C.: Overview of the facies and stratigraphy of a distal Delta remnant at the Kodiak butte (Jezero crater, Mars), Europlanet Science Congress 2022, Granada, Spain, 18–23 Sep 2022, EPSC2022-345, https://doi.org/10.5194/epsc2022-345, 2022.
The Raman Laser Spectrometer (RLS) is part of the analytical payload located inside Rosalind Franklin rover for the Exomars Mission to Mars.
The RLS instrument consists of three main units: 1) the optical head that focus the laser excitation on the sample and collect the scattered light from the same area (with a 50 microns spot); 2) the spectrometer analyzing the Raman signal in the spectral range 150-3800 cm-1 with an average spectral resolution of 8 cm-1 and 3) an electronic control unit in which the laser is included. These units are connected by optical fibers and electrical hardness. The instrument will investigate powdered samples collected by the rover at the surface and subsurface of Mars at the mineral grain scale. (1)
The RLS development stages comprised the development, verification, test and evaluation of the scientific performances of two main models: Engineering Qualification Model (EQM) and Flight Model (FM).
Because the consecutive delays in Exomars launch to Mars an important aspect related with this situation is the evaluation of the scientific performances with time of these models comparing the results obtained at the pre-delivery stage with those obtained at the rover analytical laboratory drawer (ALD) and rover integrated stages.
Additionally it is also of great interest evaluate the scientific results obtained in the framework of dedicated science activities currently ongoing at the ALD and rover levels in which the evaluation of the combined science potential among the three instruments inside Rosalind Franklin rover (MicrOmega, RLS and MOMA) is outstanding.
In the present work interest is devoted to the scientific performances evaluation of the RLS-FM at the different levels: pre-delivery, rover analytical drawer (ALD) and finally integrated on the Rosalind Franklin rover.
For that, observation of the data obtained on the calibration target (CT) is mainly used although data obtained on standard and natural samples at the pre-delivery stage are also presented and discussed.
Instrument response as function of temperature, atmospheric pressure conditions and changes on the main acquisition parameters was evaluated. Estimation of the different band parameters observed (band position, intensity, bandwidth and SNR) allowed performances comparison along the different phases of the process and comparison with the established scientific requirements.
References:
- Rull, S. Maurice, I. Hutchinson, A. Moral et al., Astrobiology, 2017, 17, 627-654.
How to cite: Rull, F., Moral, A., Lopez-Reyes, G., Perez, C., Seoane, L., Zafra, J., Veneranda, M., Manrique, J. A., Rodriguez, E., Rodriguez, P., Belenguer, T., and Prieto, O.: Scientific performances evaluation of the Raman Laser (RLS) FM-instrument for Exomars mission to Mars, Europlanet Science Congress 2022, Granada, Spain, 18–23 Sep 2022, EPSC2022-1068, https://doi.org/10.5194/epsc2022-1068, 2022.
Introduction
We developed a simple model to simulate Ma_MISS data acquisition and visualization and to support the development of acquisition strategies.
The Ma_MISS instrument
Ma_MISS (Mars Multispectral Imager for Subsurface Studies) is the miniaturized VNIR spectrometer embedded in the drill system of the ExoMars rover[1]. Ma_MISS will perform spectral reflectance measurements inside holes drilled into the surface of Mars up to a depth of 2 m. It will characterize the mineralogy and stratigraphy of the borehole walls and will allow the in-situ study of the subsurface environment, before any samples are collected and extracted. Taking advantage of the finely controllable drill tool motion, Ma_MISS can map the borehole walls. In addition to single point acquisitions, Ma_MISS can also be programmed to acquire “Ring” and “Column” scans, where the spectrometric acquisitions are interleaved with step rotations or translations of the drill tool.
Borehole stratigraphy model
To easily simulate Ma_MISS surveys, we first developed a simple model of a borehole. As further described in [2], six different simulant samples were prepared. Reflectance spectra were acquired on each of the samples with DAVIS-MOT, the new Ma_MISS laboratory model[3]. The reflectance spectra of these samples are shown in Figure 1. Six different regions were drawn as polylines on a 2D projection of the cylindrical borehole walls. Out of the six simulants, a different one was assigned to each region. As shown in Figure 2, this model was made to represents a 250 mm deep section of a borehole, exhibiting a varied stratigraphy with 5 different layers and a vertical vein.
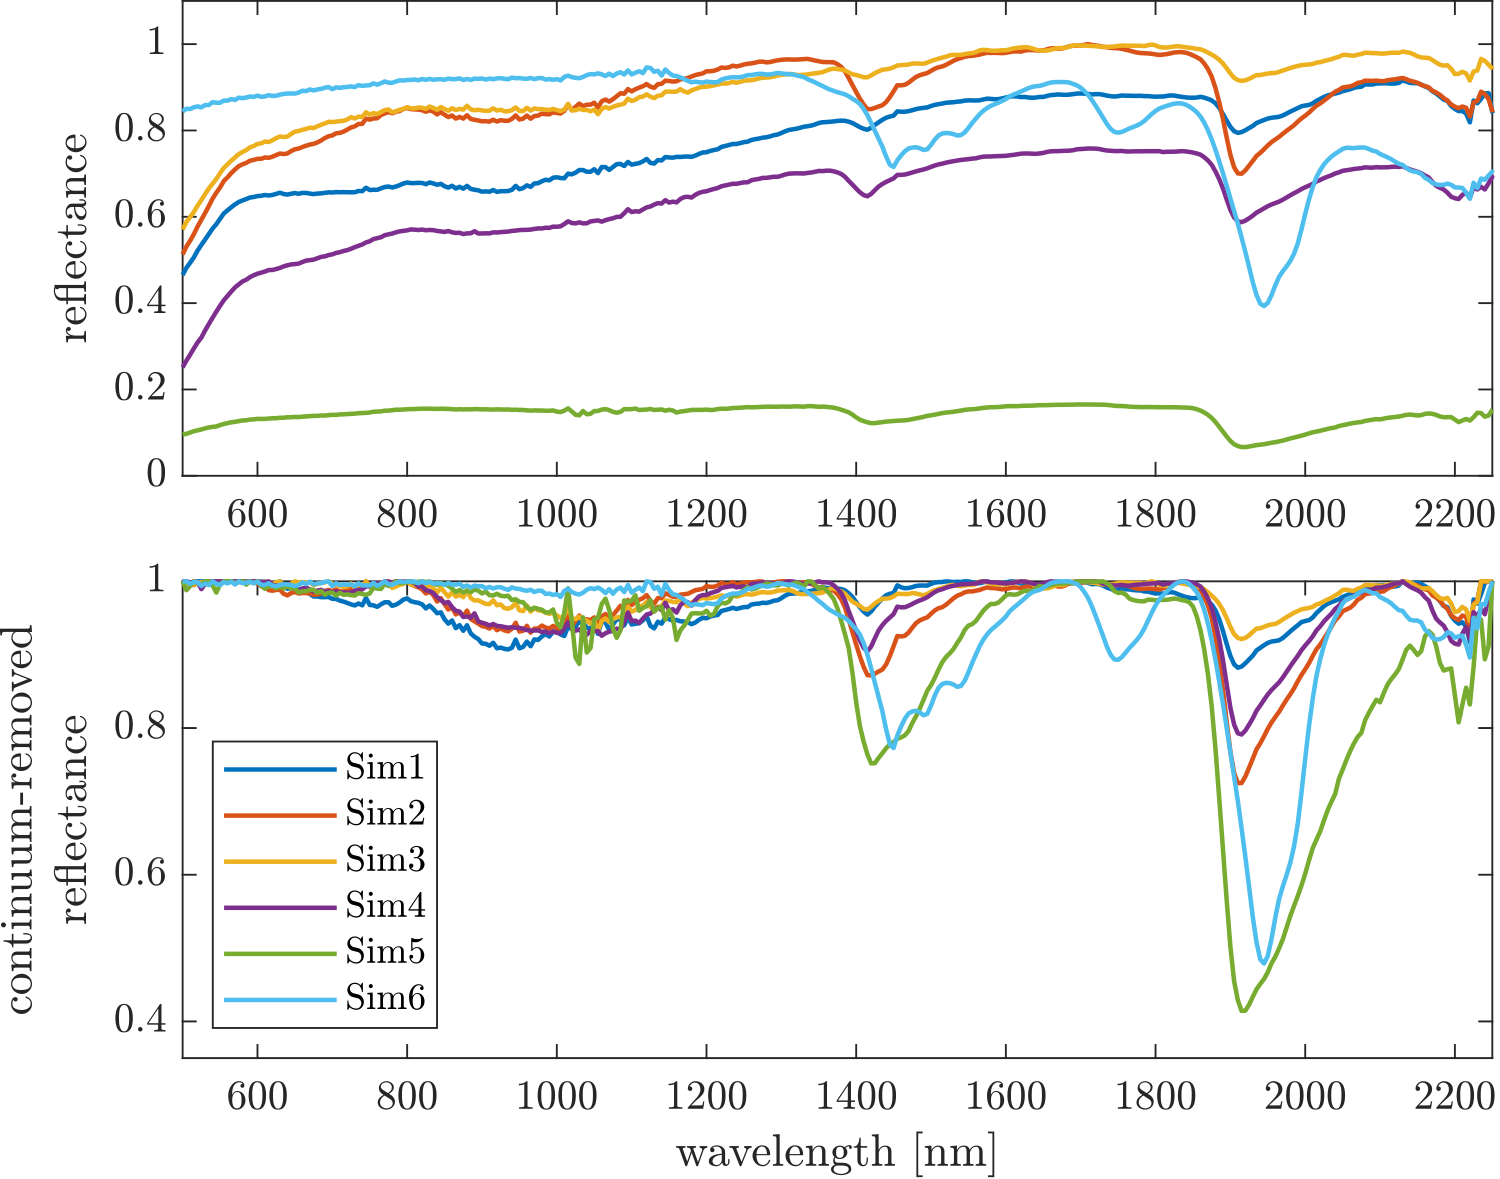
Figure 1: Reflectance spectra of samples.
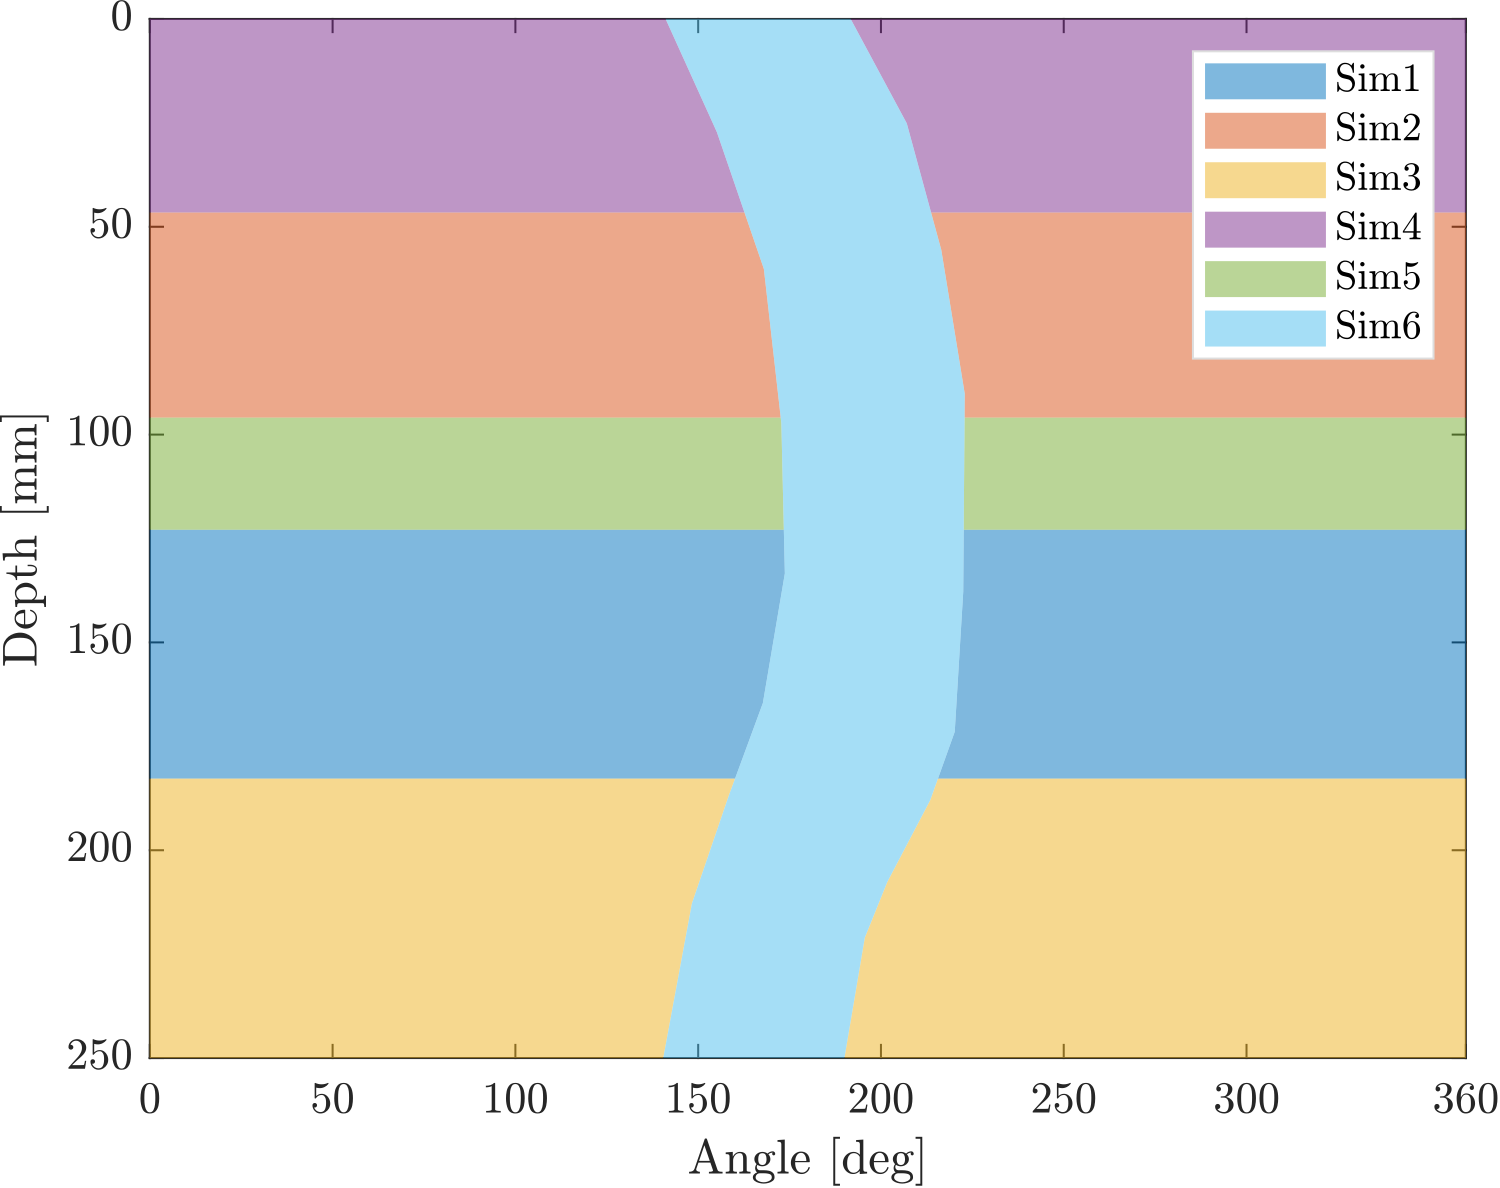
Figure 2: Borehole stratigraphy model
Survey simulation
The borehole model can be used to quickly simulate a Ma_MISS survey. Once the acquisition strategy of the survey is defined, the coordinates of the points where spectrometric acquisitions are to be simulated are computed. Small random errors can be added to the coordinates to simulate the accuracy of the drill tool actuators and sensors. For each point of this set, we generate a spectrum that simulates the real acquisition. Each simulated spectrum is generated from the measured spectra of one of the six simulants, based on its region in the stratigraphy model, with the addition of random shifts, slopes, and noise to simulate out-of-focus acquisitions and instrumental noise.
Development of acquisition strategies
The simulated data can be used to develop acquisition strategies, aimed at maximizing the information gained while limiting the time required to complete a survey of a drilled borehole. The time required to complete the survey depends on both the spectrometer acquisition settings and the drill tool motion. For example, the duration of a drill movement depends on angular and vertical step sizes (hereafter referred to as Δθ and Δz respectively), with vertical translations generally taking longer than rotations. Multiple combination of these parameters can be tried out on the same stratigraphy model to evaluate which strategy can provide the best compromise between spatial resolution and time required.
Simulated data examples
For the 4th RSOWG (Rover Science Operations Working Group) Simulation, held in November 2021, we provided data from a simulated Ma_MISS acquisition survey. The simulated Ma_MISS survey (“survey A”) consisted of:
-6 rings of 360 points each, with Δθ=1° and displaced vertically by Δz=50mm;
-8 columns made up of 126 points each, taken with Δθ=45° and a vertical step of Δz=2mm.
This amounts to a total of 3168 individual spectra. A view of the simulated data is shown in Figure 3 and Figure 5A. This acquisition strategy provides a high angular resolution in the rings with Δθ=1° (which can be useful to identify small vertical features or individual grains) and a good vertical resolution in the column with Δz=2mm (useful to reconstruct the stratigraphy of the subsurface).
Another survey (“survey B”) that was simulated with the same model is shown in Figure 4 and Figure 5B-C. In this case the acquisition was made up of 35 rings of 72 points each, with Δθ=5° and Δz=6.25 mm, for a total of 2952 spectra. This strategy offers worse spatial resolution in both the vertical direction and along the circumference but can nonetheless provide a more regular overall view of the borehole stratigraphy.
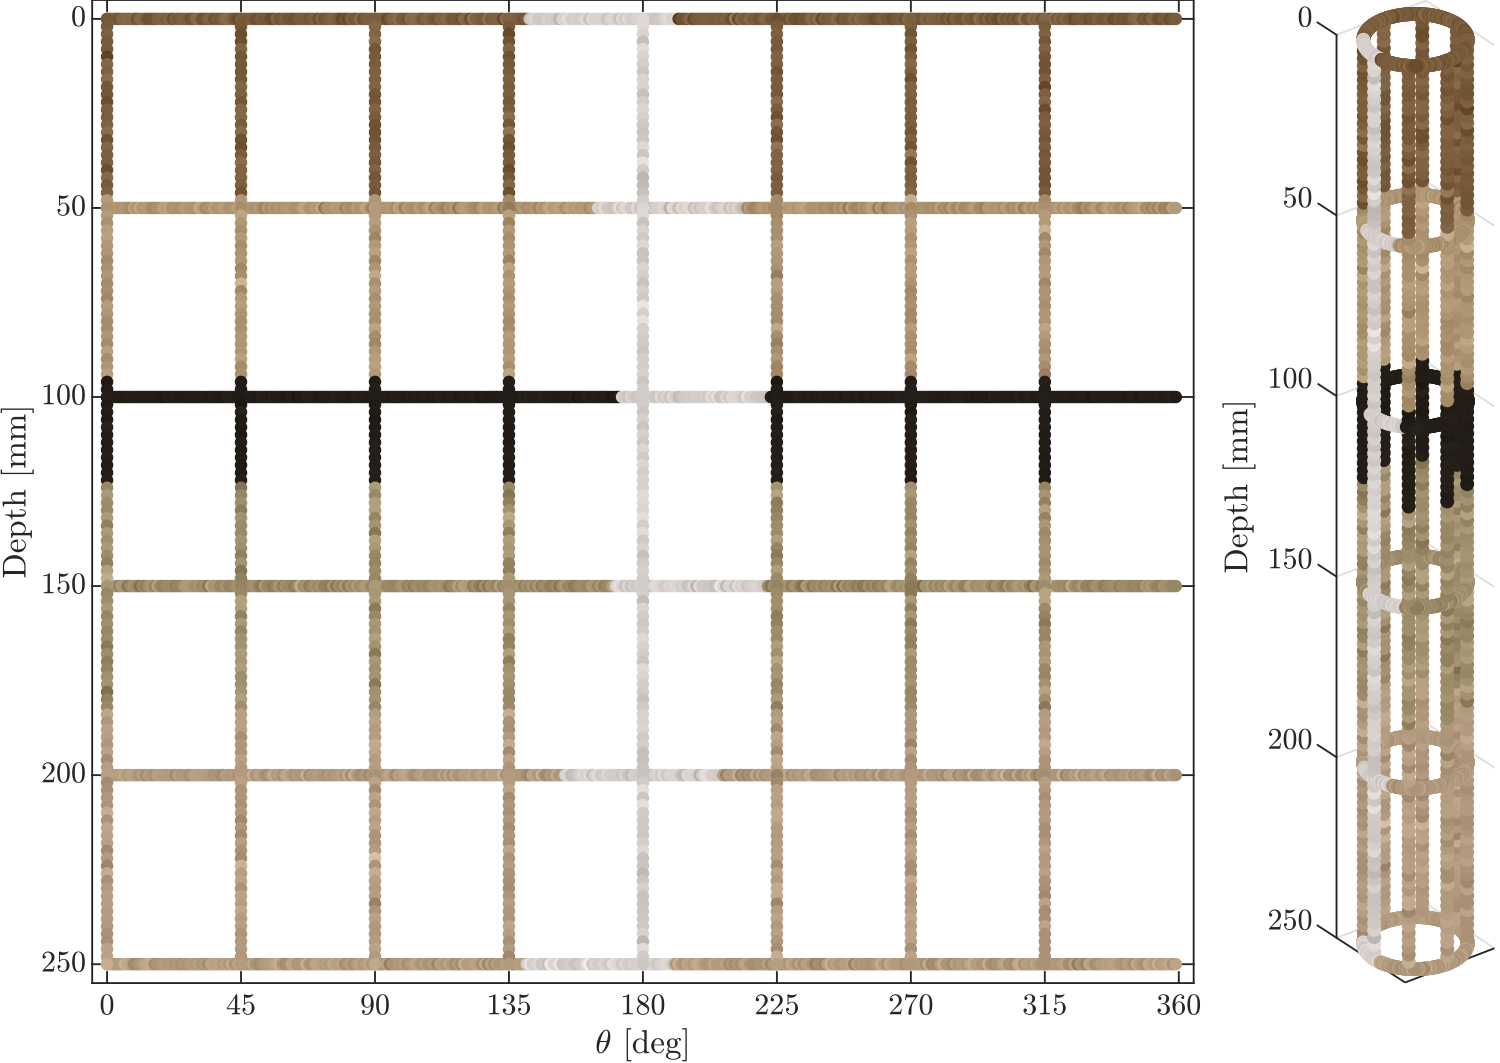
Figure 3: Simulated survey A
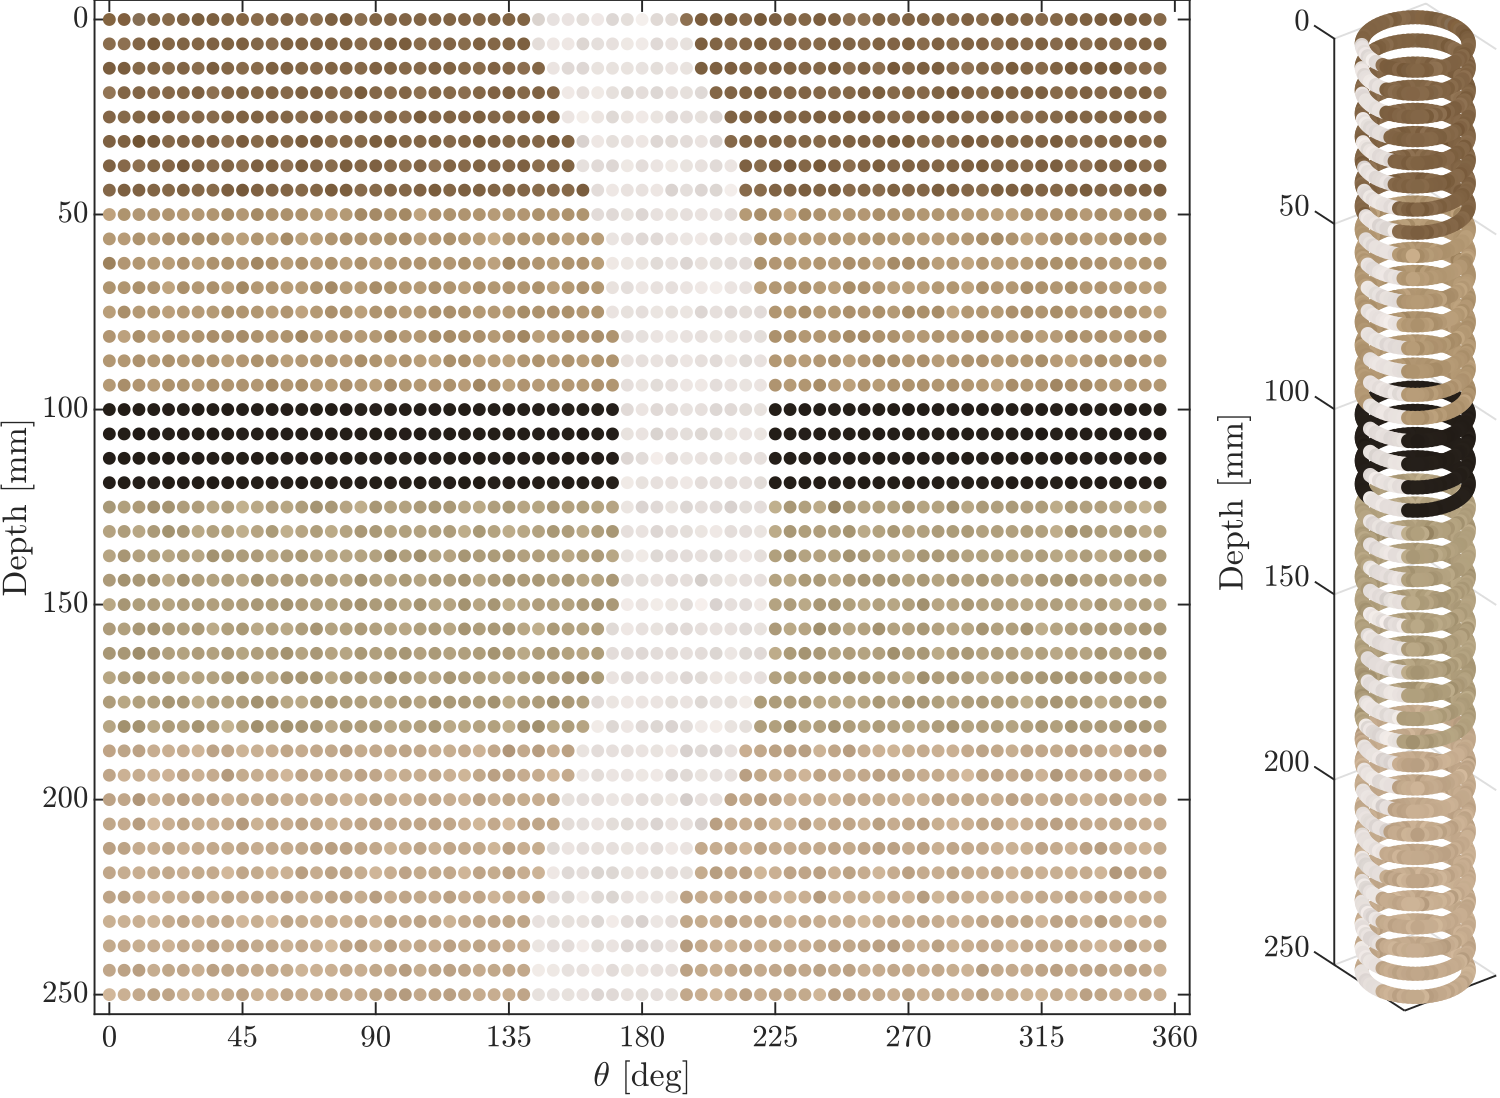
Figure 4: Simulated survey B
Data visualization
In Figure 3 and 4, each dot represents a simulated spectrum. In this case the colour of each dot was computed from its spectrum such that it looks somewhat like it would appear to the human eye. The same colours were interpolated across the surface (with a scattered data bicubic interpolation method) to obtain views like those shown in Figure 5A-B. Other useful visualizations of these spectra can be obtained by highlighting other spectral features, e.g., band depths, band ratios or specific IR bands. An example is shown in Figure 5C, where the 1.95 µm band depth is computed on the simulated spectra of survey B and its value is interpolated across the cylindrical surface.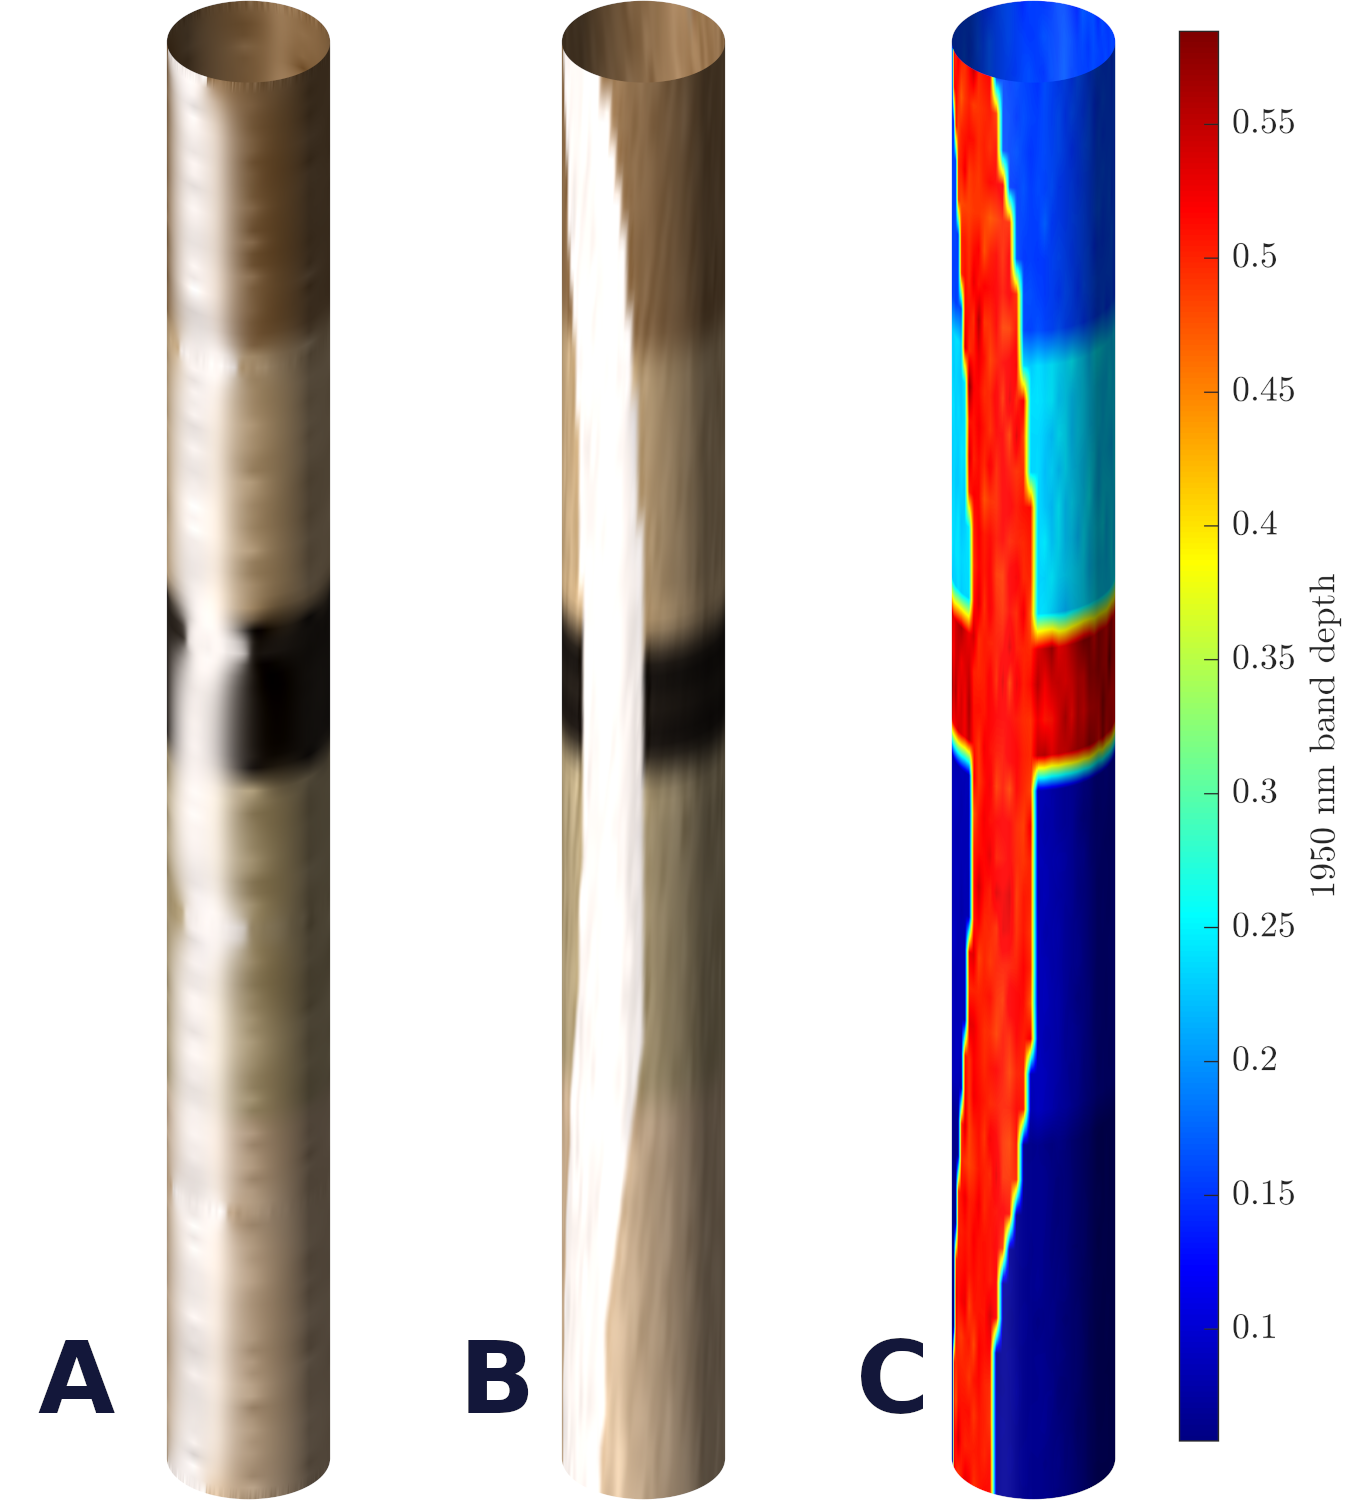
Figure 5: Visualization of simulated data on the borehole surface
Future work
The developed simulation model can be easily extended to other borehole stratigraphy models, with different geometries and spectra. It will also be complemented with tools to estimate the time needed to perform each simulated survey, which will make it a useful tool for the optimization of acquisition strategies. The developed data visualization tools can also be used with real, measured data. We are planning to verify the simulated data on real surveys. In fact, we can perform a complete survey with the Ma_MISS laboratory breadboard on an actual drilled sample. The acquired data will be visualized and used to reconstruct the sample stratigraphy.
Acknowledgments
This work is supported by the Italian Space Agency (ASI) grant ASI-INAF n. 2017-412-H.0.
References
[1] De Sanctis M.C. et al. (2017): Astrobiology, 17, 6-7
[2] Ferrari M. et al. (2022): LPSC53, Abstract#1339
[3] De Angelis S. et al. (2022): LPSC53, Abstract#1796
How to cite: Rossi, L., Ferrari, M., De Sanctis, M. C., Frigeri, A., De Angelis, S., Costa, N., Altieri, F., Formisano, M., and Ammannito, E.: Simulation and optimization of Ma_MISS surveys, Europlanet Science Congress 2022, Granada, Spain, 18–23 Sep 2022, EPSC2022-391, https://doi.org/10.5194/epsc2022-391, 2022.
The Mars Organic Molecule Analyzer instrument (MOMA) in the Exomars Rosalind Franklin rover can analyse Mars samples with different technics: Laser Desorption-Mass Spectrometry, Pyrolysis-Gas Chromatography-Mass Spectrometry (Pyr-GC-MS), and derivatisation followed by GC-MS. For the last one, three different derivatisation reagents are available and can be used depending on the molecular families to be functionalised: TMAH, DMF-DMA and MTBSTFA. They are sealed in metallic capsules opening at a specific temperature using relevant eutetics. Hence, the sample can be heated in the oven before reacting with the reagent. This can enable to dry the sample, removing most of the free water present in the sample that could consume a part of the reagent, and to proceed to a thermal extraction of the organic molecules, enhancing their recovery yield. However, compared with classical routine laboratory procedures, this in-situ wet chemistry sample preparation implies very specific conditions due to this one pot one step system and space instrumental constraints in term of weight, operational temperature and available energy.
We focused our work on GC-MS with sample derivatisation by MTBSTFA. This reagent is kept in tight capsules that open only at 221°C whereas routine similar laboratory derivatisation reactions are usually done at about 75°C in the presence of DMF. The targeted molecules are the amino acids (AAs), linear carboxylic acids (CAs) and aromatic CAs that could be preserved on Mars (benzoic, phtalic, trimesic and mellitic acids). In order to optimise the time of preparation of the samples, a series of experiments was carried out with laboratory instruments with standards and Orbagnoux soil (Kimmerdgian, late Jurassic).
First, the influence of the temperature of derivatisation and the absence of DMF on the derivatisation of AAs and CAs was studied. It showed that the presence of DMF provides a better derivatisation for AAs with fully derivatised products while many partially derivatised by-products appear otherwise. Consequently, there is a decrease of the signal for most of the amino acids. Additionally, several processes may occur upon heating at 221°C to reach the eutectic temperature (chemical decomposition, condensation), leading to the apparition of other by-products. Some of them can be used as new markers while some could create misinterpretation of the data results on Mars like the a-aminobutyric acid. Therefore, building a database, including the mass spectra and retention times of all these molecules seems necessary. The derivatisation of AA is optimum after a 4-minute reaction. The results obtained for carboxylic acids are, however, more encouraging. Indeed, without DMF the difference in yield is slight for linear CAs, while its seems to favour the aromatic CAs derivatisation. Besides, high temperature decreases the reaction yield for linear CAs with 16 carbon atoms and higher, but provides a better derivatisation yield with aromatic CAs (Figure 1).
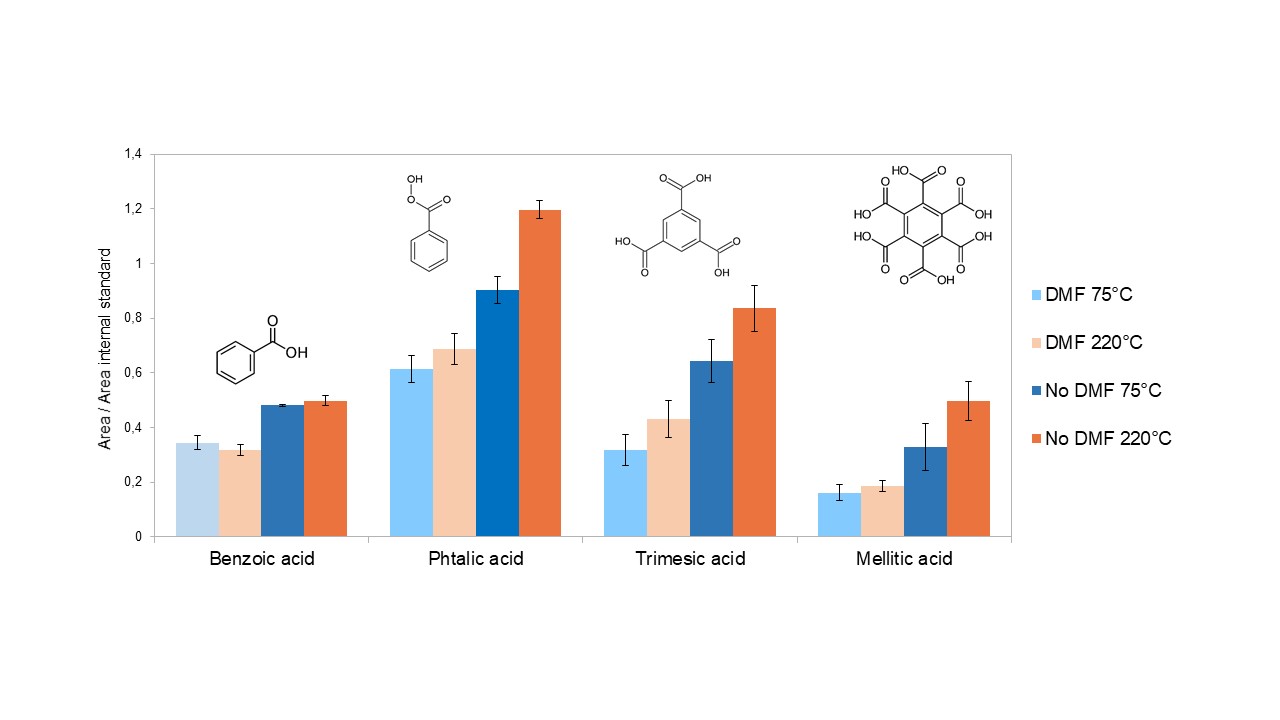
Figure 1: Aromatic carboxylic acids analysis comparaison between standards laboratory and MOMA condition derivatization.
Secondly, the extraction of carboxylic acid present in a soil matrix by thermal desorption at 200°C was studied on crushed fragments of natural terrestrial rocks from Orbagnoux. The analysis of the extracted molecules was carried out with a microreactor pyrolyse, enabling a one pot one step protocol as used for MOMA. First results indicated the detection after extraction of hexanoic acid (C₅H₁₁COOH), glycolic acid (C₂H₄O₃) and oxalic acid (C2H2O4). Extraction of CAs is incomplete if the thermal desorption step last less than 5 min, while a time greater than 7.5 min appears to degrade them. Optimization of CAs extraction is needed for the different soil matrices available for this study (other natural terrestrial rocks and extraterrestrial material as Murchison meteorite). The optimum time for CAs thermal desorption is also checked against optimum time for AAs. The total time of preparation is calculated as a function of the oven temperature ramp and shall be taken into account when programming a run. We wish to have the longest run to detect as much products as possible, better extraction and sensibility but due to the rover operation constrains we have a limited time and/or energy budget. However, compromises can be found to have an optimized trade-off between operational constrains and science return.
To validate the final protocol, Mars analog samples need to be extracted and analysed efficiently with the optimised parameters. The construction of a MOMA-like oven in our laboratory, coupled to a commercial GC-MS should enable to test our procedures with an analytical system close to the real MOMA instrument.
How to cite: Gonthier, R., Azémard, C., Stalport, F., Chaouche, N., Lepot, K., and Cottin, H.: Extraction and derivatisation of organic molecules on Mars: optimising sample preparation under MOMA instrument conditions, Europlanet Science Congress 2022, Granada, Spain, 18–23 Sep 2022, EPSC2022-991, https://doi.org/10.5194/epsc2022-991, 2022.
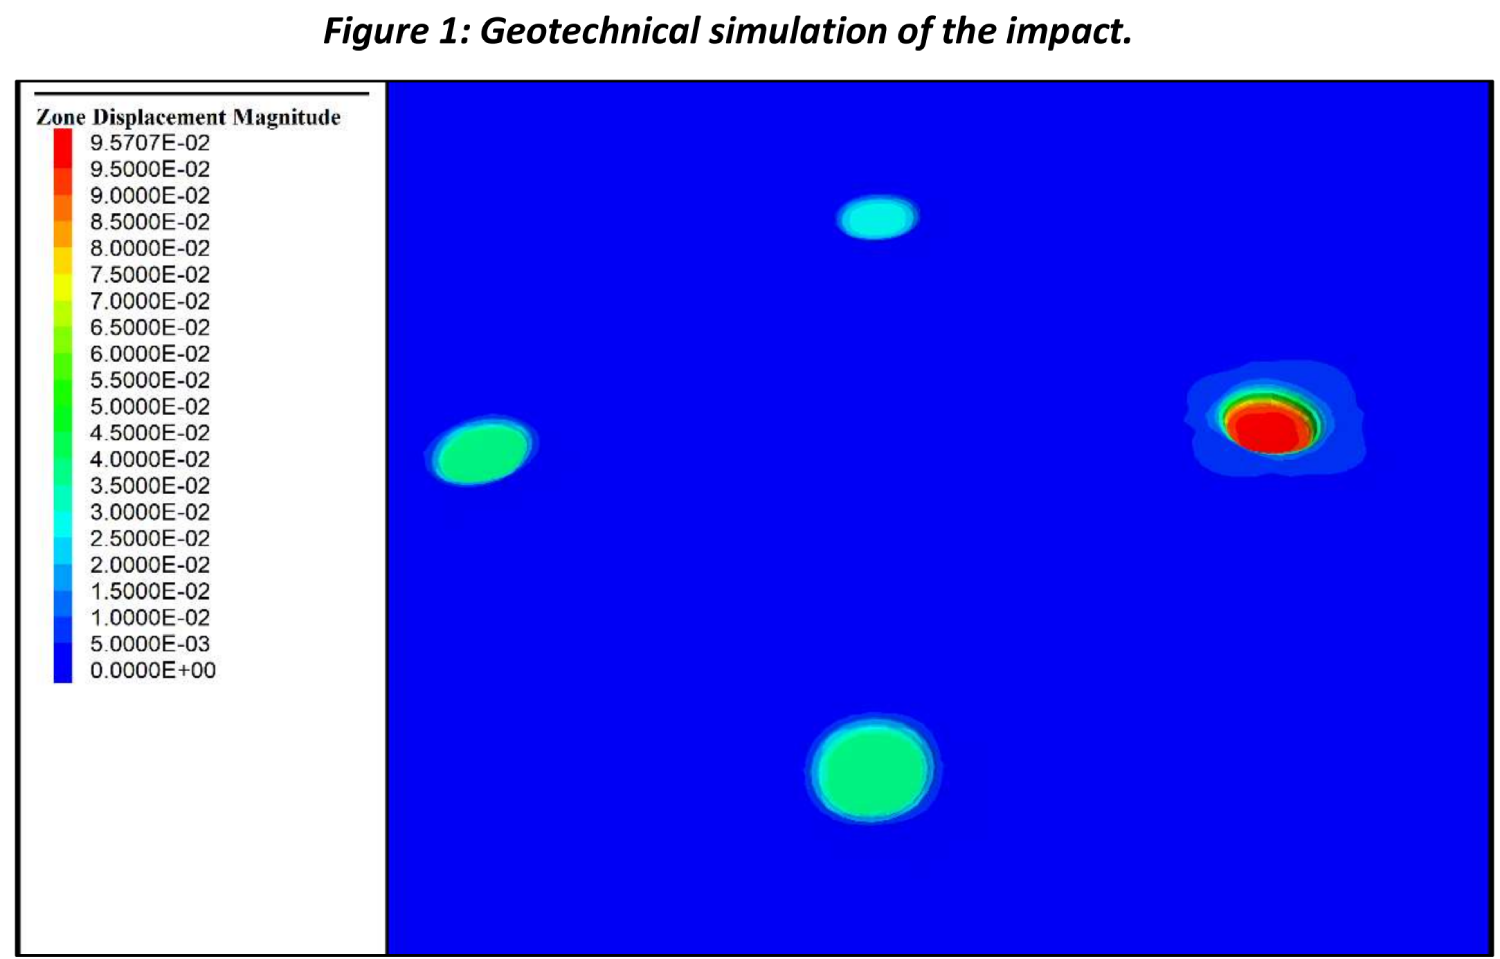
Introduction: This abstract deals with analysing the interaction between the ExoMars lander and the surface deformation at the touchdown in the Oxia Planum region of Mars. The analysis of ExoMars landing has been conducted by IRSPS under Thales Alenia Space Italia and ESA by means of computer simulations and physical test with a lander mock-up. The mission involves landing via retro-rockets to slow down the lander before impact. Despite the deceleration, the impact will transfer significant energies to the ground, exceeding those experienced in past missions.
Landing dynamics: Several variables of the descent phase influence the impact dynamics, such as the linear and the rotational terminal speeds, the inclination along the three axes, and the mass. We employed multi-body physics simulations to translate these input parameters into touchdown dynamics and ground stresses. The parameters and topographic data have been used in Unity and MATLAB environments to simulate the impacts. According to the Engineering Constraint of the mission [1], the topography has been modelled with slope values up to 20°.
Geotechnical parameters: Estimating the geotechnical characteristics of Martian soil remains a rather complex challenge. After detailed mapping of the landing ellipse and a careful identification of the surface lithologies, we simulated different lithotypes: “Regolith” (poorly-sorted sand to cobble, loose, non-lithified material), “Mudstone” (silty marl and lithified clays with low calcite content), “Sandstone” (sandstones from deltaic and fluvial environments), “Halite” (evaporites from lacustrine/flood plain and deltaic interchannels), “Tuff” (pyroclastic material) and “Basalt” (lava flows). The geotechnical parameters have been extracted from terrestrial analogues and simulants and summarised in Table 1.
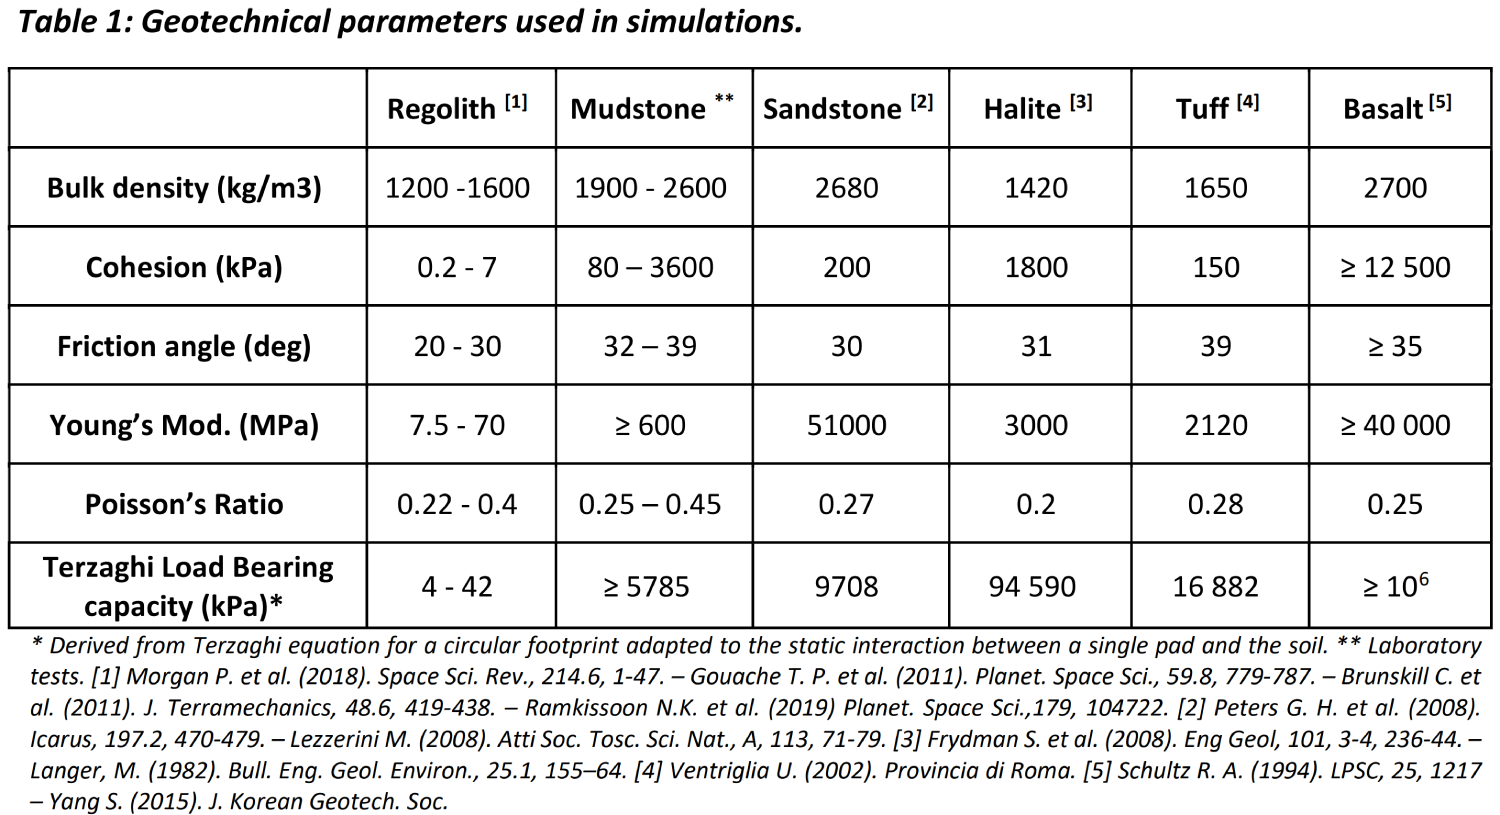
Geomechanical simulations: The numerical modelling of the stressed terrain has been performed with the Itasca FLAC3D (Fast Lagrangian Analysis of Continua in 3 Dimensions) software. One hundred and eighteen different simulations have been performed, tuning the landing variables concerning the impact dynamics, the geotechnical parameters, and the topography. The input conditions of the individual tests were composed through the programming languages FLAC3D-embedded FISH and Python. Apart from “Regolith cases”, the simulations resulted in minimal and negligible displacement (below 1 mm), although it does not exclude minimal surface fracturing of the rock. The results indicate that in none of the cases did the pressures reach the bearing capacity of the lithotypes, remaining in the domain of elastic deformations. In “Regolith” cases, due to the lower capacity, the excavation of the pads reached a range of values up to 10 cm with low terrain slopes (Fig.1) and up to 20-25 cm at higher inclinations. The cases where the first impact occurs on a single pad showed the highest displacement rates, especially when the Landing Platform is inclined perpendicularly to the ground. Subsequent contacts with other pads resulted in lower displacements due to energy dissipation and impact geometry.
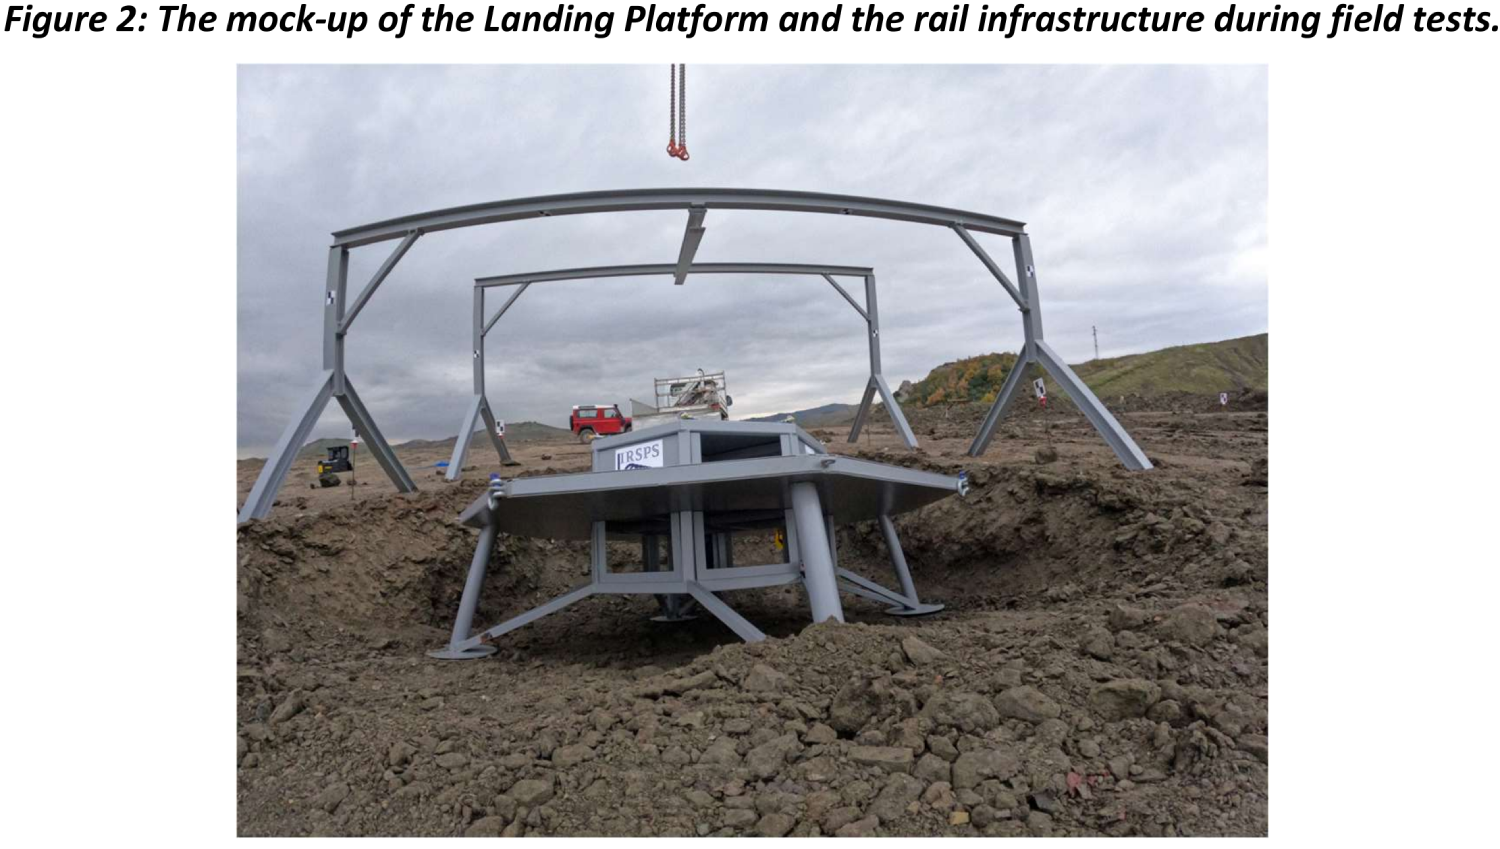
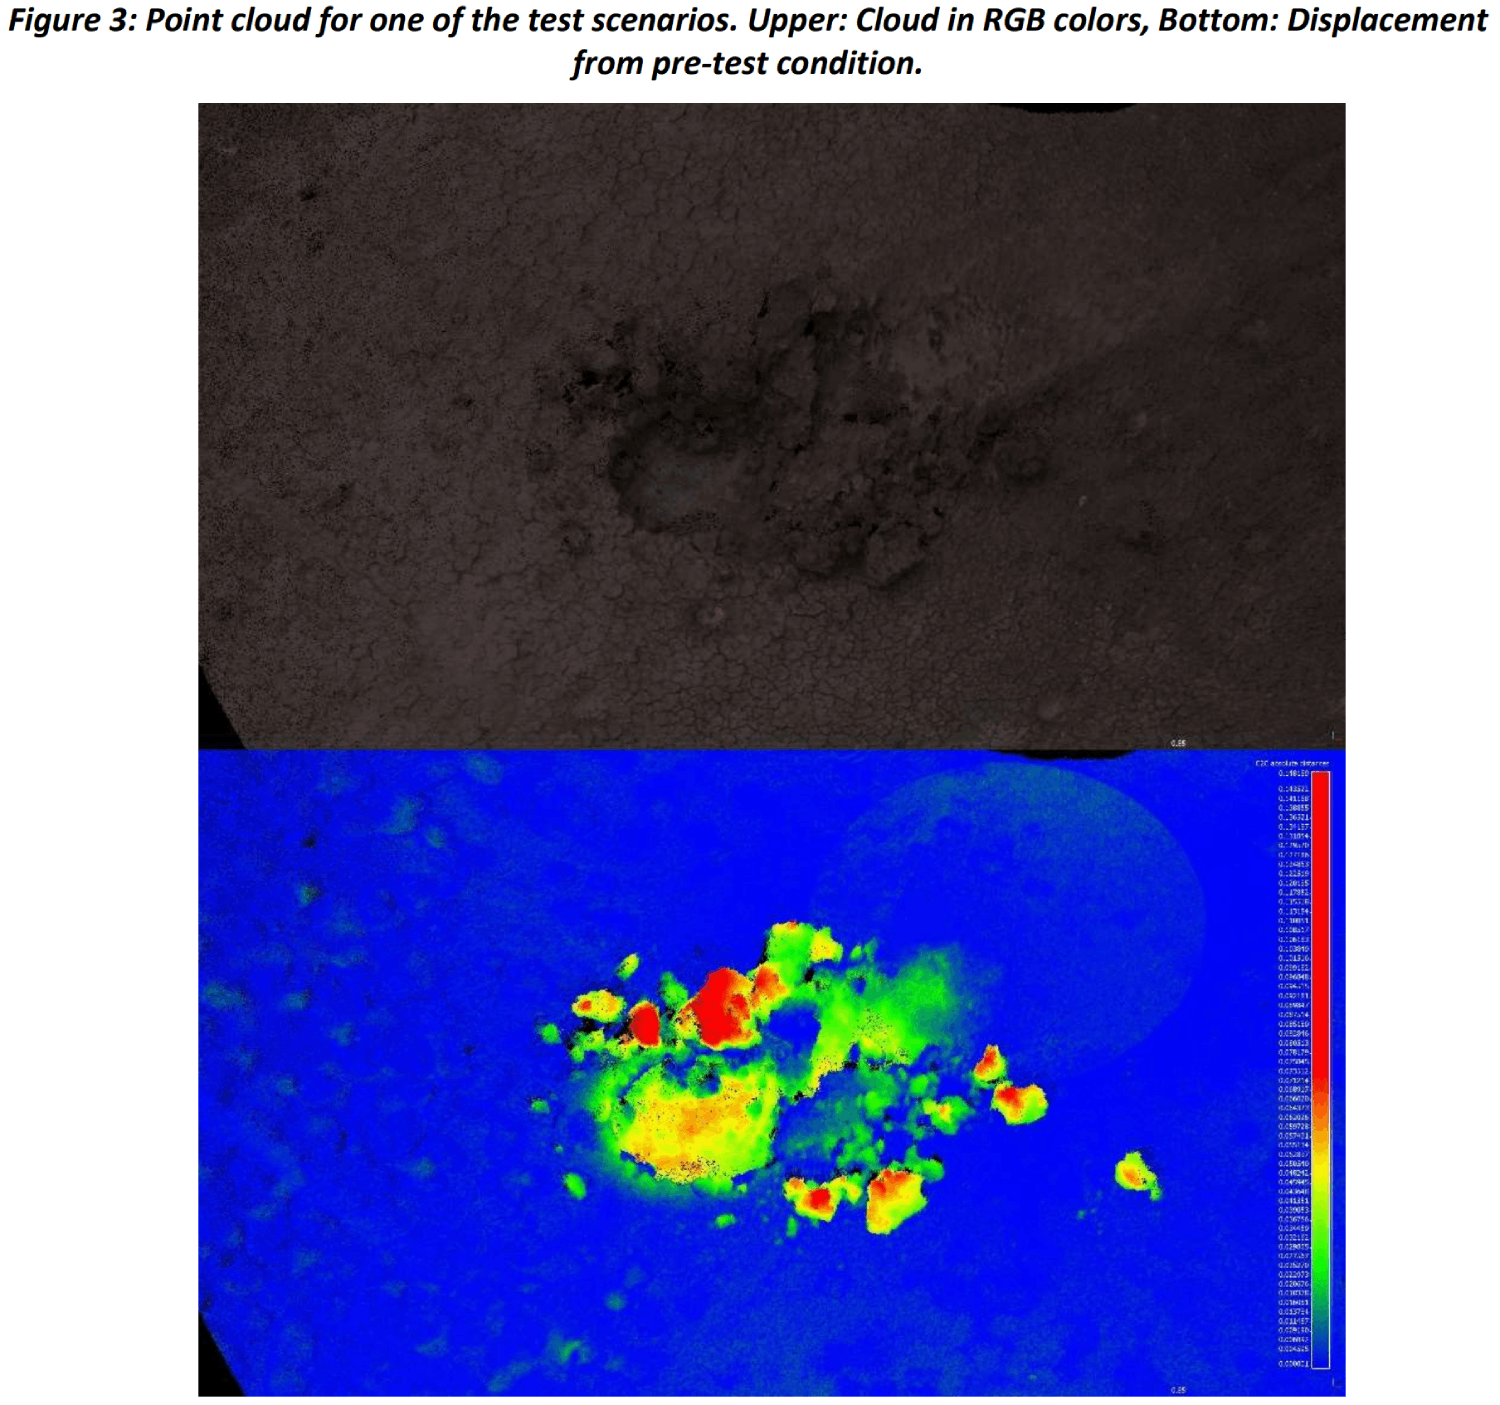
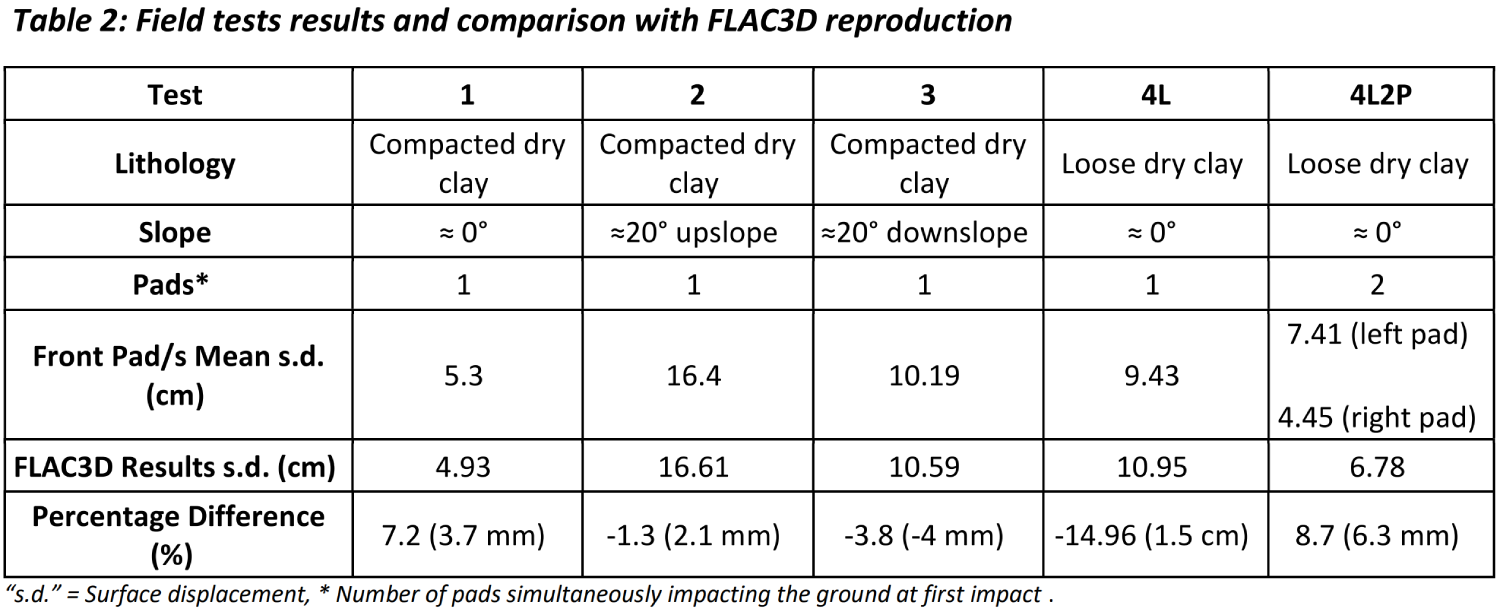
Field test campaign: To validate the adopted methodology and get more details about the impact dynamics, a field tests campaign has been performed with a full-size mock-up of the Landing Platform. The mock-up structure replicates the same shape and physical dimensions of the real L.P. but with a mass scaled from the original to compensate for the difference in gravity (Fig.2). It is equipped with an onboard triaxial IMU, capable of recording system speed and attitude during impact. The launching system, designed to reach desired velocities and address the touchdown conditions, consists of an inclined rail of steel girders and a quick release system. As an analogue of the regolith terrain material, we used the argillitic sub-unit of the “Argille Varicolori” formation, outcropping in southern Abruzzo and Molise regions in Italy. Geotechnical laboratory tests on terrain samples confirmed that the material is a good compromise between regolith and the clay-bearing lithology observed in the landing area. The material used has been prepared and left to dry in a quarry specialised in handling such material. Surface deformation has been measured with sub-centimetric accuracy through laser scanner point clouds realised before and after the tests (Fig.3). Eight different field test scenarios have been performed and subsequently replicated in FLAC3D for comparison. The test configurations were chosen to be representative of the variability of previous geotechnical simulations. The comparison, summarised in Table 2, displays a mean percentage difference of -0.8% (standard deviation of 8.5%), reaching a maximum of -15%. Deformation rates are also compliant with the ranges observed on Mars simulations, up to 10 cm in flat terrain conditions and up to 17 cm at 20° of the slope.
Conclusions: Surface deformation characterization studies have required the application of several simulations due to the wide variability of the physical, geological, and topographical factors involved. The field test campaign validated the methodology’s reliability and confirmed the expected deformation rates. The test results show that with significant thicknesses of regolith, the impact can lead to soil deformation rates ranging from five to more than twenty centimetres. Analyses of other lithotypes indicate more favourable results with negligible deformations due to not reaching the load bearing capacity. In both cases, the displacements should not reach values that compromise the onboard instrumentation, supporting landing safety in different surface conditions with a slope up to 20°.
References: [1] ESA (2013). ExoMars 2018 LSS UM Ref: EXM-SCI-LSS-ESA/IKI-003, Issue: 1.0, 17 Dec. 2013
How to cite: Tullo, A., Mancini, F., Aboudan, A., Calantropio, F., Martinez Barrio, A., Pacifici, A., and Ori, G. G.: Exomars landing: a geomechanical approach to impact characterization, Europlanet Science Congress 2022, Granada, Spain, 18–23 Sep 2022, EPSC2022-249, https://doi.org/10.5194/epsc2022-249, 2022.
Mars Express
With almost two decades of Mars observation behind it, Mars Express remains a dependable and highly productive mission.
Recent science highlights include (1) continued mapping of subsurface reflectors beneath the south polar layered ice deposits, and associated work to explain the cause of these reflections; (2) a global map of minerals on Mars with 200 m/px resolution, obtained from analysis of infrared spectra; (3) release of 50 m resolution Digital Elevation Models based on HRSC stereo topography for quadrangles covering an ever-increasing proportion of the global surface; (4) detailed characterization of the landing sites of the ESA, NASA and Chinese rovers; (5) a global climatology of ozone and water from both nadir and occultation observations and its relation to atmospheric dust; (6) transient atmospheric phenomena, such as a recurrent orographic cloud feature at Arsia Mons; (7) detailed investigation of the ionospheric structure, its variability, and coupling to the lower atmosphere; (8) continued monitoring of both the upstream solar wind conditions and of downstream escaping ions; (9) detailed study of Phobos during flybys at altitudes as low as 50 km.
Spacecraft and instrument teams continue to implement new and improved observation modes. One example is new MARSIS instrument software which now allows raw data to be returned from much longer subsurface sounding passes, improving the search for basal reflectors beneath polar ice caps; another example is mutual radio occultation observations between Mars Express and ExoMars Trace Gas Orbiter, potentially providing vertical profiles of ionospheric electron content with good spatial and temporal coverage.
ExoMars Trace Gas Orbiter
TGO has now completed two full Martian years of observations.
Highlights include (1) continuing non-detection of methane, with upper limits as low as 20 ppt by volume. Reconciling this continued non-detection by TGO with the background levels of several hundred ppt in Gale crater by MSL remains an enigma, stimulating further research. (2) detection of HCl, the first reported halogen-containing species in the atmosphere of Mars. (3) further detail of the transport of water to high altitudes, a critical step in the escape of water from Mars. (4) mapping of atomic hydrogen in the top 1-2 m of regolith, indicative of water ice and hydrated minerals, suggesting surprisingly high abundances of subsurface water ice in low latitude regions including one in central Valles Marineris; and (5) continued acquisition of 5 m colour imagery and digital elevation models over a wide range of terrain and target types, including landing site characterization.
Future plans: Mission extension cases for both missions have been submitted for the years 2023-2025 and 2026-2028. The extension of the observations would allow several new and optimized observation types; in particular, it will allow many collaborative observation opportunities with other missions and with ground- and space-based observatories. Of particular note are joint observations with James Webb Space Telescope, for which dedicated observations of Mars are due to be conducted in 2022-2023. Science goals include mapping of the water D/H ratio, search for trace gases including methane, and mapping of thermospheric structure using 4.3 μm CO2 emission; the full-disk views provided by JWST are highly complementary to the vertical profiling and long temporal coverage provided by MEx and TGO.
How to cite: Wilson, C., Titov, D., Martin, P., Cardesin Moinelo, A., Frew, D., Carter, J., Giuranna, M., Holmstrom, M., Montmessin, F., Orosei, R., Paetzold, M., Roatsch, T., Sanchez-Lavega, A., Korablev, O., Mitrofanov, I., Thomas, N., and Vandaele, A. C.: Mars Express and Trace Gas Orbiter – status, science highlights, plans, Europlanet Science Congress 2022, Granada, Spain, 18–23 Sep 2022, EPSC2022-1136, https://doi.org/10.5194/epsc2022-1136, 2022.
The NOMAD (“Nadir and Occultation for MArs Discovery”) spectrometer suite on board the ExoMars Trace Gas Orbiter (TGO) has been designed to investigate the composition of Mars' atmosphere, with a particular focus on trace gases, clouds, and dust. The instrument probes the ultraviolet and infrared regions covering large parts of the 0.2-4.3 µm spectral range [1,2], with 3 spectral channels: a solar occultation channel (SO – Solar Occultation; 2.3–4.3 μm), a second infrared channel capable of nadir, solar occultation, and limb sounding (LNO – Limb Nadir and solar Occultation; 2.3–3.8 μm), and an ultraviolet/visible channel (UVIS – Ultraviolet and Visible Spectrometer, 200–650 nm). NOMAD performs solar occultation, nadir and limb observations dedicated to the determination of the composition and the structure of the Martian atmosphere.
TGO started its science phase in April 2018 and instruments have now been accumulating data for more than two Martian years. We will present selected results obtained by the NOMAD instrument covering the atmosphere composition with observations of several trace gases, dust, and clouds. We also report on the different discoveries highlighted by the instrument by pointing to a series of contributions to this conference that will present in detail several specific studies, like recent progress in the instrument calibration, the latest CO2 and temperature vertical profiles, studies of aerosol nature and distribution, water vapor profiles and variability, carbon monoxide vertical distribution, ozone vertical profiles, climatology and relation with water, airglow observations, detection of CO2 ice clouds, surface ices and in general advances in the analysis of the spectra recorded by the three channels of NOMAD.
References
[1] Vandaele, A.C., et al., 2015. Planet. Space Sci. 119, 233-249.
[2] Vandaele et al., 2018. Space Sci. Rev., 214:80, doi.org/10.1007/s11214-11018-10517-11212.
How to cite: Vandaele, A. C., Daerden, F., Thomas, I. R., Depiesse, C., Erwin, J., Flimon, Z., Neary, L., Piccialli, A., Ristic, B., Trompet, L., Viscardy, S., Willame, Y., Aoki, S., Gérard, J.-C., Villanueva, G., Mason, J., Patel, M., Bellucci, G., Lopez-Valverde, M., and Lopez-Moreno, J. J.: Two Martian years at Mars: Observations by NOMAD on ExoMars Trace Gas Orbiter, Europlanet Science Congress 2022, Granada, Spain, 18–23 Sep 2022, EPSC2022-241, https://doi.org/10.5194/epsc2022-241, 2022.
Introduction
Studies are underway to provide solutions to bring the Rosalind Franklin rover to Mars (Figure 1). Complementing the ExoMars 2016 mission involving the Trace Gas Orbiter and Schiaparelli spacecraft [1, 2], the second ExoMars mission’s science objectives are to search for signs of past and present life, and to investigate the subsurface water/geochemical environment as a function of depth [3, 4].
We report on work by the Science Team to finalise preparations that would have been needed for a launch in 2022, and that remain essential for readiness at a future launch date.
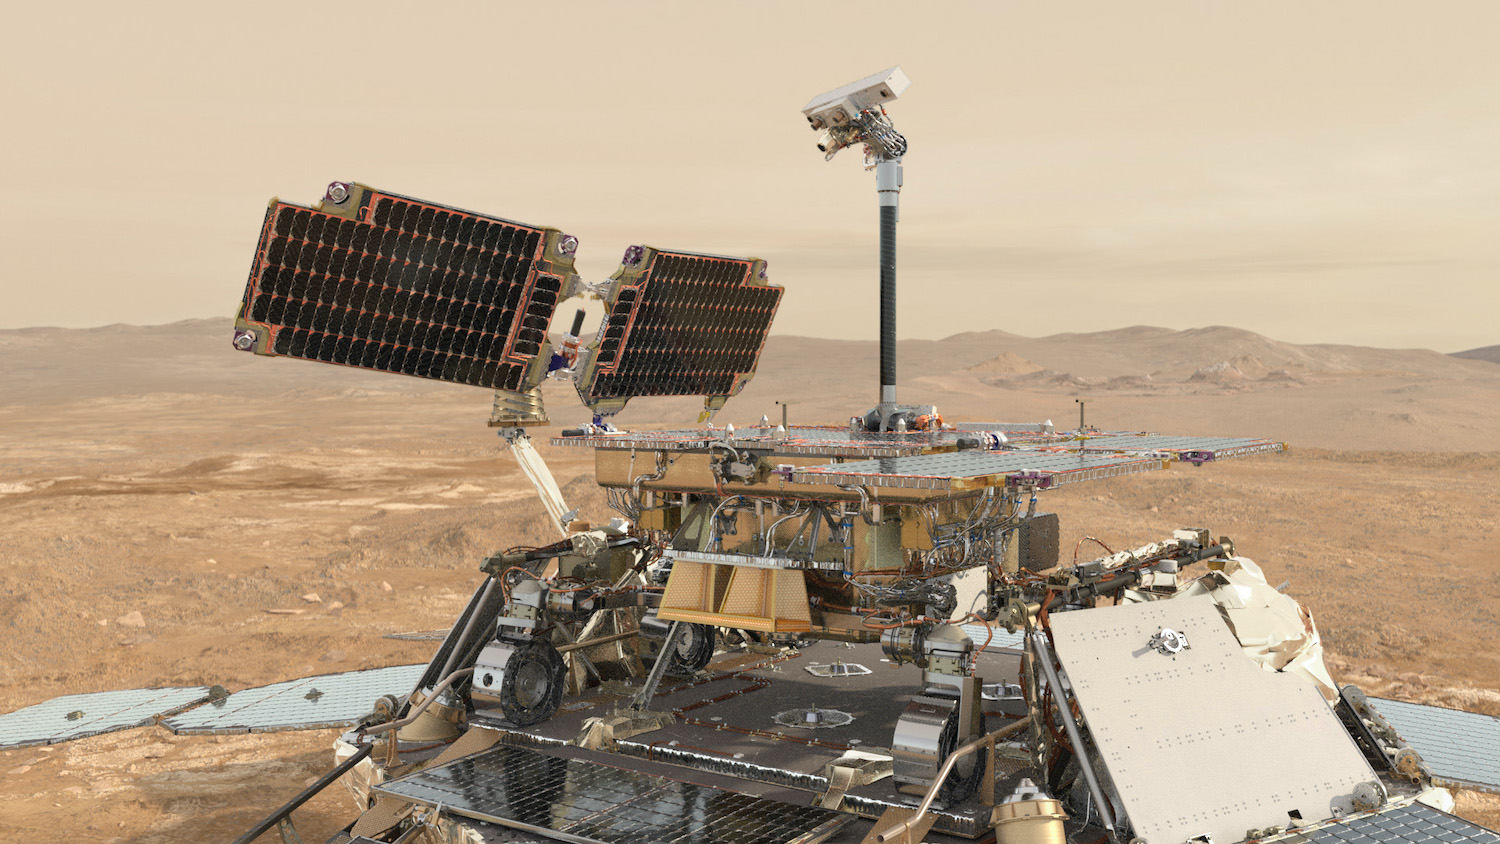
Figure 1.
Rover Science Operations Working Group (RSOWG)
The ExoMars RSOWG was chartered in 2019 to advance the state of preparation for Rover science operations within the science team. Sub-groups are tasked with addressing specific needs:
RSOWG-Micro address topics regarding the spatial scale of the samples that will be extracted from down to 2m by the rover’s drill, their analogues, and plans for their analyses. Notable recent work by the Micro sub-group has included (i) Recommending a sequence of rover activities following commissioning, named ‘Science.0’. The goal of the Science.0 activities is to prime the rover’s analytical laboratory and characterise its initial state prior to commencing analysis to search for biosignatures on Mars samples. (ii) Running a process to propose, select and analyse a set of ‘Mission Reference Samples’ – a suite of analogue samples most relevant to the landing site and mission objectives to be characterized by ground models of the MicrOmega [5], RLS [6] and MOMA [7] instruments.
RSOWG-Macro address topics using the wealth of remote sensing data amassed by orbiter missions, and at rover to regional spatial scales. In 2020-2021 the Macro group performed a group mapping exercise of the Oxia Planum landing site [8] to develop understanding of the site’s stratigraphy and geological history [9]. A related output has been the publication of a corresponding Geographic Framework [10], to be used during simulations and operations. Other RSOWG-Macro activities have included defining how to initialise the mission’s ‘Strategic Plan’ upon landing, building a version-controlled repository of orbital data products, and establishing conventions for naming features and places at the landing site.
The RSOWG Simulations Planning Group comprises a team of ‘Simulation Officers’, nominated from Pasteur Payload Teams, ESA and industry. In 2021 they were tasked with designing and leading a series of ‘RSOWG Simulations’, an early series of team simulations that were intended to rehearse and refine strategic science processes. Scenarios, entitled ‘After Landing’, ‘Site Survey’, ‘Opportunistic science trade-off’ and ‘ALD Analyses’, required science data interpretation, rover activity planning, and decision making at strategic level, and used data from all 9 Pasteur Payload instruments. Lessons learned from early simulations, inform planning of future simulations and exercises, including those prepared by the Rover Operations Control Centre (ROCC – Turin, Italy) for training and certification of team members for operations.
During 2022 and beyond, RSOWG are focussing on maturing the mission’s ‘Strategic Plan’, which provides traceability from the Rover mission science objectives to individual rover and instrument activities, taking into account the realities of the landing site. The RSOWG is tasked to form the Strategic Plan by 1) identifying questions that stem from the Rover mission science objectives and organizing them into scientific priorities, 2) defining hypotheses that should be tested using rover instruments, and 3) identifying targets and ‘skeleton’ plans of activities that could be performed by the rover and its instruments that would address specific groups of hypotheses.
Plans, People, and Processes
Some aspects of science operations preparations lie outside the responsibility of RSOWG, and are complementary to the industry-led development and testing of systems and rover operations at the ROCC.
The ‘Science Operations Plan’ was developed to ensure that daily science operations processes in Tactical and Strategic planning cycles (Figure 2) are complete, robust, transparent, efficient, and collegiate. The plan complements ground and flight control procedures, and covers science team organization, communication, journaling, science-specific tools, and designated roles.
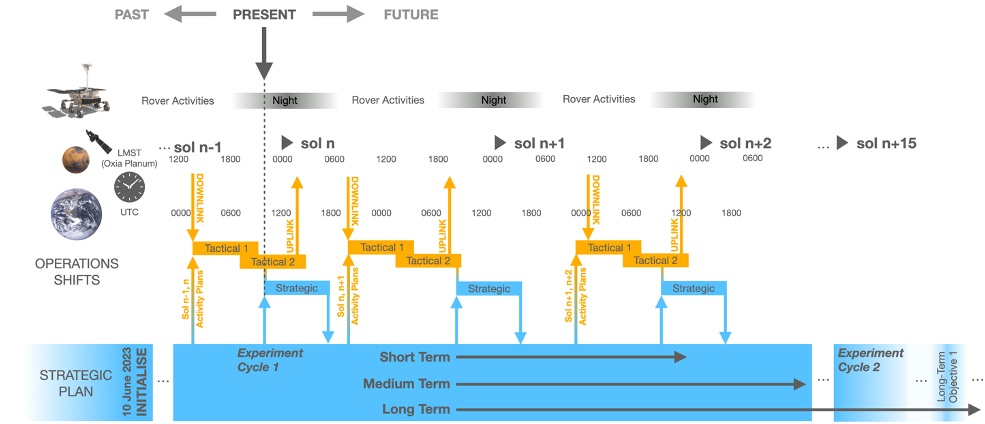
Figure 2: Illustration of Tactical planning (synchronized with orbiter overflights) and Strategic Planning (office hours) shifts as they relate to UTC and Local Mean Solar Time at Oxia Planum. The 'Strategic Plan' guides and governs the decisions made during planning cycles.
The rover long-term data archive, hosted on the ESA Planetary Science Archive (PSA) [11], will contain not only data from science instruments in the Pasteur Payload, but also data regarding the Rosalind Franklin rover’s journey through Oxia Planum. This is achieved via the ‘Science Target Scheme’, which prescribes data structures and links between them for a hierarchy of target classes from landing site to sample analysis scales.
The Sample Analysis Protocol (SAP), in preparation, builds on the ExoMars Biosignature Score (EBS) [3], and is intended define the investigations and metrics for establishing and reporting whether a location on Mars has hosted microbial life, past or present.
Finally, analyses and bespoke tools support needs in areas such as staffing, sequence optimisation for rover activities, and ‘trade-sheets’ [12] to aid decision-making for science targets.
Acknowledgments
We thank the ExoMars Pasteur Payload, Science, and Industrial Teams, for their profound continuing efforts to prepare the first European Mars rover mission that will search for signs of life on Mars.
References
[1] Vago, J. L. et al., (2015) Sol. Syst. Res. 49 (7), 518–528.
[2] Svedhem, H. et al., (2020) 14th Eur. Sci. Congr. 2020, held virtually, 21 Sept. 2020 - 9 October, 2020. Abs. EPSC2020-802.
[3] Vago, J. L. et al., (2017) Astrobiology 17 (6–7), 471–510.
[4] Thomas, N. et al., (2017) Space Sci. Rev. 212 (3–4), 1897–1944.
[5] Bibring, J.-P. et al., (2017) Astrobiology 17 (6–7), 621–626.
[6] Rull, F. et al., (2017) Astrobiology 17 (6–7), 627–654.
[7] Goesmann, F. et al., (2017) Astrobiology 17 (6–7), 655–685.
[8] Sefton-Nash, E. et al., (2021) in 52nd Lunar Planet. Sci. Conf.
[9] P. Fawdon, et al. (2022) in Lunar Planet. Sci. Conf., LPI.
[10] Fawdon, P. et al., (2021) J. Maps 17 (2), 762–778.
[11] Lim, T.-L. et al., (2021) in 5th Planet. Data Work. Planet. Sci. Informatics Anal., Vol. 2549.
[12] Torres, I. et al., (2022) '“Trade-Off” Tools to Quantify Biosignature Potentials for Future ExoMars Rover Mission Operations', This Conference.
How to cite: Sefton-Nash, E., Vago, J. L., Torres, I., Fonteyne, R., Orgel, C., Bahia, R., Joudrier, L., Haessig, F., Williams, A., Guerbuez, C., Lim, T., Ball, A. J., and Mitschdoerfer, P.: The ExoMars Rosalind Franklin Rover: Continuing Mission Preparations, Europlanet Science Congress 2022, Granada, Spain, 18–23 Sep 2022, EPSC2022-800, https://doi.org/10.5194/epsc2022-800, 2022.
NASA’s Mars Reconnaissance Orbiter (MRO) has been orbiting Mars since 2006; HiRISE has been imaging the surface with pixel scales down to 25-35 cm/pixel. Resolution of 1-meter scale features is essential for choosing landing sites as well as for direct science. With MRO’s near-polar orbit and off-nadir pointing, any patch of ground on Mars’ surface can be imaged within a 2-3 week period. Given the high data volume of >70,000 images of about one gigapixel size, only 4 percent of Mars has been imaged, and much of that is repeat coverage for stereo or change detection, so the unique coverage is from 2-3 percent. Targets for HiRISE are carefully selected to cover exploration priorities (candidate landing sites, monitoring active surface missions) and science priorities.
There have been more than 1500 peer-reviewed publications that include “Mars” and “HiRISE” in the main text, based on NASA ADS (see Figure). Some of these are mentions of HiRISE that are not central to the main results, but there are others missed by ADS for which HiRISE is essential. In any event, we cannot describe all of these results, but here are a few highlights:
- Mars Today. Prior to MRO there was much uncertainty about present-day activity on the martian surface beyond large-scale shifting dust and seasonal frost. We now know that Mars exhibits diverse surface changes at all latitudes and seasons. Active processes include impact cratering, aeolian sand and dust transport, a variety of slope processes, changes in polar ices, and diverse effects of seasonal CO2 The extent of surface change has been surprising and indicates that the present climate is capable of reshaping the surface (Dundas et al., 2021, JGR-Planets 126).
- Ancient Mars. The past fifteen years of orbital infrared spectroscopy and in situ exploration have revised our understanding of the composition and history of Mars. Mars has a basaltic upper crust and many materials from ancient Mars bear the mineralogic fingerprints of interaction with water (Ehlmann and Edwards, 2014, AREPS 42). HiRISE data has been essential to the geologic and stratigraphic interpretation of the mineralogic data, key to identification of geologic settings with fluvial and other processes and their successful in situ investigation with the Curiosity, Perseverance and other rovers.
- Water on Mars. There have been multiple false alarms about liquid water on the surface of Mars today, although eutectic brines may be present in tiny quantities for short periods of time. Mid-latitude gullies, recurring slope lineae, and slope streaks are all best explained as dry processes. However, the case for geologically recent (Amazonian) water has been strengthened by observations of craters with alluvial fans and deltas (Wilson et al., 2021, GRL 48) and other studies. HiRISE observations of new impact craters and scarps exposing ice have mapped the boundary of the subsurface water ice table and yielded information on its vertical structure.
- Polar processes. The condensation and sublimation of the seasonal CO2 polar cap sculpts landforms, from the polar region to mid-latitude dunes, eroding furrows, gullies, and radially-organized channels, changes detected by HiRISE in repeat images. Avalanches from blocks of ice falling from stretches of the permanent north polar cap edge occur every spring. HiRISE images and stereo DTMs have mapped polar stratigraphy enabling the recognition of climatic records Myr in length as well as more-ancient periods where polar ice was absent. Images of polar craters and their changes have allowed present-day ice accumulation rates to be deduced.
- Non-polar geologic processes. The list of geologic features studied with HiRISE includes impact craters, volcanic and tectonic features, channels, pit craters and potential caves, sedimentary volcanism, dune casts, boulder falls and fields, columnar jointing, dikes and water-cemented fractures, glacial and periglacial landforms, fractured mounds, landslides, polygonal terrains, inverted channels, bedrock layers, layered sedimentary deposits, and more.
What is the future of HiRISE? Given a worsening image data problem, HiRISE images may have limited use of full-resolution imaging within 3-4 years and greater use of 2x2 and 4x4 binned images. There are 3 central CCDs that have relatively minor issues, so narrow unbinned images could be acquired for some additional years, with 2x2 binned data for the 6 outer CCDs (plus the blue-green and NIR CCDs). Given the lack of current plans for new orbital imaging at this scale, there may be a gap in orbital sub-m resolution at Mars.
Figure: Refereed papers that include “HiRISE” and “Mars” according to NASA ADS on May 5, 2022 (1,685 total).

How to cite: McEwen, A., Byrne, S., and Hansen, C.: Results from MRO’s High Resolution Imaging Science Experiment (HiRISE), 2006-2022, Europlanet Science Congress 2022, Granada, Spain, 18–23 Sep 2022, EPSC2022-38, https://doi.org/10.5194/epsc2022-38, 2022.
The NASA Mars 2020 Perseverance rover mission aims to explore and characterise the geology and potential astrobiology of Jezero crater, which once hosted a Noachian–Hesperian delta–lake system. In addition to understanding the geological diversity of the locality, the mission will evaluate the possibility that prebiotic chemistry and/or microbial life may have occurred and become preserved in specific horizons within Jezero crater. To achieve this, the rover will collect a suite of diverse geological samples (cores of approximately 3–7 cm length) for subsequent return to Earth, whereupon these materials will be studied using high-resolution and high-sensitivity laboratory approaches. The notional suite of samples will be collected from throughout Jezero crater (the floor, delta and margin deposits), spanning numerous igneous and sedimentary lithologies in order to assure that returned sample science (RSS) objectives in geology, geochronology, geochemistry, geophysics and astrobiology will be addressed. The Perseverance rover explored the floor of Jezero crater and collected samples from two units, the Máaz formation (formerly Cf-fr, specifically the flat fractured floor) and the Séítah formation (formerly Cf-f1). Following an unsuccessful first sampling attempt at the Roubion locality of the Máaz formation, Perseverance collected its first sample pair at Rochette, and acquired a total of eight samples throughout the crater floor campaign (four in the Máaz formation and four in the Séítah formation). This presentation briefly describes observations of the samples collected across the crater floor and offers some perspectives on their utility for RSS objectives.
In the Máaz formation, sampling activities were conducted at three localities: Roubion (attempted), Rochette, and Sid. Roubion is located within a topographically low area of flat-lying, polygonally jointed outcrops; the corresponding abraded patch (Guillaumes) was noted to feature pervasive weathering and the core sample itself disaggregated during the sampling attempt. Rochette is located along Artuby ridge, a resistant geomorphological feature parallel to the contact between the Máaz and Séítah formations. Sid is an example of the rocks with massive blocky appearance that cover much of the Jezero crater floor. The Máaz formation samples are fine-to-medium grained, holocrystalline rocks dominated by pyroxene and feldspar, without the presence of olivine, and feature variable abundances of secondary minerals and salts.
For the Séítah formation, samples were collected in a region distributed irregularly across the crater floor to the southeast of the western delta (“South Séítah”). Proximity science was conducted at three outcrops: Bastide, Brac (topographically highest region of South Séítah visited by the rover) and Issole (near the contact with the Máaz formation); samples were acquired at Brac and Issole. Correlated imaging and lithochemical analyses by the rover payload instruments have identified olivine and pyroxenes with some alteration to carbonates, silica-rich phases, Mg-sulphates and perchlorates. The presence of higher concentrations of S and Cl (up to two orders of magnitude) than in any Martian meteorites is evidence of exposure of these nominally igneous rock units to brines, with indications of more than one sequence of exposure. Ongoing work on the “Quartier” abrasion aims to assess the possibility of organics.
Samples from the Máaz and Séítah formations are expected to address a number of crucial RSS themes of central significance to Mars Sample Return. Their diverse mineral assemblages will be valuable for geochemistry (e.g. magmatic history, igneous petrogenesis, melt evolution) and geochronology, both to quantify the conditions and timing of primary, high-temperature crystallisation of igneous phases and later-stage alteration events, including water–rock interactions with implications for Martian climate and habitability. Such analyses will require sub-sampling and high-precision analyses following sample return. Séítah samples will also shed light on the origin of the olivine-carbonate lithochemistrydistributed more widely across Nili Fossae and should allow better constraints to be placed on ultramafic igneous petrogenesis on the Noachian Mars. Studying the crater floor samples as a suite will facilitate a comprehensive understanding of igneous processes and subsequent alteration in Jezero crater, as well as an understanding of how the Jezero units are related in terms of the processes and chronology of the region, and indeed more widely on Mars.
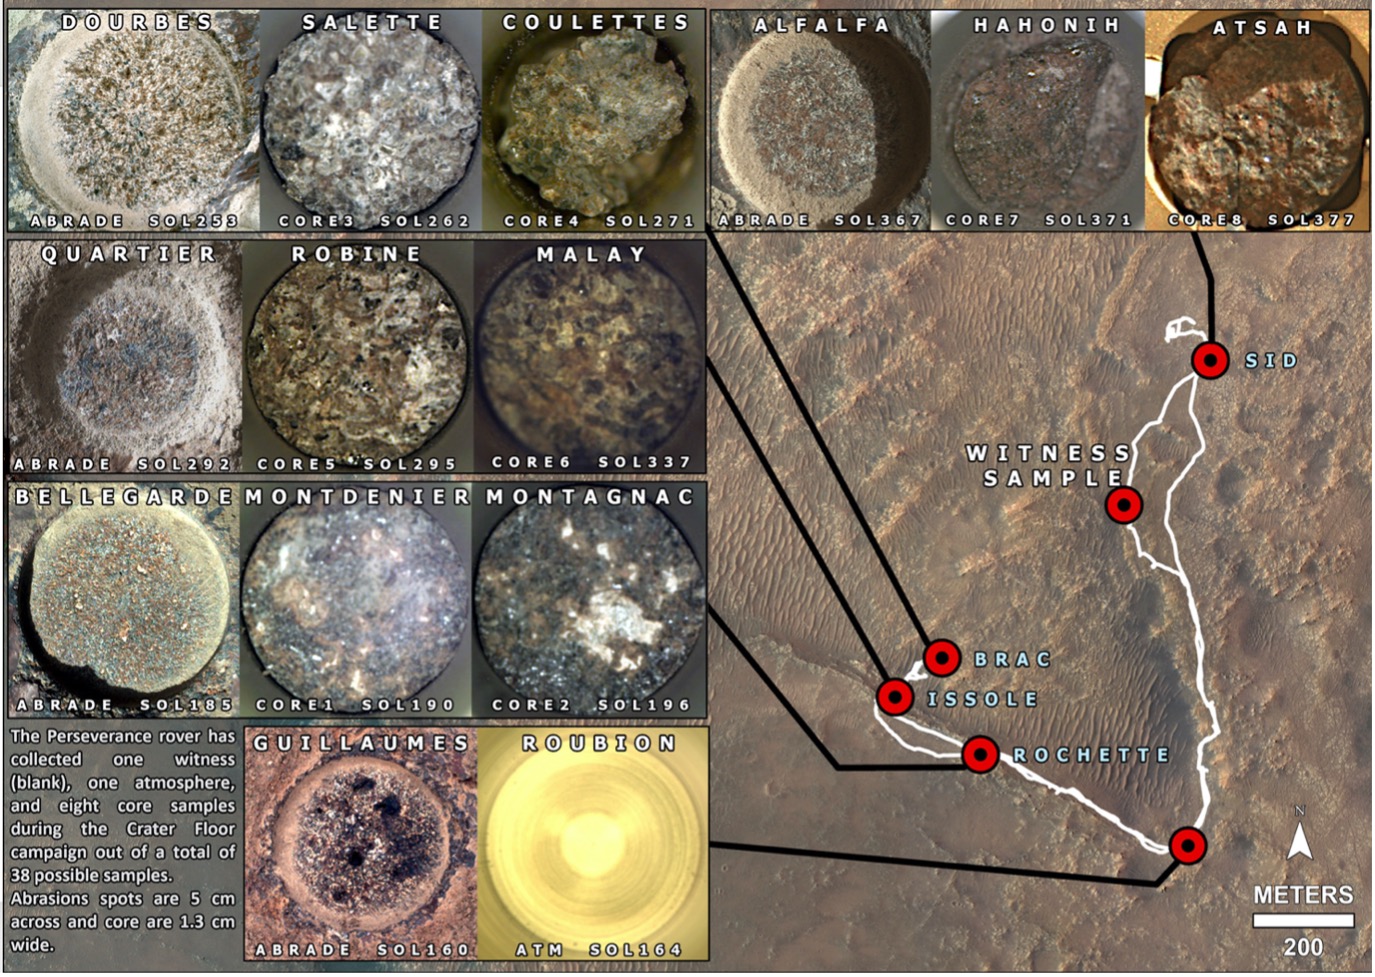
Fig. 1. Crater Floor Campaign sample collection map, showing the locations of sampling for the first eight samples of the missions, together with the Roubion sampling attempt. Abrasion patches are shown alongside their corresponding core samples.
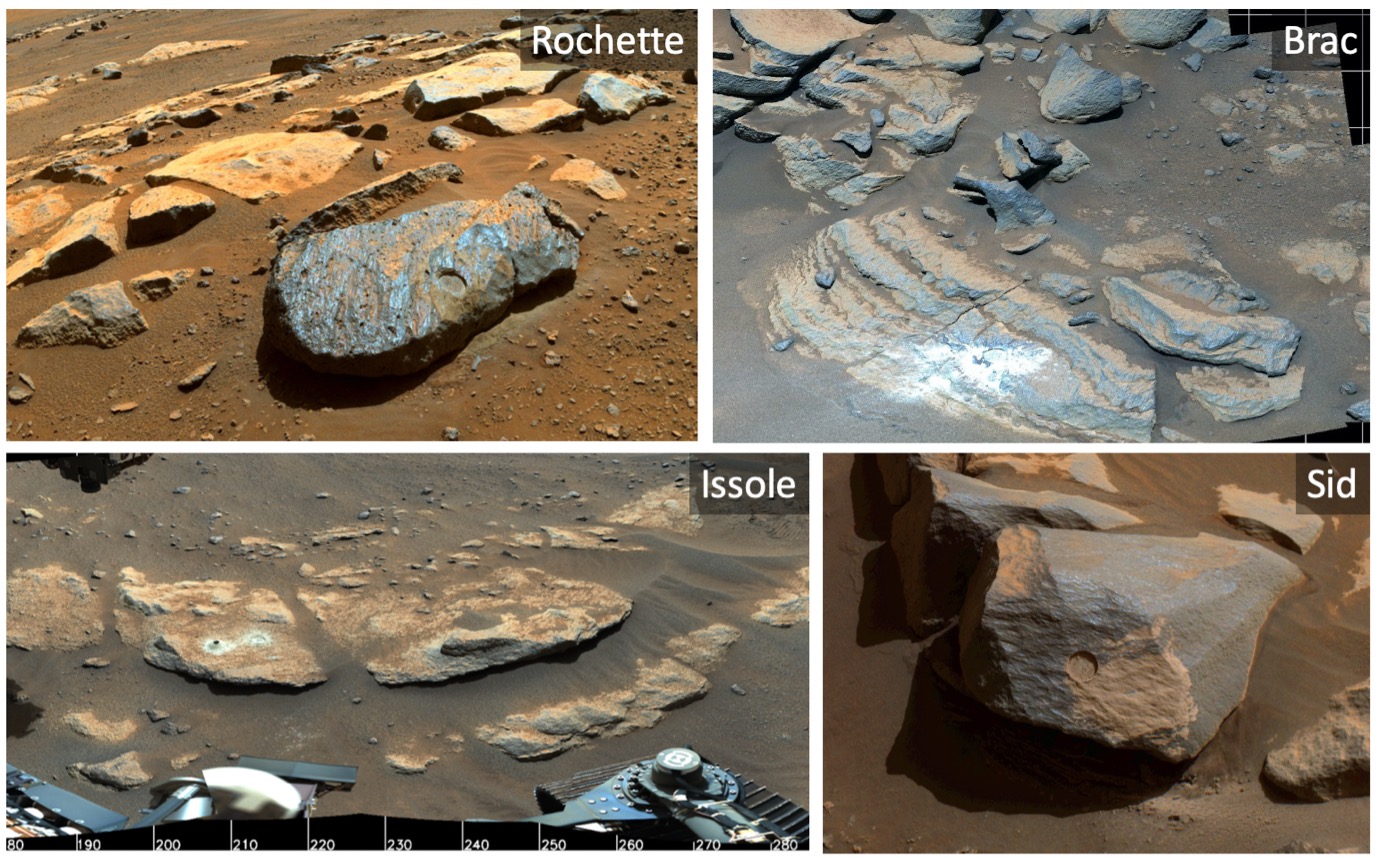
Fig. 2. Mastcam-Z images of crater floor sampling localities: Rochette and Sid (Máaz formation) and Brac and Issole (Séítah formation). Abrasion patches are 5 cm in diameter; borehole on Issole is 2.7 cm in diameter.
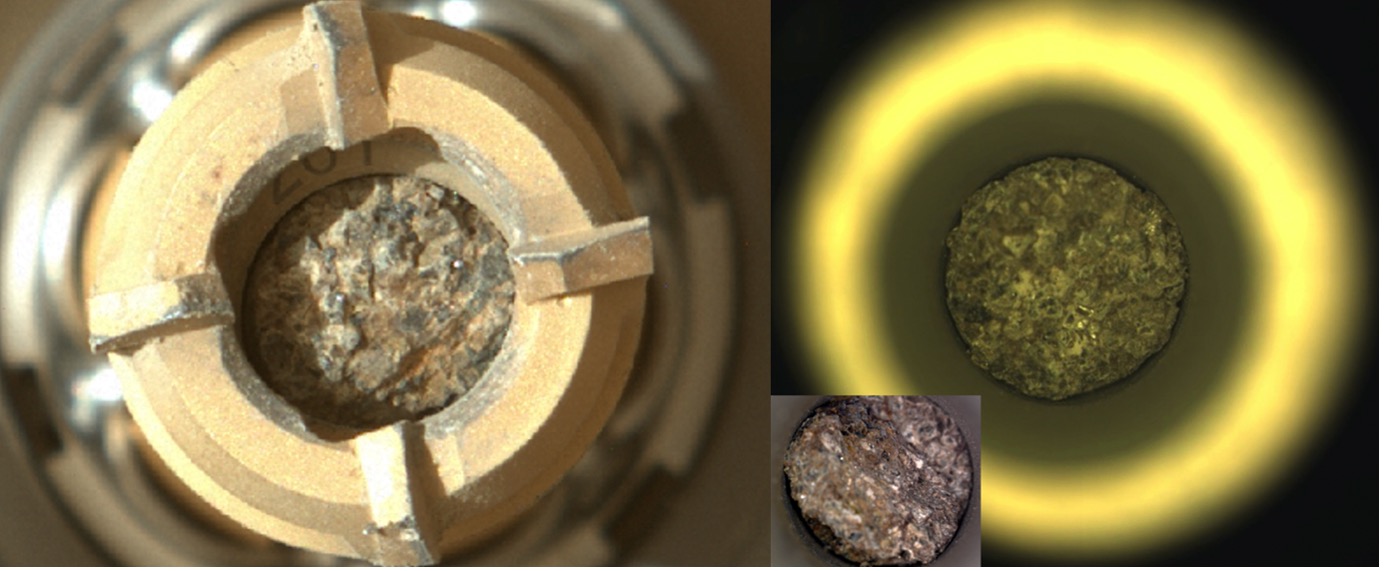
Fig. 3. Images of core samples during the sampling and caching process. Left image shows the Malay core sample (Issole member, Séítah formation) in the coring apparatus after sample acquisition. Right image shows a CacheCam image of the Salette sample (Bastide member, Séítah formation) within its sample tube. Inset shows the detachment of a small fragment of the Salette sample during sampling and caching.
How to cite: Hickman-Lewis, K. and the Mars 2020 Science Team: Perseverance rover sampling across the Jezero crater floor: geological diversity and returned sample science potential, Europlanet Science Congress 2022, Granada, Spain, 18–23 Sep 2022, EPSC2022-762, https://doi.org/10.5194/epsc2022-762, 2022.
The Committee on Space Research’s (COSPAR) Planetary Protection Policy (herein referred to as the Policy) has been developed through deliberation between the scientific community and the national space agencies to 1) ensure that scientific investigations of possible extra-terrestrial life forms, precursors, and remnants are not jeopardized; and 2) Earth is protected from the potential hazard posed by extra-terrestrial matter carried by a spacecraft returning from an interplanetary mission (COSPAR 2020).The COSPAR Panel on Planetary Protection (herein referred to as the Panel)regularly updates the Policy based on workshops and activities that are led by the community, or by national committees. For example, the requirements for the icy moons of the outer Solar System have been scrutinized as part of a European Commission’s H2020 Programme (Rettberg et al 2019) and a National Research Council report (NRC 2012), which led to recommendations being made to COSPAR, which resulted in an update to the regulations (COSPAR 2020). Another example is the recent update of the regulations relating to the moon. The Panel conducted a dedicated community consultation that led to an updated Policy (COSPAR, 2021).
The Policy relating to Mars has received increased attention over recent years as missions to Mars are being more attainable. The number of missions and nations involved have grown significantly since 2003, and commercial missions from the private sector are becoming more plausible (Liu et al 2022). The Policy regulations have evolved over the decades, as our understanding of the planet has evolved. All missions to Mars have been divided into two categories: III, for orbiters and flybys and IV, for landers or probes, with the appropriate planetary protection requirements; whilst Mars return missions are designated as category V (restricted Mars return).
Due to recent reports published regarding the Mars planetary protection, e.g., Spry et al 2021; NAS, 2021, the Panel has taken this as an opportunity to reevaluate scientific data pertaining to the subject of bioburden requirements on Mars and the implications that this has on the Policy and requirements. They focused on three key areas: 1) Biocidal effects of the martian environment; 2) stability of water and 3) transport of spacecraft bioburden. These areas were discussed in the context of survival of dormant and actively growing cells (Rummel et al 2014). Although harmful contamination is most likely to occur due to proliferation, dormant cells are also important as they can be transported to a potential habitable environment e.g., Special Regions (Rettberg et al 2016).
We contend that at present there is neither sufficient new evidence in the literature nor scientific community consensus to conclude that the bioburden recommendation for Mars needs to be changed at this point. However, the situation may change in the future with the examination of new data by the Panel. To date, several knowledge gaps that require new targeted research have been identified:
- Understanding the biocidal effects of Mars surface conditions.
- Measuring the effect of the atmosphere and dust storms of the kinetics of microbial survival (Spry et al 2021).
- Measuring the rate of dust accumulation and the impact this has on microbial survival kinetics.
- Metrological investigations to develop, test and validate contamination transport models (Spry et al 2021).
- High resolution of the absolute water vapour content, temperature, and wind speed (Rivera-Valentin et al 2021).
- Understanding the thermodynamics of salt facilitated water vapour (Rivera-Valentin et al 2021).
- Mars simulation experiments to quantify the metabolic and reproduction rates of terrestrial organisms with ephemeral wetting events with and without salts.
We therefore suggest additional international community engagement to further refine this list of knowledge gaps.
References: COSPAR (2020) Sp Res Tod. 208, 10-22. COSPAR (2021) Sp Res Tod. 211, 9-11. Fisk L., et al (2021) Sp Res Tod. 211, 9-25. Liu J., et al (2022)Intern J Transp Sci technol. 11, 1-16. Rettberg P., et al (2016) Astrobiol. 16(2), 119-125. Rettberg P., et al (2019) Astrobiol. 19(8), 951-974. Rivera-Valentín E., et al (2021) Bulletin of the AAS. 53(4). Spry J., et al (2021) Bulletin of the AAS. 53(4), 205. NAS (2021) Report Series: Committee on Planetary Protection: Evaluation of Bioburden Requirements for Mars Missions. Rummel J., et al (2014) Astrobiol. 887-968.
How to cite: Olsson-Francis, K., Doran, P., Ilyin, V., Raulin, F., Rettberg, P., Zorzano, M.-P., Coustenis, A., Kminek, G., and Hedman, N. and the COSPAR Panel on Planetary Protection: The COSPAR Planetary Protection Requirements for Space Missions to Mars, Europlanet Science Congress 2022, Granada, Spain, 18–23 Sep 2022, EPSC2022-608, https://doi.org/10.5194/epsc2022-608, 2022.
Orals: Fri, 23 Sep, 10:00–13:20 | Room Machado
Phobos is the target of the return sample mission Martian Moons eXploration that will provide a better understanding of the satellite's composition, giving clues about its formation. Some models propose that Phobos and Deimos were formed after a giant impact forming an extended debris disk. Assuming that Phobos and it parents bodies have a low material cohesion Hesselbrock and Milton (2017) have showed that a "recycling process" may happen during the assembling of Phobos, by which Phobos' parents are destroyed into a Roche-interior ring and reaccreted several times. We explore in details the recycling model, and pay particular attention to the characteristics of the disk using 1D models of disk/satellite interactions. In agreement with previous studies we confirm that , if Phobos' parents bodies are indeed rubble piles, then the recycling process do occurs. However, Phobos should be accompanied today by a Roche-interior ring which characteristics are not reconcilable with today observations of Mars' environment. Indeed a residual ring should exist in addition to Phobos, that is not observed. Thus we conclude that, if Phobos formed in a giant impact, its parent bodies should have been cohesive and there was never a recycling process. In this hypothesis, Phobos is the last object of and old moonlets population that migrated toward and crashed onto Mars. Alternatively, if Phobos' parent bodies were cohesive-less, then we do find one solution: the giant impact should have happened recently (<2 Gyrs ago) and that a Mars ring should exist today with optical depth 1e-5 with particle size about a few meters size.
How to cite: Madeira, G. and Charnoz, S.: Exploring the recycling model of Phobos formation: rubble-pile satellites, Europlanet Science Congress 2022, Granada, Spain, 18–23 Sep 2022, EPSC2022-210, https://doi.org/10.5194/epsc2022-210, 2022.
In the framework of the MMX (Martian Moons Exploration) mission, a geodesy team from CNES has joined Geodesy Sub-Science Team to study the estimation of geodetic parameters of a natural satellite of Mars: Phobos.
The MMX mission aims to return a sample of Phobos to Earth, but during the mission, exceptional observations of this natural satellite will be made. What insight into the geodetic parameters of Phobos will be gained from these measurements? The available measurements will be: LIDAR measurements between the probe and the surface of Phobos, 2-way Doppler and range measurements between ground stations on Earth and the probe, as well as optical measurements from photos taken by the probe.
The presentation will focus on the results obtained on the restitution of gravity field parameters, Phobos ephemerides, as well as rotation and orientation parameters of the natural satellite, from synthetic measurements simulated on coherent QSO (Quasi Satellite Orbit) of the current mission analysis.
The LIDAR measurements correspond to a distance measurement between the surface of the body and the onboard instrument. This very accurate measurement (sigma = 22m @ 100 km) [R1] allows the trajectory to be constrained, but is dependent on the quality of the body shape model.
The 2-Way Doppler measurements contain information on the velocity of the probe in the line of sight. These measurements are available during spacecraft observation sessions by ground stations which can be multiple at a rate of one measurement per minute.
Optical measurements are angular landmark measurements on the surface of the body. Like LIDAR measurements, these contain information on the relative position of the probe with respect to the natural satellite. These measurements are derived from a pre-processing of the wide angle and narrow angle photos taken by the OROCHI and TENGOO instruments [R2].
The combination of these three types of measurements will be used to estimate the various geodetic parameters of Phobos throughout the mission. Indeed, the first and most distant orbits (QSO-H) should allow to estimate the ephemeris of Phobos as well as the low-degree coefficients of the gravity field and rotation parameters including amplitude of libration in longitude. As the mission progresses, the spacecraft will orbit Phobos with closer and closer trajectories (QSO-M, QSO-L) which will allow to refine the first estimates made at QSO-H as well as the coefficients of the higher degree field.
This knowledge of the field and the attitude of Phobos will thus allow a precise study of the internal structure of the body.
[R1] Light detection and ranging (LIDAR) laser altimeter for the Martian Moons Exploration (MMX) spacecraft - Senshu et al. (2021) https://doi.org/10.1186/s40623-021-01537-7
[R2] Design of telescopic nadir imager for geomorphology (TENGOO) and observation of surface refectance by optical chromatic imager (OROCHI) for the Martian Moons Exploration (MMX) - Kameda et al. (2021) https://doi.org/10.1186/s40623-021-01462-9
How to cite: Laurent-Varin, J., Marty, J.-C., Matsumoto, K., Yamamoto, K., Hitoshi, I., Hiroshi, A., and Lee, J.: Preliminary geodesy study for MMX mission, Europlanet Science Congress 2022, Granada, Spain, 18–23 Sep 2022, EPSC2022-330, https://doi.org/10.5194/epsc2022-330, 2022.
Introduction
Phobos and Deimos' composition are still largely unconstrained today. Although several infrared data have been collected by both spacecraft and ground-based observatories, there is still no conclusive agreement on the interpretation of these data. These uncertainties reflect the ongoing debate on the origin of Martian moons and their evolution. The possible presence of hydrated minerals along with mafic minerals (i.e., olivine and/or pyroxene) seems to be the most plausible interpretation based on previous spectroscopic data obtained in the visible (VIS) to mid infrared range [e.g. 1, 2], but more investigations are needed. MIRS spectrometer [3] onboard the future JAXA MMX spacecraft [4] will help to unveil the open question on the composition of Phobos and Deimos.
In this presentation we will review past spectroscopic observations of the Martian moons, both from ground observatories and spacecraft dataset, aiming at better understanding the constraints in interpreting the Mars satellites composition and at identifying the best spectroscopic analogs. We will also present new laboratory measurements on mineral mixing and meteorites to match the satellites spectral behavior.
Methods
Several samples were studied in this preliminary work in order to select the best analog for Phobos and Deimos surfaces. We worked with several simulants (Mars soil and carbonaceous chondrites) acquired by Exolith Lab funded by Center for Lunar & Asteroid Surface Science at University of Central Florida [5,6]. We added to the sample set a mineral mixture (50/50 wt.% plagioclase bytownite and pyroxene augite) to resemble a basaltic composition, a synthetic amorphous carbon (AC) produced in laboratory by arc discharge and antigorite, one of the common forms of serpentine. New measurements were acquired in two different facilities: INAF-Astrophysical Observatory of Arcetri and IPAG laboratories. The results obtained set new constraints for future laboratory measurements. The main effects studied are: i) the mixing of two components, generally one basaltic and one dark to simulate a possible origin following an impact between Mars and a rocky small body; ii) the effect of the geometry on the spectra in order to evaluate the goodness of comparisons with existing data.
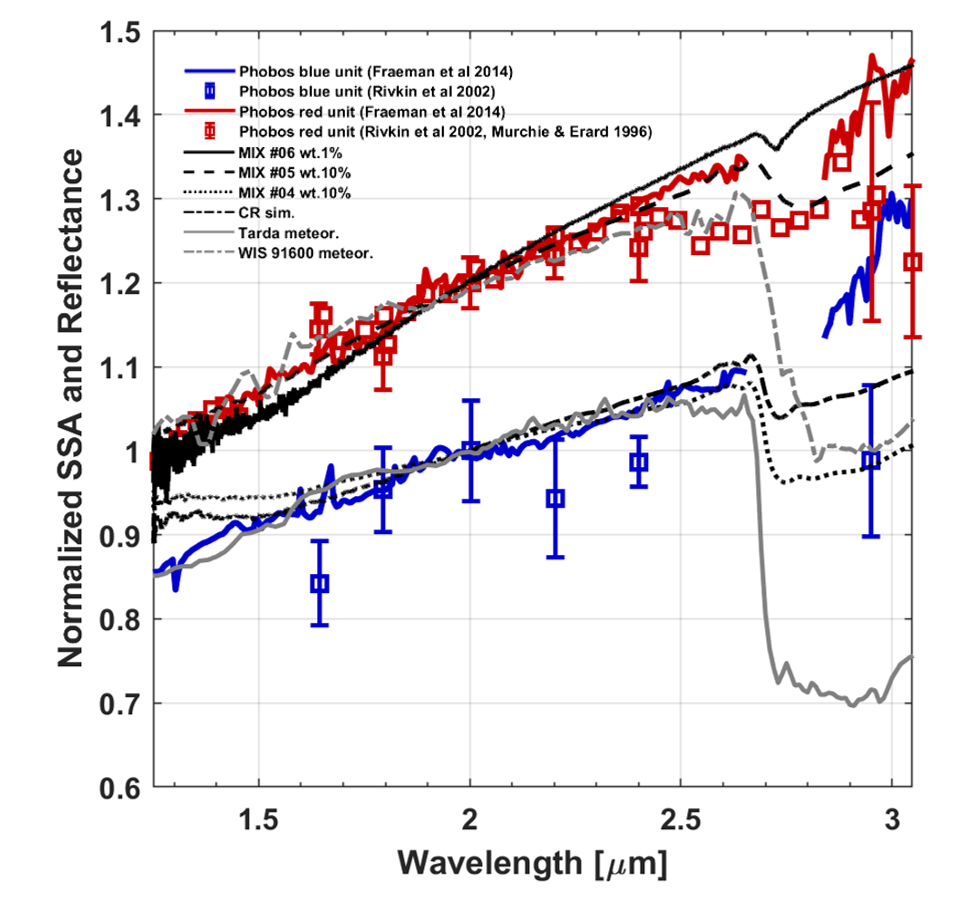
Fig. 1 Comparison between selected spectra of Phobos and laboratory analogs. Spectra of the red unit and blue unit are normalized at 2 μm and offset for clarity. We compared the mixture (black lines) and meteorites (gray lines) showing the best match with the observation. Although the agreement with the slope is pretty good in the studied range, the comparison in the region of the 2.7-μm hydrated band is of lower quality due to both the worse quality of the Phobos spectra and the more intense bands of some laboratory spectra.
Results
The MMX mission will aim to shed light on this topic, and the role of the MIRS spectrometer will be pivotal in this regard. MIRS, with its unprecedented spatial resolution, high S/N and a spectrum without interruption, will allow us to characterize the composition in detail and to investigate heterogeneity associated with the surface morphology. Up to now, despite a good agreement between measurements taken from the ground-based telescope and spacecraft (Figure 1) many possible analogues are suitable to obtain a good match considering also the incompleteness of previous data. In our presentation we will see how by comparing the observations in the VIS/NIR range with the data obtained from instruments in the thermal infrared range it is possible to place constraints on the nature of the surface of Phobos and Deimos. Moreover, we will show some new measurements of mixures trying to set compositional constrain in the mix of carbonaceous and basaltic material at the origin of Phobos and Deimos. We will focus in particular on the plausible amount of hydrated material on the surface of the martian moons.
Acknowledgements
This work was performed in support of future MIRS data interpreation. Simulant samples used in this work were produced by the ExolithLab (Florida Space Institute and The Center for Lunar & Asteroid Surface Science at UCF). They were acquired through the laboratory website or they were shared personally by D. Britt to Arcetri laboratory.
References
[1] Fraeman et al. 2014, Icarus, 299, 196–205
[2] Glotch et al. 2018, JGR planets, 123, 2467–2484
[3] Barucci et al. 2021, Earth Planets and Space, 73, 211
[4] Kuramoto et al. 2022, Earth Planets and Space, 74, 12
[5] Britt et al. 2019, Met & Plan Science 54, 9, 2067–2082
[6] Cannon et al 2019, Icarus, 317, 470-478
How to cite: Poggiali, G., Matsuoka, M., Barucci, M. A., Fornasier, S., Doressoundiram, A., Brucato, J. R., Beck, P., Merlin, F., and Andrew, A.: Search for Phobos and Deimos spectroscopic analogs: Summary of remote sensing observations and new preliminary laboratory measurements, Europlanet Science Congress 2022, Granada, Spain, 18–23 Sep 2022, EPSC2022-953, https://doi.org/10.5194/epsc2022-953, 2022.
Introduction.
Understanding the origin and evolution of Phobos and Deimos is the goal of the coming Martian Moons eXploration mission (MMX) led by JAXA [1, 2, 3]. This mission will be launched in 2024 to the Martian system and return samples from Phobos. Before sample return operations, a rover of 25 kg approximately will be delivered to the surface carrying four instruments: a Raman spectrometer (RAX), a radiometer (miniRad), a stereo pair of cameras looking forwards (NavCams), and two cameras looking at the wheel-surface interface, (WheelCams) [4].
The RAX instrument.
The RAman spectrometer for MMX, RAX, has been developed together by DLR, INTA/UVA, and JAXA/UTo [5]. It consists of three elements: I) The RAX Laser Assembly (RLA), which was originally designed for the RLS instrument of the ExoMars mission, and includes a laser emitting at 532 nm; II) The RAX Spectrometer Module (RSM), comprising a sophisticated confocal optical assembly and a CMOS detector that covers a spectral range of up to 4000 cm-1 with a spectral resolution of ̴ 10 cm-1; III) The Autofocus System (AFS) to measure with high precision at different positions onto the ground.
RAX will in situ examine the minerals of the surface and their formation conditions at rover sampling spots. By analysing the vibrational modes of the substances, RAX will be capable to characterize the igneous phases, volatiles, organic species, and secondary alteration minerals at grain scale. RAX’s targets may be correlated, on the one hand to the orbital data to better approach the spatial distribution and stratigraphic relationship between the Phobos’ blue and red material units, and on the other hand to the mineral and rock types observed on the Mars’ surface by other Raman spectrometers to link their genesis (or not) (e.g. RLS [6], or Supercam [7]). The identified mineral assemblages can be used to determine whether Phobos is a captured asteroid rich in carbon and water, or is a remnant body of a giant impact to Mars. In addition, the information may also support the sample return selection and provide context information of the materials once they are in terrestrial laboratories.
References.
[1] T. Usui, et al., Space Sci. Rev. 216:49, 2020; [2] S. L. Murchie, D. T. Britt, C. M. Pieters., Space Science 102, 2014, 176–182; [3] C.M. Pieters, S. L. Murchie, N. Thomas, and D. Britt, Planetary and Space Science 102, 2014, 144-151; [4] P. Michel, et al., Earth, Planets and Space 74: 2, 2022; [5] Y. Cho et al., Earth, Planets and Space 73:232, 2021; [6] F. Rull et al., Astrobiology 17 (6-7), 2017, 627–654; [7] S. Maurice et al., Space Sci. Rev. 217, 2021.
How to cite: Prieto-Ballesteros, O., Böttger, U., Cho, Y., Huebers, H.-W., Rull, F., Schroeder, S., Belenguer, T., Benito, M., Börner, A., Buder, M., Bunduki, Y., Dietz, E., Hagelschuer, T., Kameda, S., Kopp, E., Lopez-Reyes, G., Moral Inza, A. G., Mori, S., Perez Canora, C., Pertenais, M., Peter, G., Rockstein, S., Rodd-Routley, S., Rodriguez Perez, P., Ryan, C., Santamaria, P., Säuberlich, T., Schrandt, F., Ulamec, S., Usui, T., Weber, I., and Westerdorff, K.: In situ science on Phobos by the Raman spectrometer RAX on board the MMX rover, Europlanet Science Congress 2022, Granada, Spain, 18–23 Sep 2022, EPSC2022-955, https://doi.org/10.5194/epsc2022-955, 2022.
Summary
The mid-infrared channel of the Atmospheric Chemistry Suite (ACS) [1] onboard ESA’s Trace Gas Orbiter (TGO) has performed a sensitive search of methane in the Martian atmosphere using the solar occultation technique for more than two Mars years (four terrestrial years). The first two reports [2,3] have concluded on the global absence of methane detection above a mean level of 50 then 20 parts-per-trillion-per-volume (pptv), contrasting with the 0.4 to 45 ppbv concentrations reported from Earth-ground-observations, Mars orbiters, and from Mars’ surface by the Curiosity rover [5,6,7,8,9]. Here we present an update of the ACS methane search compiling all the ACS data collected up to summer 2022.
Introduction
For several decades, methane on Mars has been the subject of a continuous and intense search for it may resonate with an ongoing geophysical or biogenic activity on a planet that has long been perceived as inert. After a succession of failed attempts and positive detections between 2004 and 2019 [4,5,6,7,8,9,21,22], TGO started its trace gas detection mission in April 2018 and has continued since then. With its two separate state-of-the-art infrared spectrometers specifically conceived to achieve outstanding detection performances [1,10] for the ultra-sensitive search of a list of trace gases, including methane, TGO was aimed at confirming the presence of methane at Mars, or alternatively to establish the smallest upper limits possible. The Atmospheric Chemistry Suite (ACS) developed by IKI with the support of CNES is one of the spectrometers of TGO. Together with NOMAD, they offer a complementary access to the entire wavelength range from UV to thermal IR. They are also both observing the mid-IR range and therefore provide a redundant and thus reliable exploration of the presence of a variety of trace gases. Among the greatest achievements of these two experiments, we shall mention the joint observation of HDO and H2O [11,12], the discovery of HCl [13,14,15], the close and joint monitoring of water and ozone [16,17,18], as well as the first CO profiles [19].
Method
The mid-infrared range, in particular the region around the fundamental 3.3 μm band of the C-H bond, provides the most sensitive way to detect methane and higher-order hydrocarbons (Fig. 1). With ACS, this spectral region has been explored around Mars during the last four years and has revealed an absence of methane above a limit of 20 pptv (Fig. 2), while NOMAD similarly established such limit to 60 pptv [20].
The technique of solar occultation is known to be more sensitive than nadir since the Sun is a source at Mars that is ~600 000 times brighter that Mars itself. While the ubiquitous atmospheric dust prevents observing the near-surface region, the high-resolving power (30 000) and its high Signal-to-Noise Ratio (~10 000 at low level of dust) compensate for this limitation. We attempt to detect CH4 using the R2 region which features the most intense individual lines of the band system. This region was backed up by parallel search in three other regions to have confirmation in case of a positive detection.
Results
With two Martian years of survey, the dataset consists of more than 1 000 individual altitude profiles. Since [3], improvements in the data processing have been implemented. This 4-year dataset will be presented along with its implications in regard to other observational studies and model attempts to explain reconcile the various observations.
[1] Korablev, O., et al. 2018. Space Sci. Rev.
[2] Korablev, O., et al. 2019. Nature
[3] Montmessin, F., et al. 2021. Astron. & Astrophys.
[4] Lellouch, E., et al. 2000. Astron. & Astrophys.
[5] Formisano, V., et al., 2004. Science
[6] Krasnopolsky, V. et al., 2004. Icarus
[7] Mumma, M. et al., 2009. Science
[8] Webster, C.R., et al., 2015, Science
[9] Webster, C.R., et al., 2018, Science
[10] Vandaele, A.C., et al. 2018. Space Sci. Rev.
[11] Villanueva, G. et al., 2020. Sci. Adv.
[12] Alday, J. et al., 2021. Nat. Ast.
[13] Korablev, O., et al., 2021. Sci. Adv.
[14] Aoki, S., et al., 2021. Geophys. Res. Let.
[15] Olsen, K. et al., 2021. Astron. & Astrophys.
[16] Fedorova et al., A., et al., 2020, Science
[17] Patel, M., et al., 2021, J. of Geophys. Res.
[18] Belyaev, D., et al, 2021., Geophys. Res. Let.
[19] Olsen, K. et al., 2021. Nat. Geo.
[20] Knutsen, E., et al., 2021, Icarus.
How to cite: Montmessin, F., Korablev, O., Trokhimovskiy, A., Olsen, K., Lefèvre, F., Baggio, L., Braude, A., Fedorova, A., Knutsen, E., Irbah, A., Lacombe, G., Patrakeev, A., and Shakun, A.: A Four-Year Search of Methane on Mars with ACS onboard ExoMars TGO, Europlanet Science Congress 2022, Granada, Spain, 18–23 Sep 2022, EPSC2022-409, https://doi.org/10.5194/epsc2022-409, 2022.
Since February 18, 2021, Perseverance has been exploring Jezero Crater (18ºN, 77ºE). The meteorology of this location is being investigated with the Mars Environmental Dynamics Analyzer (MEDA) [1], which among many other sensors has 5 Air Temperature Sensors (ATS) to measure near surface temperatures. These sensors are located at two altitudes: two are at 0.85 m, in the front of the rover, and three are at 1.45 m around the Remote Sensing Mast (RSM), distributed azimuthally so that at least one sensor is located upwind. Local air temperatures are measured with a frequency that can be as high as 2 Hz. In addition, the temperature of the surface and at an approximate altitude of about 40 m are measured with the Thermal Infrared Sensor (TIRS), which operates with a sampling frequency of 1 Hz. MEDA records atmospheric variables typically over 50% of a full sol.
Here we present consolidated analysis of data up to sol 400, which covers a period from the start of northern Spring (Ls=5º) to early Autumn (beyond Ls=180º). This analysis takes into account different instrumental effects affecting ATS and TIRS which have been characterized over the course of the mission.
Firstly, we will present the daily temperature cycle at Jezero, including mean values and its fluctuations plus their daily and seasonal evolution. Hence, we report phenomena at various altitudes, in different time scales, ranging from thermal tides to continuous rapid fluctuations, as well as the effects caused by the different environments as Perseverance explores Jezero. The convective and calmed regimes, at daytime and nighttime respectively, and the transitions between them are well differentiated in the MEDA data and can be well characterized. We will also discuss vertical thermal gradients (surface to 40 m altitude) along the mission and the evolution of nighttime inversions. Secondly, we quantify the influence of different forcings on temperatures: The thermal changes associated with clouds, dust load, variations of the solar flux and changes in the surface properties on the ground and near-surface temperatures. Specific effects associated with a regional dust storm over Jezero will be presented. Lastly, we will comment on the comparison of temperatures at Jezero with in situ data from other locations [2-3] and models [4-5].
[1] Rodriguez-Manfredi, J. A., et al. (2021). The Mars Environmental Dynamics Analyzer, MEDA. A suite of environmental sensors for the Mars 2020 mission. Space science reviews, 217(3), 1-86.
[2] Davy, R., et al. (2010). Initial analysis of air temperature and related data from the Phoenix MET station and their use in estimating turbulent heat fluxes. Journal of Geophysical Research: Planets, 115(E3).
[3] Mason, E. L., & Smith, M. D. (2021). Temperature fluctuations and boundary layer turbulence as seen by Mars Exploration Rovers Miniature Thermal Emission Spectrometer. Icarus, 360, 114350.
[4] Newman et al. (2020). Multi-model Meteorological and Aeolian Predictions for Mars2020 and the Jezero Crater Region, Space Sci. Rev. 215, 148.
[5] Pla-García et al., (2020). Meteorological Predictions for Mars 2020 Perseverance Rover Landing Site at Jezero, Space Sci. Rev., 215, 148.
How to cite: Munguira, A., Hueso, R., Sánchez-Lavega, A., de la Torre-Juarez, M., Martínez, G., Newman, C., Banfield, D., Lepinette, A., Pla-García, J., Vicente-Retortillo, Á., Rodríguez-Manfredi, J. A., Chide, B., Bertrand, T., Lemmon, M., Sebastián, E., Gómez-Elvira, J., and Lorenz, R. and the CAB Team (6): Mars 2020 MEDA Measurements of Near Surface Atmospheric Temperatures at Jezero, Europlanet Science Congress 2022, Granada, Spain, 18–23 Sep 2022, EPSC2022-247, https://doi.org/10.5194/epsc2022-247, 2022.
For the first time, four surface stations are currently operating on Mars, three rovers, Curiosity in Gale crater (4.6°S, 137.4°E; since 6 August 2012), Perseverance in Jezero crater (18.4°N, 77.5°E; since 18 February 2021), Zhurong in Utopia Planitia (25.1°N, 109.9°E; since 14 May 2021), and the platform Insight in Elysium Planitia (4.5°N, 135.6°E; since 26 November 2018) [1]. All these stations are equipped with a suite of meteorological sensors and cameras. For the first time, simultaneous data can be obtained on the meteorological magnitudes from the instruments onboard these stations allowing a comparative and complementary study of the global and local atmospheric dynamics of Mars. In addition, a battery of up to 8 orbiters are currently studying the planet [2]. In order to interpret and put in context the meteorological measurements at the surface by these stations, we present here a study of the atmospheric disturbances based of images of Mars obtained from cameras in two orbiters: the Visual Monitoring Camera (VMC) onboard Mars Express [3], and the MARCI camera onboard Mars Reconnaissance Orbiter [4, 5]. The period covered by this study extends from the arrival of Perseverance (February 2021) and up to the present with VMC images (Ls ~ 5° – 295°) and up to February 2022 with MARCI images (Ls ~ 170°).
We first report on the disturbances that evolved at the edge of the North Polar Cap (latitudes ~ 40°N to 70°N) during the springtime season in the northern hemisphere. These are dust storms and synoptic-scale cloud systems with arc, frontal, irregular and spiral shapes, typically growing from the baroclinic instabilities in the intense eastward jet present in this epoch of the Martian year, that leave their imprint in the surface pressure, temperature and winds [6] (Figures 1a-b). We also report on the evolution of the aphelion cloud belt (Ls ~ 0° – 180°) in the location of the surface stations. Finally, we present an analysis of dust storms that evolved at other latitudes, but taking particular interest in those that formed and evolved at the location of the stations, as was the case in early January 2022 when a regional dust storm impinged the Perseverance rover (Figure 1c).
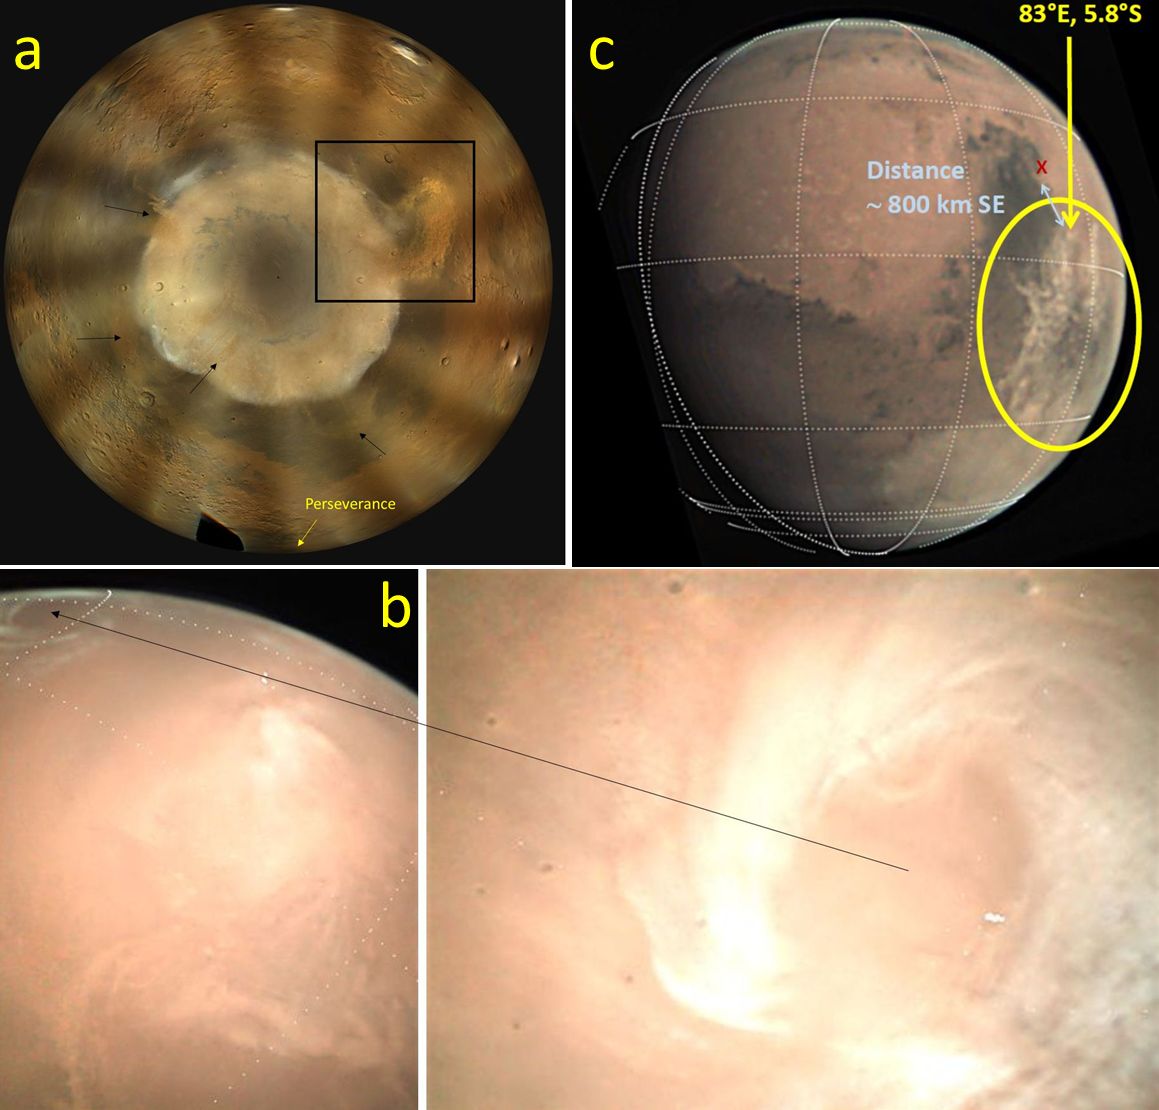
Figure 1. Images of atmospheric disturbances: (a) MARCI polar map for 1 April 2021 showing dust storms at the edge of the North Polar Cap; (b) VMC image of the annular baroclinic cyclone in 3 November 2021; (c) VMC image showing a regional dust storm approaching Perseverance rover (red cross) in 4 January 2022 (SE = South East).
References
[1] Wikipedia: https://en.wikipedia.org/wiki/List_of_artificial_objects_on_Mars
[2] Wikipedia: https://en.wikipedia.org/wiki/List_of_Mars_orbiters
[3] Sánchez-Lavega, A. et al., Icarus 299, 194-205 (2018)
[4] Bell III, J. F. et al., J. Geophys. Res. Planets 114, E003315, 1-41 (2009)
[5] Ordóñez-Etxeberria, I. et al., in Mars Atmospheric Modelling and Observation, MAMO, Paris, 14-17 June (2022)
[6] Barnes, et al., The Global Circulation, in The Atmosphere and Climate of Mars (edts. R. M. Haberle, R. Clancy, F. Forget, M. D. Smith and R. W. Zurek), Chapter 9, pp. 228-294, Cambridge University Press, Cambridge, U.K. (2017)
How to cite: Sanchez-Lavega, A., Larsen, E., Hernandez-Bernal, J., del Río-Gaztelurrutia, T., Ordoñez-Etxeberría, I., Ordorika, J., and Cardesín-Moinelo, A.: Atmospheric disturbances imaged on Mars during the simultaneous operations of four surface stations along 2021 and 2022, Europlanet Science Congress 2022, Granada, Spain, 18–23 Sep 2022, EPSC2022-228, https://doi.org/10.5194/epsc2022-228, 2022.
Abstract:
This work aims to examine the atmospheric pres-sure, ground and air temperatures and relative humid-ity obtained by The Rover Environmental Monitoring Station REMS on its journey from the Mars Science Laboratory (MSL) landing site to its current position on the slopes of Mount Sharp. It seeks to extend the work done by Pla-García et al. [1] and Rafkin et al. [2], studying the evolution of the meteorology during the rover's traverse. The results help to better under-stand the martian meteorology inside Gale Crater, re-vealing changes in pressure and temperature driven by the change in altitude of the rover and meteorological cycles, and confirming the hypothesis of Rafkin et al. [2] about the existence of a pocket of cold air at the bottom of the crater.
2. Methods
We report 3457 sols observations performed by REMS from Martian Year (MY) 31 to 36 for air tem-perature (Figure 1), daily maximum relative humidity (Figure 2), water vapor VMR (Figure 3) and daily mean atmospheric pressure vs elevation (Figure 4).
In an effort to better understand the different me-teorological environments observed inside Gale crater, the Mars Regional Atmospheric Modeling System (MRAMS) was applied to the landing site re-gion using nested grids with a spacing of 330 meters on the innermost grid that is centered over the landing site. MRAMS is ideally suited for this investigation; the model is explicitly designed to simulate Mars’ at-mospheric circulations at the mesoscale and smaller with realistic, high-resolution surface properties. The model is run for 4 sols with 4 grids and then the 3 ad-ditional grids are added and run for at least 3 more sols. Initialization and boundary condition data are taken from a NASA Ames GCM simulation with col-umn dust opacity driven by zonally-averaged TES re-trievals. Vertical dust distribution is given by a Con-rath-v parameterization that varies with season and latitude.
3. Results
Surface pressure drops when climbing Mt Sharp (Figure 4) since the atmosphere column above a unit area shortens as altitude increases [4].
MRAMS results are shown to be in good agree-ment with observations (Figures 5 and 6) when con-sidering the uncertainties in the observational data set. The good agreement provides justification for utiliz-ing the model results to investigate the meteorological environment changes experienced by the rover during mission traverse.
As expected, both REMS and MRAMS show nighttime air temperatures up to 10 K warmer for re-cent years (MY35-36) compared to postlanding years (MY31-32), when the rover was exposed to cold air masses at the crater floor (Figure 5), and lower pres-sure (Figure 6).
During MY31-32 (first and second MSL years), the rover was in the crater floor, completely exposed to the strong N-W downslope (mostly dynamically driven) winds from Peace Vallis during Ls 225-315 [2]. The overturning circulation aloft due to upslope winds during daytime along Gale’s northern rim and Mt. Sharp creates an intense subsidence area in the crater floor area, suppressing the PBL [5]. During the MY33 (third MSL year), the rover climbed the slopes of crater Mt Sharp (Figure 6) and was less exposed to the high subsidence area and to the strong N-W downslope wind flow from Peace Vallis. This new en-vironment condition should favor the dust devil activ-ity. After MY34 (fourth MSL year), the rover could be much more exposed to "free" (and putative wet) atmosphere, that is, outside Gale crater floor air masses that could explain, among other features, the relative humidity and water vapor VMR increment during mission traverse (Figures 2 and 3).
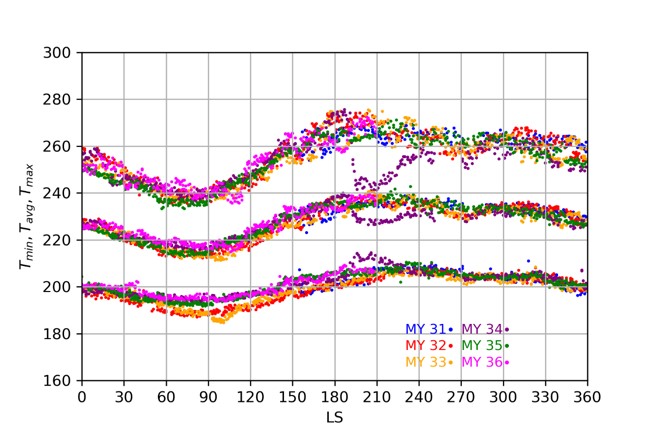
Figure 1: Interannual and seasonal evolution of daily maximum, average and minimum air temperature during the first 3457 sols of the Mars Science Laboratory mission. Color code is used to represent different Martian Years.
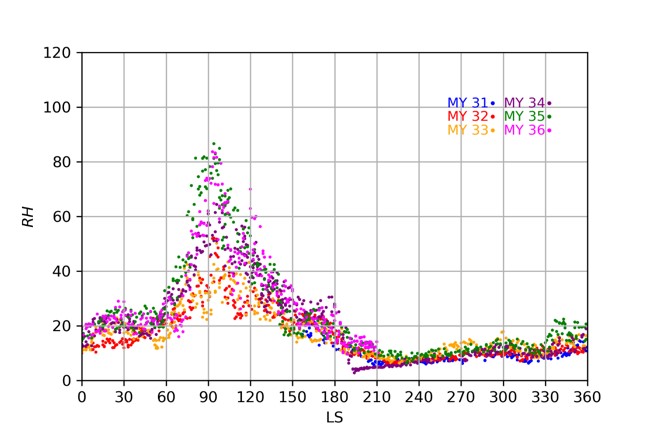
Figure 2: Seasonal evolution of daily maximum relative humidity during the first 3457 sols of the Mars Science Laboratory mission. Color code is used to represent different Martian Years.
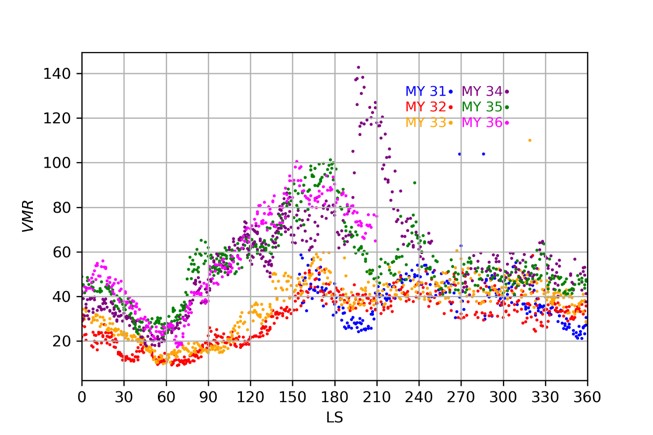
Figure 3: Same as Fig. 3, but for daily water vapor VMR.
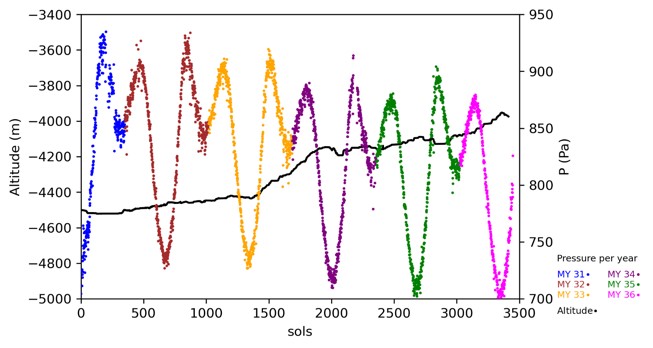
Figure 4: Seasonal evolution of daily mean atmospheric pressure vs elevation changes during the first 3457 sols of the Mars Science Laboratory mission. Color code is used to represent different Martian Years in the pressure.
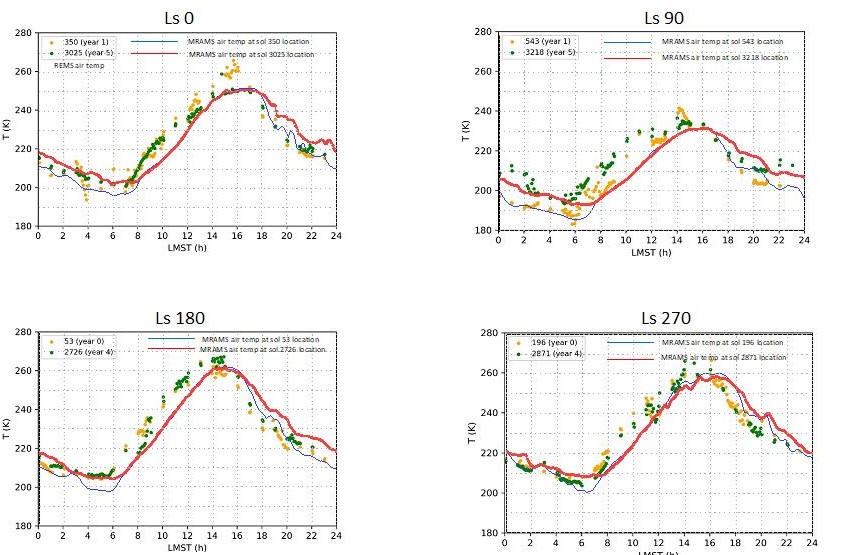
Figure 5: MRAMS model predictions and REMS observations of diurnal air temperature at solstices and equinoxes of MSL years 0-1 (MY31-32) vs MSL years 4-5 (MY35-36). As expected, air temperature during nighttime is up to 10 K warmer at years 4-5 locations (600 m higher in elevation compared to landing site), far away from the cold air masses of the crater floor.
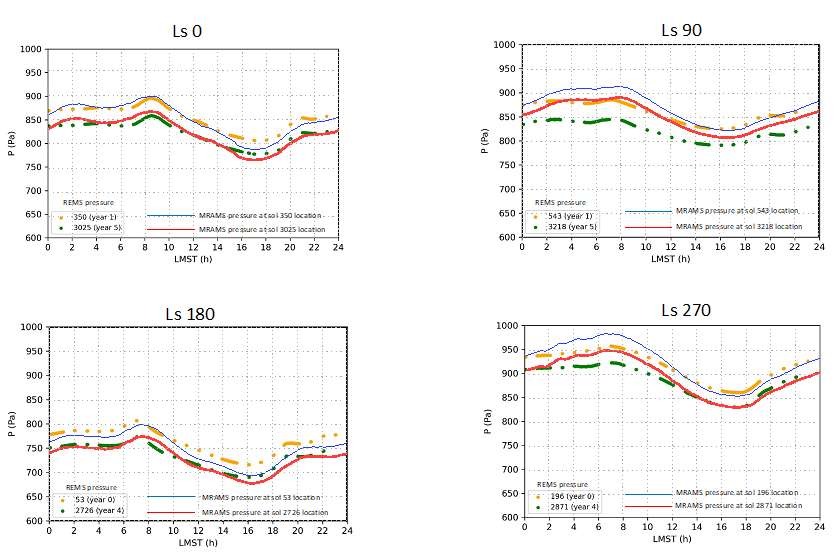
Figure 6: Same as Fig. 7, but for daily mean atmospheric pressure.
References:
[1] Pla-Garcia et al. (2016), Icarus. [2] Rafkin et al. (2016) [3] Gómez-Elvira, J., et al. (2012), Space Science Reviews, 170(1-4), 583-640. [4] Pascal, Blaise (1648) Oeuvres completes. [5] Moores et al. (2015). Icarus, 249, 129-142.
How to cite: Ruíz-Pérez, M., Pla-García, J., Rafkin, S., Martínez, G., de la Torre, M., Gómez-Elvira, J., and Rodríguez-Manfredi, J.: Interpretation of the Meteorological Environment ChangesExperienced By MSL During Mission TraverseUsing REMS and MRAMS, Europlanet Science Congress 2022, Granada, Spain, 18–23 Sep 2022, EPSC2022-478, https://doi.org/10.5194/epsc2022-478, 2022.
Introduction
The large enrichments of D/H currently measured in atmospheric water suggest that a large fraction, beyond 80%, of this water was lost over time1,2, and Ar and O isotopic ratios measured with MAVEN3 and TGO4 indicate Mars has lost a large fraction of its atmosphere. As we attempt to trace back the history of water on Mars, it is unknown how much water remains locked in non-labile/sub-surface reservoirs, and an important question is whether all current labile reservoirs have evolved in the same way and undergone extensive exchange.
New measurements with TGO
We have analyzed data over the entirety a Martian year as measured with TGO/NOMAD, which probed the release of water from the two polar caps using the instrument’s solar occultation mode. Specifically, the measurements presented here have been collected by the NOMAD10 instrument suite onboard TGO. The data were collected employing the Solar Occultation (SO) channel/mode of the instrument.
Interpretation and extraction of molecular abundances from the calibrated data is done by employing the Planetary Spectrum Generator (PSG, https://psg.gsfc.nasa.gov)11, and as reported in 12. The model employs a layer-by-layer line-by-line method in a spherical and refractive geometry. We employ the latest linelists for H2O, HDO, and CO2 as compiled in the HITRAN-2020 database13, which are complemented to include the latest H2O and HDO broadening coefficients for a CO2 atmosphere14,15.
Probing the seasonal release from both caps
During Martian Year 34, the planet was engulfed in a global dust storm (GDS) that greatly perturbed the temperature and vertical structure of the Martian atmosphere. In addition, the lingering effects of the GDS were joined by a large regional dust storm that started during late southern summer (LS 320). These two major events greatly affected the climate of Mars, primarily leading to a strong increase in atmospheric temperature, a substantial rise in altitude of the hygropause, and subsequent transport of water to unexpectedly high altitudes16–22.
Interestingly, during the GDS when the northern hemisphere was in the winter season, the climate was substantially warmer there than normal23–25, leading to high-altitude water also in the northern hemisphere. Typically, the largest seasonal water columns are observed during summer in the northern hemisphere26, and that may be true in MY35, but the vertical profile of water is highly compact (confined to altitudes below 20 km), even at the peak of northern summer (LS 90-130).
In all cases (all seasons and regions of the planet) the D/H declines quickly above the hygropause, from a nominal value above 5 VSMOW to a very low value near <2 VSMOW when HDO is not present (owing to its preferential freeze-out). For the values during the peak of the northern summer release (LS 80-130) and closer to the surface, the D/H varies in the range of 4-7 VSMOW near the hygropause. Importantly, this would mean that the D/H of the water liberated from the seasonal northern polar cap is the same as that of the water liberated from the seasonal southern polar cap, roughly 6-7 VSMOW. Yet, due to the confinement of water relatively close to the surface during northern summer, and the challenges associated with solar occultation probing of such narrow vertical region, our results cannot rule out an alternative scenario with a D/H different than that of the southern seasonal cap.
Discussions and conclusions
The new results presented here, which probe the vertical profiles of water and D/H for both seasonal caps, together with previous ground-based and orbital measurements, suggest a common and highly enriched value for this labile reservoir of water.
Atmospheric D/H behaves as an integrator of the differential individual atomic (H and D) escape rates, and therefore without any new supply of water into the system, the D/H of the labile sources will continue to increase. Among other phenomena, the chaotic changes in obliquity that Mars has experienced, and the corresponding impact on climate and regions of ice stability28,29, could lead to large exchanges between the reservoirs and further homogenization of the D/H across the planet. Thus, the D/H value of the polar caps could be similar to the modern labile D/H value observed in the seasonal releases.
References
1. Jakosky, B. M. Annual Review of Earth and Planetary Sciences 49, 71–93 (2021).
2. Villanueva, G. L. et al.. Science 348, 218–221 (2015).
3. Jakosky, B. M. et al. Science (2017) doi:10.1126/science.aai7721.
4. Alday, J. et al. JGR: Planets 126, e2021JE006992 (2021).
5. Scheller, E. L., et al. Science 372, 56–62 (2021).
6. Plaut, J. J. et al. Science 316, 92 (2007).
7. Zuber, M. T. et al. Science 282, 2053 (1998).
8. Byrne, S. & Murray, B. C. JGR: Planets 107, 11-1-11–12 (2002).
9. Fishbaugh, K. E. & Head, J. W. Icarus 174, 444–474 (2005).
10. Vandaele, A. C. et al. Planetary and Space Science 119, 233–249 (2015).
11. Villanueva, G. L., et al. JQSRT 217, 86–104 (2018).
12. Villanueva, G. L. et al. Science Advances (2021) doi:10.1126/sciadv.abc8843.
13. Gordon, I. E. et al. JQSRT 107949 (2022) doi:10.1016/j.jqsrt.2021.107949.
14. Devi, V. M. et al. JQSRT 187, 472–488 (2017).
15. Régalia, L. et al.JQSRT 231, 126–135 (2019).
16. Aoki, S. et al. JGR: Planets 124, 3482–3497 (2019).
17. Belyaev, D. A. et al. GRL 48, e2021GL093411 (2021).
18. Chaffin, M. S. et al. Nat Astron 5, 1036–1042 (2021).
19. Heavens, N. G. et al. Nature Astronomy 2, 126–132 (2018).
20. Holmes, J. A. et al. Earth and Planetary Science Letters 571, 117109 (2021).
21. Neary, L. et al. GRL 47, e2019GL084354 (2020).
22. Stone, S. W. et al. Science (2020) doi:10.1126/science.aba5229.
23. Daerden, F. et al. JGR: Planets n/a, e2021JE007079 (2022).
24. Montabone, L. et al. JGR: Planets 125, e2019JE006111 (2020).
25. Rossi, L. et al. GRL 48, e2020GL090962 (2021).
26. Crismani, M. M. J. et al. JGR: Planets 126, e2021JE006878 (2021).
27. Laskar, J. et al. Icarus 170, 343 (2004).
28. Jakosky, B. M., Henderson, B. G. & Mellon, M. T. JGR: Planets 100, 1579–1584 (1995).
29. Levrard, B., Forget, F., Montmessin, F. & Laskar, J. JGR: Planets 112, (2007).
How to cite: Villanueva, G., Liuzzi, G., Aoki, S., Stone, S., Brines, A., Thomas, I., Lopez-Valverde, M., Trompet, L., Erwin, J., Daerden, F., Ristic, B., Smith, M., Mumma, M., Faggi, S., Kofman, V., Robert, S., Neary, L., Patel, M., Bellucci, G., and Vandaele, A.-C.: Measurements of water and its D/H as released from both Martian polar caps, Europlanet Science Congress 2022, Granada, Spain, 18–23 Sep 2022, EPSC2022-766, https://doi.org/10.5194/epsc2022-766, 2022.
The first detection of HCl in the atmosphere of Mars was recently achieved by the IR spectrometers (ACS and NOMAD) onboard the ExoMars Trace Gas Orbiter (TGO), revealing the presence of chlorine species in the Martian atmosphere. The two instruments report HCl abundance ranging from 1 to 4 ppbv, for Ls between 250 and 350 [1,2,3,4]. Perchlorate salts [5] (ClO4-) and chloride-bearing minerals [6] are known to be widely present on the surface, so lifted surface materials may be involved in the release of Cl in the atmosphere.
The TGO measurements showed that HCl detections are mainly confined in the specific period around the southern summer season, leading to a possible chemical pathway connected with lifted dust and the release of water vapor from the southern polar cap. Yet sources and sinks of Martian HCl are still unknown.
Orbital and rover measurements do not permit rapid hemispheric mapping, but this is achieved with ground-based observatories in a few hours, permitting accurate measurements of the global distribution of trace gases and fundamental understanding of the distribution of present volatile reservoirs on Mars, and allowing to quantify their evolution and atmospheric loss.
Importantly, with the advent of new near-IR high resolution instrumentation (e.g., Keck/NIRSPEC-II and NASA-IRTF/iSHELL) ground-based observatories are much more sensitive than before, enabling a significant contribution to understand the origin and the variability of organics on Mars. With their much broader spectral grasp, these new high resolution spectrometers also permit simultaneous mapping of trace gases, and isotopes.
In 2021 we started a comprehensive Mars observing campaign with the NASA IRTF/iSHELL spectrometer.
We performed full rapid hemispheric mapping of water, trace gases, HCl and its isotopes, with a highly temporal cadence and extended seasonal coverage from the beginning of the Martian Spring Equinox Ls ~ 356, in early Feb/2021 to about the Summer Solstice Ls ~ 79 at the end of Jul/2021.
This strategic seasonal sampling has the primary objective to properly characterize the Martian atmospheric water cycle, since the polar cap vaporizes between Ls = 0 – 70. Moreover, HCl will be searched close to the Spring Equinox, enabling further investigations of the newly suggested correlation between the release of water and HCl evidenced by TGO measurements [1,2,3,4].
By combining the 2D-maps obtained with iSHELL with the vertical profiles measured by TGO, we will obtain a novel 3D-picture of H2O, HDO HCl and trace gases, and their circulation.
References
[1] Korablev, O., Olsen, K. S., Trokhimovskiy, A., Lefèvre, F., Montmessin, F., Fedorova, A. A., et al. (2021). Transient HCl in the atmosphere of Mars. Science Advances, 7, eabe4386. https://doi.org/10.1126/sciadv.abe4386
[2] Olsen, K. S. et al. "Seasonal reappearance of HCl in the atmosphere of Mars during the Mars year 35 dusty season", Astronomy & Astrophysics, A161, Doi:10.1051/0004-6361/202140329 (2021)
[3] Aoki, S., et al. (co-authors Villanueva, G., Liuzzi, G.) “Annual appearance of hydrogen chloride on Mars and a striking similarity with the water vapor vertical distribution observed by TGO/NOMAD”, Geophys. Res. Letters, 48, doi:10.1029/2021GL092506.
[4] Liuzzi G., Villanueva, G., Faggi, S., Kofman, V. et al. “Probing the Atmospheric Cl Isotopic Ratio on Mars: Implications for Planetary Evolution and Atmospheric Chemistry”, Geophys. Res. Letters, 48, doi:10.1029/2021GL092650.
[5] Hecht et al., 2009, Science, 325, 64–67.
[6] Osterloo et al., 2010, J. Geophys. Res., 115, E10012.
How to cite: Faggi, S., Aoki, S., Liuzzi, G., Sagawa, H., Mumma, M. J., and Villanueva, G. L.: Global maps of H2O, HCl and isotopic signatures in the Martian atmosphere: synergies between NASA/IRTF and TGO/ExoMars observations., Europlanet Science Congress 2022, Granada, Spain, 18–23 Sep 2022, EPSC2022-296, https://doi.org/10.5194/epsc2022-296, 2022.
Abstract
The D/H ratio measured in the Martian atmosphere gives an estimation of the planet’s water escape rate. We present here a global circulation model including the water isotope HDO and the main physical processes of fractionation. Modeling the D/H cycle accompanies the recent measurements from the ACS spectrometer onboard the orbiter TGO. The comparison between the model outputs and the TGO/ACS observations reveal some discrepancies, in particular during the second half of the martian year, when the escape is supposed to be the most efficient. The present work aims at studying these main differences.
Introduction
The high value of the Martian D/H ratio, derived from the HDO/H2O abundance ratio, in comparison to that of the Earth’s oceans[1],[2],[3],[4], is an indicator of the large escape of water from Mars over time. Apart from the mass difference between both isotopes, the differential escape of H and D comes from the preferential photolysis of H2O over HDO[5] and the preferential condensation of HDO over H2O [6],[7],[8]. The NOMAD and ACS instruments onboard ExoMars Trace Gas Orbiter (TGO) have recently provided unprecedented observations of vertical variations in HDO abundance and D/H ratio in the martian atmosphere [9],[10],[11],[12], motivating model development [13],[14]. In particular, TGO data cover the second half (“dusty season”) of martian year (MY) 34, which includes a Global Dust Storm (GDS) (Ls 180°-230°) and a regional dust storm (Ls 315°-330°). These dust events have been proven to be of particular importance in the hydrogen escape inventory [12],[15],[16],[17],[18].
HDO modeling
The D/H ratio measured in the Martian atmosphere gives an estimation of the planet’s water escape rate. We present here a global circulation model including the water isotope HDO and the main physical processes of fractionation. Modeling the D/H cycle accompanies the recent measurements from the ACS spectrometer onboard the orbiter TGO. The comparison between the model outputs and the TGO/ACS observations reveal some discrepancies, in particular during the second half of the martian year, when the escape is supposed to be the most efficient. The present work aims at studying these main differences. Based on Montmessin et al. 2005[19], Rossi et al. 2021[13] have introduced the HDO cycle in the Mars Planetary Climate Model (Mars PCM), formely known as the LMD Mars Global Climate Model[20]. Vals et al. 2022[21] have recently adapted these implementations to the complete representation of the water ice clouds, including the radiative effect of clouds[22] and microphysics, the latter allowing the modeling of supersaturation[23]. The effect of kinetics in the fractionation by condensation has also been included, as has the photodissociation of HDO and the photochemical reactions of the deuterated species [24],[25],[26]. Rossi et al. 2022[27] have used the improved model to compare with TGO/ACS/MIR retrievals of D/H profiles[28] and revealed some discrepancies, which account for the challenge of reproducing the D/H cycle, depending on key components of the Martian atmosphere such as the water and dust cycles.
Preliminary results
By comparing the simulations and the observations, we particularly notice an overestimation by the model of water vapor above ∼60 km occuring near the GDS in MY34, and an underestimation near perihelion in the southern hemisphere (see Figure 1). The difference in water vapor vertical distribution has a direct impact on the D/H profiles (see Figures 2 and 3). In this work, we want to analyse these differences to eventually propose some model improvements. Further comparisons and results for MY34 and 35 will be shown at the conference.
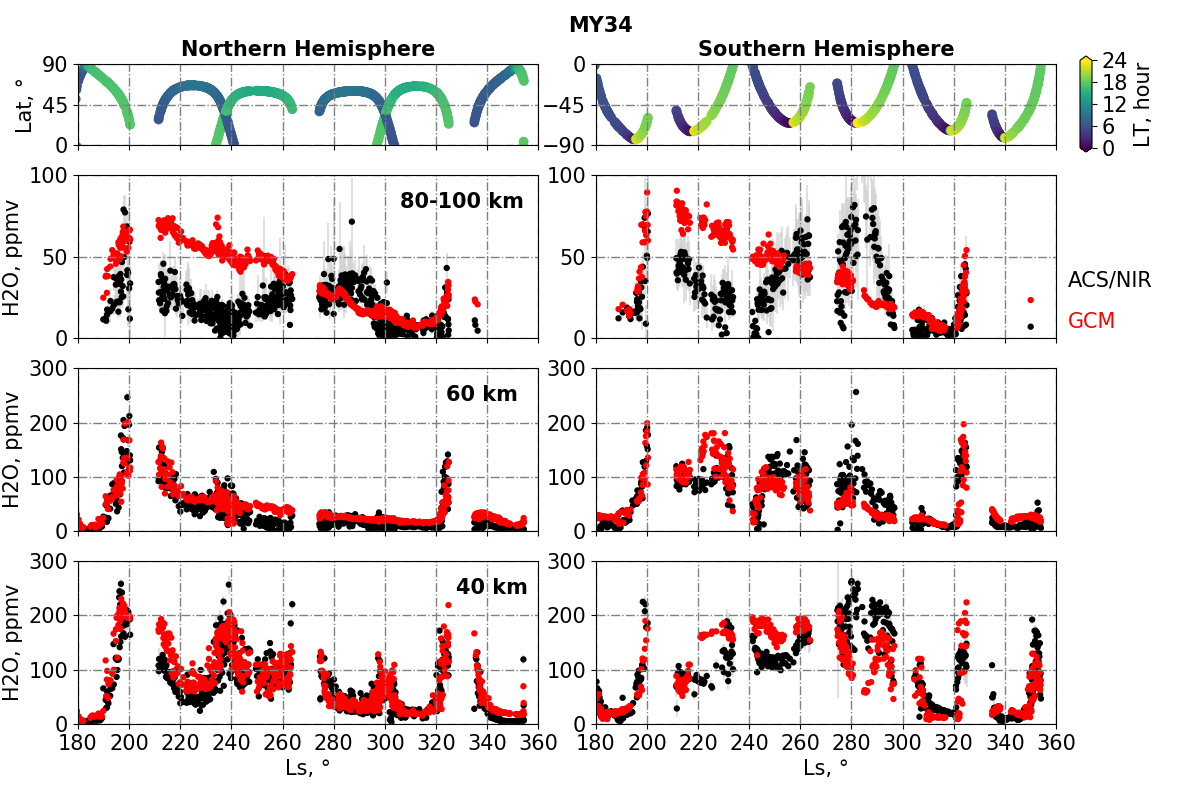
Figure 1: Water vapor volume mixing ratio in ppmv as measured by TGO/ACS/NIR[16] (black) and as computed by the model (red) at different altitude ranges.
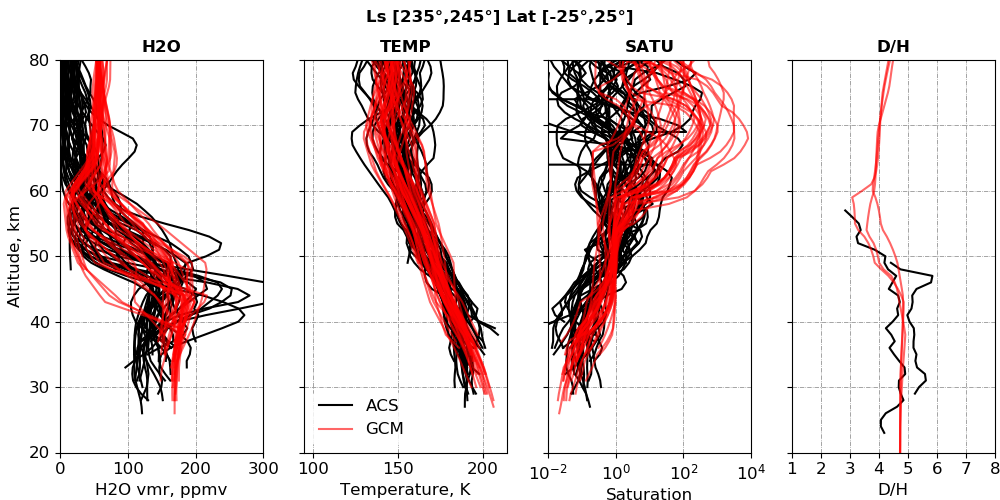
Figure 2: Water vapor volume mixing ratio, temperature and saturation as measured by TGO/ACS/NIR[16], and D/H profiles as measured by TGO/ACS/MIR[28] (black) and as computed by the model (red) during MY34 between solar longitudes 235°, 245° and latitudes -25°N, 25°N.
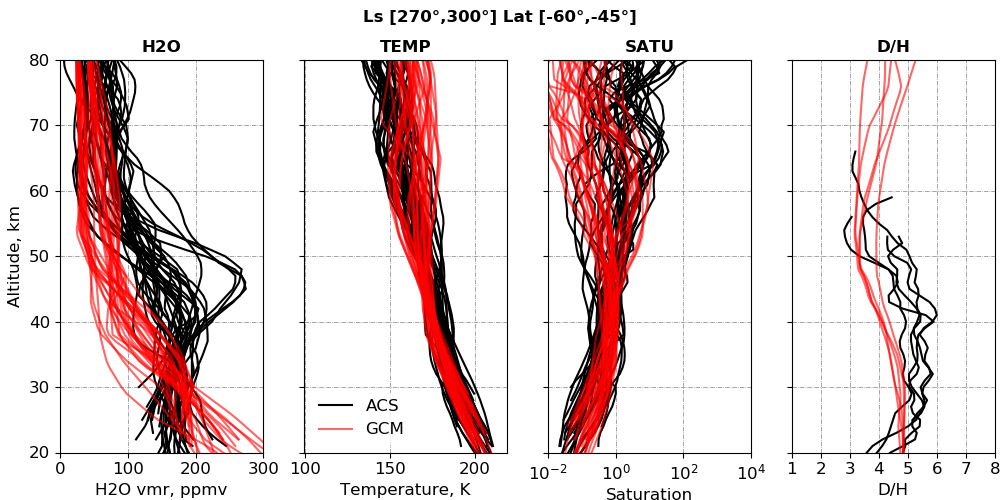
Figure 3: Same layout as Figure 2 between solar longitudes 270°, 300° and latitudes -60°N, 45° N.
References
[1] Owen et al.: Science, 240 (4860), 1767-1770, 1988
[2] Encrenaz et al.: A&A, 612 , A112, 2018.
[3] Krasnopolsky: Icarus, 257 , 377 - 386, 2015
[4] Villanueva et al.: Science, 348 (6231), 218–221, 2015.
[5] Cheng et al.: Geophysical Research Letters, 26 (24), 3657-3660, 1999
[6] Krasnopolsky: Icarus, (2), 597-602, 2000.
[7] Fouchet et al.: Icarus, 144 , 114-123, 2000.
[8] Bertaux et al.: Journal of Geophysical Research: Planets, 106 (E12), 32879-32884, 2001.
[9] Vandaele et al.: Space Science Reviews, 214 (5), 80, 2018.
[10] Vandaele et al.: Nature, 568 (7753), 521-525, 2019.
[11] Korablev et al.: Space Science Reviews, 214 , 7, 2018.
[12] Korablev et al.: Nature, 568 (7753),517-520, 2019.
[13] Rossi et al.: grl , 48 (7), e90962, 2021.
[14] Daerden et al.: Journal of Geophysical Research (Planets), 127 (2), e07079, 2022.
[15] Aoki et al.: Journal of Geophysical Research (Planets), 124 (12), 3482-3497, 2019.
[16] Fedorova et al.: Science, 367 (6475), 297-300, 2020.
[17] Neary et al.: Geophysical Research Letters, 47 (7), e84354, 2020.
[18] Chaffin et al.: Nature Astronomy, 5 , 1036-1042, 2021.
[19] Montmessin et al.: Journal of Geophysical Research, 2005.
[20] Forget et al.: JGR, 104:24,155–24,176, 1999.
[21] Vals et al.: Journal of Geophysical Research (Planets), under revision, 2022.
[22] Madeleine et al. : Geophys. Res. Lett., 39 , 23202, 2012.
[23] Navarro et al.: Journal of Geophysical Research (Planets), 2014.
[24] Lefèvre et al.: Journal of Geophysical Research (Planets), 126 (4), 2021.
[25] Cheng et al.: Journal of Chemical Physics, 120 (1), 224-229, 2004.
[26] Chung et al.: Nuclear Instruments and Methods in Physics Research A, 467 (2002), 1572-1576, 2001.
[27] Rossi et al.: Journal of Geophysical Research (Planets), under revision, 2022.
[28] Alday et al.: Nature Astronomy, 5, 943-950, 2021.
How to cite: Vals, M., Montmessin, F., Rossi, L., Braude, A., Lefèvre, F., Gonzalez-Galindo, F., Chaufray, J.-Y., Fedorova, A., Alday, J., Forget, F., Millour, E., Korablev, O., Trokhimovskiy, A., and Shakun, A.: Modeling the Martian HDO cycle with a Global Climate Model during the “dusty” season, Europlanet Science Congress 2022, Granada, Spain, 18–23 Sep 2022, EPSC2022-451, https://doi.org/10.5194/epsc2022-451, 2022.
NOMAD [1] (Nadir and Occultation for MArs Discovery) is a multi-channel spectrometer onboard the ExoMars 2016 Trace Gas Orbiter (TGO), which began its observations in April 2018. The Solar Occultation (SO) channel has a spectral range coverage from 2.3 to 4.3 μm (2320 to 4350 cm-1), where numerous ro-vibrational bands of H2O are located. An Acousto-Optical Tunable Filter (AOTF) is used to select different spectral windows (with a typical width from 20 to 35 cm-1) corresponding to the desired diffraction orders to be used during an atmospheric scan. The SO channel has a sample rate of ∼1 s, that allows a vertical sampling of typically 1 km. In order to obtain as much information as possible from the Martian atmosphere, for this study we have analyzed data from diffraction orders 134 (3011-3035 cm-1), 136 (3056-3081 cm-1), 168 (3775-3805 cm-1) and 169 (3798-3828 cm-1), taken during different solar occultation scans since the beginning of the science operations phase of the TGO/ExoMars mission. This combination of diffraction orders allowed us to obtain an optimal mapping of the distribution of the water vapor at altitudes from ∼10 km up to about ∼100 km and in different atmospheric conditions, and hence, permitting the study of its spatial and seasonal variability.
The data presented here have been analyzed with pre-processing and cleaning tools developed entirely at the IAA (see companion contributions to this conference [2-4]), and then, inverted using a state-of-the-art retrieval scheme [5]. For the inversion, we have introduced a novel strategy of combining (when coincident in the same solar occultation) pairs of NOMAD orders (in contrast to a post-processing strategy), using orders 134 or 136 for the lower atmosphere, commonly below 60 km, and orders 168 or 169 for the upper atmosphere. This combination procedure allows us to exclude heavily saturated absorption lines present at low altitudes in orders 168-169, which contain strong absorption lines, permitting the exploitation of these orders for the analysis of the atmosphere up to 100 km. Here we present and discuss detailed maps showing the vertical distribution of the water vapor abundance of a subset of the solar occultations observed during the first two years of TGO/ExoMars. This research confirms some findings also obtained by other teams within the NOMAD consortium [6-8] and ACS instrument [9], showing that dust storms allow water vapor to reach higher altitudes in the atmosphere. This is important for the escape of atomic hydrogen [10] and therefore, for the long-term evolution of the Martian atmosphere. Detailed studies on the characterization of the Martian hygropause and saturation events are also presented.
Acknowledgments
The IAA/CSIC team acknowledges financial support from the State Agency for Research of the Spanish MCIU through the 'Center of Excellence Severo Ochoa' award for the Instituto de Astrofísica de Andalucía (SEV- 2017-0709) and funding by grant PGC2018-101836-B-100 (MCIU/AEI/FEDER, EU). ExoMars is a space mission of the European Space Agency (ESA) and Roscosmos. The NOMAD experiment is led by the Royal Belgian Institute for Space Aeronomy (IASB-BIRA), assisted by Co-PI teams from Spain (IAA-CSIC), Italy (INAF-IAPS), and the United Kingdom (Open University). US investigators were supported by the National Aeronautics and Space Administration.
References
1. Vandaele, A. C. et al. NOMAD, an integrated suite of three spectrometers for the ExoMars Trace Gas mission: technical description, science objectives and expected performance. Space Science Reviews 214, 1-47 (2018).
2. López-Valverde, M. A. et al. Temperature and density profiles from the two solar occultation instruments NOMAD and ACS during a full Martian Year. EPSC (2022).
3. Modak, A. et al. Mapping of Martian CO from NOMAD solar occultation measurements for MY35 and 36. EPSC (2022).
4. Stolzenbach, A. et al. Composition and size of Martian aerosols as seen in the IR by NOMAD-SO experiment onboard TGO. EPSC (2022).
5. Jurado Navarro, A. A. et al. Retrieval of CO2 and collisional parameters from the MIPAS spectra in the earth atmosphere (2016).
6. Aoki, S et al. Water vapor vertical profiles on Mars in dust storms observed by TGO/NOMAD. Journal of Geophysical Research: Planets (2019).
7. Aoki, S. et al. Global vertical distribution of water vapor on Mars: Results from 3.5 years of ExoMarsTGO/NOMAD science operations. submitted (2022).
8. Villanueva, G. L. et al. Water heavily fractionated as it ascends on Mars as revealed by ExoMars/NOMAD. Science Advances 7, eabc8843 (2021).
9. Fedorova, A. A. et al. Stormy water on Mars: The distribution and saturation of atmospheric water during the dusty season. Science 367, 297-300 (2020).
10. Chaffin, M., Deighan, J, Schneider, N. & Stewart, A. Elevated atmospheric escape of atomic hydrogen from Mars induced by high-altitude water. Nature geoscience 10, 174-178 (2017).
How to cite: Brines, A., Lopez Valverde, M. Á., Stolzenbach, A., Modak, A., Funke, B., Gonzalez Galindo, F., Lopez Moreno, J. J., Aoki, S., Vandaele, A. C., Daerden, F., Thomas, I., Erwin, J., Trompet, L., Ristic, B., Villanueva, G. L., Liuzzi, G., Patel, M., and Bellucci, G.: Mars water vapor vertical distributions from the troposphere to the mesosphere from NOMAD Solar Occultation for Martian Years 34 and 35, Europlanet Science Congress 2022, Granada, Spain, 18–23 Sep 2022, EPSC2022-504, https://doi.org/10.5194/epsc2022-504, 2022.
Introduction: The NOMAD-UVIS instrument on board the ExoMars Trace Gas Orbiter has been investigating the Martian atmosphere with the occultation technique since April 2018 [1]. In the solar occultation mode, it is mainly devoted to studying the climatology of ozone and aerosols content [2,3,4].
We analyzed almost two Mars Years of ozone vertical distributions acquired at the day-night terminator, corresponding to more than 8300 solar occultations, acquired between April 2018 (MY 34, LS=163°) and November 2021 (MY 36, LS=132°).
Retrieval method(s): As in the work of [5], the NOMAD-UVIS ozone retrievals proved more difficult than expected due to the presence of spurious detections of ozone caused by instrumental effects, high dust content, and very low values of ozone. This led us to compare the results from three different retrieval approaches:
- an onion peeling method (OP);
- a full occultation Optimal Estimation Method (FOEM), and
- a direct onion peeling method (DOP).
The OP method is similar to that used for Mars and Venus stellar occultations [6,7]. The FOEM and DOP approaches are based on ASIMUT-ALVL, the BIRA-IASB radiative code [8,9].
The main challenge was to find reliable criteria to exclude spurious detections of O3, and we finally adopted two criteria for filtering: i) a detection limit, and ii) the Δχ2 criterion. Both criteria exclude spurious O3 values especially near the perihelion, where based on the simulations from a general circulation model, we do expect very low values of ozone.
Comparison of filtering methods between UVIS and SPICAM:
We compared the results of filtering with SPICAM-UVIS observations. The SPICAM team applied very similar criteria for filtering their data to the ones implemented here [5]. Even if the two instruments observed during different Martian Years, the agreement on the filtered O3 retrievals is very good, and both filtering approaches lead to very similar results (see Figure 1).
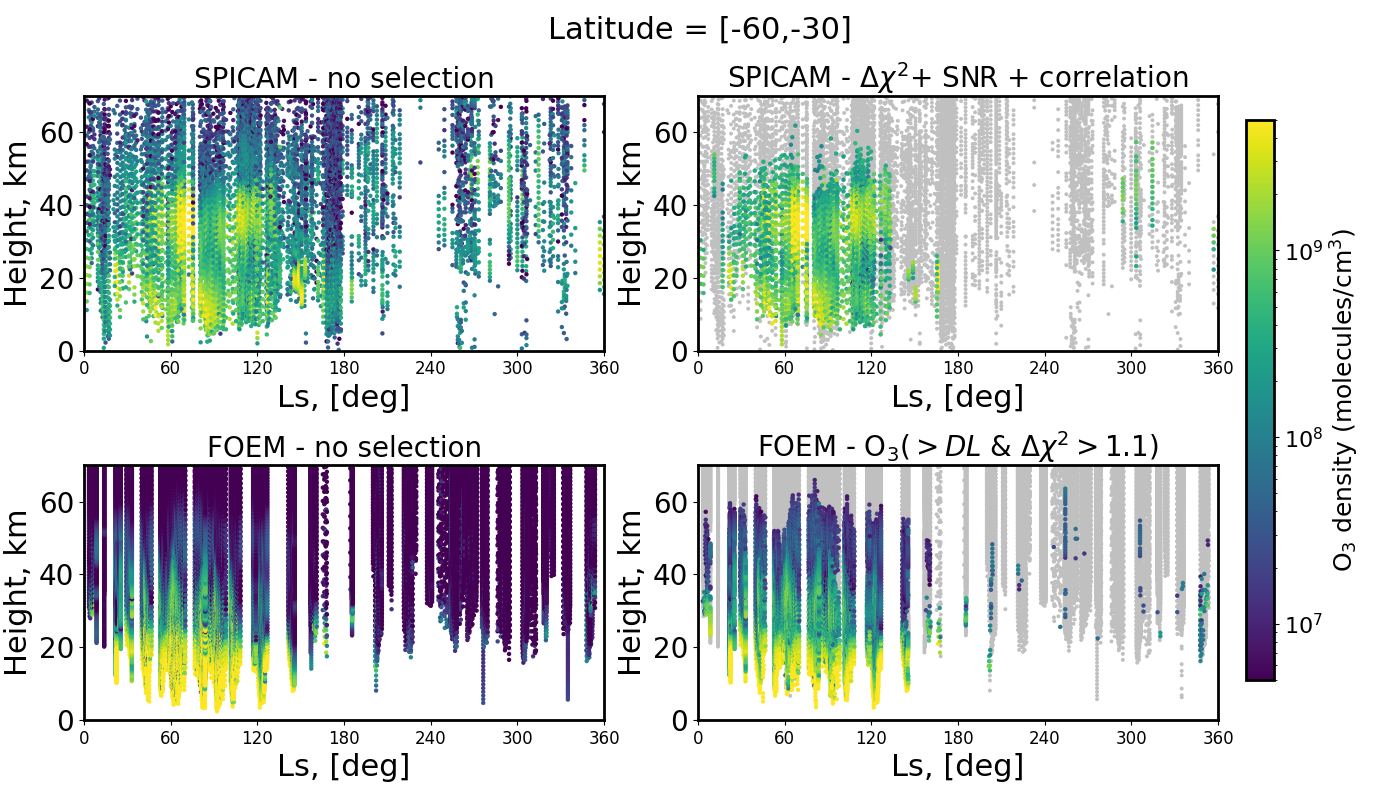
Figure 1: An example of the effect of the selection criteria for SPICAM-UV and NOMAD-UVIS obser-vations for a latitude band (-60°;-30°). Left panels show the ozone vertical distribution before applying the filtering; right panels shows O3 profiles after the selection criteria.
The O3-H2O relationship: Water vapor was observed by the infrared channel of the NOMAD SO. The results from a first analysis can be found in [10], while an extended dataset is presented in a companion abstract [11]. Water vapor and ozone are measured simultaneously, which allows us to investigate the water-ozone correlation, the key to addressing the atmospheric chemistry on Mars.
We present correlation plots of O3 vs. H2O at high latitudes (60°-90°, both hemispheres), and at the equator (30°S-30°N). It is important to notice that during a solar occultation experiment at the terminator, ozone may exhibit rapid changes due to photolysis that are uncorrelated to water vapor. As an example, we show the 60°N-90°N latitude region (Figure 2): a clear anti-correlation is observed at lower altitudes, up to 40 km. O3 is roughly proportional to (H2O)-1.0 up to 30 km and a variation with Ls seems also present.
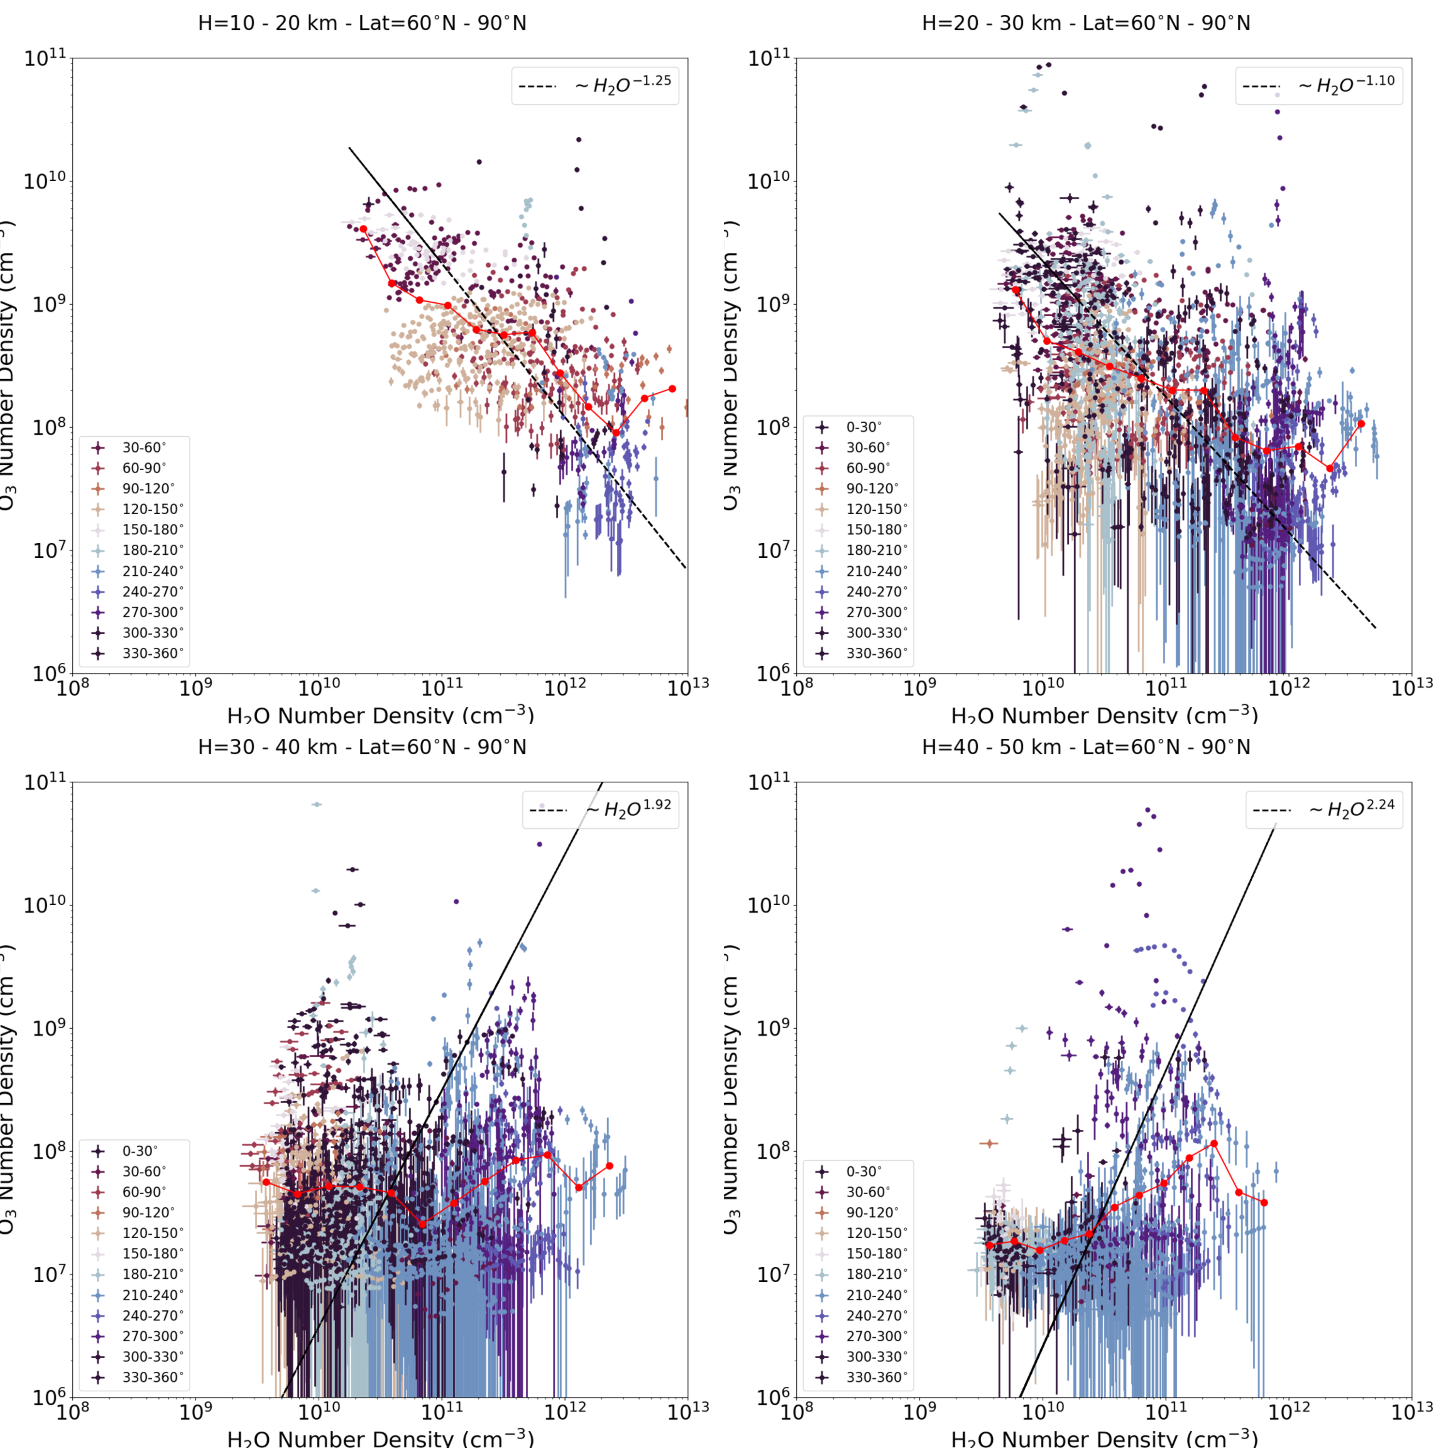
Figure 2: O3 (cm-3) vs. H2O (cm-3) vertical profiles measured simultaneously by NOMAD-UVIS at high latitudes in the Northern hemisphere (60°N-90°N). (a) 10 – 20 km; (b) 20 – 30 km; (c) 30 – 40 km; (d) 40 – 50 km. Colours indicate the Ls interval. The black line shows the function O3 =H2Ox, with x varying with the altitude range.
Impact of gradients at the Martian terminator: Rapid variations in species concentration at the terminator have the potential to cause asymmetries in the species distributions along the line of sight (LOS) of a solar occultation experiment. Ozone, in particular, displays steep gradients across the terminator of Mars due to photolysis [12]. Nowadays, most of the retrieval algorithms for solar and stellar occultations rely on the assumption of a spherically symmetrical atmosphere. However, photochemically induced variations near sunrise/sunset conditions need to be taken into account in the retrieval process in order to prevent inaccuracies.
We investigated the impact of gradients along the LOS for the retrieval of ozone under sunrise/sunset conditions. We used the diurnal variations in the ozone concentration obtained from photochemical model calculations together with an adapted radiative transfer code.
References: [1] Vandaele et al. (2015), PSS. [2] Patel et al. (2021), JGR (Planets). [3] Khayat et al. (2021), JGR (Planets). [4] Neefs, E., et al. (2015) Applied Optics. [5] Määttänen et al. Icarus, in review. [6] Quémerais et al. (2006), JGR (Planets). [7] Piccialli et al. (2015), PSS. [8] Vandaele et al., (2008), JGR (Planets). [9] Piccialli et al. (2021), Icarus. [10] Aoki et al. (2019), JGR (Planets). [11] Aoki et al., (2021) EPSC. [12] Lefèvre, et al. (2008), Nature.
How to cite: Piccialli, A., Vandaele, A. C., Willame, Y., Määttänen, A., Trompet, L., Erwin, J., Daerden, F., Neary, L., Aoki, S., Viscardy, S., Thomas, I., Depiesse, C., Ristic, B., Mason, J., Patel, M., Wolff, M., Khayat, A., Bellucci, G., and Lopez-Moreno, J. J.: Ozone in the Martian atmosphere observed by TGO/NOMAD-UVIS solar occultations, Europlanet Science Congress 2022, Granada, Spain, 18–23 Sep 2022, EPSC2022-1027, https://doi.org/10.5194/epsc2022-1027, 2022.
The two infrared spectrometers onboard the ExoMars Trace Gas Orbiter (TGO) spacecraft, the Atmospheric Chemistry Suite (ACS) and the Nadir and Occultation for MArs Discovery (NOMAD) have been providing observations since April 2018 and are a unique source of information to unveil the vertical structure of the atmosphere of Mars in a level of detail never previously seen. In this work, we focus on understanding how the NOMAD data can be used to constrain the isotopic composition of atmospheric carbon. This has been measured on several occasions on the surface [1], and in near-surface atmospheric samples [2,3], and is of great interest to trace the history of atmospheric loss and differences with other inner solar system bodies. Additionally, proper characterization of the uncertainties of derived isotopic ratios is a very important proxy towards a better understanding of the instrument limitations and performances.
NOMAD is a 3-channel spectrometer working in the spectral ranges 0.2-0.65 μm (UVIS channel) and 2.2-4.3 μm (SO and LNO channels). The data taken by the Solar Occultation (SO) channel measurements in the infrared channel is used in this work. SO is an echelle grating spectrometer with relatively high spectral resolution (λ/dλ~17,000), and an Acousto Optical Tunable Filter (AOTF) used to instantaneously switch the observed diffraction orders, with a typical cycle of 1 second. This yields a vertical sampling of less than 1 km from the surface to 250 km of altitude. In this work we use NOMAD Full Scan data to gather appropriate information about 12C, 13C and temperature. We use full scans acquired between Apr/2018 (LS ~160 MY34) and Dec/2021 (LS ~137 MY36), a type of data in which many diffraction orders are measured along the vertical. From these we derive the average rotational temperature along the line of sight with an accuracy of about 5 K [4], which then can be used to derive the column density at a specific tangent altitude – in particular - of 12CO2 and 13CO2. The accuracy of the retrievals is also possible thanks to recent calibration efforts for the AOTF transfer function and the ILS of the SO channel, which are fully parameterized with the diffraction order [5]. Retrievals are performed using the Planetary Spectrum Generator (PSG, [6,7]), a full general purpose radiative transfer code, which contains a dedicated retrieval module based on Optimal Estimation and is configured with all the instrumental parameters of NOMAD SO natively accounted for.
Once all the retrievals are completed, we filter the values by excluding values with low SNR and those spectra where the intensity of the spectral lines is smaller than 5 times the radiometric noise.
By averaging the different measurements, is possible to get an average vertical profile of the C isotopic ratio. In this work we specifically explore analytical criteria to quantify the uncertainty of the 13C/12C at each altitude and whether the dispersion in the retrieved values is of stochastic nature - meaning that it is not dominated by systematics - or it is related to the limitations of the instrument and the accuracy of spectroscopy. In particular, we conduct specific analyses that quantify the expected uncertainty of a single measurement depending on the observed column of CO2 and the prescribed radiometric noise.
We find that the 13C/12C in CO2 below 50 km can be consistently quantified, complementing the current results by ACS [8] and MSL [2,3]. We estimate the 13C/12C in CO2 in the lower atmosphere (10-25 km) in 1.027+/-0.030 VPDB, largely consistent with the value observed by MSL in surface minerals and the atmosphere. The value is fairly constant throughout the atmosphere with oscillations within the error bars. Upper atmosphere values (>50 km) do not show any inconsistency with the values reported using ACS observation above 60 km [8]. The precision of the measurement is limited by the radiometric SNR, and by the precision with which the spectral continuum can be quantified, which plays an essential role when spectral lines are close to saturation. By combining several lines, the accuracy of the atmospheric temperature is not the main limiting factor.
References
[1] House et al. (2022), “Depleted carbon isotope compositions observed at Gale crater, Mars”, PNAS, doi: 10.1073/pnas.2115651119.
[2] Webster et al. (2013), “Isotope Ratios of H, C, and O in CO2 and H2O of the Martian Atmosphere”, Science, doi: 10.1126/science.1237961.
[3] Mahaffy et al. (2013), “Abundance and Isotopic Composition of Gases in the Martian Atmosphere from the Curiosity Rover”, Science, doi: 10.1126/science.1237966.
[4] Liuzzi et al. (2021), “First Detection and Thermal Characterization of Terminator CO2 Ice Clouds With ExoMars/NOMAD”, Geophys. Res. Lett., doi: 10.1029/2021GL095895.
[5] Villanueva et al. (2022), Under review, Geophys. Res. Lett.
[6] Villanueva et al. (2018), “Planetary Spectrum Generator: An accurate online radiative transfer suite for atmospheres, comets, small bodies and exoplanets”, J. Quant. Spectrosc. Rad. Trans., doi: 10.1016/j.jqsrt.2018.05.023.
[7] Villanueva et al. (2022), Handbook of the Planetary Spectrum Generator, ISBN: 978-0-578-36143-7.
[8] Alday et al. (2021), Isotopic Composition of CO2 in the Atmosphere of Mars: Fractionation by Diffusive Separation Observed by the ExoMars Trace Gas Orbiter, J. Geophys. Res., doi: 10.1029/2021JE006992.
How to cite: Liuzzi, G., Villanueva, G., Stone, S. W., Faggi, S., Kofman, V., Aoki, S., Alday, J., Trompet, L., and Vandaele, A. C.: Measuring the 13C/12C in the lower atmosphere of Mars with NOMAD/TGO: challenges and interpretation, Europlanet Science Congress 2022, Granada, Spain, 18–23 Sep 2022, EPSC2022-575, https://doi.org/10.5194/epsc2022-575, 2022.
Introduction:
Between March 2018 and December 2019, millions of spectra of Mars' surface and atmosphere thermal emission have been recorded in nadir geometry by TIRVIM/ACS, a thermal infrared spectrometer onboard the ExoMars Trace Gas Orbiter (TGO) [7]. From this wealth of data, we characterized in detail the thermal structure of the Martian lower atmosphere at a great variety of local times. Here we focus on the study of migrating thermal tides derived from TIRVIM observations, including during the Global Dust Event of MY34.
Observations and Methods:
We have developed an algorithm coupling line-by-line radiative transfer and optimal estimation theory to retrieve the surface temperature, the vertical profiles of the temperature between a few km and 50-55 km (2–3 Pa), and the integrated optical depth of dust and water ice clouds [3]. The retrieved temperature profiles have a vertical resolution of 10 km in the lower atmosphere and a coarser resolution of 15-20 km in the range 2–20 Pa. They were validated against thousands of co-located observations from the Mars Climate Sounder, acquired in limb viewing geometry [3].
Thermal structure and tides:
Thermal tides are planetary-scale oscillations resulting from the diurnal solar forcing of the thin Martian atmosphere. Migrating tides describe sun-synchronous modes propagating westward with the sun. The diurnal mode has one maximum and one minimum per day and a zonal wavenumber of one; the semi-diurnal mode has two maxima and two minima per day and a zonal wavenumber of two; etc. One of the main advantage of TGO’s orbit is that the local time of TIRVIM nadir observations drifts by 13 minutes earlier each sol. After 54 sols, or 25-35° of Ls, a full coverage of the daily cycle is achieved, allowing to separate between diurnal and seasonal temperature variations. This is clearly an asset to study thermal tides compared to previous studies, mostly based on 2-4 AM and 2-4 PM temperatures obtained from sun-synchronous orbiters [1,4,6,9].
An example of the zonally-averaged temperature retrieved from TIRVIM at 30 Pa in the period March 13 - April 28, 2018 (Ls~150° of MY34) is shown below, as a function of latitude and local time. At the equator, the temperature is found maximum near 3~AM and minimum near 7~PM. This feature of warm nighttime temperatures at this altitude is well known and is a manifestation of the diurnal thermal tide [8]. The fact that these two temperature extrema are not separated by 12 hours is a first hint that the thermal field is also influenced by a semi-diurnal tide.

Figure 1: Zonally-averaged temperature retrieved from TIRVIM/ACS at 30 Pa, with latitude and local time. This figure gathers 45 sols of data around Ls~150°, MY34.
To study migrating tides qualitatively, we consider the zonally-averaged temperature in a fixed local time reference frame, in which other types of wave signatures (stationary waves, non-migrating tides,…) are averaged out. Following [6], we decompose the observed zonally-averaged temperature into a daily-averaged temperature plus sinusoidal functions at diurnal, semi-diurnal and ter-diurnal frequencies. We obtain the amplitude and phase of the migrating tides at each pressure level and 10°-wide latitudinal bin (see below an example of fits).
An amplitude of 4K is found for the diurnal mode near the equator, which decreases to 2K near 20°, and increases to 6K near 50°N. Very similar results are found at Ls~90° for MY35 [2]. We employ the same methodology to derive tides characteristics simulated in the LMD GCM. Temperature profiles from the model are extracted at the same locations and times as TIRVIM observations and are smoothed vertically using the appropriate averaging kernel matrix. The modeled tides exhibit very similar characteristics as those observed, except for a 1 to 2 hours phase shift; temperature extrema occurring at later local times in the model.

Figure 2: Fit (purple) to TIRVIM equatorial temperatures at 50 Pa (black stars, upper part) as a function of local time. It combines a daily average temperature (horizontal dashed line), diurnal and semi-diurnal signals, as labeled. The bottom part shows the same for GCM outputs (shifted by -15K).
One caveat is that even small seasonal variations over a martian month can hamper our analysis when characterizing the semi-diurnal tide [2]. To overcome this issue, we de-trend the data for seasonal variations using MCS observations. The derived amplitude of the semi-diurnal tide near the equator at Ls=150° ranges from 2K (at 100 Pa) to 6K (at 2 Pa), confirming that this tide mode is significant even in non-dusty seasons [6].
Impact of the MY34 GDE: A Global Dust Event started locally on 2 June 2018 and became planet-encircling on 21 June [5]. Compared to pre-storm conditions, we find that the diurnal tide amplitude strongly increases, reaching 32K at 50-60°S and 20K at 50-60°N at 50 Pa, while it remains unchanged (~4K) near the equator. The semi-diurnal mode increases slightly (6-8K at 30-50 Pa, equator), while the ter-diurnal mode is also detected (amplitude of 5K near 50 Pa, equator). GCM simulations run with the MY34 dust scenario agree very well with TIRVIM observations, both in terms of thermal structure and tide characteristics.
Bibliography:
[1] Banfield et al., JGR Vol. 105, 2000. [2] Fan et al., GRL Vol. 49, 2022. [3] Guerlet et al., JGR Vol. 127, 2022. [4] Guzewich et al., JGR Vol. 117, 2012. [5] Kass et al., GRL Vol. 47, 2020. [6] Kleinbohl et al., GRL Vol. 40, 2013. [7] Korablev et al., SSR Vol. 214, 2018. [8] Lee et al., JGR Vol. 114, 2009. [9] Wilson et al., GRL Vol. 27, 2000.
How to cite: Guerlet, S., Fan, S., Forget, F., Millour, E., Ignatiev, N., Vlasov, P., Shakun, A., Trokhimovskiy, A., Korablev, O., Grigoriev, A., and Montmessin, F.: Migrating Thermal Tides in the Martian Atmosphere from TIRVIM-ACS onboard TGO, Europlanet Science Congress 2022, Granada, Spain, 18–23 Sep 2022, EPSC2022-113, https://doi.org/10.5194/epsc2022-113, 2022.
One of the goals of the ESA and Roscosmos Exomars Trace Gas Orbiter (TGO) is the exploitation of the two solar occultation instruments NOMAD [1] and ACS [2] to characterize the thermal structure of the Martian atmosphere with unprecendented vertical resolution, and from the ground up to the thermosphere. Specifically for the upper atmosphere this is a unique opportunity [3] and we present here an on-going effort to retrieve CO2 abundance and temperature profiles simultaneously from each of these instruments and to combine them for a mutual validation and for obtaining a most complete mapping from the TGO orbit.
We developed a retrieval suite common for both instruments, comprising: (a) a cleaning/pre-processing module to build vertical profiles of calibrated transmittances which computes and correct for residual calibration and instrumental effects like spectral shifts, bending of the continuum and variations in the instrument line shape; (b) a state-of-the-art retrieval scheme designed originally for Earth atmospheric remote sensing [4,5,6] and applied to Mars [7], in order to derive simultaneous density and temperature profiles allowing for hydrostatic adjustments during the internal iteration.
Recently the first application of this retrieval scheme focused on measurements by the NOMAD SO channel at altitudes below 100 km, and for the first year of TGO operations, from April 2018 to March 2019 (second half or “perihelion” season of MY34), and revealed very interesting results [8]. The thermal structure is strongly affected by the MY34 global dust storm at all altitudes, a cold mesosphere (in comparison to global climate models) was found during the post-GDS period, and wavy structures at mesospheric altitudes in the morning terminator seem to reveal very strong thermal tides at low-mid latitudes.
In this presentation we also focus on the Martian troposphere and mesosphere and build upon the above mentioned work during the 1st year of TGO by extending the study to a full Mars year and adding retrievals from ACS MIR channel. Both NOMAD/SO and ACS/MIR channels observe the strong CO2 ro-vibrational band at 2.7 micron in the same spectral region with some differences in spectral resolution and noise level, in addition to very differnet instrument characteristics, which are included in our retrieval approach. In obth cases we use calibrated atmospheric transmittances to tackle three targets, CO2 density, temperature, and dust loading, in a simultaneous global-fit inversion, including contaminant species like H2O. The contamination by aerosol can severely limit the ability to sound low tangent altitudes with both instruments, when the gas absorption lines become hidden within the aerosol continuum. But also these measurements permit a good characterization of aerosol properties [9]. Propagation of measurement noise, tunning of regularization, and computation of averaging kernels are performed with the same code and the comparison of the retrieval performance is a first step towards a common validation between these two instruments, considering that a complete correlation is not possible since the two instruments' individual solar occulation scans are non-coincident in time and space. Our results will be discussed and compared to paralell retrieval efforts by other teams within the NOMAD and ACS consortia using the same datasets [10, 11, 12]. We will also compare them with specific runs of the LMD-Mars GCM (see also a companion presentation in this conference on this specific topic [13]). One of the important applications of our inversion is to supply true-field and a.priori inputs for the inversion of trace species from collocated NOMAD spectra, as we are doing for water vapour [14] and carbon monoxide [15].
Acknowledgments
The IAA/CSIC team acknowledges financial support from the State Agency for Research of the Spanish MCIU through the ‘Center of Excellence Severo Ochoa’ award for the Instituto de Astrofísica de Andalucía (SEV-2017-0709) and funding by grant PGC2018-101836-B-100 (MCIU/AEI/FEDER, EU). ExoMars is a space mission of the European Space Agency (ESA) and Roscosmos. The NOMAD experiment is led by the Royal Belgian Institute for Space Aeronomy (IASB-BIRA), assisted by Co-PI teams from Spain (IAA-CSIC), Italy (INAF-IAPS), and the United Kingdom (Open University). US investigators were supported by the National Aeronautics and Space Administration.
References
[1] Vandaele et al., Space Science Reviews 214, 5, 2018
[2] Korablev et al., Space. Sci. Rev. 214, 7 (2018).
[3] Lopez-Valverde et al., Space Sci Rev, 214, 29 (2018)
[4] Funke, B., et al. , Atmos. Chem. Phys., 9(7), 2387–2411 (2009).
[5] Stiller et al., JQSRT, 72, 249–280 (2002)
[6] von Clarmann et al., J. Geophys. Res. 108, 4746 (2003)
[7] Jimenez-Monferrer et al., Icarus, 353, 113830 (2020), doi.org/10.1016/j.icarus.2020.113830.
[8] Lopez-Valverde et al., JGR-Planets (submitted, 2022)
[9] Stolzenbach et al., JGR-Planets (submitted, 2022) and Stolzenbach et al., EPSC 2022 (this conference)
[10] Trompet et al., JGR-Planets (submitted, 2022)
[11] Belyaev et al., GRL
[12] Belyaev et al., JGR-Planets (submitted, 2022)
[13] Gonzalez-Galindo et al., EPSC 2022 (this conference)
[14] Brines et al., JGR-Planets (submitted, 2022) and Brines et al., EPSC 2022 (this conference)
[15] Modak et al., JGR-Planets (submitted, 2022) and Modak et al., EPSC 2022 (this conference)
How to cite: Lopez-Valverde, M. A., Funke, B., Brines, A., Stolzenbach, A., Modak, A., Gonzalez-Galindo, F., Aoki, S., Trompet, L., Thomas, I., Villanueva, G., Liuzzi, G., Belyaev, D., Olsen, K., Trokhimovsky, A., Lopez-Moreno, J. J., Vandaele, A. C., Patel, M., Bellucci, G., Korablev, O., and Montmessin, F.: Vertical distribution of atmospheric temperature and density from the solar occultation instruments NOMAD and ACS on board the Trace Gas Orbiter, Europlanet Science Congress 2022, Granada, Spain, 18–23 Sep 2022, EPSC2022-779, https://doi.org/10.5194/epsc2022-779, 2022.
Please decide on your access
Please use the buttons below to download the presentation materials or to visit the external website where the presentation is linked. Regarding the external link, please note that Copernicus Meetings cannot accept any liability for the content and the website you will visit.
Forward to presentation link
You are going to open an external link to the presentation as indicated by the authors. Copernicus Meetings cannot accept any liability for the content and the website you will visit.
We are sorry, but presentations are only available for users who registered for the conference. Thank you.
Posters: Thu, 22 Sep, 18:45–20:15 | Poster area Level 1
Mars Express has the distinction of being one of the oldest operational spacecraft at Mars, with over 18 years since its injection into Martian orbit in December 2003. Designed for a nominal mission of one Martian year to survey the red planet, it is currently applying for its 9th mission extension. A recent technical review has concluded that Mars Express was technically fit to continue providing excellent science return for the 2023-25 and 2026-28 extension intervals.
The spacecraft subsystems, scientific payload and ground segment are in overall good health, allowing continued smooth mission and science operations. The 3 lifetime-limiting elements of the spacecraft are the gyros, the batteries, and the fuel remaining onboard. The situation of the gyros has been improved by the successful implementation of a gyroless operations mode in May 2018 by the Mars Express teams at ESOC and ESAC. This difficult modification saved the mission and now allows an IMU duty cycle currently reduced to a monthly figure of about 3 to 4 % of the original usage. Mars Express can expect its gyro lifetime to be extended well beyond the 2025 timeframe.
Studies performed in 2019 and 2020 have shown the spacecraft batteries to be much less degraded than had previously been assumed. The findings of these studies were substantiated in subsequent eclipse seasons. A new battery power model now used operationally allows for more flexibility in science planning particularly during eclipse seasons. The longest, most challenging eclipses of the mission were passed successfully in 2021. With shorter eclipse durations in the coming years the outlook is very favourable for continuing to operate the batteries well beyond 2030.
The fuel situation remains satisfactory based on regularly actualised estimates and on a very low fuel consumption (assuming no safe modes; the last one was in 2011). The estimated ~3kg of usable hydrazine (with high confidence based on the Venus Express experience) left onboard can take the spacecraft mission operations to beyond 2030 with the current load of science operations.
Planning and execution of science operations have been improved by upgrades to the mission operations run from the MOC at ESOC and to the Science Ground Segment operations done at ESAC near Madrid. More flexible, rationalised and in some cases even reduced constraints are now in place which enhance the capability of the spacecraft and its payload in performing scientific observations and data taking.
Finally, new science opportunities are presenting themselves in the coming years, illustrated recently by the routine implementation of mutual radio occultations between Mars Express and the ExoMars Trace Gas Orbiter. This will greatly expand the number of atmospheric observations in the future. Automated dual-band radio science occultation observations have now been implemented at egress. The MARSIS subsurface radar is implementing two new promising modes of operation, one to investigate the subsurface at a better sampling rate and one to characterise Phobos, the largest Martian moon and future target for Japan’s MMX mission. Another proposed mission capability will be to perform active sounding of the local plasma environment using combined operation of the ASPERA particle detector and the MARSIS radar. MELACOM relay operations have increasingly taken place with regular Mars Surface Laboratory overflights and were also recently upgraded to implement CNSA’s Zhurong rover overflights and prepare for supporting the ExoMars rover mission as well as other NASA landed assets. These are only a limited set of examples of how Mars Express keeps delivering new and exciting science return.
Interplanetary missions can operate over many years and learning how to use the technology in ways that were maybe not part of the original operational concept is an incredibly important ability. The above demonstrates that the Mars Express teams have been able throughout the mission’s many years of life to render Mars Express a better spacecraft now than at any time before, with in-flight upgrades that kept the mission flying. Those teams were able to make such changes thanks to: robust in-house control and support of the ESAC-run MAPPS planning software allowing for continuous improvement; Flight Control Team with enough skill and resources to modify and fully test the flight code; instrument teams with enough funding and support to allow for software updates/testing late in the mission. This might help younger and upcoming missions assemble the resources now so that they can attempt life-extending changes later.
Combining a special set of payload instruments onboard Mars Express, very resilient spacecraft and payload health and a favourable orbit configuration, this makes for a still unique mission at Mars, very much complementary to newer orbiting elements with different capabilities. ESA is getting the most out of Mars Express and will continue to do so in the coming years, contributing to and enhancing the international cooperation at Mars.
How to cite: Martin, P., Titov, D., Wilson, C., Godfrey, J., Cardesin-Moinelo, A., Blake, R., Dressler, T., Lucas, L., Johnstone, A., Mueller, M., Wood, S., Esquej, P., Merritt, D., Sierra, M., Marin-Yaseli de la Parra, J., Heather, D., Grotheer, E., Breitfellner, M., and Muniz-Solaz, C.: Getting the Most Out of Mars Express, Europlanet Science Congress 2022, Granada, Spain, 18–23 Sep 2022, EPSC2022-1080, https://doi.org/10.5194/epsc2022-1080, 2022.
Abstract
Mars Express experienced numerous challenges from initial operations to date. We present the last scientific operations performed by the Science Ground Segment (SGS) as well as last modifications in the planning processes and software systems to deal with the spacecraft degradation and the operational changes.
1. Introduction
Mars Express remains one of ESA’s most scientifically productive missions and has fully accomplished its mission objectives. The mission provides a unique platform for Mars climate evolution research to help understand the complex atmospheric processes present on Mars. It uniquely covers a huge range of different observations from the subsurface and surface to the magnetosphere and moons.
The Mars Express (MEX) Science Ground Segment team is responsible for the definition and maintenance of the overall scientific plan in cooperation with the Project Scientist (PS). The overview of the SGS system is shown in figure 1.
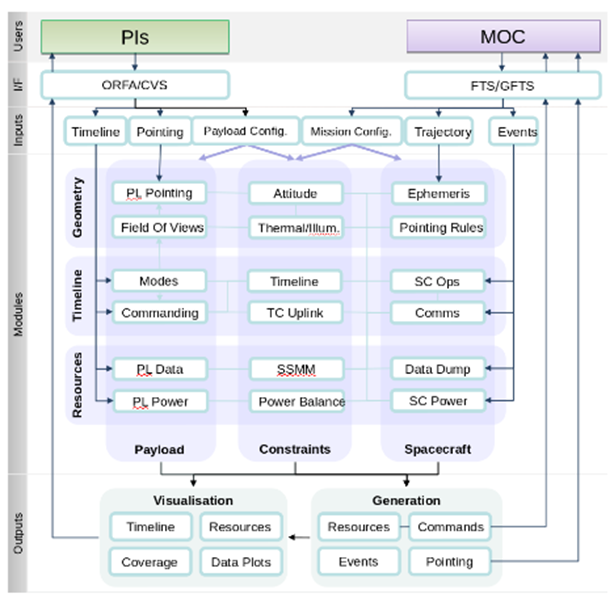
Figure 1: SGS system based on the mission planning
Some of the team duties are:
- Coordinating the candidate observation selection process between the Instrument Teams and the relevant Mission Operation Centre (MOC) teams, supporting the planning activities of the MEX Principal Investigators (PI) in the preparation of science operations for their instruments and shielding MOC from the details of this iterative process,
- Producing a set of consolidated instrument payload operations requests and pointing timeline requests based on the Long Term Plan (LTP) and tool structure. the output of the Medium Term Planning (MTP) exercise, and transferring these to MOC. Specifying the commanding though the short term planning (STP),
- Iterating the instrument payload operation requests with the MOC and the PIs to resolve inconsistencies,
2. Recent changes in science operations
After operating for 18 years, through changing Martian seasons and changes in the condition of the spacecraft, planning the science operations of the mission continues to be a challenge. We will present the improvements over the last few years of our operating methodologies, instrument operation changes, software improvements and scientific observation modifications; degradation of spacecraft systems, overcoming major uncertainty in battery capacity and eclipse operations, expansion of compatible ground relays to adjust to a reduction in antenna time due to increases in spacecrafts at Mars…
Versatility in SGS is the key to success, as there are continuous changes in the Martian seasons, data volume, illumination conditions, power during eclipses and many other factors.
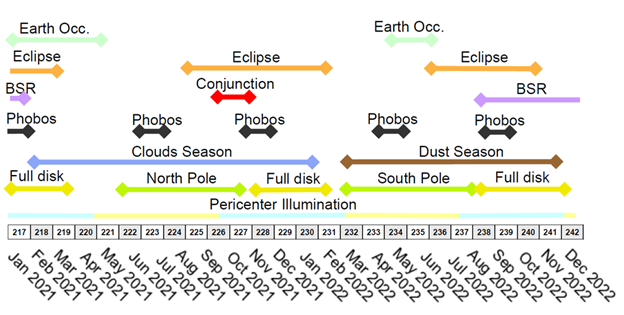
Figure 2: Mission scheme as a function of the Martian climate.
3. Future of the mission and system improvements
Finally, we will summarize the future objectives for the long-term planning period up to 2025 and the general status of the spacecraft and instruments. All these are aligned with the changing Martian seasons as represented in figure 2. Among these activities are:
- Continue the observations of all instruments to fulfill the scientific objectives of the mission extension and new scientific challenges,
- Continuing mutual science observations with the Trace Gas Orbiter (TGO), providing scientific context to the new observations,
- Updates of the ground segment to ensure the extended lifetime of the mission with new operational constraints,
- Support the communications with surface assets (USA and China) and characterize landing sites for future robotic missions.
- Providing unique information about Phobos surface imagery and spectra
4. Summary and Conclusions
Flexibility is key for science missions, and it requires a qualified science operations team with both engineering and scientific experience to achieve their goals. In order to improve SGS planning systems for planetary missions it is vital to take advantage of long-term missions such as MEX in order to transfer the planning knowledge and experience to more complex objectives of the future.
Acknowledgements
The members of the Science Ground Segment team are particularly grateful for the assistance provided by the Flight Control Team at the MOC and the collaboration of all the instrument teams. Without their excellent and constant collaboration in the science planning process, the Mars Express mission would not have obtained such prolific scientific results.
How to cite: Marín-Yaseli de la Parra, J., Cardesín-Moinelo, A., Merritt, D., Sierra Burgos, M., Esquej, P., Grotheer, E., Breitfellner, M., Muñiz, C., Escalante, A., Martin, P., Titov, D., and Wilson, C.: Mars Express Science Ground Segment operations overview, Europlanet Science Congress 2022, Granada, Spain, 18–23 Sep 2022, EPSC2022-752, https://doi.org/10.5194/epsc2022-752, 2022.
Introducction
JAXA’s MMX (Martian Moons eXploration) mission, to be launched in 2024, will study both Martian satellites, for several years, and will drop a small rover to Phobos, to explore its surface [1]. As part of this rover scientific payload, it will be placed a Raman spectrometer, the RAX Instrument (Raman Spectrometer for MMX). The RAX will be able to analyse the mineral composition of the Phobos regolithe surface with in-situ measurements, complementing the Japanese Sample Return mission, and helping to reveal the nature and distribution of materials on the Martian Moon’s surface, and ultimately its origin and evolution [2].
The RAX instrument [3] has been designed, manufactured, integrated and tested by an international consortium led by DLR (Germany), with significant contributions from JAXA & University of Tokyo (Japan), and INTA-CAB-UVa (Spain). One of the Spanish contributions to RAX, will be the instrument Verification Target, a small piece of PET (polyethylene terephthalate) attached to MMX spacecraft, to be used before launch, and during cruise; for spectral instrument performances verification on-ground and just before the rover release to Phobos.
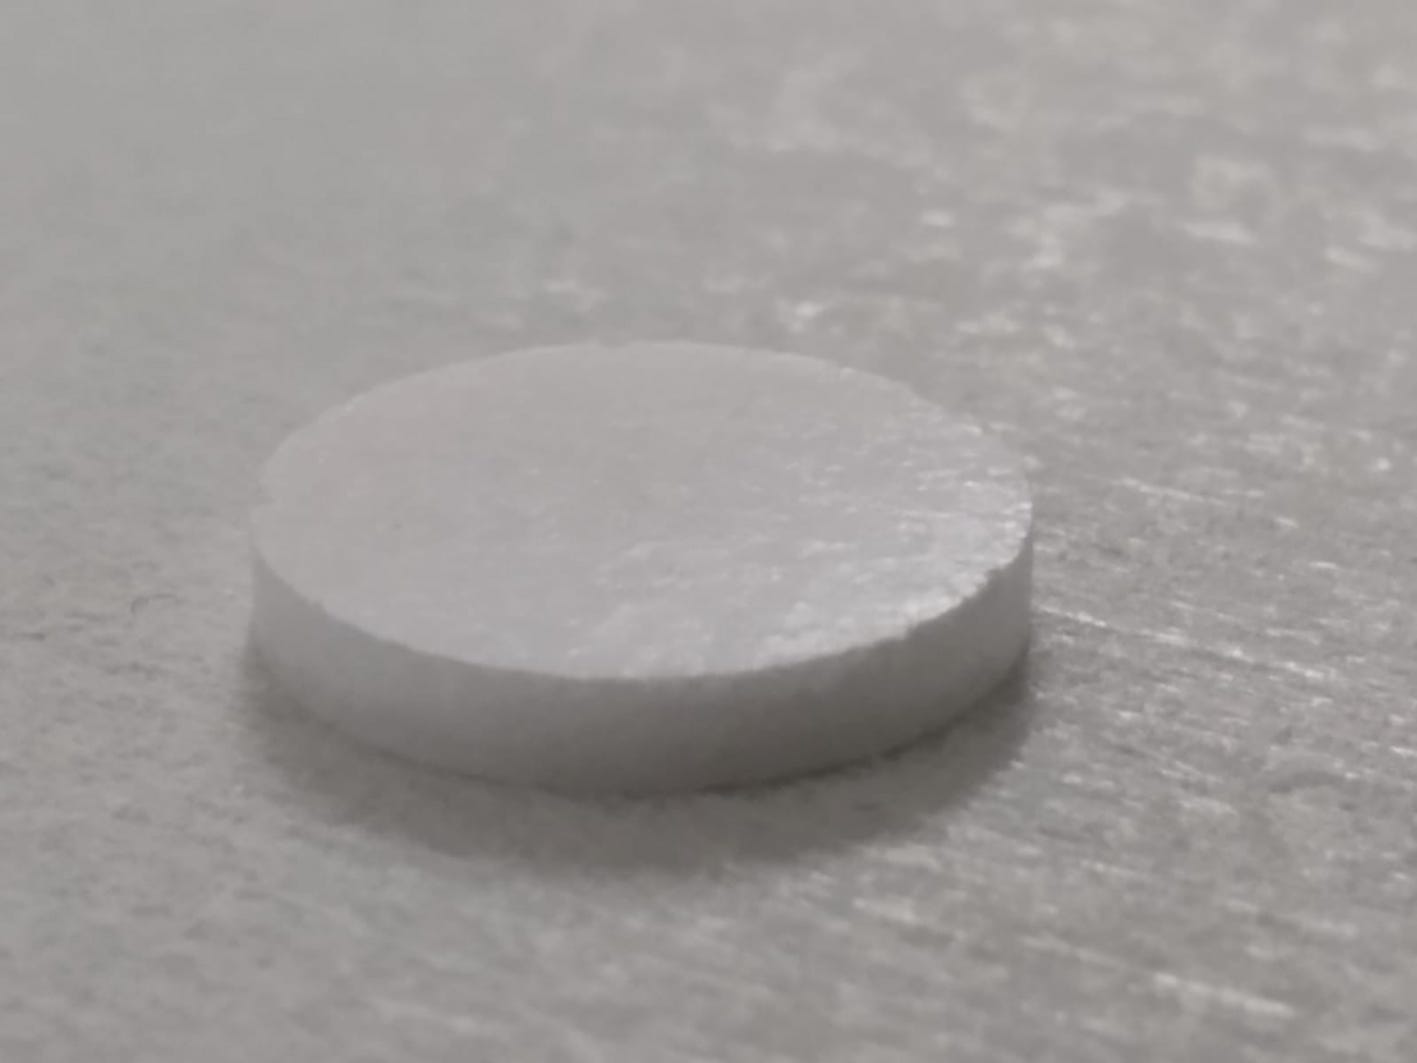
Figure 1. RAX Verification Target design proposed by INTA-CAB-UVa
Experimental
Thanks to previous expertise of the UVa-INTA group with PET material, used on the Raman Laser Spectrometer (RLS) Calibration Target [4] for ESA’s ExoMars mission; and SuperCam Calibration Target [5] for NASA Mars2020; a newly design-deuterated PET material, decreasing the PET fluorescence background, and adding new Raman bands with respect to ordinary PET [6] has been developed, manufactured, characterized and space-qualified for MMX-RAX mission by INTA-CAB-UVa; so it was proposed as candidate the RAX Verification Target.
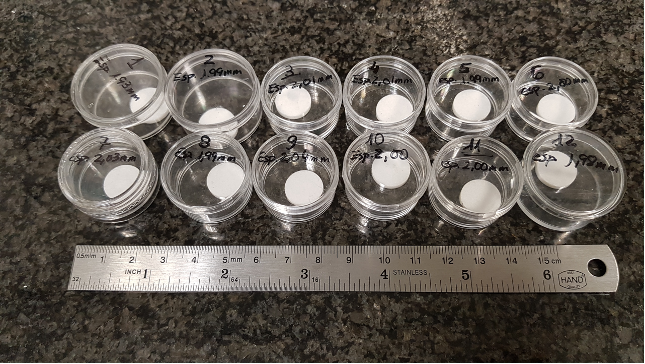
Figure 2. RAX Verification Target Flight batch for qualification/acceptance
Results and discussion
During the session, a detailed description of different tests carried out for the space qualification of the deuterated material, will be shown. And how the final performances with respect to other commercial PETs have been improved; and so, how the final verification-calibration of the Raman instrument has been optimized.
Acknowledgements
INTA’s internal I+D+I project IDMats; and MICINN grants PID2019-107442RB-C32 & PID2019-107442RB-C31
References
[1] Michel P. et al. (2022) Earth, Planets and Space 74, 2.
[2] Hagelschuer, T. et al. (2019) 70th Int. Astronautical Congress, 2019.
[3] Hagelschuer, T. et al. (2022) 73th Int. Astronautical Congress.
[4] López-Reyes, G. et al. (2020) Journal of Raman Spectroscopy, 1-13
[5] Manrique, J.A. et al. (2020) Space Sci Rev, 216:138
[6] Mora, J. et al (2020) Acta Astronaut. 167 (2020) 360–373
How to cite: Moral, A. G., Mora, J., Prieto-Ballesteros, O., Fernández Sanpedro, M., López-Reyes, G., Ercilla, O., Sanz Arranz, J. A., Herrera, A., Pérez, C., Rull, F., Böttger, U., Cho, Y., Schöder, S., and Hübers, H.-W.: Improving the Polyethylene Terephtalate (PET) perfomances, for the RAX Verification Target for MMX mission, Europlanet Science Congress 2022, Granada, Spain, 18–23 Sep 2022, EPSC2022-784, https://doi.org/10.5194/epsc2022-784, 2022.
Introduction
While the single image coverage of the currently available Context Camera (CTX, [1]) images converges to the full coverage of the surface of Mars, the individual images show offsets of tens to hundreds of pixels from their real ground position. Current efforts for ortho-rectification and lateral control use the MOLA data as a source for global reference and geometric correction (e.g., [2]). Towards the equator this approach is unprecise due to the large discrepancy of the spatial resolutions of the two datasets (6 m/px vs.463 m/px). Automatic point matching of image pixels to DTM pixels are not reliable, therefore usually the CTX pixels are matched to imagery datasets which are themselves controlled to MOLA, such as the THEMS IR dataset [3]. This of course is sensitive to error propagation. The HRSC team expects to finalise the creation of global mosaics consisting of bundle-block-adjusted DTMs and their corresponding image mosaics [4] by the end of the year 2023. These DTMs provide an internal photogrammetric precision better than the 50 m used as the grid size. The deviations from the MOLA profile heights are also less than this single pixel resolution value [5]. Their corresponding image mosaics provide precise pixel-by-pixel alignment to the respective DTM in 12.5 m/px resolution [6]. Here we show a first approach using these HRSC products as the global reference dataset for Mars, by creating a CTX quadrangle mosaic with absolute geodetic control to HRSC (and therefore also to MOLA).
Methods
Generally, first the HRSC DTM is used for the ortho-rectification of the CTX images instead of MOLA. After this geometric correction, the image mosaic is used as a reference for automatic point matching and co-registration. We then apply the well-established brightness correction in a similar way we are using it for HRSC [6]. Ultimately, we combine the multitude of images from a whole quadrangle together to a seamless mosaic and export it as a single image file. The general workflow of our processing pipeline is shown in Fig. 1.

Figure 1: Flow chart of the proposed CTX processing workflow from single images to a complete mosaic.
Owed to the large amount of single CTX images per HRSC tile, we use a database management system (DBMS) for storage and retrieval of the CTX data catalog. In the spatially-enabled DBMS we perform geometric queries by intersection with the HMC30 boundary with the CTX footprints. The map-projection and co-registration of the data is slow - processing time can be significantly increased by high-performance computing (HPC). We define the main tasks as array jobs: The ISIS [7] processing pipeline performs image ortho-rectification using the HMC30 DTM. The resulting nominally ortho-rectified CTX images show a significant offset to HRSC based on inaccurate spacecraft attitude control (see Fig. 2 left). For correction, we introduce a subsequent co-registration based on a phase correlation approach [8]. The consecutive brightness correction uses the same HRSC image mosaic as a radiometric reference. A final step for seamline creation and image export is performed outside of the cluster using Desktop GIS software.
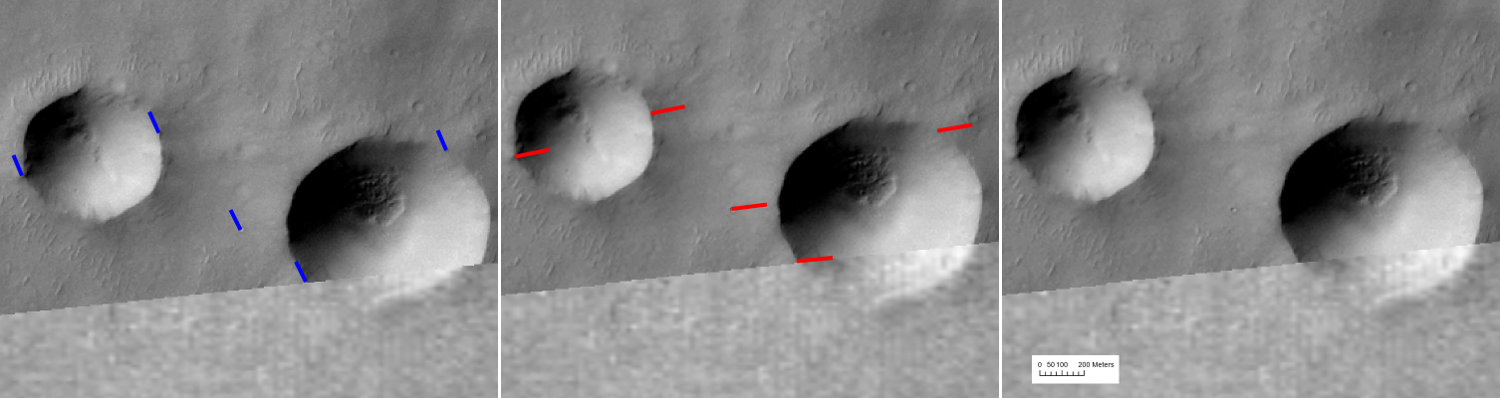
Figure 2: Image offsets between CTX image D02_027799_1580 (6.25 m/px) and HRSC HMC30 20W (12.5 m/px); left: CTX with nominal pointing after ISIS standard processing, offsets in red; middle: CTX co-registered to HRSC by global x/y shift, offsets in blue; right: CTX co-registered by warping to dense network of tie points, no visible offsets.
Results
In a first qualitative assessment of dividual single CTX images, we examined the pixel offsets between the nominal images and their co-registered counterparts. First we tried to translate the images only in x/y direction as a block, but there were significant remaining offsets, increasing in the along-track direction of the spacecraft (see Fig. 2 middle). We achieved better results by transforming the CTX image to the HRSC reference image by the use of a dense network of tie points (see Fig. 2 right). In the example given in Figure 2, the offsets measure about 170 m which corresponds to 27 CTX pixels, 13 HRSC image pixels and 3 HRSC DTM pixels. Based on the processing pipeline described above, we created a complete CTX mosaic of the HMC-20W quadrangle, which will be available on our mapserver (https://maps.planet.fu-berlin.de). The ISIS processing steps were successfully applied to all of the 2062 images intersecting the DTM boundary, and 1692 of the images were successfully co-registered to the HMC30 image mosaic. The processing of the complete CTX dataset consisting of 2062 single images with a resolution of 6.25 m/px took around 3 days on the cluster, but this time is highly dependent on the cluster utilization.
Discussion
The results of the co-registration with a success rate of 82% are better than we initially expected. The remaining visible image gaps might be filled either by adapted parameters for co-registration or by the addition of manual tie-points. The initial offsets between the nominally-processed CTX images and the HRSC DTM (3 pixels in our example) might be large enough to expect impacting geometric artifacts during the orthorectification process, which will not be removed by the co-registration. Therefore it is planned to include an additional iterative processing step by feeding the tie-points acquired from the co-registration back into the ISIS pipeline and perform a bundle-adjustment between the CTX image and HRSC as ground and height reference.
Acknowledgements
This work is supported by the German Space Agency (DLR Bonn), grant 50OO2204, on behalf of the German Federal Ministry for Economic Affairs and Climate Action. We thank the HPC Service of FU for computing time [9].
References
[1] M. C. Malin et al., JGR Planets (E5 2007). [2] J. L. Dickson et al., LPSC 49, #2480. [3] S. J. Robbins et al., LPSC 52, #2066. [4] K. Gwinner et al., EPSC/DPS 13, 2019, #2006. [5] K. Gwinner et al., PSS 126 (2016). [6] G. G. Michael et al., PSS 121 (2016). [7] T. Sucharski et al. (2020), DOI: 10.5281/zenodo.3962369. [8] Q. Chen et al., IEEE TPAMI 16 (1994), pp. 1156–116. [9] L. Bennett et al. (2020), DOI: 10.17169/refubium-26754.
How to cite: Walter, S. H. G., Neesemann, A., Gwinner, K., Michael, G. G., Jaumann, R., and Postberg, F.: Coregistering Mars Reconnaissance Orbiter Context Camera Images to Mars Express High Resolution Stereo Camera Global Datasets, Europlanet Science Congress 2022, Granada, Spain, 18–23 Sep 2022, EPSC2022-601, https://doi.org/10.5194/epsc2022-601, 2022.
Abstract
The European Space Agency’s (ESA) Mars Express (MEX) mission to Mars has been returning valuable scientific data for ~18 years. This data is available to the public for free via the Planetary Science Archive (PSA), which houses the raw, calibrated, and higher-level data returned by the ESA’s planetary missions, including data provided by the various MEX instrument teams. The High Resolution Stereo Camera (HRSC) has provided several types of datasets throughout the mission, and its images have proven popular not only among scientists but also the public for the spectacular images of the red planet. A new version (version 4.0) of the radiometrically calibrated HRSC data has been made available which covers the entirety of the mission’s operation up to now.
This new version utilizes an updated calibration, which is especially important for later images as it improves the adjustments for the aging of the instrument [1]. In addition to the new calibration, the data is now split into mission phases. Previous versions of the radiometrically calibrated data incorporated all observations into a single dataset, which led to increasing lag in some access methods as the dataset continued to grow in size and number of files. All this data and more can be accessed at the PSA at: https://archives.esac.esa.int/psa/
Introduction
MEX was inserted into Mars orbit in December 2003, though several instrument test observations also exist from the cruise phase of the mission, prior to arrival at Mars. Thus, this long-lived Mars mission covers 18+ years of data with its 7 instruments. Later in the mission’s lifetime, the camera used for the Beagle 2 lander separation was reactivated and used for public outreach. Over time, the camera began to be used for scientific observations as well, making MEX an unusual mission in that it now has more scientific instruments in operation than it was launched with.
The PSA user interface
The ESA’s PSA uses the Planetary Data System (PDS) format developed by NASA to store the data from its various planetary missions. In the case of MEX, the data is stored in the PDS3 format, which primarily uses ASCII files to store and describe the data. Newer missions, from ExoMars onward use the PDS4 data standard, which uses XML files. There are three primary ways in which to find the data. One is the FTP area, which houses all the public data in the PSA. Here, there are no advanced search capabilities, but it does provide access to all the supporting files and documentation for the various datasets. When first searching for new data, users would benefit from using the Table View search interface [2]. Here the user can search using various parameters, such as mission name, target, instrument name, processing level, observation times, etc. The Table View is also linked to the Image View, where users can view the browse images provided by the PI teams. The Table View interface also has a section for “Free Search”, allowing one to use Contextual Query Language (CQL) to search over additional parameters. Finally, there is also a Map View for viewing the footprints of data from those instruments where such calculations can be of some utility. These various search methods rely in part on the metadata provided by the instrument teams in the labels associated with each of the data products, though the Map View also benefits from a homogenized approach to calculating geometrical parameters for all data across various missions.
Conclusion
The redelivery of the HRSC data provides an improved dataset with newer calibration factors applied. This data can be freely accessed at the ESA’s PSA, at https://archives.esac.esa.int/psa/. There are multiple ways of browsing the HRSC and other instrument teams’ data, including from other planetary missions, which will be explained in this poster. The development of the PSA’s user interface is an ongoing project, and we welcome feedback from the community for suggestions on new ways to search this wealth of data. Feedback and suggestions can be sent to psahelp@cosmos.esa.int.
Acknowledgements
The MEX Archive Scientist and the entire PSA team would like to extend their thanks to the HRSC team for their effort in updating previous deliveries and continuing to deliver new data from Mars to the public via ESA’s PSA. Our thanks go also to the European taxpayers, whose contributions to the European Space Agency enable the gathering and dissemination of this scientific knowledge, and preserving it for future generations of scientists to work on.
References
[1] Gwinner, K. et al.: The High Resolution Stereo Camera (HRSC) of Mars Express and its approach to science analysis and mapping for Mars and its satellites, Planetary and Space Science, Vol. 126, pp. 93-138, 2016.
[2] Besse, S., Vallat, C., Barthelemy, M., Coia, D., Costa, M., De Marchi, G., Fraga, D., Grotheer, E., Heather, D., Lim, T., Martinez, S., Arviset, C., Barbarisi, I., Docosal, R., Macfarlane, A., Rios, C., Saiz, J., and Vallejo, F.: ESA’s Planetary Science Archive: Preserve and present reliable scientific data sets, Planetary and Space Science, Vol. 150, pp. 131-140, 2018.
How to cite: Grotheer, E., Breitfellner, M., Godfrey, J., Heather, D., Martin, P., Titov, D., Wilson, C., Cardesin-Moinelo, A., Esquej, P., Marin-Yaseli, J., Merritt, D., Sierra, M., Coia, D., Lim, T., Arviset, C., Bentley, M., De Marchi, G., Merin, B., Docasal, R., and Felix-Redondo, F. and the PSA Archive engineering team: New MEX-HRSC radiometrically calibrated data released in the ESA’s Planetary Science Archive, Europlanet Science Congress 2022, Granada, Spain, 18–23 Sep 2022, EPSC2022-939, https://doi.org/10.5194/epsc2022-939, 2022.
Introduction
The detection of anomalous bright reflections beneath the Martian SPLD by MARSIS radar has sparked a vast debate on the characterization of the basal material. The source of the reflections has been interpreted by someone as an evidence of basal liquid salty water [1, 2], while by others as clay sediments or volcanic rocks [3, 4]. Though it has been demonstrated that clays cannot be the responsible of the strong reflections [5], it has not yet been well understood if the dielectric permittivity of the volcanic rocks can be so high as to cause the reflectivity seen by MARSIS. Furthermore, although there are in literature several attempts to demonstrate a correlation between the dielectric properties of volcanic rocks and their whole-rock compositions [6], these data can hardly be compared with each other, since every work employs different experimental setup and procedures. Therefore, a definitive dataset of the permittivity of such samples and planetary simulants does not yet exist, especially at the operating frequencies of planetary radar sounders ( 1 MHz - 1 GHz). The present work aims to be a first step towards a reliable dataset of electromagnetic measurements of volcanic rocks, investigating the relation between their geochemical and their electric and magnetic properties.
Methodology
Sample characterization
We studied the granular samples of three different volcanic rocks that are plausibly representative of the overall surface compositions of the terrestrial planets [7]. In the following, the samples are named as: St. Augustine (2006), Etna (1991-1993) and Etna (Holocene). The St. Augustine (2006) sample is a lava rock coming from the 2006 eruption of the St. Augustine stratovolcano in Alaska [8]. Sample Etna (1991-1993) comes from the Piana del Trifoglietto lava field at SE of Etna summit craters generated by the eruption started on December 1991 and stopped on March 1993 [9]; the rock is characterized by a potassic geochemical signature. Sample Etna (Holocene) is a mugearite from Pizzi Deneri Formation and it comes from an ancient eruption (57000-15000 years ago), representing the more sodic volcanic activity [10]. In Fig. 1 and Tab. 1 are shown respectively the TAS diagram of the samples and their geochemical composition.
The samples exhibit different grain densities: ρSt. Augustine(2006) = (2.736± 0.001) g/cm3, ρEtna(91-93)= (2.961 ± 0.001) g/cm3 and ρEtna(Holocene)= (2.787 ± 0.001) g/cm3.

Table 1. Whole-rock compositions of the samples.
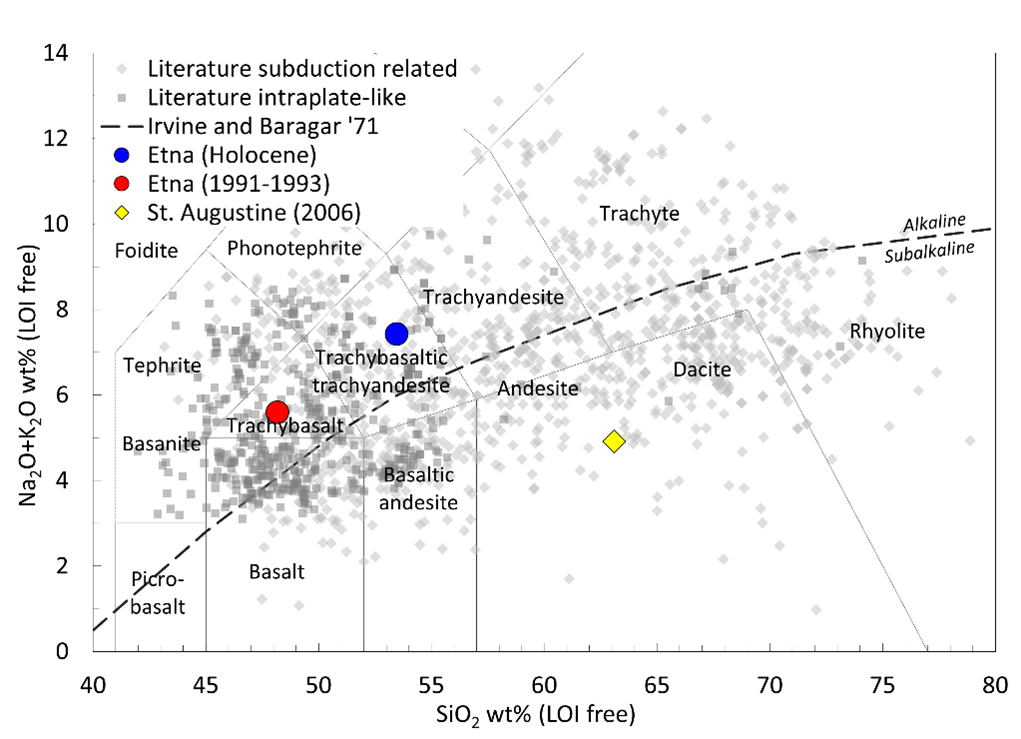
Figure 1. Total Alkali vs. Silica diagram of the samples.
Electromagnetic measurements and mixing formulas
The electromagnetic measurements were carried out with a two port Vector Network Analyzer (VNA), employing a cage coaxial cell and using the experimental procedure and setup described in [11]. The complex permittivity ε and magnetic permeability µ were estimated by using the Nicholson-Ross-Weir algorithm and the equations slightly modified in [12]:

![]()
where Fg is a factor related to the geometry of the cell, Γ and Ψ are the reflection and transmission coefficients, le = 5 cm is the electrical length of the cell, c is the velocity of the light in a vacuum and ν is the frequency. The complex effective permittivity of the two phases granular rock-air was studied using Lichtenecker and Bruggeman mixing formulas:
![]()
![]()
where εi and εeare respectively the permittivity of the environment (the solid grains) and inclusions (air) and f = 1- Φ is the volume fraction of the grainsin the sample, with Φ the porosity.
Results and conclusions
Measurements with the VNA were performed on the granular samples at room temperature, for percentage porosities ranging from 31% to 55%. The magnetic permeability µ is not reported because the three samples do not show a magnetic behavior (and then we can consider µ ≃ 1). Fig. 2 illustrates the complex dielectric permittivity as a function of frequency and at Φ = 0.36. Gray areas in the plots show values that are not reliable since at high frequencies the NRW algorithm diverges because of the cell resonances. Data have larger uncertainties at low frequencies due to VNA instrumental limits. The two Etna samples show a similar dielectric behavior, instead the St. Augustine sample has lower values of both real and imaginary part of permittivity. In the end, we fitted at 80 MHz the complex permittivity as a function of porosity using eqs. 3 and 4. In Tab. 1 we show the measurements at Φ = 0.36 and the values obtained with the mixing formulas at Φ = 0. The St. Augustine sample has the lower values of the solid complex permittivity, probably due to its lower iron abundances and higher abundances of SiO2, while the two Etna samples show a similar dielectric behavior. Further measurements will be required in the future in order to identify the relation between the electromagnetic properties and the geochemical compositions of volcanic rocks that can be accounted as good simulants of the surface and subsurface of terrestrial planets, such as Mars and Venus.
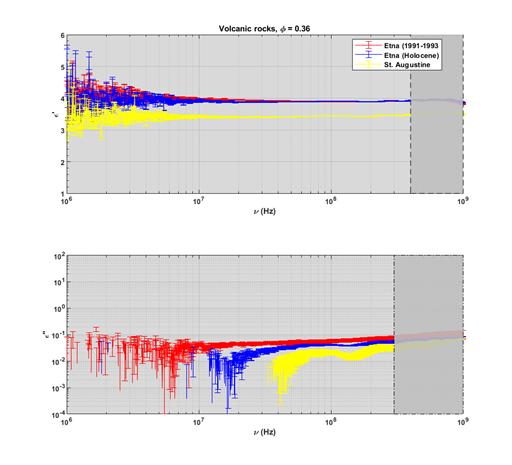
Figure 2. Complex permittivity frequency spectra of the samples.
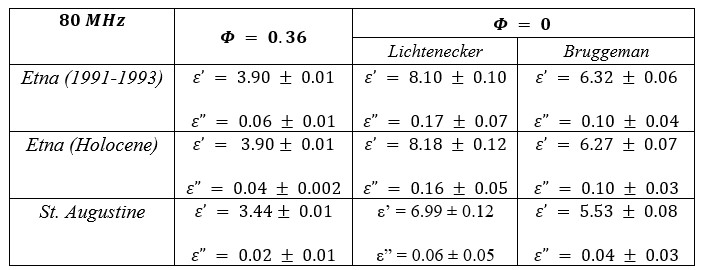
Table 2. Complex permittivity measured at Φ = 0.36 and fitted at Φ = 0 with eqs. 3 and 4.
References
- Orosei R. et al. (2018) Science, 361(6401), 490-493
- Lauro S. E. et al. (2020) Nat. Astron., 5(1), 63-70
- Smith I. B. et al. (2021) Geophys. Res. Lett. 48, 15
- Grima C. et al. (2022) Geophys. Res. Lett. 49.2, e2021GL096518.
- Mattei, E. et al. (2022). Earth and Plan. Sci. Lett. 579, 117370.
- Rust A. C. (1999) Jour. of Volc. and Geoth. Res. 91.1: 79-96.
- McSween Jr et al (2009) Science, 324.5928: 736-739.
- Larsen J. F. et al. (2010). Rapp. tecn. US Geological Survey.
- Calvari S. et al. (1994) Acta Vulcan., 4: 1-14.
- Vona A. et al. (2017) Chem. Geol., 458: 48-67.
- Brin A. et al. (2021) Icarus 114800.
- Mattei E. et al. (2013). IEEE trans. on instr. and meas., 62(11), 2938–2942.
How to cite: Brin, A., Salari, G., Lauro, S. E., Cosciotti, B., Mattei, E., and Pettinelli, E.: Electromagnetic and geochemical characterization of volcanic rock samples in the framework of radar exploration of terrestrial planets, Europlanet Science Congress 2022, Granada, Spain, 18–23 Sep 2022, EPSC2022-956, https://doi.org/10.5194/epsc2022-956, 2022.
- Introduction
In the absence of returned samples, the study of Martian meteorites allows us to classify the samples according to their composition and consequently to study the geochemical processes taking place in the Martian crust. Moreover, meteorites can be also good samples to find possible remains of organic matter that could shed some light on the existence of life on Mars.
In this sense, for this work several shergottites were analyzed with the aim of detecting remarkable biosignature signals by means of Raman spectroscopy to understand their origin, nature and structure.
The selected meteorites were NWA 10628, 1950 and DAG735. Previous petrological studies on the specimens revealed that NWA 10628 consists on grains of pyroxene (~ 70 vol%) and interstitial plagioclase/maskelynite (~30 vol%) [1]; NWA 1950 is a cumulate peridotitic specimen consisting of olivine (~ 55 vol%), pyroxenes (~35 vol%) and plagioclase glass (~8% vol%) [2]; and DAG735 is composed of olivine megacryst and fine-grained mass of pyroxene, mesostasis and maskelynitized plagioclase [3].
- Materials and method
In particular, the analyzed piece of NWA 10628 had a weight of 0.19 g, and “a brownish appearance with minor patches of fusion crust on the surface” [1]. At first sight, its composition seems quite uniform, but it is worth to highlight the difference in roughness between the two faces.
The sample of NWA 1950 weighed 0.081 g and, in contrast to the previous one, in this case it had a heterogeneous appearance with zones with a dark brown coloration and others with a more yellowish appearance.
Finally, the fragment of meteorite DAG735 tested weighed 0.66g and had a slightly rough matrix with a greenish-brown tone, Figure 1 shows, the comparison of the three samples.
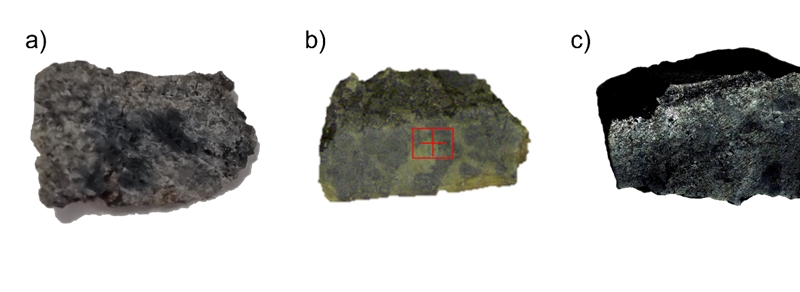
Figure 1. Images of the studied meteorites a) NWA 10628, b) NWA 1950 and DAG735.
With the aim of avoiding alterations and modifications or consumption of such unique samples, non-destructive analytical techniques were employed for the study. On the one hand, an InVia confocal micro-Raman spectrometer provided with 785 nm and 532 nm excitation lasers and CCD detector and calibrated with the 520.5 cm-1 silicon line, was used to obtain the molecular results. On the other hand, X-Ray fluorescence (XRF) allowed us to obtain the elemental composition of the meteorites, for which the M4 TORNADO micro-spectrometer was used.
- Results and Discussion
The Raman analysis obtained for the meteorite NWA 10628 showed that some of the compounds were β-carotene (Figure 2) and a possible sterol known as Cholesteryl stearate (CSA). The spectrum of the β-carotene contains two strong bands at 1157 cm-1 and 1515 cm-1, typical of the stretching vibrations of the polyene chain v1(C=C) and v2(C-C) [4]. Furthermore, the presence of a complex phospholipid called sphingomyelin (SM) was determined by the existence of two bands at positions of 2852 cm-1 and 2885 cm-1 characteristic of CH2 stretching vibrations [5].

Figure 2. Raman spectra of β-carotene in the NWA 10628 meteorite.
In addition, in the specimen NWA 1950 Raman bands that corresponded to the presence of branched-chain saturated fatty acids were found. Obtained Raman spectra matched with those of compounds such as 14-methylpentadecanoid acid, 15-methylpalmitic acid and triacylglycerols, which have the v(C-C) stretching vibrations bands between 1050-1150 cm-1, the δ(CH2) twist vibration at 1297 cm-1 and δ(CH2) or δ(CH3) deformations between 1400-1500 cm-1[6].
Finally, in the meteorite DAG735 a medium chain saturated fatty acid known as palmitic acid (CH₃(CH₂)₁₄COOH) was detected, whose characteristics stretching vibration bands v(C-C) are at 1063 cm-1, 1099 cm-1 and 1129 cm-1. Moreover, δ(CH2) twisting vibrations appear at 1129 cm-1 [7].
- Conclusions
As a conclusion, it can be said that the analysis carried out in the three shergottites provided useful and valuable information about possible biomarkers present in them, and, therefore, on their probable implications with the potential origin of life on Mars.
More specifically, a pigment belonging to the carotene family was found in the NWA 10628 meteorite. This may have been produced as a protection mechanism of microbial life against harmful exposure to UV radiation. Considering this, P. Vítek et al. [4] considered β-carotene as a biomarker of the organic fossil that could have colonized early Mars, 3-4 Ga ago.
Additionally, in two of the meteorites, fatty acids that are part of the cell membranes of all life forms, including microbial organisms were found. In this sense, it should be noted that the samples were always treated taking into account biosafety and sample handling standards, following the MOMA protocol. Therefore, the presence of these compounds as a cross-contamination consequence can be rejected. This fact is supported by the detection of a sphingolipid in the meteorite NWA 10628, which is a compound also found in the structure of all cell membranes.
With these results, unfortunately, the origin of the detected compounds cannot be assured. These meteorites suffered a terrestrial weathering process in which the detected compounds could penetrate the meteorite matrix. However, regardless the Terrestrial or Martian origin of the detected compounds, it can be said that this work proves how an igneous rock, such as the analyzed shergottites, can be a good matrix for preserving biosignatures, compounds that can be detected by Raman spectroscopy.
- Acknowledgements
This work has been funded by the “Raman On Mars” project (Grant No. PID2019-107442RB-C31), funded by the Spanish Agency for Research (MICINN and the European Regional Development Fund), and the “Study of Alteration Processes in Terrestrial and Planetary materials” strategic project (ref. PES 21/88), funded by the University of the Basque Country (UPV/EHU.
- References
(1) https://www.lpi.usra.edu/meteor/metbull.php?code=63155
(2) https://www2.jpl.nasa.gov/snc/nwa1950.html
(3) García-Florentino C., Torre-Fdez I., Ruiz-Galende P., Aramendia J., Castro K., Arana G., & Madariaga J. M. (2021), Talanta, 224, 121863
(4) Vítek P., Osterrothová K., & Jehlička J. (2009). 57(4), 454-459.
(5) Czamara K., Majzner K., Pacia M. Z., Kochan K., Kaczor A., & Baranska M. (2015), 46(1), 4-20. Reference database of Raman spectra of biological molecules
(6) Saggu M., Liu J., & Patel A. (2015).. Pharmaceutical research, 32(9), 2877-2888.
How to cite: Arana, G., Población, I., Aramendia, J., Huidrobro, J., García-Florentino, C., Coloma, L., Torre-Fdez, I., Castro, K., and Madariaga, J. M.: Detection of different biosignatures in the NWA 10628, NWA 1950 and DAG735 Martian meteorites by Raman spectroscopy, Europlanet Science Congress 2022, Granada, Spain, 18–23 Sep 2022, EPSC2022-394, https://doi.org/10.5194/epsc2022-394, 2022.
- Introduction
It is widely known that ionic compounds are hardly detected by Raman spectroscopy. Ionic bonds provide weak or no Raman signal under normal conditions but recent studies [1] have demonstrated that at high pressures and high temperatures quality Raman spectra can be obtained. Unfortunately, high pressures and temperatures change the structural composition of the sample to analyze. This is not the best option when the aim of the analysis is to characterize an unknown sample.
The characterization of ionic compounds such as chlorides is gaining strength in the space exploration field. For instance, in Mars surface phenomena linked to the past presence of water the characterization of chloride bearing deposits is crucial. The molecular characterization of these deposits could provide information about climate, water history and deposition dynamics [2, 3]. Moreover, in the study of terrestrial analogues it is also important in order to ascertain the capability of different compounds to preserve microorganisms, as a background science for Mars exploration.
Considering that Raman spectrometers were sent for the first time to the Mars surface onboard Perseverance Rover (MARS2020 mission), an effort to counter the weaknesses of this technique results worthy, even more, if it is focused on the resolution of key issues for Mars exploration.
In this way, in this work an indirect way to detect the presence of chlorides using the water molecules as a traceable Raman fingerprint is provided.
- Materials and methods
For the mentioned aim, a terrestrial brine sample was used as an analogue of a Mars chloride-bearing deposit. In addition, some hydrated chlorides standards such as MagCl2∙6H2O, CaCl2∙2H2O, FeCl3∙6H20 were also analyzed. In order to understand the contribution in the Raman signal of the major chloride in the sample, a standard of NaCl was also measured by Raman spectroscopy. Finally, a gypsum standard was considered for the work as it was the main Raman signal obtained in the analysis of the sample. For the analysis, a Renishaw InVia Raman confocal microscope was employed provided with several excitation lasers (532, 633 and 785 nm lasers) and a CCD detector. Its high spectral resolution (up to 1 cm-1) allowed obtaining high quality results. The measuring conditions were optimized at 20 seconds and 2 accumulations to obtain a good signal to noise ratio for the sample as well as for the analyzed standards in order to carry out fair comparisons.
- Results
As expected, Raman spectroscopic analyses performed on the brine samples did not provide any signal of the major compounds present in the sample which were mainly chlorides. Instead of that, the only detectable Raman signals were the bands for gypsum. The transparency of the major compounds allows the detection of a minor compound as it is the gypsum. However, it does not provide a complete characterization of the sample.
Considering this, an indirect identification through the presence of water molecules detected by the mentioned technique was tested.
First of all, the band area for the –OH region was measured for the sample Raman spectra. Then, as the gypsum was the only detected signal, a gypsum standard was measured in order to compare the –OH region area with the sample one. In this way, it was observed that the gypsum water molecules did not contribute enough to explain the area present in the sample spectrum. Therefore, by the comparison of the –OH region, a clear input of other hydrated phases to the –OH signals was observed in the sample.
Taking into account that NaCl was expected to be the main compound in the analyzed sample, analysis of a NaCl standard was also performed. In this way, it was confirmed the lack of Raman signal even on the –OH region as it was not hydrated. Thus, the lack of signals in the Raman region of the spectrum (different to that of gypsum), indicated that this extra –OH input belonged to other ionic hydrated species.
Several hydrated chloride standards were analyzed in order to evaluate their contribution in the –OH region. The contribution of the –OH band area of the analyzed compounds fit perfectly the –OH band area obtained for the sample. In this way, it was confirmed by Raman spectroscopy that other hydrated chlorides were present in the sample (Figure 1).
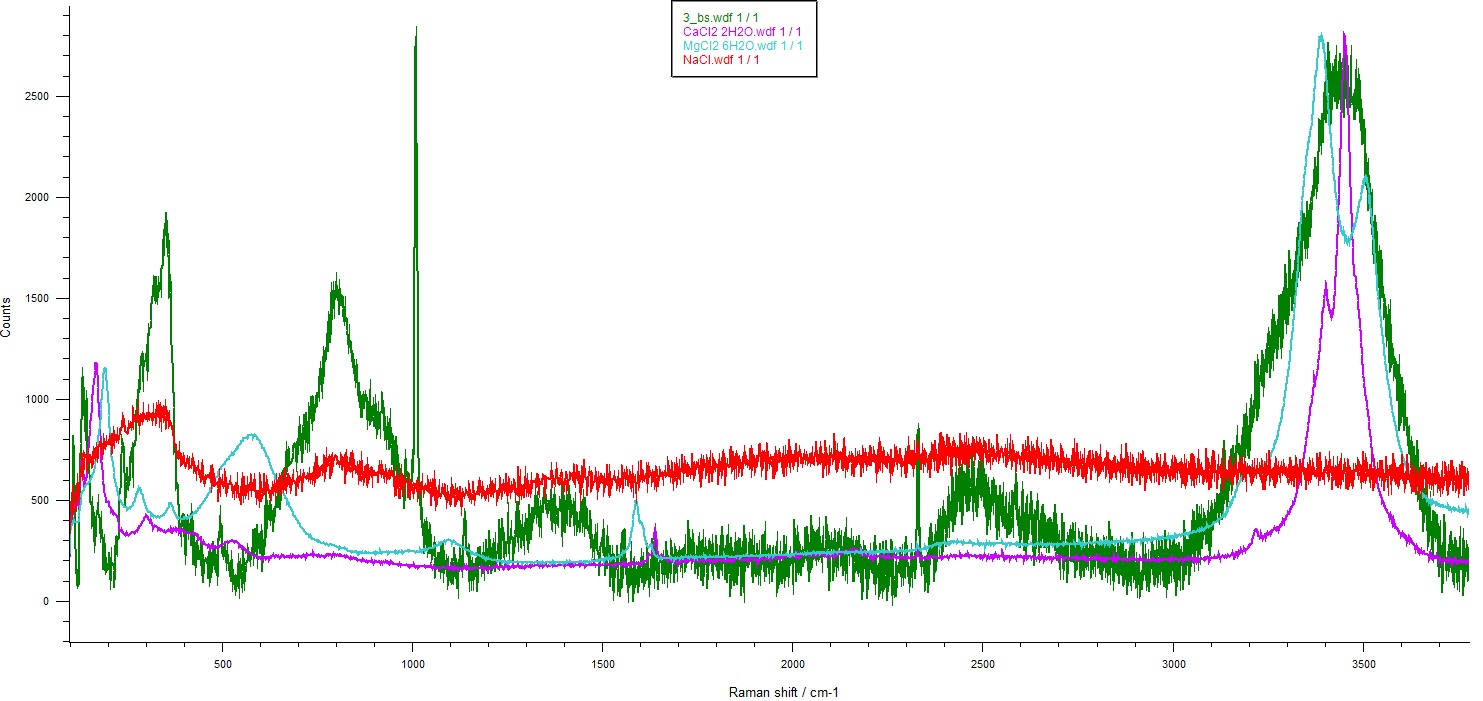
Figure 1. Raman spectra of a brine sample (3_bs) in green, NaCl in red, CaCl2 2H2O in purple and MgCl2 6H2O in cyan.
- Conclusions
Raman spectroscopy has been found as a successful technique to detect hydrated chlorides in brine samples. An accurate identification of the compounds was not possible yet but an indirect unambiguous methodology to detect their presence in a complicated sample is presented in this work. Raman spectroscopic analyses performed on hydrated chloride standards provide some broad and overlapping Raman bands. Nevertheless, the spectra obtained for the real sample did not present those bands. Therefore, the methodology presented on this work can be very useful.
- References
[1] Tian Y., Xiao W., He Y., Zhao H., Jiang F., Tan D., Chen M., Raman spectroscopy of sodium chloride under high-pressure and high-temperature. 2019, https://doi.org/10.48550/arXiv.1903.11824
[2] Leask E. K., Ehlmann B. L., Evidence for Deposition of Chloride on Mars From Small-Volume Surface Water Events Into the Late Hesperian-Early Amazonian. AGU Advances 3, e2021AV000534, 2022.
[3] Uriarte L. M., Dubessy J., Boulet P., Baonza V. G., Bihannic I., Robert P. Reference Raman spectra of synthesized CaCl2 ·nH2O solids (n=0, 2, 4, 6). Journal of Raman Spectroscopy 46, 822–828, 2015.
- Acknowledgements
This work has been funded by the “Raman On Mars” project (Grant No. PID2019-107442RB-C31), funded by the Spanish Agency for Research (MICINN and the European Regional Development Fund), and the “Study of Alteration Processes in Terrestrial and Planetary materials” strategic project (ref. PES 21/88), funded by the University of the Basque Country (UPV/EHU.
How to cite: Aramendia, J., Poblacion, I., Huidobro, J., Coloma, L., Garcia-Florentino, C., Arana, G., Castro, K., and Madariaga, J. M.: Can Raman spectroscopy determine the presence of ionic compounds? The use of water molecules as a indirect identification parameter, Europlanet Science Congress 2022, Granada, Spain, 18–23 Sep 2022, EPSC2022-1046, https://doi.org/10.5194/epsc2022-1046, 2022.
Roadmap to instrument Operation readiness. Lessons learned from the RLS Instrument on board the ExoMars Rover
L. Seoane1, A. Moral1, C. Pérez1, J. Zafra1, S. Ibarmia1, G. López-Reyes2, D. Gutiérrez3, M. García-Alonso4, E. Sentana5, F. Rull2, O. Prieto-Ballesteros6
(1) Instituto Nacional de Técnica Aeroespacial (INTA). Torrejón de Ardoz (Spain). seoanepl@inta.es
(2) Universidad de Valladolid. Valladolid (Spain)
(3) Universidad Rey Juan Carlos. Madrid (Spain)
(4) Universidad Politécnica de Madrid. Madrid (Spain)
(5) Universidad Carlos III. Madrid (Spain)
(6) Centro de Astrobiología (CSIC-INTA)
The Raman Laser Spectrometer (RLS) [1], as one of the three scientific instruments inside the Pasteur analytical suite on board the Rover module of the ExoMars mission, must be operated in fully coordination with the Rover Operations Control Center (ROCC) by the RLS Operations team [2].
So, the preparation for instrument operations is twofold; on one side, at high level, the ROCC provides organization, tools, infrastructure, training, etc. to all personnel involved in ROCC operations, including science instrument teams. On the other side, and always being compliant with agreements and dispositions made by ROCC, each science instrument team must also prepare its own organization, specific tools, infrastructure outside ROCC, internal training, etc. at instrument level.
While at high level all the process is guided by the ROCC, for the preparation at instrument level, each instrument team must be in charge to do it. This contribution tries to show the path to be followed for the latter, the operations preparation at instrument level, taking the experience obtained by RLS as reference.
Establishing a specific working group may be a good starting point. As main activities, this group would be in charge of, besides ROCC interface management, instrument operation definition - including definition of reference activity plans, instrument measurement scenarios, staffing, roles and logistics, day-to-day operations, tools, data flow and support laboratory data, among others - and operation readiness plan development – defining a set of specific activities grouped by milestones, establishing how and when they should be finished.
Based on RLS experience, we cannot consider instrument operation definition as straightforward. It comprises many different activities which requires quite personnel involved, taking decisions at different levels. Furthermore, the list of activities is not easy to be fully identified at the beginning. So, for all this, RLS makes the operation readiness plan as a key element to control the progress despite these difficulties.
The plan was established choosing temporal horizons relevant for the mission, and from there, defining which capacities of software, installations and personnel should be ready to be able to operate the instrument properly at the end of each horizon, point at which a simulation is scheduled.
Simulations are the means to verify expected activities were carried out and work fine during a quasi-real scenario and to find out new needs not originally covered. So, feedback got during simulations is really helpful to improve the operation definition in different aspects, from equipment and infrastructure, to tasks assigned by roles, coordination between team members, tools improvements, etc. It is for this that both, the simulation preparation and its review are considered very relevant activities and must be carefully prepared.
Activities assigned to each temporal horizon or phase are, at least at the beginning, quite addressed by the development of software tools. These tools support tasks assigned to personnel, they are quite often complex and their development very time-consuming. So, in order to have a good progress in the operation readiness, review points of software developments should be included in simulations.
Thus, to define activities for the different phases, efforts in determining data flow and needed software applications should be made from the beginning. In the case of RLS, the following software tools have been considered:
For instrument data processing:
- RENATO: Raman ENgineering Assesment Tool, for automatic check of instrument health and verification of the last commanded activities execution, anomalies identification, etc.
- IDAT/SpectPro: Instrument Data Analysis Tool for processing Raman spectra, including automatic generation of elaborated products and reports.
- RASTA [3]: RLS Archive and Supporting Tools for Analysis of data generated during any test on any model of RLS whose data had been previously inserted in the database (RASTA-DB) by executing a script available with this tool (RASTA-PARSER).
For APs (Activity Plans) generation:
- RLS_AP_Generator: Tool for APs creation, including validation of parameters, and estimation of data generated when the AP is executed and duration of this execution.
For supporting instrument operation:
- RLS Operation Portal: Web application developed through a wiki-based approach that allows accessing to downlinked/uplinked data, reports generated, operator shifts, and all the information that can be considered useful for the RLS team during operations.
Apart from data flow and software tools, development and setting of installations can be included in the operation readiness plan. For RLS, besides the Rover Operations Control Centre (ROCC) that is located at ALTEC, in Torino, a specific instrument Control Centre was proposed. This is the RLS Operations Control Centre (RLS-OCC) placed at INTA and connected to the ROCC by VPN, allowing remote operation of the instrument. In this case, the RLS-OCC was included in the instrument operation readiness plan, having its development scheduled into the plan.
In conclusion, establishing a plan focused in simulations results in an extremely practical resource to manage instrument operation readiness; besides supporting training of the team involved, it helps to improve roles definition and, also, to guide evolution and next steps to follow in software development, logistics support, equipment, etc. It becomes the main tool to control the progress of every development and, at the same time, helps to identify new needs and improve functionality and coordination.
References
[1] F. Rull et al., “The Raman Laser Spectrometer for the ExoMars Rover Mission to Mars”, Astrobiology, Vol. 17, Num. 6 and 7, 2017.
[2] L. Seoane et al., “Operation design based on short-term response for the RLS instrument, on board the ExoMars 2022 Rover”, SpaceOps 2021.
[3] J. Zafra et al., “RASTA (RLS Archive and Supporting Tools for Analysis), a supporting tool to manage planetary mission archives.” EPSC 2020.
How to cite: Seoane, L., Moral, A., Pérez, C., Zafra, J., Ibarmia, S., López-Reyes, G., Gutiérrez, D., García-Alonso, M., Sentana, E., Rull, F., and Prieto-Ballesteros, O.: Roadmap to instrument Operation readiness. Lessons learned from the RLS Instrument on board the ExoMars Rover, Europlanet Science Congress 2022, Granada, Spain, 18–23 Sep 2022, EPSC2022-1012, https://doi.org/10.5194/epsc2022-1012, 2022.
Introduction:
The ESA ExoMars rover mission mainly focuses on the search for potential life-relevant molecules (large, non-volatile organic or biological molecules that suggest current or ancient prebiotic activity) at the Mars surface and near-subsurface. The Mars Organic Molecule Analyzer (MOMA) aboard the Rosalind Franklin rover will be a key analytical tool to provide chemical (molecular) information from solid samples collected by the rover. The characterization of the organic content in the sample is the main purpose of the instrument. The MOMA instrument comprises a gas chromatograph coupled to a mass spectrometer (GC-MS) which offers the unique capability to analyze and identify a wide range of organic molecules, including species of interest for life and prebiotic chemistry. Here we present an evaluation of the performance of the instrument from the analysis of a full set of samples of interest for Mars, using the Engineering Test Unit of the GC and MS instruments.
Method:
The samples delivered to MOMA will be analyzed either by UV laser desorption/ionization ion trap mass spectrometry (LDI-ITMS) or pyrolysis gas chromatography ion trap mass spectrometry (pyr-GC-ITMS). Samples containing organic compounds previously detected by LDI-ITMS and/or pyr-GC-ITMS can undergo further analysis through reaction with chemical derivatization reagents before characterization. These reagents (MTBSTFA, DMF-DMA, or TMAH), stored inside sealed capsules, induce a chemical reaction with the sample (in particular with its organic compounds) enhancing the volatility of complex organic species. Due to the need to prevent organic contamination of the Flight Model (FM) and Spare Model (SM) of MOMA, it was not possible to perform extensive analytical tests on them. For that reason, a series of tests were performed by coupling the GC and the MS Engineering Test Units (ETU) which are very close replica of the FM on board the Exomars rover.
The ETU GC (developed in France by LISA and LATMOS laboratories) was mated to the ETU ion trap mass spectrometer (developed in the USA by Goddard Space Flight Center) in a flight-like configuration (Fig. 1) for the coupling campaign. The MOMA GC ETU includes a tank filled with the carrier gas (helium), four separate analytical modules including columns and thermal conductivity detectors (TCDs) and two thermal injection traps. A homemade oven designed and built at LISA is used to mimic MOMA FM ovens. During the pyrolysis of the sample or after its chemical derivatization with one of the three reagents, the volatile compounds are injected and pre-concentrated in one of the traps. The trap is then flash-heated with a backflush carrier gas flow to release the trapped chemical species as quickly as possible into one of the GC columns. The GC column separates the different molecules. They are then ionized by the electron impact ionization source in the MS chamber and analyzed by the linear ion trap mass spectrometer. During the ETU campaign, the derivatization reagents (MTBSTFA, DMF-DMA, and TMAH) are added inside the oven by a syringe mimicking the release of reagent from the MOMA capsules.
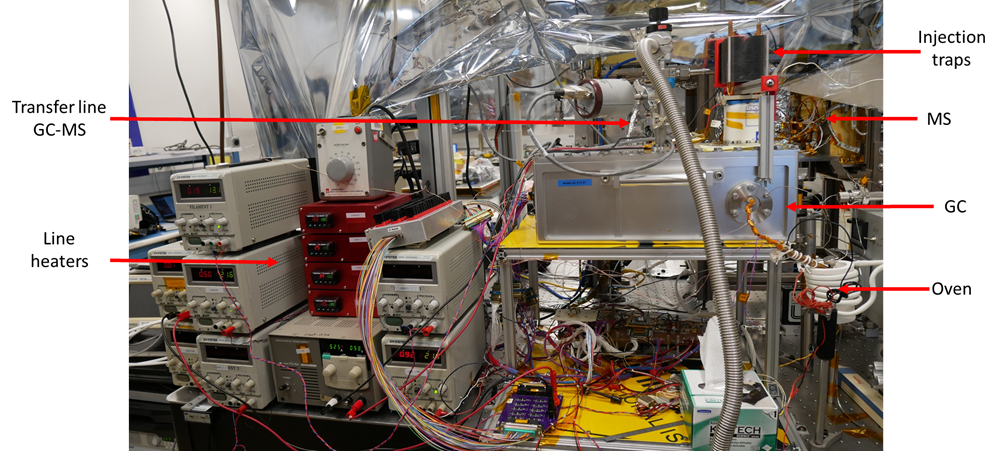
Figure 1: picture of the ETU gas chromatograph and the ETU MS ion trap.
Samples:
Several samples were studied during this campaign. Standard samples (standard gases, amino acids, carboxylic acids) were used to obtain the reference data. Then organic carbon-bearing natural and synthetic (mixing organic molecules and inorganic phases) Mars analog samples were analyzed, using both pyrolysis and derivatization as used in the MOMA instrument. These samples included JSC Mars-1, fragments of Murchison meteorite and synthetic samples composed of an organic-free mineral (vermiculite) doped with phenylalanine, phthalic acid and undecanoic acid. Also a synthetic “unknown” sample was used to run a blind analysis and to test the capability to identify a range of organic species under more realistic analytical conditions. This sample was used to simulate a day in the life of the instrument.
Results and conclusion:
The results described show the current state of end-to-end performance of the gas chromatography-mass spectrometry mode of operation. We show that from a technical point of view, the MOMA instrument works as expected. From a chemical perspective, we have shown that the four different types of MOMA analyses conducted here (pyrolysis and MTBSTFA, DMF-DMA, or TMAH derivatization) are efficient. Specific molecules have been detected (as expected) when using chemical standards. Analysis of the natural and synthetic samples reveals that a large number of molecules are released, and many species have been positively detected and identified (Fig. 2).
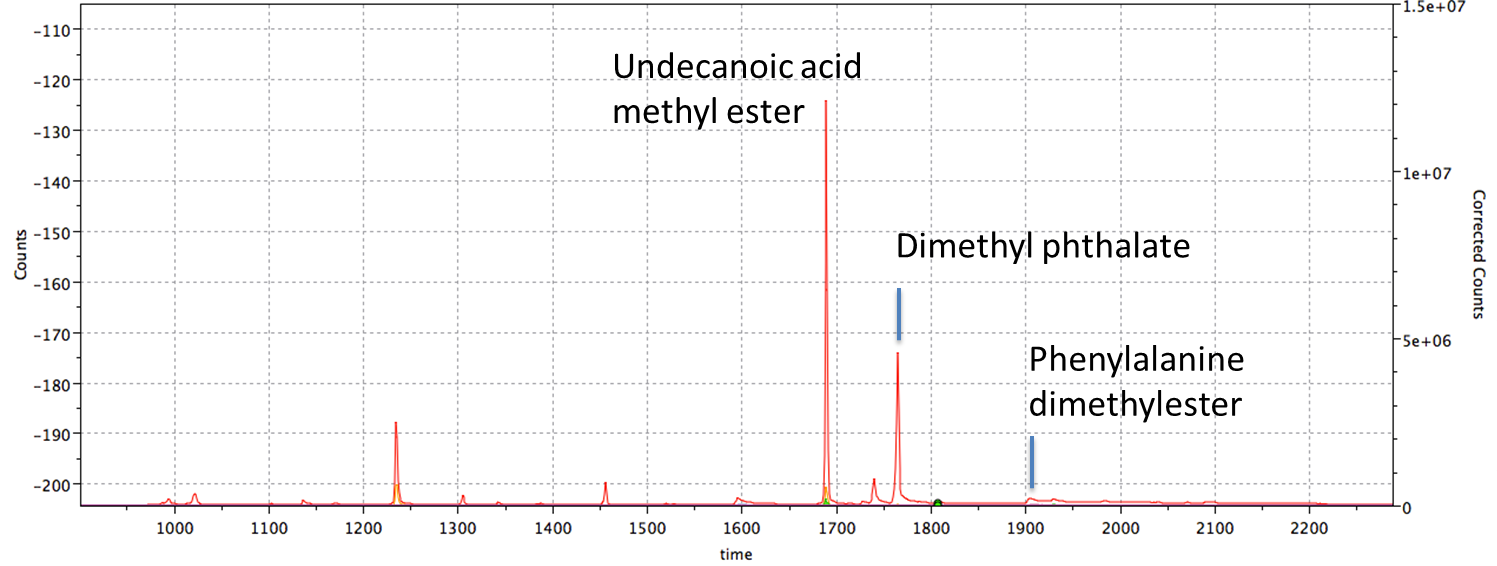
Figure 2 : Total ion chromatogram (TIC) for vermiculite doped with phenylalanine, phthalic acid and undecanoic acid after online DMF-DMA derivatization.
How to cite: Azémard, C., Stalport, F., Kaplan, D., Danell, R., Szopa, C., Buch, A., Chaouche, N., Freissinet, C., van Amerom, F., Grand, N., Zapf, P., Raulin, F., Guzman, M., Fornaro, T., Li, X., Grubisic, A., Siljeström, S., Cottin, H., Brinckerhoff, W. B., and Goesmann, F.: Analytical capabilities of the MOMA GC-MS instrument of the Exomars mission assessed from the analysis of a variety of samples with the Engineering Test Units (ETU), Europlanet Science Congress 2022, Granada, Spain, 18–23 Sep 2022, EPSC2022-1008, https://doi.org/10.5194/epsc2022-1008, 2022.
The availability of thermal vacuum chambers (TVC) represents a need in today´s planetary research. A TVC must be capable of operate under representative conditions (temperature, gas composition, pressure, radiation flux …) of space exploration targets, but also have an useful volume compatible with the performing experiments and the testing of equipment under mimicked scenarios.
Stand-off spectroscopies and imaging techniques have gained a proper niche within the modern tools in remote compositional analysis for space exporation using rovers. Laser-induced breakdown spectroscopy (LIBS), Raman spectroscopy, time-resolved laser-induced fluorescence (LIF) and laser-induced shockwave acoustics are tools currently installed and used at the Perseverance rover in the seek of understanding of mineralogy and geochemistry of Mars as they obtain real-time information at distances up to 12 meters. The convenience of a TVC capable of performing stand-off spectroscopies under the current analysis range is evident as it allows reproducing the results obtained in the rovers, gaining insights about data treatment and data modelling, and also anticipating experiments on Earth before being commanded.
This abstract details the TVC designed and installed at UMALASERLAB to serve the astrochemical community. With a length of 12 meters and an useful internal diameter of 1.6 meters, the chamber operates in a temperature range between 200 K - 400 K and can be oil-free pumped down from atmospheric pressure to 10-4 mbar in the current configuration. Additional upgrades may extend the pressure range up to the 10-6 mbar range. Such figures and dimensions turns the TVC of UMALASERLAB a powerful and versatile tool for space-related studies in chemistry, biology and engineering.
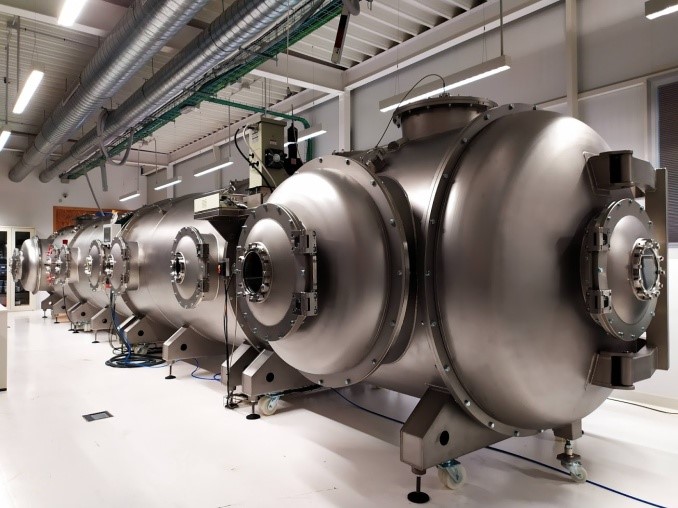
Fig. 1. Panoramic view of the simulation chamber at UMALASERLAB facilities.
The TVC at UMALASERLAB (Figure. 1) is an stainless-steel cylinder of ca. 22 m3 made of four independent on-wheels units. The external cylinder-shaped vessel is made in 304L stainless steel. All the internal surfaces are electropolished. The vacuum vessel ensures an overall leak range < 1x10⁻⁶ mbar.l/s. Such value is exclusively limited by the VitonTM O-rings connecting the four units of the cylinder as well as the all the different flanges of the 50 auxiliary ISO-K and ISO-KF ports.
The interior of the chamber is manned accessed by two hinged-doors at the ends of the chamber with a diameter of 1,6 meters, as well as by two lateral hinged-doors with a 1 meter diameter. The four doors are equipped with large hinged DN 500 ISO-K flange that included a DN 250 ISO K inspection windows.
The chamber thermal jacket is made of two thin TIG welded stainless steel 304 L sheets according to a “spot-grid” figure. An air-blowing pressurization applied after the welding, causes a controlled blistering creating a set of channels for the cooling fluid, that covers the entire surface of the heat exchanger ensuring very good temperature uniformity, savings of raw materials, greater efficiency in heat transfer and lower thermal inertia. The temperature changing rate of the chamber is 1 ºC/min.
The internal surface of the shroud is black-painted with a special enamel to improve the thermal emission of the surface itself and maximizing light absorption (> 95 % at any angle) to reduce flares os ghost effects in the recorded spectra. The painting exhibit a degassing rate < 10-6 mbar.-l/s.
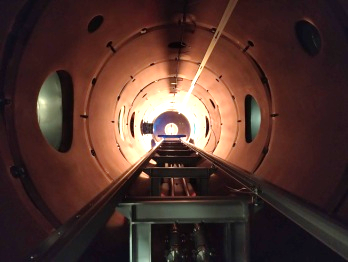


Fig. 2. (Top) Detail of the rails crossing the entire length of the chamber. (Middle and bottom) Details of the two lateral ports of the chamber allowing the loading of an optical table for laser spectroscopy experiments on one side (middle) and the loading of an anechoic chamber on the other end (middle).
Two stainless steel rails placed along the major axis of the cylinder allows the displacement of three grid patterned threaded plates fixation along the interior of the chamber (Figure 2, top). A second set or telescopic rails allow the plates to get out of the chamber for loading and handling (Figure 2, middle and bottom). The plates are placed directly on rails supported by the vessel, in order to avoid any mechanical stress on the shroud. In the loading position outside the chamber, the plates allow a maximum weight of 70 kilograms. For experiments demanding deep UV illumination, a fiber-optic connected to a high-power Xe lamp provides illumination conditions similar to those at Mars surface in the UV-A, UV-B and UV-C spectral regions over an area of 1 cm2.
A graphic user interface allows local and remote visualization, control and data logging of the vacuum pumps, the cooling/heating system, the pressure gauges, the thermocouple gauges, and the mass flow controllers for gas mix load in the chamber.
Different Mars-geochemistry related experiments are being conducted in the TVC with the aim of finding different ways to infere as much information as possible from the different stand-off techniques available. In particular, data fusion algorythms combining Raman, LIBS and the associated acoustic signals have been succesfully implemented for the categorization of soils, rocks and mineral phases of interest in Mars exploration.
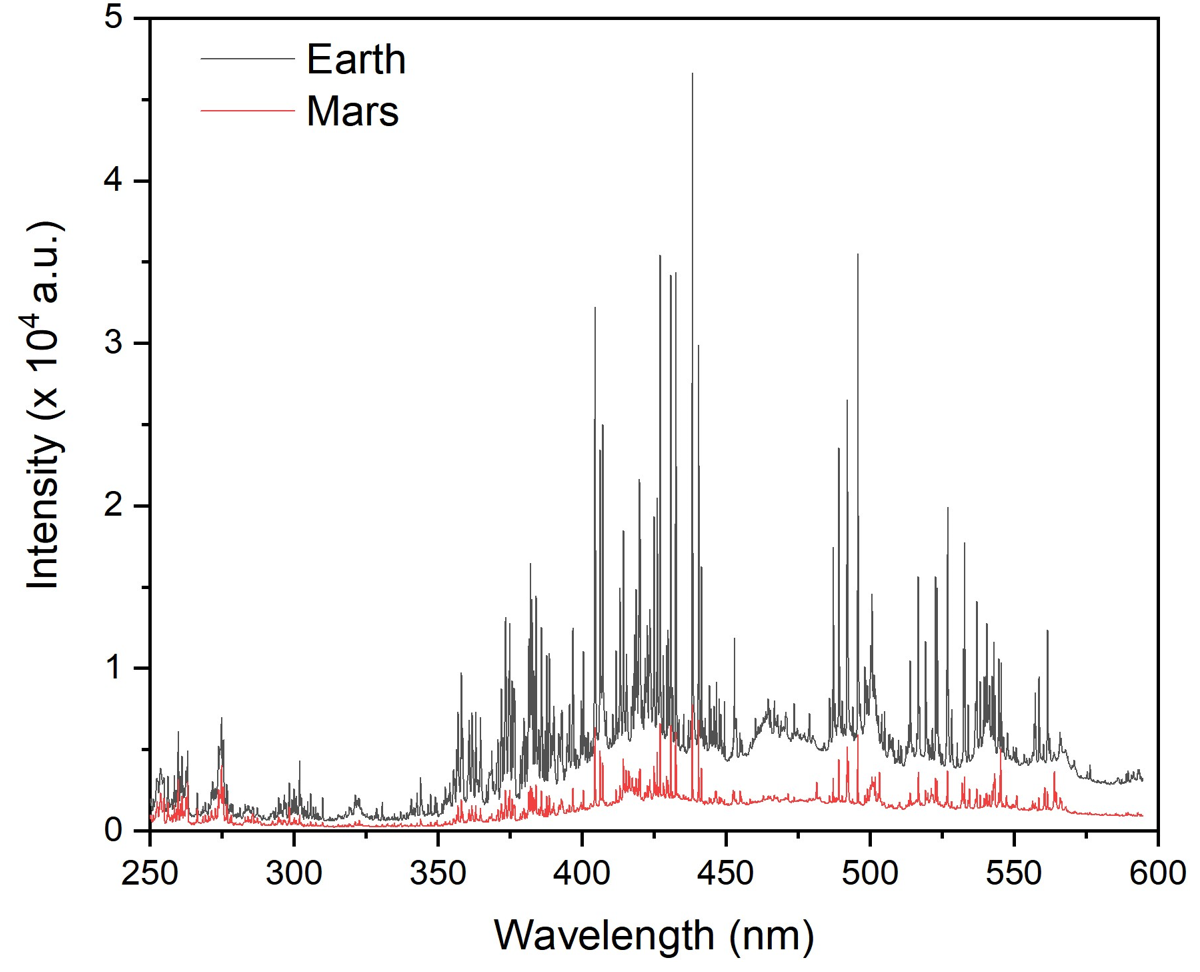
Fig. 3. Stand-off LIBS spectra of pyrite sample placed 12 meters away the laser head under standard Earth conditions (black line) and Mars-like atmospheric conditions.
As a performance test, Figure 3 shows two LIBS spectra taken under Earth and Mars-like conditions of a pyrite. The commercial laser (l: 1064 nm) and spectrometer were external to the chamber due to non-compatibiity of the electronics with the temperature. The rest of the elements were placed inside the chamber. The sample was placed inside the TVC 12 meters away the laser head under standard standard pressure, gas composition and temperature Earth conditions (black line) while the red line represents the same sample analyzed under Mars-like atmospheric conditions (10 mbar CO2, -10 ºC). In both examples, 100 accumulated shots were averaged. At a set laser energy of 40 mJ/pulse, the spot diameter was 500 microns.
How to cite: Álvarez-Llamas, C., Purohit, P., Moros, J., Lucena, P., Vadillo, J.-M., and Laserna, J.: A multipurpose thermal vacuum chamber for planetary research compatible with stand-off laser spectroscopies, Europlanet Science Congress 2022, Granada, Spain, 18–23 Sep 2022, EPSC2022-1234, https://doi.org/10.5194/epsc2022-1234, 2022.
The scientific objectives of Mars Express (MEX) and ExoMars 2016 Trace Gas Orbiter (TGO) missions are very complementary, with increasing synergies among the science teams, in particular for the study of the atmosphere. In this contribution we summarize the coordination efforts to perform joint observations by the two European satellites around Mars until 2022, and the science opportunities for the expected mission extension until 2025.
Since the start of the TGO science operations in April 2018 we have executed hundreds of coordinated observations of the Martian atmosphere, first reported in [1,2] and extended here to 2022. The science data obtained during these coordinated observations provide useful input for cross-calibration of the instruments, comparison of atmospheric vertical profiles, and potential for the study of the temperature, composition, meteorology and climate of Mars.
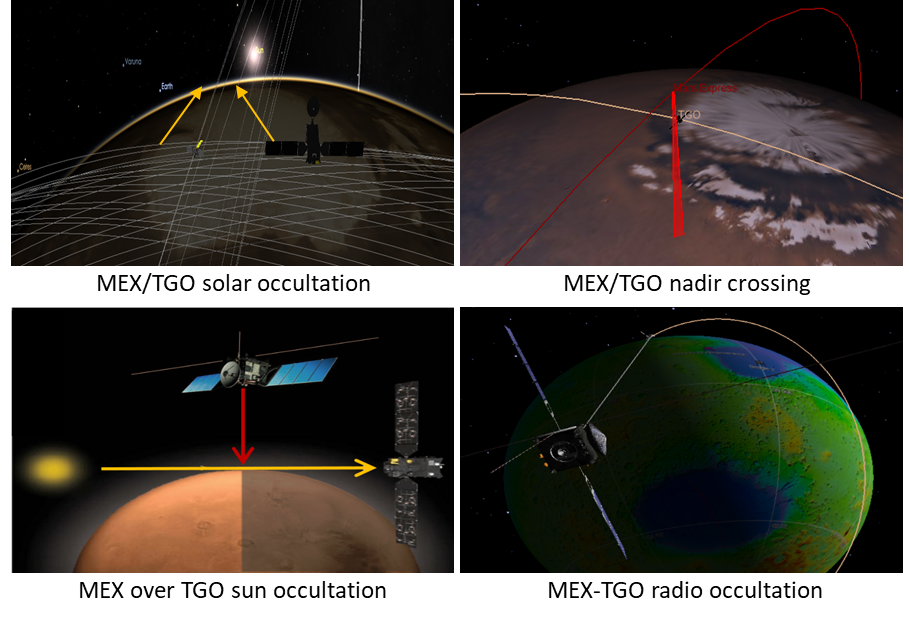
Figure 1: Types of coordinated observations performed: MEX-TGO Sun Occultations (within 15min and distance <1000km), MEX-TGO Nadir crossings (simultaneous, within <5deg seen from Mars center), MEX Nadir over TGO Sun Occultation point (simultaneous within distance <500km), and MEX-TGO Radio Occ. points (tested in 2021 and run operationally in 2022 onwards)
These observations are routinely coordinated in collaboration between the Science Operations Centers (SOCs) of both missions [1, 3] and the instrument teams, in particular the spectrometers NOMAD and ACS onboard TGO [4,5] and SPICAM, OMEGA and PFS onboard MEX [6,7,8].
The various types of joint observations are represented in Figure 1. First the joint solar occultations by the spectrometers SPICAM (MEX) and ACS-NOMAD (TGO) are performed quasi-simultaneously (<15minutes difference), allowing the comparison of vertical profiles of the atmosphere in the same region (<1000km distance) both at the ingress and egress points (i.e. dusk and/or dawn terminator). Then, all spectrometers observe regularly in nadir geometry and we have so far performed hundreds of simultaneous observations of the crossing points (within ~350km, or <5deg as seen from Mars) and quasi-simultaneous observations of the same location within a few minutes difference, at various distances and illumination conditions. Then with MEX we are also observing nadir in the region of the TGO solar occultation, so vertical atmospheric profiles can be complemented with wider contextual imaging and/or temperature retrievals. Finally, in 2021 we have validated the spacecraft-to-spacecraft radio occultations [9], and started routine observations in 2022 to provide useful information of the ionosphere.
The authors acknowledge the contributions of the European Space Agency, Roscomos, all National Agencies, research institutions and teams involved in the success of the Mars Express and ExoMars 2016 missions. ExoMars is a space mission of the European Space Agency (ESA) and Roscosmos (Russia).
References:
[1] Cardesin Moinelo, A. et al: First year of coordinated science observations by Mars Express and ExoMars 2016 Trace Gas Orbiter, ICARUS 353, 2021
[2] Cardesin Moinelo, A. et al: Atmospheric observations performed simultaneously in 2020-2021 by ESA’s Mars Express and Trace Gas Orbiter, European Planetary Science Congress, Vol. 15, EPSC2021-128, 2021
[3] Geiger, B et al: Long Term Planning for the ExoMars Trace Gas Orbiter Mission: Opportunity Analysis and Observation Scheduling, Proceedings of SpaceOps Conference, 2018
[4] Vandaele, A. C. et al: NOMAD, an Integrated Suite of Three Spectrometers for the ExoMars Trace Gas Mission: Technical Description, Science Objectives and Expected Performance, Space Sci Rev 214: 80. 2018
[5] Korablev, O. et al: The Atmospheric Chemistry Suite (ACS) of Three Spectrometers for the ExoMars 2016 Trace Gas Orbiter Space Sci Rev 214: 7. 2018
[6] Montmessin et al, SPICAM on Mars Express: A 10 year in-depth survey of the Martian atmosphere. Icarus, Volume 297, p. 195-216. 2017
[7] Bibring, J.-P., et al., OMEGA: Observatoire pour la Minéralogie, l’Eau, les Glaces et l’Activité, ESA SP-1240, pp. 3–16. 2004
[8] Formisano V. et al: The Planetary Fourier Spectrometer (PFS) onboard the European Mars Express mission, Planetary and Space Science, Volume 53, Issue 10, p. 963-974. 2005
[9] Svedhem H. et al: First results from the MEX – TGO Mutual Radio Occultation Experiment, European Planetary Science Congress, Vol. 15, Vol. 15, EPSC2021-719, 2021
How to cite: Cardesin-Moinelo, A., Geiger, B., Lacombe, G., Ristic, B., Wolkenberg, P., Svedhem, H., Wilson, C., Titov, D., Martin, P., Muñiz, C., Marin-Yaseli, J., Merritt, D., Sierra, M., Esquej, P., and Ashman, M.: Coordination of Mars Express and Trace Gas Orbiter joint observations of the Martian atmosphere in 2021-2022, Europlanet Science Congress 2022, Granada, Spain, 18–23 Sep 2022, EPSC2022-136, https://doi.org/10.5194/epsc2022-136, 2022.
Introduction: CO is one of the important trace gas species in the Martian atmosphere which is linked to the Martian photochemistry through its production in the upper atmosphere in the photolysis of CO2 and its destruction in the lower altitudes in a chemical reaction with OH radicals. Thus it can be used as a proxy to study the HOx chemistry. CO is also one of the long-lived species in the atmosphere and its global distribution is controlled by the atmospheric dynamics. The observations made by the Solar Occultation (SO) spectrometer onboard TGO ExoMars space-craft presents with opportunity for systematic mapping of CO density profiles in the atmosphere for the first time.
Retrieval Methodology: SO is one of the spectrometers in the NOMAD suite onboard Exo Mars Trace Gas Orbiter designed for the observations of the trace species active in the spectral range 2.3 – 4.3 μm [2]. The spectrometer is built using diffraction grating in Littrow configuration. It uses Acousto Optical Tunable Filter (AOTF) to select one wavelength range corresponding to a single diffraction order. The selected order passes through a set of parabolic mirrors before getting incident on the grating. The diffracted light is then guided through the same mirrors to the detector of the spectrometer. The spectrometer is operated usually to record diffraction orders from 110 to 191, but in regular operations, up to six different diffraction orders can be selected. In this wide range of diffraction orders, CO sounding is suitable only in the diffraction orders 186 – 191 where the CO absorption lines are strong and well separated from each other.
The diffraction orders 186 – 191, however, are not measured simultaneously. Orders 186, 189, and 190 are the most commonly used so far, and therefore, a better geographical coverage was obtained from them compared to the other orders. Our aim is to obtain a similar retrieval performance for these orders using the state-of-the art retrieval method developed at IAA/CSIC. The transmission spectra for every order suffer from residual calibration effects like spectral shift and bending which are corrected using a cleaning methodology described in [3,4]. We use line-by-line radiative transfer model KOPRA (Karlsruhe Optimized and Precise Radiative transfer Algorithm)[5] as a forward model, which was adapted for Mars and to the NOMAD instrument characteristics, in conjunction with an interactive solver (RCP) to retrieve CO from the cleaned spectra [6]. This follows a similar work for the diffraction order 190 and is applied to the first year of TGO observation [1].
Acknowledgement: The IAA/CSIC team acknowledges financial support from the State Agency for Research of the Spanish MCIU through the ‘Center of Excellence Severo Ochoa’ award for the Instituto de Astrofísica de Andalucía (SEV-2017-0709). MALV was funded by grant PGC2018-101836-B-100 (MCIU/AEI/FEDER, EU). ExoMars is a space mission of the European Space Agency (ESA) and Roscosmos. The NOMAD experiment is led by the Royal Belgian Institute for Space Aeronomy (IASB-BIRA), assisted by Co-PI teams from Spain (IAA-CSIC), Italy (INAF-IAPS), and the United Kingdom (Open University). US investigators were supported by the National Aeronautics and Space Administration.
References
[1]A. Modak, et al. Retrieval of martian atmospheric CO vertical profiles from the first year of NOMAD/TGO solar occultation observations. JGR-submitted , 2022.
[2]A. C. Vandaele, et al. NOMAD, an integrated suite of three spectrometers for the exoMars trace gas mission: Technical description, science objectives and expected performance. Space Science Reviews , 214(5):1–47, 2018.
[3]M.-A. López-Valverde, et al, Martian atmospheric temperature and density profiles during the 1st year of NOMAD/TGO solar occultation measurements. JGR-submitted , 2022.
[4]A. Brines, et al. Water vapor vertical distribution on Mars during the perihelion season of MY34 and MY35 from ExoMars TGO/NOMAD solar occultation measurements. JGR-submitted, 2022.
[5]Stiller, G. P. The Karlsruhe Optimized and Precise Radiative transfer Algorithm (KOPRA), 2000.
[6]Á. A. Jurado Navarro et al. Retrieval of CO2 and collisional parameters from the mipas spectra in the earth atmosphere. 2016.
How to cite: Modak, A., Lopez-Valverde, M.-A., Brines, A., Stolzenbach, A., Funke, B., Gonzalez-Galindo, F., Lopez-Moreno, J.-J., Aoki, S., Villanueva, G., Liuzzi, G., Bellucci, G., Yoshida, N., Erwin, J., Trompet, L., Thomas, I., Daerden, F., Ristic, B., Patel, M., Vandaele, A. C., and Montmessin, F.: Mapping of Martian CO from NOMAD solar occultation measurements for MY35 and 36, Europlanet Science Congress 2022, Granada, Spain, 18–23 Sep 2022, EPSC2022-853, https://doi.org/10.5194/epsc2022-853, 2022.
An upward transport of water via the Hadley cell has been suggested as one of the mechanisms to transport water vapor to the upper atmosphere [Shaposhnikov et al., 2019], which would enhance the hydrogen escape on Mars [cf. Chaffin et al., 2017]. Carbon monoxide is one of the tracers which can measure the dynamics in the Martian atmosphere because CO distribution is a combination of photochemistry and dynamics. Above ~60 km altitude, the CO mixing ratio increases with altitude due to the production from photodissociation of CO2 and is further enhanced around the polar regions because of downwelling from the thermosphere [Daerden et al., 2019; Holmes et al., 2019; Olsen et al., 2021; Yoshida et al., accepted]. In the lower atmosphere, CO is recycled to CO2 by the catalytic cycle by odd hydrogen. The photochemical lifetime of CO is too slow, and then its lifetime is ~6 years in the lower atmosphere [Krasnopolsky, 2007]. Thus, seasonal variation of CO in the lower atmosphere is a consequence of CO2 sublimation/condensation at the polar cap [Encrenaz et al., 2006; Smith et al., 2009, 2021]. In addition, transport of rich CO atmosphere from southern to northern hemispheres during Ls = 90 – 180 has been measured by Smith et al. (2008, 2018) as predicted due to the breaking of the polar vortex by the GCM model. Although the vertical distribution of CO VMR is an index to determine the condensation of CO2, photochemistry, and dynamics, there is no direct comparison between measurements and simulations because we did not obtain the CO vertical distribution before the Trace Gas Orbiter (TGO) ExoMars mission. To clarify the vertical and horizontal transport of CO in the Martian atmosphere, we investigate the CO VMR retrieved from the solar occultation (SO) channel of Nadir and Occultation for MArs Discovery (NOMAD) instrument aboard TGO [Vandaele et al., 2018].
The SO channel operates at wavenumbers from 2325.6 to 4347.8 cm-1 with relatively high spectral resolution (R = 17,000). CO (2-0) band spectra features between 3970.7 and 4360.1 cm-1 are measured regularly in orders 186 to 191 of the instrument. We retrieved CO number densities using CO spectra features in orders 186 to 191 and radiative transfer code, ASIMUT [Vandaete et al., 2006], based on the Optimal Estimation Method [Rogers, 2006]. ASIMUT was performed for each spectrum at each tangential altitude independently [e.g., Aoki et al., 2019]. The latest updated instrument calibrations [Villanueva et al., submitted; Thomas et al., 2022] have been applied. We used the GEM-Mars model temperature and CO2 profiles [Neary et al., 2018; Daerden et al., 2019] to derive the CO VMR. The CO spectra were investigated from April 2018 to September 2021, corresponding from MY 34 Ls ~ 150 to MY 36 Ls ~ 105. The total number of dataset is 31,000.
Firstly, we found that the retrieved CO VMR in orders 187 to 191 does not correspond to that in order 186 below ~60 km altitude. The CO VMR derived from orders 187 to 191 is underestimated. The strongest 2-0 band of CO is located at 4288.3cm-1, which corresponds to order 190, and it saturates around ~60 km. The saturation of CO lines would be related to the underestimation of CO VMR. When we tested the retrieval sensitivity of saturated lines in order 186, the underestimation of CO VMR also appears below 40 km altitude in the case that we perform the ASIMUT using the entire wavenumber range of order 186 (4179.0 – 4212.2 cm-1) compared with using a partial wavenumber range, 4189.0 – 4198.0 cm-1, of order 186. To avoid the underestimation of CO VMR, the retrieved CO VMR derived from CO spectra in the orders 187 – 191 is limited between 60 and ~110 km altitude, that from CO spectra in order 186 is limited between 40 and ~110 km, and that from CO spectra in 4189.0 – 4198.0 cm-1 is limited between the near-surface to 40 km altitude.
The retrieved CO VMR distributes from 300 to ~5000 ppm. In the polar regions, the CO VMR increases above ~40 km and reaches 4000 ppm at 70 km, which is attributed to the production of CO from photodissociation of CO2 and transport of CO-enriched air via meridional circulation [Daerden et al., 2019]. That is consistent with the results measured by the Atmospheric Chemistry Suite aboard TGO [Olsen et al., 2021]. In the lower atmosphere, the enriched CO VMR up to ~3500 ppm appears from 90 to 200 in Ls in the southern hemisphere, which would be attributed to the CO2 condense in the southern winter season. We will report the CO distribution in more detail while distinguishing the dataset into season and latitude along with altitude.
How to cite: Yoshida, N., Aoki, S., Vandaele, A. C., Nakagawa, H., Thomas, I., Erwin, J., Daerden, F., Trompet, L., Murata, I., Terada, N., Neary, L., Lopez-Valverde, M., Modak, A., Villanueva, G., Liuzzi, G., Kasaba, Y., Patel, M., Ristic, B., Bellucci, G., and López-Moreno, J. J.: CO distributions retrieved from TGO NOMAD SO using multiple orders, Europlanet Science Congress 2022, Granada, Spain, 18–23 Sep 2022, EPSC2022-753, https://doi.org/10.5194/epsc2022-753, 2022.
The Martian mesosphere, and in particular the upper mesosphere, above about 80 km from the surface, remains poorly explored in comparison with the troposphere and the thermosphere/ionosphere. Observations by the NOMAD and ACS instruments on board the ExoMars Trace Gas Orbiter mission (TGO in what follows) are starting to fill this gap by providing measurements such as the abundance of mesospheric water and the effects of global dust storms (Vandaele et al., 2019; Belyaev et al., 2021; Brines et al., 2022), the CO variability (Modak et al., 2022) or the temperature and density structure (López-Valverde et al., 2022). For the first time we have a set of diverse atmospheric parameters derived simultaneously with good vertical resolution and from a single instrument, which is ideal for model validation purposes.
In this work, we will compare the predictions of the LMD-Mars GCM (LMD-MGCM) in the mesosphere with the NOMAD results (abundances of CO2, CO, and H2O, as well as temperature) obtained by the retrieval scheme developed at the Instituto de Astrofisica de Andalucia-CSIC (IAA), in order to validate the model and to gain insight into the physical processes at the origin of the observed structures. In particular, we will focus on the comparison of the CO2 density and temperature structure observed below ~120 km (López-Valverde et al., 2022) during the second half of Mars Year 34, a period including the MY34 global dust storm. We will show that the model reproduces well the strong seasonal variations of the CO2 density observed by NOMAD. However, the model tends to overestimate the temperatures above ~50 km.
Acknowledgments
F.G-G. is funded by the Spanish Ministerio de Ciencia, Innovación y Universidades, the Agencia Estatal de Investigación and EC FEDER funds under project RTI2018-100920-J-I00. MALV, AB, AM, and AS were supported by grant PGC2018-101836-B-100 (MCIU/AEI/FEDER, EU). The IAA team acknowledges financial support from the State Agency for Research of the Spanish MCIU through the “Center of Excellence Severo Ochoa" award to the Instituto de Astrofísica de Andalucía (SEV-2017-0709)
How to cite: González-Galindo, F., López-Valverde, M. Á., Brines, A., Modak, A., Stolzenbach, A., Funke, B., López-Moreno, J. J., Forget, F., Millour, E., Lefèvre, F., Vals, M., Montmessin, F., Patel, M., Bellucci, G., and Vandaele, A.-C.: Characterization of the Martian mesosphere with NOMAD/TGO observations and a Global Climate Model, Europlanet Science Congress 2022, Granada, Spain, 18–23 Sep 2022, EPSC2022-701, https://doi.org/10.5194/epsc2022-701, 2022.
NOMAD [1] is regularly scanning the atmosphere of Mars from the troposphere to the upper thermosphere since the beginning of the science operations of the Trace Gas Orbiter on April 21, 2018. This work focus on retrievals of CO2 density and temperature in the mesosphere and the thermosphere which are both regions of high interest. The latter is the region where atmospheric escape occurs while the mesosphere is the place of many atmospheric phenomena such as gravity waves, large amplitudes tides, temperature inversion and sometimes temperature lower than the limit for CO2 condensation. Those atmospheric phenomena can be constrained by the atmospheric temperature.
The NOMAD-SO channel (SO in the following) is dedicated to solar occultation measurements and thus probes the Martian terminator. SO is an infrared spectrometer (2.3-4.3 µm) composed of an echelle grating with an acousto-optical tunable filter for the selection of the diffraction orders (hereafter simply called orders).
This work combines the datasets from two orders: 148 and 165 convenient to probe, respectively, Mars mesosphere and thermosphere. We derived 2400 profiles for order 165 in Martian years (MYs) 34 to 36 spanning altitudes between 140 and 180 km as well as 1200 profiles for order 148 in MY 35 and 36 spanning an altitude range between 60 and 100 km. The higher bounds of the profiles are set when the lines are enough thick to retrieve density values that are at least six times higher than the noise. The lower bounds are due to saturation of the lines, i.e. when the absorption lines are so thick that their curves of growth are no more a linear function of the CO2 density.
The retrievals are performed with the ASIMUT radiative transfer code [2] and the profiles are regularized with a Tikhonov method [3]. The regularization is further fine-tuned with the expected error estimation [4]. The temperature profiles are derived from the CO2 density profiles with the hydrostatic equilibrium equation and the ideal gas law. The uncertainties are on average 10 K and 2 K at, respectively, the top and bottom of the profiles. The vertical resolution of the profiles is around 2.5 km.
Twenty percent of the profiles in the mesosphere contain a strong warm layer, i.e. temperature values that are 20 K higher than the background temperature. The warm layer is present at dawn in both hemispheres as well as at dusk in the Northern hemisphere but it is absent at dusk in the Southern atmosphere. In the mesospheric dataset, we also report the presence of six temperature profiles containing temperatures lower than the temperature limit for CO2 condensation.
Analyzing the longitudinal variations of temperature for some profiles with very close solar longitude, local solar time and latitude around 60°, we found remaining wavenumber-1 and wavenumber-3 components with respectively 10% and 5% of the background temperature.
The retrieved values in the mesosphere are compared with data from the GEM-Mars general circulation model [5, 6] simulated for NOMAD-SO occultations. The comparisons are in good agreement except in the Southern hemisphere before aphelion where the temperature minimum is lower in SO data. The Northern hemisphere after perihelion have also different values where the warm layers are more important in SO data. Comparisons are ongoing with measurements from other instruments such as MAVEN-EUVM [7] for the thermosphere and MRO-MCS [8] for the mesosphere. The comparisons are in good agreement considering the differences in geometry and time.
The NOMAD-SO dataset of the thermosphere contains profiles from April 21, 2018, a bit before the global dust storm (GDS) that encircled Mars until the end of June 2018. Compared to MY 35 and 36, we notice a clear increase in the density in the thermosphere starting at Ls 185°. A comparison between the temperatures in the mesosphere and the thermosphere will be presented, we see a higher temperature at dusk than at dawn in the thermosphere and no specific trend in the mesosphere. In the thermosphere at dusk, the temperature is higher at the equator than at the poles, with the opposite at dawn. In the mesosphere, the temperature values are lower at the equator than at the poles. In conclusion, the temperature variations in the mesosphere and thermosphere at the terminator have similar seasonal trends but different diurnal and latitudinal trends.
References : [1] Vandaele et al., (2015), PSS ; [2] Vandaele et al., (2008), JGR (Planets) ; [3] Quémerais et al., (2006), JGR (Planets) ; [4] Xu et al., (2016), JQSRT ; [5] Daerden et al. (2022), JGR (Planets) ; [6] Neary et al. (2020), GRL ; [7] Thiemann et al., (2018), JGR (Planets) ; [8] Kleinböhl et al., (2009) , JGR (Planets).
How to cite: Trompet, L., Vandaele, A. C., Thomas, I., Aoki, S., Daerden, F., Erwin, J., Flimon, Z., Neary, L., Mahieux, A., Robert, S., Villanueva, G., Liuzzi, G., Lopez-Valverde, M. A., Brines, A., Bellucci, G., Lopez-Moreno, J. J., and Patel, M.: Mesospheric and thermospheric carbon dioxide and temperature profiles from NOMAD-SO onboard TGO., Europlanet Science Congress 2022, Granada, Spain, 18–23 Sep 2022, EPSC2022-1013, https://doi.org/10.5194/epsc2022-1013, 2022.
The Nadir and Occultation for MArs Discovery (NOMAD, Neefs et al., 2015) instrument suite on board the Exomars Trace Gas Orbiter (TGO) spacecraft is capable to observe the Martian atmosphere at high spectral resolution with different observing modes. The data acquired in nadir observing geometry by the infrared Limb, Nadir and Occultation (LNO) channel of NOMAD are characterized by a signal to noise ratio (SNR) that is mostly limited by the instrument’s operative temperature, in turn impacting integration times.
In this study we apply to LNO nadir data the Minimum Noise Fraction (MNF) technique (Green et al., 1988; Lee et al., 1990; Boardman and Kruse, 1994), usually adopted to enhance the SNR of remotely sensed hyperspectral imaging datasets (e.g. Lee et al., 1990; Amato et al, 2009; Bjorgan and Randeberg, 2015; Luo et al., 2016). In practice, the MNF projects the original data in a space in which the noise component is minimized. Such a projection is achieved by means of two consecutive Principal Component (PC) transforms (see Jolliffe and Cadima, 2016, for a comprehensive review) providing eigenvalues for the data reconstruction that are ordered with increasing noise.
As first step of the analysis, we perform tests on ensembles of synthetic spectra in order to evaluate the theoretical performances of the technique in different frameworks of analysis. For example, we investigate the application of the MNF on spectral features characterized by different depth, width, correlation with other bands, and spatial dependencies, verifying that all these factors impact its effectiveness. Then, we evaluate the MNF performances on specific LNO spectral orders, in order to assess the SNR improvement for studies related to the Martian surface and aerosols/clouds (e.g. Oliva et al., 2022) and to trace gases.
A limiting factor in the SNR enhancement is the presence of systematic noise linked to spectral artifacts introduced by the MNF itself. In order to remove these artifacts, the number of transform eigenvalues, and hence the noise, needs to be increased in the reconstruction of the denoised observations. Nevertheless, as result from this preliminary analysis, we report an average SNR improvement of about 20% and reaching a maximum of 50%.
Acknowledgements
ExoMars is a space mission of the European Space Agency (ESA) and Roscosmos. The NOMAD experiment is led by the Royal Belgian Institute for Space Aeronomy (IASB-BIRA), assisted by Co-PI teams from Spain (IAA-CSIC), Italy (INAF-IAPS), and the United Kingdom (The Open University). This project acknowledges funding by the Belgian Science Policy Office (BELSPO), with the financial and contractual coordination by the ESA Prodex Office (PEA 4000103401, 4000121493), by Spanish Ministry of Science and Innovation (MCIU) and by European funds under grants PGC2018-101836-BI00 and ESP2017-87143-R (MINECO/FEDER), as well as by UK Space Agency through grants ST/V002295/1, ST/V005332/1 and ST/S00145X/1 and Italian Space Agency through grant 2018-2-HH.0. This work was supported by the Belgian Fonds de la Recherche Scientifique – FNRS under grant number 30442502 (ET_HOME). The IAA/CSIC team acknowledges financial support from the State Agency for Research of the Spanish MCIU through the ‘Center of Excellence Severo Ochoa’ award for the Instituto de Astrofísica de Andalucía (SEV-2017-0709). US investigators were supported by the National Aeronautics and Space Administration. Canadian investigators were supported by the Canadian Space Agency.
References
Amato, U., et al., 2009. IEEE Geosci. Remote Sens. Lett. 2009, 47, 153–160.
Bjorgan, A. and Randeberg, L.L., 2015. Sensors 2015, 15, 3362-3378.
Boardman, J.W. and Kruse, F.A., 1994. ERIM, Ed., Proc. 10th Thematic Conference on Geological Remote Sensing, San Antonio, 407-418.
Green, A.A., et al., 1988. IEEE Transactions on Geoscience and Remote Sensing, Vol. 26, No. 1, pp. 65–74.
Jolliffe, I.T., and Cadima, J., 2016. Phil. Trans. R. Soc. A, 374:20150202.20150202
Lee, J.B., Woodyatt, A.S. and Berman, M., 1990. IEEE Transactions on Geoscience and Remote Sensing, Vol. 28, No. 3, pp. 295–304.
Luo, G., et al., 2016. Canadian Journal of Remote Sensing, 42:2, 106-116.
Neefs, E., et al., 2015. Appl. Opt. 54, 8494–8520.
Oliva, F., et al., 2022. Journal of Geophysical Research: Planets, 127, e2021JE007083.
How to cite: Oliva, F., D'Aversa, E., Bellucci, G., Carrozzo, F. G., Ruiz Lozano, L., Karatekin, O., Daerden, F., Thomas, I., Ristic, B., Patel, M., Lopez-Moreno, J.-J., Vandaele, A. C., and Sindoni, G.: Minimum Noise Fraction analysis of ExoMars/TGO-NOMAD LNO channel nadir data: SNR enhancement and application, Europlanet Science Congress 2022, Granada, Spain, 18–23 Sep 2022, EPSC2022-561, https://doi.org/10.5194/epsc2022-561, 2022.
NOMAD is a three-channel spectrometer on the ExoMars 2016 Trace Gas Orbiter, which has been operating around Mars since April 2018 [1]. NOMAD contains two infrared channels: SO, which operates in solar occultation mode; and LNO, which operates primarily in nadir mode, but can also measure limbs, solar occultations, Phobos and Deimos.
In the past four years of science operations, SO has taken over 35 million solar occultation spectra, whilst LNO has taken 2.8 million nadir spectra of Mars. Recently, we have started observing Phobos and Deimos in the infrared, and work is currently ongoing to calibrate the spectra and the geometry [2] of the observations. Work is also ongoing to improve the radiometric calibration of LNO, using the latest data, and also to calibrate the Acousto-Optic Tuneable Filter (AOTF) and diffraction grating in the same manner as was done for SO [3,4]. We are investigating the removal of systematic noise and binning multiple spectra to improve the SNR of the SO channel, which will allow us to improve retrievals of temperature/pressure from CO2 [5,6], H2O [7,8], HDO [3] CO [9,10], HCl [11] and the detection limits of trace gases [12] in Mars’ atmosphere.
References
[1] Vandaele, Ann Carine, et al. "NOMAD, an integrated suite of three spectrometers for the ExoMars Trace Gas mission: technical description, science objectives and expected performance”. Space Sc. Rev. (2018): 214, 80, https://doi.org/10.1007/s11214-018-0517-2
[2] Thomas, Ian, et al. "Calibration of NOMAD on ESA's ExoMars Trace Gas Orbiter: Part 2–The Limb, Nadir and Occultation (LNO) channel." Planetary and Space Science (2021): 105410. https://doi.org/10.1016/j.pss.2021.105410
[3] Villanueva, Geronimo, et al. “The deuterium isotopic ratio of water released from the Martian caps as measured with TGO/NOMAD”, submitted to Geophysical Research Letters
[4] Thomas, Ian, et al. "Calibration of NOMAD on ESA's ExoMars Trace Gas Orbiter: Part 1–The Solar Occultation channel." Planetary and Space Science (2021): 105411. https://doi.org/10.1016/j.pss.2021.105411
[5] Trompet, Loic., et al. “Carbon dioxide retrievals from NOMAD-SO on ESA’s ExoMars Trace Gas Orbiter and temperature profiles retrievals with the hydrostatic equilibrium equation. II. Temperature variabilities in the mesosphere at Mars terminator.” Journal of Geophysical Research: Planets, Submitted.
[6] Lopez Valverde, Miguel, et al., “Martian atmospheric temperature and density profiles during the 1st year of NOMAD/TGO solar occultation measurements”. Journal of Geophysical Research: Planets, Submitted.
[7] Aoki, Shohei, et al., “Global vertical distribution of water vapor on Mars: Results from 3.5 years of ExoMars-TGO/NOMAD science operations”, Journal of Geophysical Research: Planets, Submitted.
[8] Brines, Adrian, et al., “Water vapor vertical distribution on Mars during perihelion season of MY34 and MY35 with ExoMars-TGO/NOMAD observations.” Journal of Geophysical Research: Planets, Submitted.
[9] Yoshida, Nao et al. "Variations in vertical CO/CO2 profiles in the Martian mesosphere and lower thermosphere measured by the ExoMars TGO/NOMAD: Implications of variations in eddy diffusion coefficient", Geophysical Research Letters, accepted
[10] Modak, Ashim, et al., Retrieval of Martian atmospheric CO vertical profiles from NOMAD observations during the 1st year of TGO operations. Journal of Geophysical Research: Planets, Submitted.
[11] Aoki, Shohei, et al., “Annual Appearance of Hydrogen Chloride on Mars and a Striking Similarity With the Water Vapor Vertical Distribution Observed by TGO/NOMAD”, Geophysical Research Letters (2021) https://doi.org/10.1029/2021GL092506
[12] Knutsen, Elise, et al. “Comprehensive investigation of Mars methane and organics with ExoMars/NOMAD”, Icarus (2021): 357. https://doi.org/10.1016/j.icarus.2020.114266
How to cite: Thomas, I., Trompet, L., Erwin, J., Aoki, S., Vandaele, A. C., Daerden, F., Ristic, B., Willame, Y., Robert, S., Piccialli, A., Flimon, Z., Neary, L., Viscardy, S., Patel, M., Bellucci, G., and Lopez-Moreno, J. J.: Observations and ongoing calibration of the infrared channels of NOMAD on ExoMars Trace Gas Orbiter, Europlanet Science Congress 2022, Granada, Spain, 18–23 Sep 2022, EPSC2022-823, https://doi.org/10.5194/epsc2022-823, 2022.
Trace gases - important ingredient of planetary atmospheres interact with other components of the surroundings of the planets and with planetary surfaces, creating a new conditions on the surfaces and in the atmosphere. These changes can be obviously visible in spectrometric measurements. In the case of nadir measurements, the ground optical information is distorted by the influence of the atmosphere and vice versa when examining the atmosphere, by the influence of the surface. This fact can cause ambiguity in remotely detection of both: the composition of the atmosphere and the soil. The paper is focused on the study the influence of the optical characteristic of minerals on the surface on remotely detected gaseous components of the Martian atmosphere. This influence is visible in the radiance spectra as the overlapping of spectral features of reflectance/emissivity on extinction of atmospheric gases. The main question is to what extent the spectra of the soil can obscure the gaseous spectra of the atmosphere. Is it possible that the surface spectrum completely changes the spectral characteristics of atmospheric trace gases?
In the paper the influence of spectral properties of the surface on intensity and profiles of Martian spectra in the spectral region of absorption bands of methane were carefully examined. An inspiration to start analyzing this issue was the fact that the excellent NOMAD spectrometer the part of payload of ExoMars Trace Gas Orbiter has not yet detected methane in the Martian atmosphere. The methane has been detected many times (from the Martian orbiters and from Earth) and its presence in the Martian atmosphere is rarely questioned today. For this reason, the topic seems extremely interesting. In the paper the numerical simulations of the measurements of the device such as NOMAD spectrometer are shown.
The elaborated codes provide estimates of the spectral reflectance/emittance and the total radiance of the Martian surface and atmosphere in the Mid-Infrared spectral range. The surface with various structures were described by the reflectance of pure serpentynite or it's mixtures with other minerals like olivine and carbonates. The reflectance were calculated from n,k with Mie and Hapke theories or measured in the laboratory. The various granulation of the surface and concentration of atmospheric gases were taken into account. The surface structure was characterized by particles of various sizes. The physical properties of the atmosphere were characterised in terms of its thermodynamical parameters and absorbing and scattering properties.
One of the discussed examples is the observation of methane over mineralogical surfaces which may be the source of this gas. At the beginning have been assumed that this gas is emitted from Mg-rich serpentinized rocks. Other mineralogical compositions of the surface were also taken into account. Examples are shown in which the optical characteristics of the surface significantly change the shape and contrast of the absorption band of methane.
Our analysis shows that in the spectral region around 3.32, where there is a strong methane absorption band, it is possible to detect this gas by nadir spectrometric measurements over serpentine-water ice regions on the Martian Surface. But the presence of other substances, e.g. dolomite, significantly changes the nature of the radiance spectrum in the region of interest. We have not found so far that the surface characteristics can lead to the complete disappearance of the methane band.
The paper is related with stereoscopic camera CASSiS measurements the a part of payload of ExoMars Trace Gas Orbiter (TGO) of the ESA mission in which researchers from SRC – PAS are engaged. The Cassis camera give us the opportunity of analysis the structure, color and locations on the surface of Mars possible sources of trace gases e.g. methane.
How to cite: Blecka, M.: Influence the composition of Martian surface on visibility the spectral features of atmospheric trace gases in the Mid-infrared spectra - the results of numerical simulations, Europlanet Science Congress 2022, Granada, Spain, 18–23 Sep 2022, EPSC2022-638, https://doi.org/10.5194/epsc2022-638, 2022.
The Imaging UltraViolet Spectrograph (IUVS) (McClintock et al., 2015) onboard the MAVEN (Mars Atmosphere and Volatile EvolutioN) spacecraft performs limb observations of the Mars atmosphere in the dayside. Spectra have been acquired in the ultraviolet domain, between and 110 and 340 nm, since September 2014.
Additionally, the UVIS (UV and Visible Spectrometer) channel of the NOMAD (Nadir and Occultation for MArs Discovery) spectrometer (Patel et al., 2017; Vandaele et al., 2018) onboard the ExoMars Trace Gas Orbiter has performed the same type of observations both in the middle ultraviolet and the visible domains (200 – 650 nm), since April 2019. It is the first instrument that allows studying UV and visible emissions simultaneously that can, thus, be directly compared.
The visible emissions of the oxygen green line (557.7 nm, Gérard et al., 2020) and the oxygen red line doublet (630.0-636.4 nm, Gérard et al., 2021) have already been investigated by Soret et al. (2022), using the NOMAD/UVIS data. The variation of their peak brightness and altitudes have been studied over seasons and compared to photochemical model simulations.
In this work, we present the ultraviolet dayglow counterpart of the visible dayglow and compare the results of both the NOMAD/UVIS and MAVEN/IUVS instruments.
The [OI] 297.2 nm emission that, like the oxygen green line, originates from the O(1S) state is analyzed. The [OI] 297.2 nm has already been extensively studied with the IUVS instrument (Gkouvelis et al., 2018) but it is the first time that both the 297.2 and 557.7 nm can be observed simultaneously, with NOMAD/UVIS. The correlation of those emissions is shown and the ratio I(557.7 nm)/I(297.2 nm) is established with NOMAD/UVIS concurrent measurements.
The CO2+ UVD and CO Cameron bands, that have been studied with the MAVEN/IUVS instrument are also presented and compared to UVIS observations. Finally, the CO2+ Fox-Duffendack-Barker (FDB) system, that has not been observed on Mars since Mariner, is also investigated. We present averaged limb profiles of all these ultraviolet emissions, their seasonal variations and ratios of their brightness.
References:
Gérard, J. C. et al. (2020), Detection of green line emission in the dayside atmosphere of Mars from NOMAD-TGO observations. Nature Astronomy, 4(11), 1049-1052
Gérard, J. C. et al. (2021), First observation of the oxygen 630 nm emission in the Martian dayglow. Geophysical Research Letters, 48(8), e2020GL092334, https://doi.org/10.1029/2020GL092334
Gkouvelis, L., et al. (2018), The O(1S) 297.2-nm dayglow emission: a tracer of CO2 density variations in the Martian lower thermosphere. Journal of Geophysical Research: Planets, 123(12), 3119-3132
McClintock, W. E. et al. (2015), The Imaging Ultraviolet Spectrograph (IUVS) for the MAVEN mission. Space Science Reviews, 195(1–4), 75–124. https://doi.org/10.1007/s11214-014-0098-7
Patel, M. R. et al. (2017), NOMAD spectrometer on the ExoMars trace gas orbiter mission: part 2—design, manufacturing, and testing of the ultraviolet and visible channel. Applied optics, 56(10), 2771-2782. https://doi.org/10.1364/AO.56.002771
Soret, L. et al. (2022), The Mars oxygen visible dayglow: a Martian year of NOMAD/UVIS observations, Journal of Geophysical Research
Vandaele, A. C. et al. (2018), NOMAD, an integrated suite of spectrometers for the ExoMars Trace Gas Mission: Technical description, science objectives, and expected performance. Space Science Reviews, 214(5). https://doi.org/10.1007/s11214-018-0517-2
How to cite: Soret, L., Gérard, J.-C., Gkouvelis, L., Schneider, N., Jain, S., Hubert, B., Vandaele, A.-C., and team, N. U.: Ultraviolet dayglow emissions and ratios in the Mars atmosphere, Europlanet Science Congress 2022, Granada, Spain, 18–23 Sep 2022, EPSC2022-973, https://doi.org/10.5194/epsc2022-973, 2022.
Abstract
The geological record provides convincing evidence for very recent volcanic activity on Mars (e.g. Horvath et al. 2021, Icarus 365, 114499). In this talk we present the results of Braude et al. (2022, A&A 658, A86), in which a comprehensive analysis was performed of solar occultation observations from the ACS MIR instrument from MY 34 to 35, in search of three tracers of residual volcanic outgassing from the surface of Mars: SO2, H2S and OCS. We found no statistically significant detections of either of these three molecules, instead imposing upper limits of 20 ppbv of SO2, 15 ppbv of H2S, and 0.4 ppbv of OCS. We thereby estimated that volcanic outgassing from the surface of Mars must be below 2 ktons day-1.
Introduction
Several pieces of geological evidence indicate the presence of residual volcanic activity in the Tharsis and Elysium regions dating back only a few million [1] or even hundreds of thousands [2] of years, with the InSight Lander recently confirming present-day seismic activity in the Cerberus Fossae region [3]. On Earth, volcanic emission is dominated by carbon dioxide, water vapour and sulphur species, notably sulphur dioxide (SO2) but with smaller amounts of hydrogen sulphide (H2S) and the occasional detection of carbonyl sulphide (OCS). Previous ground-based observations of sulphur species on Mars, however, have not resulted in any confirmed detections, instead imposing lowest disc-integrated upper limits of 0.3 ppbv of SO2 [4,5], 1.5 ppbv of H2S [6] and 1.1 ppbv of OCS [7]. In this talk we summarise the results of [8], in which we used solar occultation measurements from the mid-infrared channel of the Atmospheric Chemistry Suite (ACS MIR, [9]) instrument from the start of the ACS science phase in MY 34 to the end of MY 35, in search of SO2, H2S and OCS in Mars’ lower atmosphere.
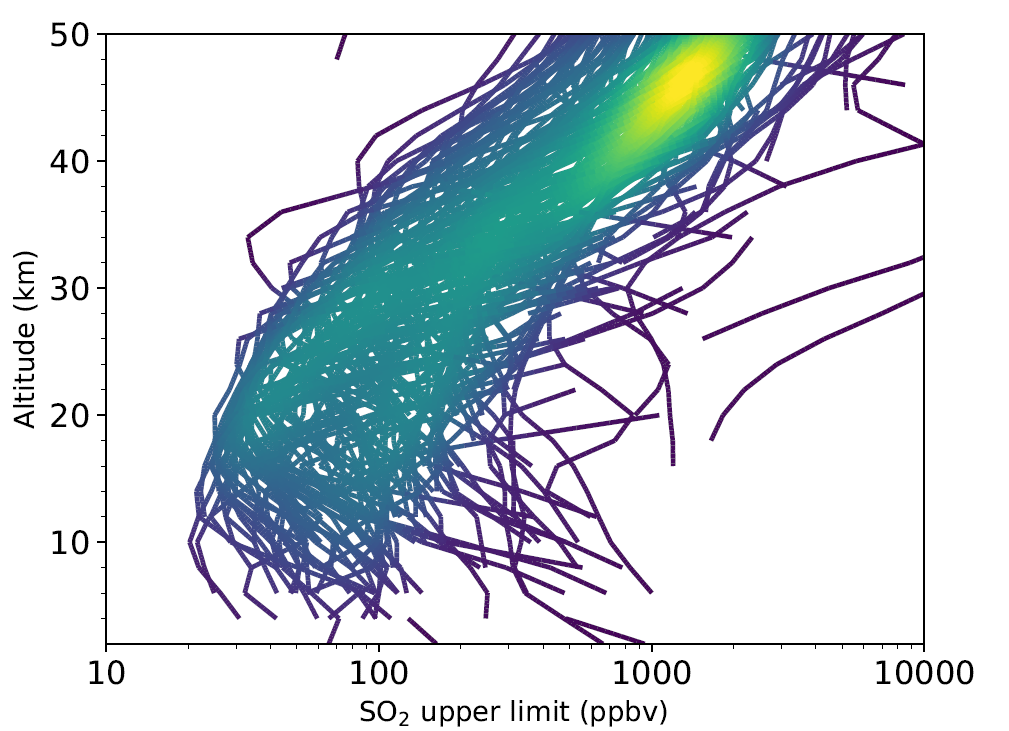
Fig. 1: Retrieved vertical profiles of SO2 upper limit values from each of the 190 processed solar occultations between Ls = 165 - 280° of MY 34 and Ls = 140 - 350° of MY 35. Yellower colours indicate an increased density of retrieved values. (Reproduced with permission from Fig. 4 of [8])
Method
We made use of three sets of ACS MIR data each obtained using different diffraction grating positions that are sensitive to different wavenumber ranges. 190 individual occultations carried out using grating position 9 were analysed, covering a time period of Ls = 165 - 280° of MY 34 and Ls = 140 - 350° of MY 35. This grating position covers the strongest SO2 absorption features in the wavenumber range covered by ACS MIR. Using the RISOTTO radiative transfer and retrieval code [10], we performed retrievals of this data within a wavenumber range of 2481 and 2492 cm-1, which is sensitive to a series of overlapping SO2 and CO2 absorption lines, and imposed upper limits by deriving the volume mixing ratio (VMR) of SO2 that would result in a change in goodness of fit (χ2/n) to the observed spectra above a given threshold.
Equivalently, we searched for H2S in two spectral windows between 3827 and 3833 cm-1 and around a single absorption line at 3839.2 cm-1 covered by grating position 5, of which we analysed 86 occultations between Ls = 164 - 218° and Ls = 315 - 354° of MY 34. Finally, we searched for OCS in two spectral windows between 2908 - 2912 and 2923 - 2927 cm-1, corresponding to the P and R branches respectively of an OCS absorption band in a wavenumber region that is mostly devoid of other gas absorption lines. This region is covered by grating position 11, for which there is almost complete coverage between Ls = 163° of MY 34 and Ls = 355° of MY 35. Upper limits for these two molecules were imposed by averaging retrieved vertical VMR profiles from adjacent rows on the MIR detector.
Results and Perspective
We found no significant detections (>3σ) of any of these three molecules, instead deriving our best upper limits of 20 ppbv of SO2, 15 ppbv of H2S and 0.4 ppbv of OCS. The latter value is the lowest reported upper limit of OCS in the Martian atmosphere to date, as opposed to the previous value of 1.1 ppbv reported by [7]. However, SO2 is expected to dominate in concentration relative to H2S and OCS in volcanic emission. We estimate that during the period of observation, no more than 750 ktons of SO2 could be present in the entire Martian atmosphere, implying surface outgassing of SO2 below 2 ktons/day. Future targeted measurements of sulphur species in regions associated with historic volcanism (e.g. the Tharsis region, Elysium Planitia) could shed greater light on the probability of residual present-day volcanism.
References
[1] Neukum, G., Jaumann, R., Hoffmann, H., et al. 2004, Nature, 432, 971
[2] Horvath, D. G., Moitra, P., Hamilton, C.W., Craddock, R. A, & Andrews-Hanna,J. C. 2021, Icarus, 365, 114499
[3] Giardini, D., Lognonné, P., Banerdt, W. B., et al. 2020, Nat. Geosci.,13,205
[4] Encrenaz, T., Greathouse, T. K., Richter, M. J., et al. 2011, A&A,530,A37
[5] Krasnopolsky, V. A. 2012, Icarus,217,144
[6] Khayat, A. S., Villanueva, G. L., Mumma, M. J., & Tokunaga, A. T. 2015, Icarus,253,130
[7] Khayat, A., Villanueva, G. L., Mumma, M. J., & Tokunaga, A. T. 2017, Icarus,296,1
[8] Braude, A. S., Montmessin, F., Olsen, K. S., et al. 2022, A&A,658,A86
[9] Korablev, O., Montmessin, F., Trokhimovskiy, A., et al. 2018, Space Sci. Rev.,214,7
[10] Braude, A. S., Ferron, S., & Montmessin, F. 2021, J. Quant. Spec. Rad. Transf.,274,107848
How to cite: Braude, A., Montmessin, F., Olsen, K., Trokhimovskiy, A., Korablev, O., Lefèvre, F., Fedorova, A., Alday, J., Baggio, L., Irbah, A., Lacombe, G., Forget, F., Millour, E., Wilson, C., Patrakeev, A., and Shakun, A.: Upper limits on volcanic gases in the Martian atmosphere from the ACS MIR instrument, Europlanet Science Congress 2022, Granada, Spain, 18–23 Sep 2022, EPSC2022-642, https://doi.org/10.5194/epsc2022-642, 2022.
ESA's Mars Express (MEX) spacecraft has operated in Mars orbit since 2003. On-board MEX, the ASPERA-3 (Analyser of Space Plasma and EneRgetic Atoms) instrument is providing a unique dataset of the space plasma near Mars for more than 18 years, covering a complete solar cycle, allowing long-term inverstigation of the interaction of Mars with the solar wind.
The large number of observations also enables unique statistical studies. Here we present two ASPERA-3 Ion Mass Analyzer (IMA) higher level data sets that will be available through the ESA's Planetary Science Archive (PSA): Solar wind ion moments and Ion differential flux.
How to cite: Holmström, M., Ramstad, R., Futaana, Y., Persson, M., Nilsson, H., and Barabash, S.: High Level Datasets for ASPERA-3 IMA on Mars Express, Europlanet Science Congress 2022, Granada, Spain, 18–23 Sep 2022, EPSC2022-412, https://doi.org/10.5194/epsc2022-412, 2022.
Please decide on your access
Please use the buttons below to download the presentation materials or to visit the external website where the presentation is linked. Regarding the external link, please note that Copernicus Meetings cannot accept any liability for the content and the website you will visit.
Forward to presentation link
You are going to open an external link to the presentation as indicated by the authors. Copernicus Meetings cannot accept any liability for the content and the website you will visit.
We are sorry, but presentations are only available for users who registered for the conference. Thank you.
Please decide on your access
Please use the buttons below to download the presentation materials or to visit the external website where the presentation is linked. Regarding the external link, please note that Copernicus Meetings cannot accept any liability for the content and the website you will visit.
Forward to session asset
You are going to open an external link to the asset as indicated by the session. Copernicus Meetings cannot accept any liability for the content and the website you will visit.
We are sorry, but presentations are only available for users who registered for the conference. Thank you.