Towards new insights of Venus mantle viscosity structure
- Observatoire de la Cote d'Azur, Lagrange Laboratory, France (julia.maia@oca.eu)
One of the most informative ways of studying the interior structure and geodynamics of terrestrial planets is the joint investigation of gravity and topography data. In the case of Venus, this is in fact one of the only sources of information about the planet's interior, along with the lack of an active dynamo (e.g., Phillips and Russell, 1987), estimations of the moment of inertia (Margot et al., 2021) and tidal love numbers (Konopliv and Yoder, 1996). The firsts global gravity-topography analyses of Venus revealed unique characteristics. For long wavelengths, the planet presents correlations which are considerably higher than for Earth (Sjogren et al., 1980). Moreover, the apparent depth of compensation is large, globally deeper than 100 km (e.g., Kiefer et al., 1986). By analyzing the wavelength-dependent ratio between gravity and topography, the so-called spectral admittance, Kiefer et al. 1986 concluded that Venus' long-wavelength topography is mostly supported dynamically, i.e., by convective flows in the mantle.
Although today we know that some Venusian highlands, such as the crustal plateaus (e.g., Simons et al., 1997, Maia and Wieczorek, 2022) and Ishtar Terra (e.g., Kucinskas et al., 1996), are more consistent with being in a state of isostasy with significant variations on crustal thickness, it is broadly accepted that dynamic compensation is important on a global scale, notably at long wavelengths. Hence, one can attempt to predict Venus' gravity field and surface displacement using a geophysical model of mantle convection and how this couples to the surface. One of the most used instantaneous dynamic loading models was developed by Hager and Clayton (1989), where mantle flows, triggered by density anomalies, depend on radial viscosity variations. On Venus, this model has been adopted to estimate mantle mass anomalies maps and to investigate the planet's mantle viscosity profile (e.g., Herrick and Phillips, 1992; Pauer et al. 2006; James et al. 2013). Herrick and Phillips (1992) conclude that Venus mantle is consistent with a constant viscosity profile while Pauer et al. (2006) suggests that Venus could be more similar to Earth, where the mantle viscosity increases with depth and with a possible low-viscosity zone in the upper mantle.
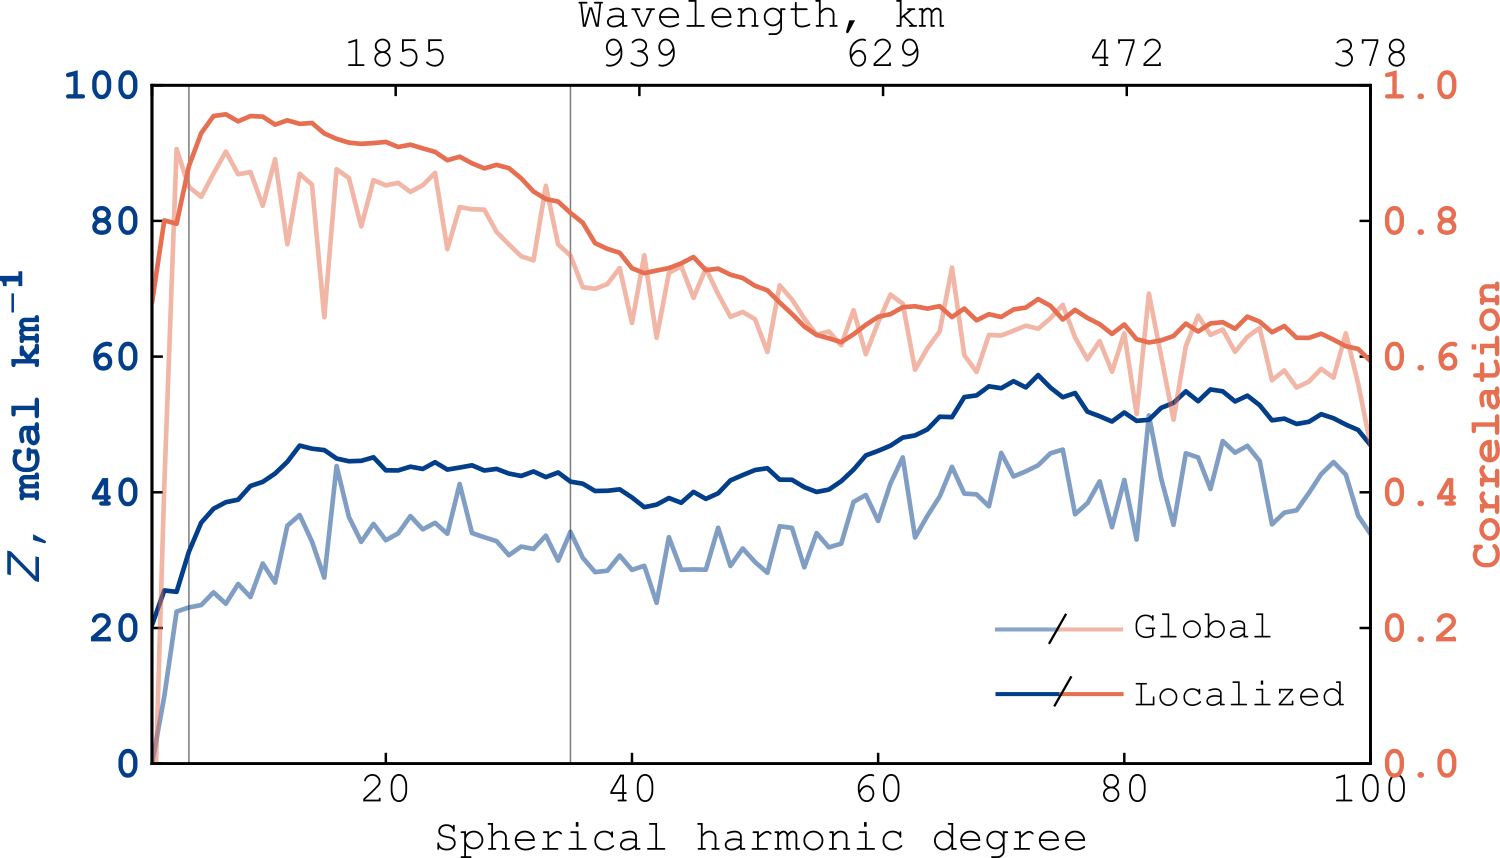
These studies investigate the global topography and gravity signals to make their predictions. However, there are major highlands on Venus, such as Ovda, Thetis and Ishtar Terra, that are inconsistent with dynamic support. Using the Hager and Clayton (1989) dynamic model we do a new mantle viscosity investigation that excludes those areas where the gravity and topography signals are best modeled by a combination of Airy isostasy and lithospheric flexure. Our study is performed in the spectral domain and a multitaper spatio-spectral localization approach (Wieczorek and Simons, 2007) is adopted to suppress the signals of Ishtar Terra and Western Aphrodite Terra. The figure below shows a comparison between Venus global spectral admittance and correlation and the tapered estimations. There is a clear increase in admittance and correlation when the localization tapers are applied, specially for long wavelengths where dynamic loading is expected to dominate. The difference is largely attributed to the high elevations associated with the highlands that are near a state of isostasy, and hence have low associated gravity signals.

Regarding the dynamic modeling, we consider a viscosity profile with four layers, where the viscosity and depth of each layer are randomly sampled following a log-uniform and a uniform distribution, respectively. After computing the predicted topography and gravity field, we multiply the data by several different orthogonal localization windows and calculate the predicted admittance. The misfits between observations and predictions are computed in order determine the accepted models and constrain the mantle viscosity structure.
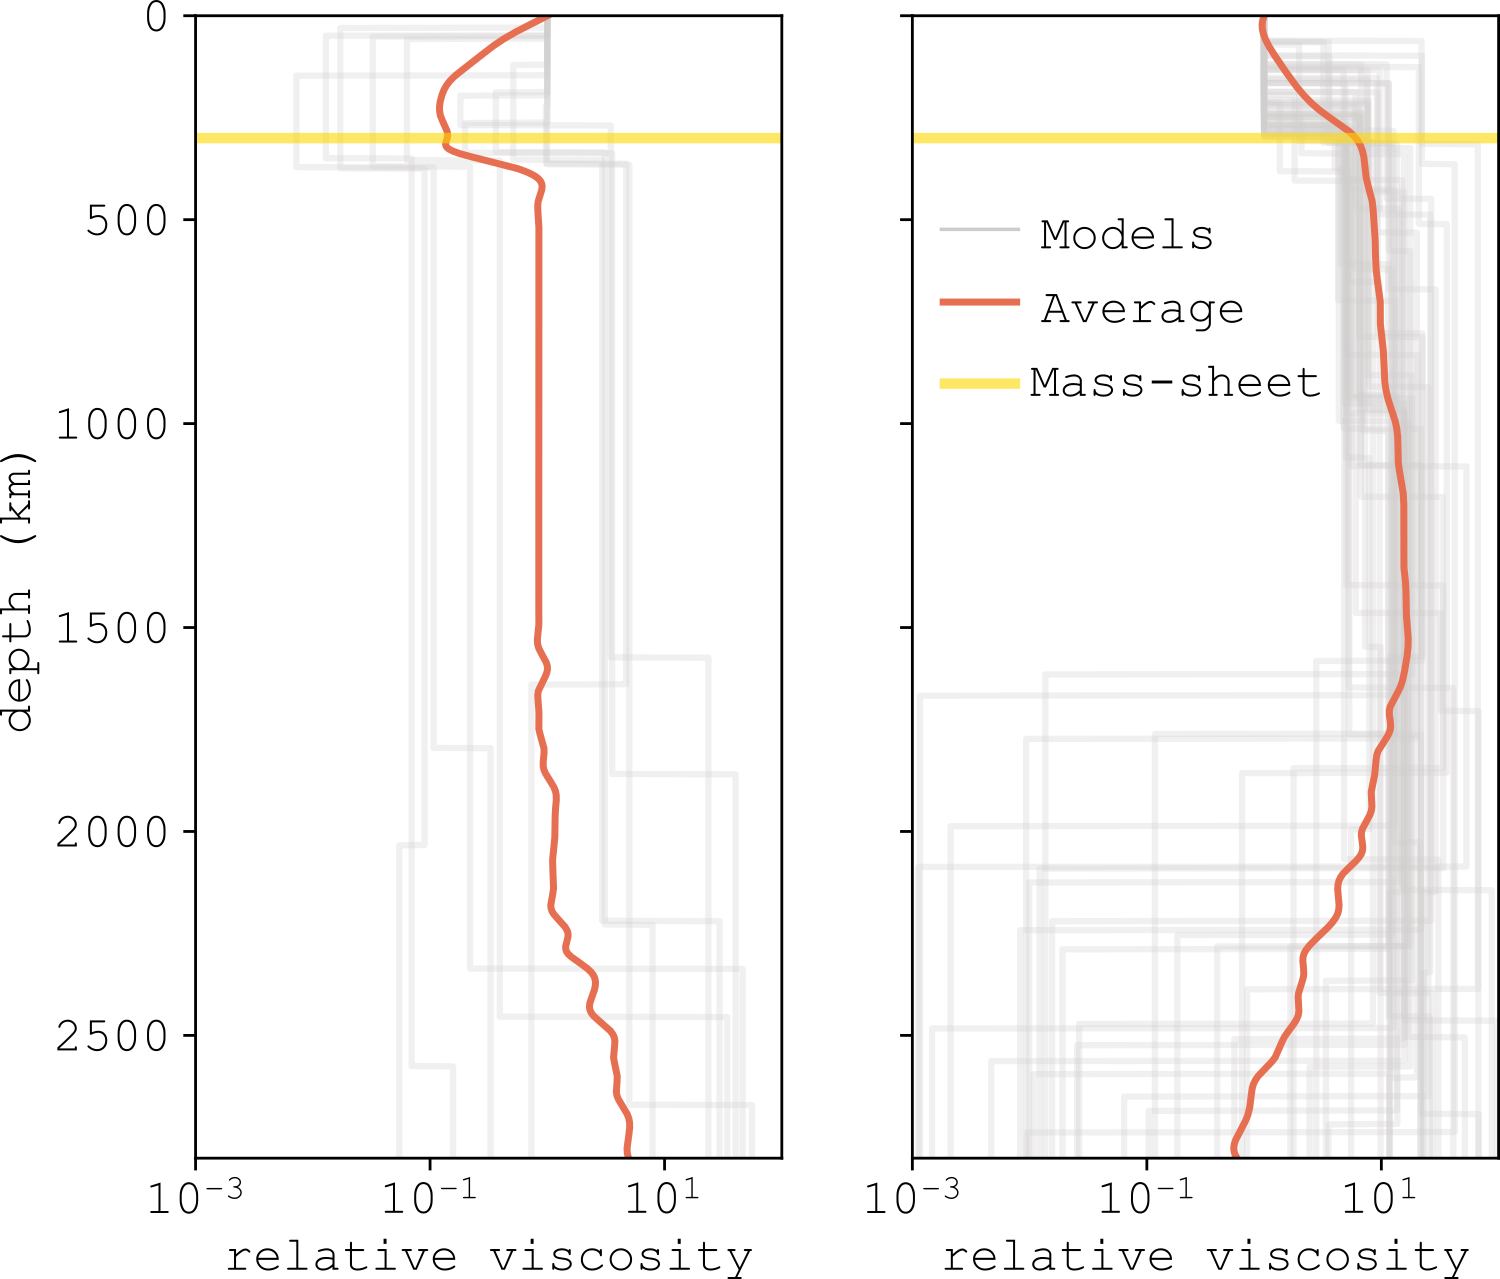
The range of models that properly fit the observed admittance can be roughly divided into two groups, illustrated in figure below. The first is overall characterized by a layer of relative low viscosity beneath the lithosphere with maximum thickness of about 400 km, followed by an increase of viscosity with depth down to the core-mantle boundary. The second set of models does not present a clear viscosity boundary between the lithosphere and the underlying mantle and, as for the first group, the viscosity tends to increase with depth. In this scenario, however, a large number of models present a basal low viscosity zone in the mantle with thicknesses ranging from about 300 to 1000 km. In the next steps of our study, we intend to pinpoint what is the most likely viscosity structure of Venus’ mantle, interpreting the results in the framework of a Bayesian analysis to assess the likelihood of each of these scenarios and considering the physical implications of the different models.

Hager, B. and Clayton, R. (1989) Mantle Convection, 657-763; Herrick, R. and Phillips, R. (1992) JGR, 97; James, P. et al. (2013) JGR-Planets, 118; Kiefer et al. (1986) GRL, 13; Konopliv and Yoder (1996) GRL, 23; Kucinskas et al. (1996) JGR, 101; Maia and Wieczorek (2022) JGR-Planets, 127; Margot et al. (2021) Nat Astron; Pauer et al. (2006) JGR, 111; Phillips and Russel (1987); Simons et al. (1997) JGI, 131; Sjogren et al. (1980) JGR, 85; Wieczorek and Simons (2007) J Fourier Anal Appl, 13
How to cite: Maia, J. and Wieczorek, M.: Towards new insights of Venus mantle viscosity structure, Europlanet Science Congress 2022, Granada, Spain, 18–23 Sep 2022, EPSC2022-407, https://doi.org/10.5194/epsc2022-407, 2022.

