Europlanet Science Congress 2022
Palacio de Congresos de Granada, Spain
18 – 23 September 2022
Europlanet Science Congress 2022
Palacio de Congresos de Granada, Spain
18 September – 23 September 2022
TP2
Paving the way to the decade of Venus

TP2

Paving the way to the decade of Venus
Convener: Anne Grete Straume-Lindner | Co-conveners: Gabriella Gilli, Moa Persson
Orals
| Tue, 20 Sep, 10:00–13:30 (CEST)|Room Albéniz+Machuca
Posters
| Attendance Mon, 19 Sep, 18:45–20:15 (CEST) | Display Mon, 19 Sep, 08:30–Wed, 21 Sep, 11:00|Poster area Level 1

Session assets

Discussion on Slack

Orals: Tue, 20 Sep | Room Albéniz+Machuca

Chairpersons: Anne Grete Straume-Lindner, Thomas Widemann
Welcome
Understanding Venus' evolution: Past and future missions
10:00–10:15
|
EPSC2022-62
|
solicited
Cédric Gillmann, Gregor Golabek, Sean Raymond, Paul Tackley, Maria Schoenbaechler, Veronique Dehant, and Vinciane Debaille

The evolution of surface conditions on Venus has recently made a return to the forefront of planetary sciences questions. Due to both the striking similarities and the obvious differences between Earth and Venus, understanding Venus might hold some of the keys to how terrestrial planets become habitable, either in our solar system or beyond. The question of the origin and persistence of water at the surface/in the atmosphere of Venus determines, in a large part what the planet's evolutionary path has been. The critical difference between Earth and Venus might even be settled during their primordial evolution. Since no sample of Venus can be studied yet, as would be the case for Earth, we turn on alternative methods of investigation. We track the evolution of volatiles at the surface of the planet during its history, since the end of the magma ocean phase. We compare these scenarios with present-day observation and derive limits on maximum amounts of volatiles in the atmosphere of Venus through time, on volatile exchanges, and on water delivery.  

We have developed coupled numerical simulations of the evolution of Venus, modeling mechanisms that govern its surface conditions and atmosphere composition. Currently, the simulations include modeling of mantle dynamics, core evolution, volcanism, surface alteration, atmospheric escape (both hydrodynamic and non-thermal), greenhouse effect, and the feedback mechanisms between the interior and the atmosphere of the planet. Focusing on Late Accretion, we have modeled the effects of large meteoritic impacts on long term evolution through three aspects: atmosphere erosion, volatile delivery and mantle dynamics perturbation due to energy transfer.  The models are constrained by present-day observation and atmosphere composition, with the requirement that scenarios fit reasonnably the current state of the planet.

We produce scenarios that fit present-day conditions and feature both early mobile lid regime (akin to plate tectonics) as well as late episodic lid regime with resurfacing events. However, water outgassing during late evolution could be dampened by high surface pressures. Therefore, it is during the early history of Venus, in particular, that we observe the largest volatile exchanges. That era seems to have large repercussions on long term evolution and present-day state, as it determines volatile inventories and repartition.

The effects of impacts dominate the volatile and mantle evolution during Late Accretion. Large impacts are shown to have essential consequences for volatile repartition. The atmosphere erosion they cause is marginal and doesn’t deplete the atmosphere as much as swarms of smaller bodies, they instead act as a significant source of volatiles. Indeed, if Late Accretion is mainly composed of volatile-rich bodies; it is very difficult to reach the observed present-day state of Venus; instead the atmosphere may become too wet. Likewise, the likely mass received by Venus during volatile-rich Late Accretion, if completely outgassed into the planet's atmosphere, could lead to masses of CO2 and N2 3-6 times higher than observed at present-day.

Simulations show that the maximum contribution of wet material impactors (carbon-chondrites-like) is about 5-10% (mass.) of the total accreted mass during Late Accretion (the larger portion of the Late accretion being composed of enstatite-chondrite-like bodies). In less volatile rich scenarios, water brought by collisions is then lost, either quickly or over billions of years. A small amount of water is then slowly reinserted in the atmosphere by volcanic outgassing.

In wet scenarios, water is efficiently brought to the surface of Venus and loss mechanisms are not able to remove it later, through solid surface oxidation and atmospheric escape. This then leads to water-rich atmosphere, unlike what we observe today.

Those results are consistent over a large range of simulations with variations of late accretion timing, impactors mass-size distribution, composition, efficiency, mantle parameters and so on. Water should have been delivered early to the terrestrial planets in the solar system, during main accretion, before the last giant impact, as is suggested for Earth from isotopic measurements. 

Acknowledgments: CG acknowledges support from the FNRS ET-HOME project and Brussels Free University. CG further acknowledges support from the CLEVER Planets group, supported by NASA.

How to cite: Gillmann, C., Golabek, G., Raymond, S., Tackley, P., Schoenbaechler, M., Dehant, V., and Debaille, V.: The Consequences of Late Accretion Volatile Delivery and Loss Mechanisms on Venus’ Evolution, Europlanet Science Congress 2022, Granada, Spain, 18–23 Sep 2022, EPSC2022-62, https://doi.org/10.5194/epsc2022-62, 2022.

10:15–10:30
|
EPSC2022-1120
|
solicited
Dmitrij Titov, Anne Grete Straume-Lindner, and Colin Wilson

Venus appears to be an “alien” planet drastically and surprisingly different from the Earth. The early space missions revealed the world with remarkably hot, dense, cloudy, and very dynamic atmosphere filled with toxic species likely of volcanic origin. During more than 8 years of operations ESA’s Venus Express spacecraft performed a global survey of the atmosphere and plasma environment of our near neighbour. The mission delivered comprehensive data on the temperature structure, the atmospheric composition, the cloud morphology, the atmospheric dynamics, the solar wind interaction and the escape processes. Vertical profiles of the atmospheric temperature showed strong latitudinal trend in the mesosphere and upper troposphere correlated with the changes in the cloud top structure and suggesting convective instability in the main cloud deck at 50-60 km. Observations revealed significant latitudinal variations and temporal changes in the global cloud top morphology, which modulate the solar energy deposited in the atmosphere. The cloud top altitude varies from ~72 km in the low and middle latitudes to ~64 km in the polar region, correlated with decrease of the aerosol scale height from 4 ± 1.6 km to 1.7 ± 2.4 km, marking vast polar depression. UV imaging showed for the first time the middle latitudes and polar regions in unprecedented detail. In particular, the eye of the Southern polar vortex was found to be a strongly variable feature with complex dynamics.

Solar occultation observations and deep atmosphere spectroscopy in spectral transparency “windows” mapped distribution of the major trace gases H2O, SO2, CO, COS and their variations above and below the clouds, revealing key features of the dynamical and chemical processes at work. A strong, an order of magnitude, increase in SO2 cloud top abundance with subsequent return to the previous concentration was monitored by Venus Express specrometres. This phenomenon can be explained either by a mighty volcanic eruption or atmospheric dynamics.

Tracking of cloud features provided the most complete characterization of the mean atmospheric circulation as well as its variability. Low and middle latitudes show an almost constant with latitude zonal wind speed at the cloud tops and vertical wind shear of 2-3 m/s/km. Surprisingly the zonal wind speed was found to correlate with topography decreasing from 110±16 m/s above lowlands to 84±20 m/s at Aphrodite Terra suggesting decelerating effect of topographic highs. Towards the pole, the wind speed drops quickly and the apparent vertical shear vanishes. The meridional cloud top wind has poleward direction with the wind speed ranging from about 0 m/s at equator to about 15 m/s in the middle latitudes. A reverse equatorward flow was found about 20 km deeper in the middle cloud suggesting existence of a Hadley cell or action of thermal tides at the cloud level. Comparison of the thermal wind field derived from temperature sounding to the cloud-tracked winds confirms the validity of cyclostrophic balance, at least in the latitude range from 30S to 70S. The observations are supported by the General Circulation Models.

Venus Express detected and mapped non-LTE infrared emissions in the lines of O2, NO, CO2, OH originating near the mesopause at 95-105 km. The data show that the peak intensity occurs in average close to the anti-solar point for O2 emission, which is consistent with current models of the thermospheric circulation. For almost complete solar cycle the Venus Express instruments continuously monitored the induced magnetic field and plasma environment and established the global escape rates of 3·1024s−1, 7·1024s−1, 8·1022s−1 for O+, H+, and He+ ions and identified the main acceleration process. For the first time it was shown that the reconnection process takes place in the tail of a non-magnetized body. It was confirmed that the lightning tentatively detected by Pioneer-Venus Orbiter indeed occurs on Venus.

Thermal mapping of the surface in the near-IR spectral “windows” on the night side indicated the presence of recent volcanism on the planet, as does the high and strongly variable SO2 abundance. Variations in the thermal emissivity of the surface observed by the VIRTIS imaging spectrometer indicated compositional differences in lava flows at three hotspots. These anomalies were interpreted as a lack of surface weathering suggesting the flows to be younger than 2.5 million years indicating that Venus is actively resurfacing. The VMC camera provided evidence of transient bright spots on the surface that are consistent with the extrusion of lava flows that locally cause significantly elevated surface temperatures. The very strong spatial correlation of the transient bright spots with the extremely young Ganiki Chasma, their similarity to locations of rift-associated volcanism on Earth, provide strong evidence of their volcanic origin and suggests that Venus is currently geodynamically active.

Alongside observations of Earth, Mars and Titan, observation of Venus allows the opportunity to study geophysical processes in a wide range of parameter space. Furthermore, Venus can be considered as an archetype of terrestrial exoplanets that emphasizes an important link to the quickly growing field of exoplanets research.

The talk will give an overview of the Venus Express findings including recent results of data analysis, outline outstanding unsolved problems and provide a bridge, via the Akatsuki mission, to the missions to come in 2030s: EnVision, VERITAS and DAVINCI.

How to cite: Titov, D., Straume-Lindner, A. G., and Wilson, C.: Venus Express as precursor of the Venus Decade, Europlanet Science Congress 2022, Granada, Spain, 18–23 Sep 2022, EPSC2022-1120, https://doi.org/10.5194/epsc2022-1120, 2022.

10:30–10:40
|
EPSC2022-751
Scott Hensley, Suzanne Smrekar, Bruce Campbell, Marco Mastrogiuseppe, Dragana Perkovic-Martin, Marwan Younis, and Howard Zebker

VERITAS is a NASA Discovery mission that was selected on June 2, 2021 and is a partnership between scientists and engineers at NASA/JPL and with the German (DLR), Italian (ASI) and French Space Agencies (CNES). VERITAS would carry two instruments, VISAR, an X-band interferometric radar provided by NASA/JPL with contributions from ASI and DLR, and VEM, an infrared spectrometer provided by DLR. Data from these two instruments would be combined with gravity science data obtained from telecom tracking data to investigate tectonic style and ongoing volcanism. Science data is collected in two phases after arriving at Venus after a 7-month cruise from Earth. During the second phase of science data collections VERITAS plans to collect radar data for image generation, topographic mapping and targeted repeat pass radar interferometry observations to measure surface deformation .

VERITAS has two phases of science operation. The first science phase (SP1) for VEM operations occurs during a 4-month interruption in the middle of 16 month aerobraking phase, which is needed to achieve the desired circular orbit needed for Science Phase 2 observations of both the VISAR and VEM instruments. The final nearly circular polar orbit used for SP2 varies between 180 and 255 km in altitude. SP2 lasts for 4 Venus sidereal days or ‘cycles’, each of which is 243 days in duration owing to the very slow rotation rate of Venus. The orbit is designed as a frozen eccentricity orbit so that its trajectory nearly repeats from cycle to cycle to facilitate repeat pass radar observations.

VISAR nominally collects data for 11 orbits on both ascending and descending passes followed by 5 orbits of data downlink to Earth. Data is processed onboard to multi-looked imagery and interferograms to reduce the data downlink volume up to 1000 fold. The exception to this is when repeat pass radar interferometry (RPI) data is collected for targeted sites on the surface. Since RPI sites are 200 km (along-track) × 200 km (cross-track) in extent, raw data for 20 consecutive orbits (Venus rotates 10 km at the equator during a VERITAS orbit) are needed to map a site. Raw data are downlinked for processing on Earth. Downlinked data volume as well as ∆V and other operational considerations limit the number of RPI sites to approximately12-18.

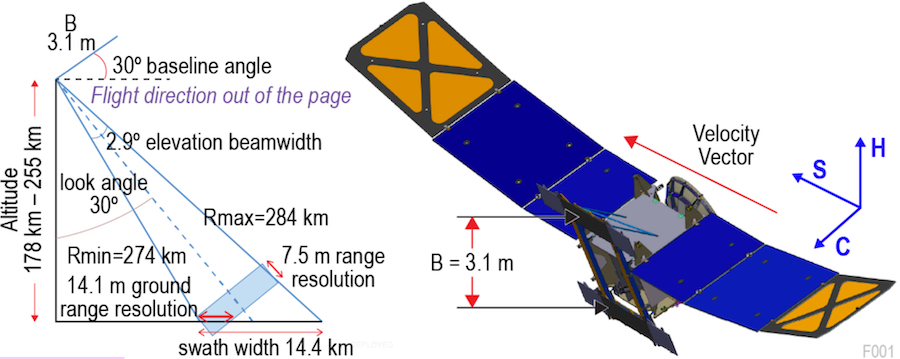
Fig. 1: VISAR flight configuration and observing geometry are optimized for InSAR DEM acquisition with baseline separation B = 3.1 m.

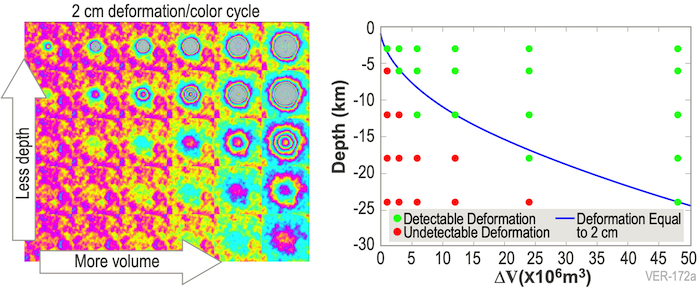
Venus is expected to be active today. VERITAS requires detection of 2-cm deformations for spatial scales of 1 km (e.g., fault creep) and 2 cm at 40 m horizontal postings for small-scale (e.g., volcanic) features. To access which deformation signals would be discernible given the expected amount of atmospheric noise we simulated volcanic deformation using various localized, spherical sources (a.k.a. Mogi sources) for a range of source depth and delta volumes. We assumed Earth-like magma chambers at depths of 2-28 km and delta volumes of 1-48 km3, in reasonable agreement with the few Venusian volcanoes for which these parameters can be estimated. Figure 2 shows that inflation above magma chambers at a range of depths, even including atmospheric variability, produces a readily discernible deformation exceeding 2 cm, assuming 1.5 cm of atmospheric distortion at 200 km length scale.

Fig. 2: Deformations above 2 cm are detectable with VISAR RPI techniques, after accounting for observed S02 variability. Left: Fringe patterns (2 cm of deformation per color cycle) for 30 Mogi point sources with atmospheric distortion superimposed. Right: De formation above or near the detectability limit are shown as green dots; those obscured by atmospheric distortion are red.

Radar image, topographic and RPI data along with data from the VEM instrument and gravity measurements to answer three essential science questions: 1) What processes shape rocky planet evolution? 2) What geologic processes are currently active? and 3) Is there evidence of past and present interior water? VERITAS’ VISAR instruments is integral to endind many 30-year-old debates for Venus, such as whether volcanism has been steady or catastrophic, why it lacks terrestrial-style plate tectonics, how it loses its heat, and if it has continents.

A portion of this research was conducted at the Jet Propulsion Laboratory, California Institute of Technology, under contract with the National Aeronautics and Space Administration.

How to cite: Hensley, S., Smrekar, S., Campbell, B., Mastrogiuseppe, M., Perkovic-Martin, D., Younis, M., and Zebker, H.: VERITAS Radar Observations at Venus, Europlanet Science Congress 2022, Granada, Spain, 18–23 Sep 2022, EPSC2022-751, https://doi.org/10.5194/epsc2022-751, 2022.

10:40–10:50
|
EPSC2022-1097
Thomas Widemann, Anne Grete Straume-Lindner, Adriana C. Ocampo, Thomas Voirin, Ann Carine Vandaele, Alberto Moreira, Bruce Campbell, Caroline Dumoulin, Emmanuel Marcq, Gabriella Gilli, Jörn Helbert, Walter Kiefer, Lynn Carter, Lorenzo Bruzzone, Philippa Mason, Scott Hensley, and Tatiana Bocanegra-Bahamon


EnVision was selected as ESA's 5th Medium-class mission in the Agency's Cosmic Vision plan, targeting a launch in the early 2030s. EnVision's overarching science questions are to explore the full range of geoscientific processes operating on Venus. It will investigate Venus from its inner core to its atmosphere at an unprecedented scale of resolution, characterising in particular core and mantle structure, signs of past geologic processes, and looking for evidence of past liquid water. Far more than a simple radar mission, this suite of investigations works together to comprehensively assess surface and subsurface geological processes, interior geophysics and geodynamics, and atmospheric pathways of key volcanogenic gases, which together illuminate how and why Venus turned out so differently to Earth. Recent modeling studies strongly suggest that the evolution of the atmosphere and interior of Venus are coupled, emphasizing the need to study the atmosphere, surface, and interior of Venus as a system. 

EnVision is an ESA Venus orbiter mission formulated in collaboration with NASA; As a key partner in the mission, NASA provides the Synthetic Aperture Radar, VenSAR. The EnVision payload consists of five instruments provided by European and US institutions. The five instruments comprise a comprehensive measurement suite spanning infrared, ultraviolet- visible, microwave and high frequency wavelengths, complemented by the Radio Science investigation exploiting the spacecraft TT&C system. All instruments in the payload have substantial heritage and robust margins relative to the requirements with designs suitable for operation in the Venus environment. This suite of instruments was chosen to meet the broad spectrum of measurement requirements needed to support EnVision science investigations.

How to cite: Widemann, T., Straume-Lindner, A. G., Ocampo, A. C., Voirin, T., Vandaele, A. C., Moreira, A., Campbell, B., Dumoulin, C., Marcq, E., Gilli, G., Helbert, J., Kiefer, W., Carter, L., Bruzzone, L., Mason, P., Hensley, S., and Bocanegra-Bahamon, T.: EnVision: understanding why our closest neighbour is so different, Europlanet Science Congress 2022, Granada, Spain, 18–23 Sep 2022, EPSC2022-1097, https://doi.org/10.5194/epsc2022-1097, 2022.

10:50–11:00
|
EPSC2022-196
Ann-Grete Straume-Lindner, Robert Buchwald, Pierre-Elie Crouzet, Dmitri Titov, Thomas Voirin, and Arno Wielders

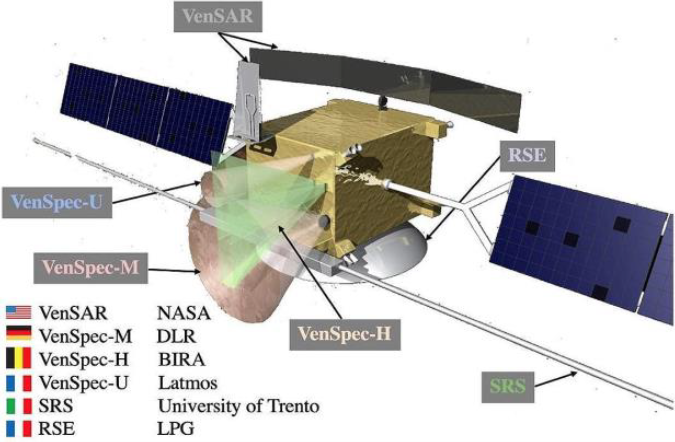
EnVision is a Venus orbiter mission that will determine the nature and current state of geological processes on Venus in the present era, measure how those processes generate and sustain the inhospitable atmosphere and climate of Venus, and piece together the sequence of events – the geological history – that led to that current state. Envision was selected in June 2021 to become the next M-Class mission of ESA's Cosmic Vision Programme. To full fill the science objectives, EnVision employs a suite of instruments optimised for observations from Venus orbit, including an imaging radar for high-resolution surface mapping (provided by NASA), a sounding radar for discerning the geometry of the near subsurface, a multispectral infrared camera capturing the composition of surficial rocks and atmospheric composition, and an infrared and ultraviolet spectrometer, complemented by radio science experiments, to identify the pathways of important volcanogenic gases (water vapour, sulphur dioxide, and others) from the lower atmosphere up and into the clouds and in the upper atmosphere. The radoscience experiment also exploits the precise orbit determination to measure the gravity field and probe the deep interior structure of Venus. Figure 1 shows the instrument payload integrated onto the spacecraft and the country and organization responsible for each payload element. The Synthetic Aperture Radar, VenSAR, will image pre-selected regions of interest at a resolution of 30 m/pixel, and subregions at 10 m/pixel. EnVision will be the first Venus mission hosting a Subsurface Radar Sounder, SRS, characterizing the vertical structure and stratigraphy of geological units including volcanic flows. The spectrometer suite, VenSpec, will obtain global maps of surface emissivity in six wavelength bands using one ultraviolet on the dayside, and five near-infrared spectral transparency windows in the nightside atmosphere, to constrain surface mineralogy and inform evolutionary scenarios; and measure variations of SO2, SO and linked gases in the mesosphere. These variations will be further linked to tropospheric variations and volcanism. The Radio Science Experiment uses the spacecraft-Earth radio link for gravity mapping and atmospheric profiling. EnVision is planned to be launched on an Ariane 62 in 2031 with back-up launch dates in 2032 and 2033. An interplanetary cruise is followed by orbit insertion and then circularisation by aerobraking to achieve the nominal science orbit, a low quasi-polar Venus orbit. NASA is contributing the VenSAR instrument and supplies DSN support. The other payload instruments are contributed by ESA member states, with ASI, DLR, BelSPO, and CNES leading the procurement of SRS, VenSpec-M, VenSpec-H, the USO and VenSpec-U instruments respectively.

Figure 1 EnVision' s payload instruments integrated onto the spacecraft

How to cite: Straume-Lindner, A.-G., Buchwald, R., Crouzet, P.-E., Titov, D., Voirin, T., and Wielders, A.: EnVision: An ESA Medium-class mission to Venus in collaboration with NASA, Europlanet Science Congress 2022, Granada, Spain, 18–23 Sep 2022, EPSC2022-196, https://doi.org/10.5194/epsc2022-196, 2022.

11:00–11:10
|
EPSC2022-374
Jörn Helbert, Ann-Carine Vandaele, Emmanuel Marcq, Severine Roberts, Eddy Neefs, Justin Erwin, Gabriel Guignan, Benjamin Lustrement, Gisbert Peter, Steve Rockstein, Friederike Wolff, Giulia Alemanno, Luisa Lara, Jose Castro, Jeremie Lasue, and Sandrine Vinatier and the The VenSpec team

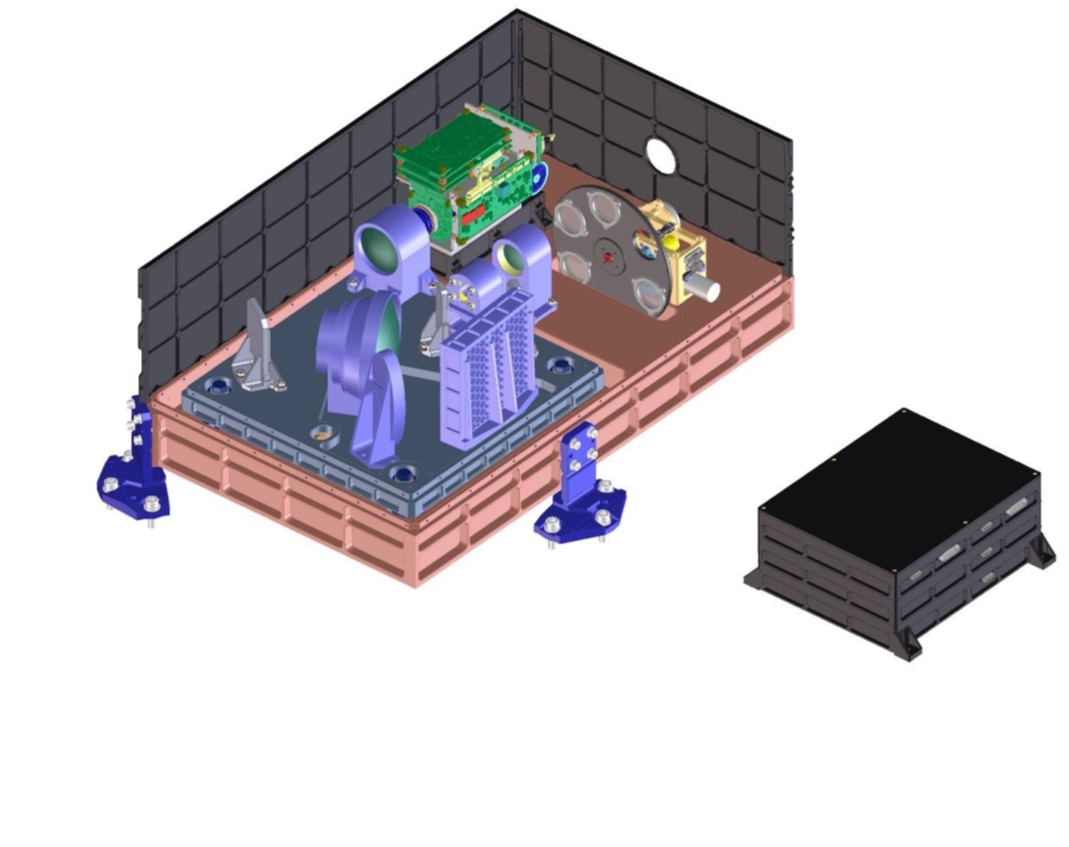
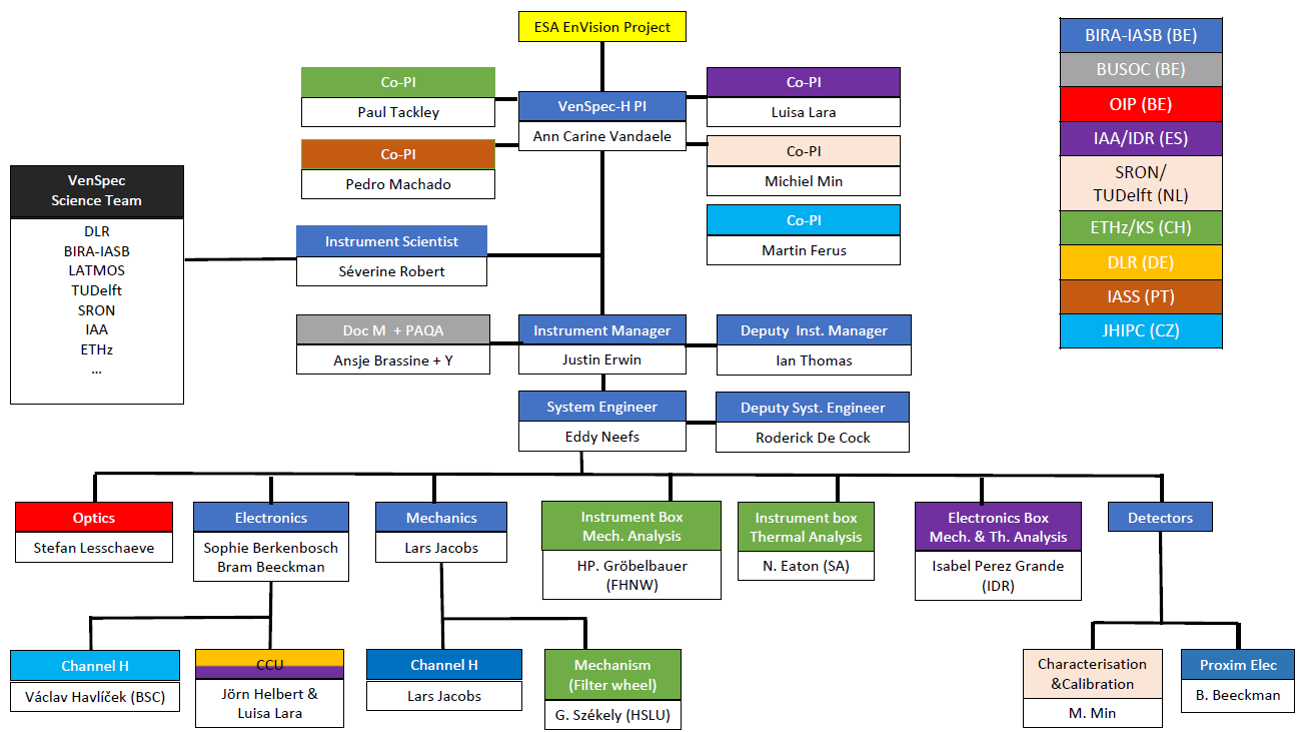
The VenSpec instrument suite on the EnVision mission consists of three channels: VenSpec-M, VenSpec-H, VenSpec-U, and the Central Control Unit (CCU).

VenSpec-H will be dedicated to high-resolution atmospheric measurements. The main objective of the VenSpec- H instrument is to detect and quantify SO2, H2O and HDO in both the troposphere and the mesosphere, to enable characterization of volcanic plumes and other sources of gas exchange with the surface of Venus, complementing VenSAR and VenSpec-M surface, SRS subsurface observations and VenSpec-U observations in the upper cloud layer. A nadir pointed high-resolution infrared spectrometer is the ideal instrument for these observations in different spectral windows between 1 and 2.5 microns, that permit measurements of the troposphere during the night, and of the mesosphere during the day. VenSpec-U will monitor sulphur-bearing minor species (mainly SO and SO2) and the yet unknown UV absorber in Venusian upper clouds and just above. It will therefore complement the two other channels by investigating how the upper atmosphere interacts with the lower atmosphere, and especially characterize to which extent outgassing processes such as volcanic plumes are able to disturb the atmosphere through the thick Venusian clouds. The twin channel (0.2 nm in high-resolution, 2 nm in low-resolution) spectral imager in the 190-380 nm range able to operate in nadir is ideally suited to such a task.

VenSpec-M will provide near-global compositional data on rock types, weathering, and crustal evolution by mapping the Venus surface in five atmospheric windows. The broadest window at 1.02 μm is mapped with two filters to obtain information on the shape of the window. Additional filters are used to remove clouds, water, and stray light. VenSpec-M will use the methodology pioneered by VIRTIS on Venus Express but with more and wider spectral bands, the NASA VERITAS VIRSAR and Envision VenSAR-derived DEMs, and EnVision’s lower orbit compared to Venus Express to deliver near-global multichannel spectroscopy with wider spectral coverage and an order of magnitude improvement in sensitivity. It will obtain repeated imagery of surface thermal emission, constraining current rates of volcanic activity following earlier observations from Venus Express. In combination with the observations provided by the identical VEM instrument on the NASA VERITAS mission VenSpec-M will provide more than a decade of monitoring for volcanic activity, as well as search for surface changes.

In combination, VenSpec spectrometers will provide unprecedented insights into the current state of Venus and its past evolution. VenSpec will perform a comprehensive search for volcanic activity by targeting atmospheric signatures, thermal signatures and compositional signatures, as well as a global map of surface composition. VenSpec will be key to studying the coupled system of surface and atmosphere on Venus following the holistic approach of Envision.

How to cite: Helbert, J., Vandaele, A.-C., Marcq, E., Roberts, S., Neefs, E., Erwin, J., Guignan, G., Lustrement, B., Peter, G., Rockstein, S., Wolff, F., Alemanno, G., Lara, L., Castro, J., Lasue, J., and Vinatier, S. and the The VenSpec team: The VenSpec suite on the ESA Envision mission – a holistic investigation of the coupled surface atmosphere system of Venus, Europlanet Science Congress 2022, Granada, Spain, 18–23 Sep 2022, EPSC2022-374, https://doi.org/10.5194/epsc2022-374, 2022.

11:10–11:20
|
EPSC2022-860
Silvia Tellmann, Janusz Oschlisniok, Martin Pätzold, Caroline Dumoulin, and Pascal Rosenblatt

EnVision has been selected in the M5 call of ESA’s Cosmic Vision program as the next European led mission to Venus. It is dedicated to unravel some of the numerous open questions about Venus' past, current state and future and will help to understand why Venus and Earth evolved so differently.

The Radio Science Experiment (RSE) on EnVision will perform extensive studies of the gravitational field but also Radio Occultations to sense the Venus atmosphere and ionosphere at a high vertical resolution of only a few hundred metres. These radio occultations provide electron density profiles in the ionosphere and atmospheric density, temperature and pressure profiles in the upper troposphere and mesosphere (~40 – 90 km). Additionally, they allow to study the H2SO4 absorption in the Venus cloud layer.

The first radio occultation experiment at Venus was conducted during the Mariner 5 flyby in 1967, followed by Mariner 10, several Venera missions, Magellan, and the Pioneer Venus Orbiter, and Akatsuki. The most extensive radio occultation study of the Venus atmosphere so far was carried out by the VeRa experiment on Venus Express.

EnVision will use two coherent frequencies (X- and Ka-band) to separate dispersive and nondispersive effects. This allows to distinguish between ionospheric wave structures and other noise induced effects in the ionosphere.

The use of Ka-band, which has never been used to sense the Venus atmosphere before, allows to study the H2SO4 absorption in the Venus cloud layer due to its high sensitivity to sulfuric acid absorption. Ka-band is also sensitive to liquid H2SO4 which provides the opportunity (in combination with X-band) to distinguish between gaseous and liquid H2SO4 absorption features on Venus for the very first time.

The short orbital period of EnVision in combination with its very small orbital inclination allows to cover all latitudes, longitudes, local times and solar zenith angles on Venus. Especially short-term variations caused by atmospheric waves can be identified to study traveling or stationary small scale atmospheric structures.

How to cite: Tellmann, S., Oschlisniok, J., Pätzold, M., Dumoulin, C., and Rosenblatt, P.: Radio Sounding of the Venusian Atmosphere and Ionosphere with EnVision, Europlanet Science Congress 2022, Granada, Spain, 18–23 Sep 2022, EPSC2022-860, https://doi.org/10.5194/epsc2022-860, 2022.

11:20–11:30
|
EPSC2022-588
Gabriella Stenberg Wieser and Moa Persson

Venus Dynamics Tracer (VdT) is a proposal for a multi-balloon mission to Venus that was submitted as a response to the ESA call for new M-class missions. This presentation discusses the science questions that could be addressed using two balloons at different altitudes in Venus atmosphere together with an orbiter. The main goal of VdT is to reveal how the atmospheric motion in the Venus atmosphere is driven by the energy originating from absorption of solar radiation. VdT achieves this by in situ measurements in two major regions where driving “motors” are located: Firstly, the cloud layer where visible light is absorbed and drives the vertical motions of the air. Secondly, the upper atmosphere where EUV is absorbed both by neutrals and ions and where energy and momentum are transferred between them. VdT combines the in situ measurements by two balloons at different altitudes in the atmosphere with in situ and remote sensing observations from an orbiter. The mission aims to answer the following questions: 1. What are the roles of the vertical and meridional circulation in maintaining major atmospheric dynamics near the clouds, including the superrotation? and 2. What is the global dynamics of ions and neutrals in the upper atmosphere?

VdT has only 50 kg scientific payload but enables break-through science by a unique distribution of the payload: 40 kg on an orbiter and 5 kg each on two atmospheric balloons. The presentation describes and motivates the suggested payload.

How to cite: Stenberg Wieser, G. and Persson, M.: Venus Dynamics Tracer - exploring Venus with balloons, Europlanet Science Congress 2022, Granada, Spain, 18–23 Sep 2022, EPSC2022-588, https://doi.org/10.5194/epsc2022-588, 2022.

Coffee break
Chairpersons: Gabriella Gilli, Moa Persson
12:00–12:10
|
EPSC2022-77
Dirk Schulze-Makuch, Louis Irwin, and Troy Irwin

The possibility of life in the lower Venusian atmosphere has been given serious scientific consideration for many decades (Sagan, 1961; Cockell, 1999; Grinspoon, 1997; Schulze-Makuch and Irwin, 2002; Schulze-Makuch et al., 2004; Limaye et al., 2018; Limaye et al., 2021; Seager et al., 2021; Bains et al. 2021; Schulze-Makuch, 2021). More recently the idea has come to the forefront of astrobiological attention due to the claimed detection of the biomarker phosphine in the Venusian atmosphere (Greaves et al., 2021a). Whether or not phosphine has been detected is controversial; and if it has, it's significance is also controversial (Villanueva et al., 2021; Lincowski et al., 2021; Greaves et al., 2021b), as is the notion that life can exist in the Venusian atmosphere at all (Kasting and Harman, 2021).

If there is life in the clouds, it almost certainly resides within liquid droplets in the atmosphere (Schulze-Makuch and Irwin, 2004; Irwin and Schulze-Makuch, 2011; Schulze-Makuch, 2021), and most likely within mode 3 particles. Mode 3 particles are aerosols enriched in the lower cloud layer, about the size that would be expected for microbes if covered by a layer of inorganic compounds – including elemental sulfur and hydrophilic filaments. The Venus Pioneer probe made an attempt to identify the interior of these particles in the late 1980s, but unfortunately the pyrolyzer to crack open the particles jammed. This was unfortunate because an organic interior would have been a strong indication for possible life. Even if the cloud particles are not organic and show no evidence of living organisms, they would reveal critical insights about the natural history of Venus.  

Only new missions will provide clarity on whether the Venusian clouds are habitable and could possibly host living organisms. Two missions by NASA and one by ESA are currently in the planning stages to obtain more insights on the environmental conditions and potential habitability of the Venusian clouds. The results of these missions will surely reveal many important insights, but we propose here the more direct approach of collecting cloud droplets within the Venusian atmosphere with a return to Earth for their analysis. We have considered both an in-situ life detection and a sample return approach to resolve the question of whether the lower Venusian atmosphere may contain life.  Critical to both approaches is that the interior of the cloud droplet particles be analyzed.  The obvious instrument for the molecular analysis would be a gas chromatograph mass spectrometer (GC-MS) similar to the one used by the Curiosity Rover on Mars but including such an instrument for an in-situ life detection experiment would likely be weight-prohibitive.

Thus, we conclude that a sample return mission would seem to be more appropriate as this would also allow a much more detailed investigation of the cloud particles. If organic compounds are detected, a detailed analysis of the molecules and possible macromolecules can be conducted to determine whether the biochemical building blocks of Venusian life differ from those of life on Earth.  If not, we will obtain important insights about the natural history of Venus. Of the different mission approaches for a sample return which have been proposed, we have concluded that the NUVOLE SRS mission architecture based on a glider concept (Sindoni et al., 2021) is currently the most suitable approach.


References:

Bains W., Petkowski J.J., et al. (2021) Production of ammonia makes Venusian clouds habitable and explains observed cloud-level chemical anomalies. Proc. Natl. Acad. Sci. USA, 118.

Cockell C. S. (1999) Life on Venus. Planet. Space Sci., 47: 1487-1501.

Greaves J.S., Richards A.M.S., et al. (2021a) Phosphine gas in the cloud decks of Venus. Nature Astronomy, 5: 655-664.

Greaves J.S., Richards A.M.S., et al. (2021b) Addendum: Phosphine gas in the cloud deck of Venus. Nature Astronomy, 5: 726-728.

Grinspoon D.H. (1997) Venus Revealed: A New Look Below the Clouds of Our Mysterious Twin Planet. Perseus Publishing, Cambridge, Massachusetts.

Irwin L. N., and Schulze-Makuch D. (2011) Cosmic Biology: How Life Could Evolve on Other Worlds. Praxis, New York.

Kasting J.F., and Harman C.E. (2021) Venus might never have been habitable. Nature, 598: 259-260.

Limaye S.S., Mogul R., et al. (2021) Venus, an Astrobiology Target. Astrobiology, 21: 1163-1185.

Limaye S. S., Mogul R., et al. (2018) Venus' Spectral Signatures and the Potential for Life in the Clouds. Astrobiology, 18: 1181-1198.

Lincowski A.P., Meadows V.S., et al. (2021) Claimed detection of PH3 in the clouds of Venus is consistent with mesospheric SO2. Astrophys. J. Lett., 908: L44.

Sagan C. (1961) The planet Venus. Science, 133: 849-858.

Schulze-Makuch D. (2021) The case (or not) for life in the Venusian clouds. Life, 11: 255. https://doi.org/10.3390/life11030255.

Schulze-Makuch D., Grinspoon D.H., et al. (2004) A sulfur-based survival strategy for putative phototrophic life in the Venusian atmosphere. Astrobiology, 4: 11-18.

Schulze-Makuch D., and Irwin L.N. (2002) Reassessing the possibility of life on Venus: proposal for an astrobiology mission. Astrobiology, 2: 197-202.

Schulze-Makuch D., and Irwin L.N. (2004) Life in the Universe: Expectations and Constraints. Springer-Verlag, Berlin.

Seager S., Petkowski J.J., et al. (2021) The Venusian lower atmosphere haze as a depot for desiccated microbial life: A proposed life cycle for persistence of the Venusian aerial biosphere. Astrobiology, 21: 1206-1223.

Sindoni E., Vignaud P., et al. (2021) Feasibility study of a Venus atmosphere sample retrieval mission. In: 72nd International Astronautical Congress (IAC), IAC-21-A2.5.2., Dubai, United Arab Emirates.

Villanueva G.L., Cordiner M., et al. (2021) No evidence of phosphine in the atmosphere of Venus from independent analyses. Nature Astronomy, 5: 631-635.

How to cite: Schulze-Makuch, D., Irwin, L., and Irwin, T.: The Case for a Mission to Return Cloud Particles from the Lower Atmosphere of Venus, Europlanet Science Congress 2022, Granada, Spain, 18–23 Sep 2022, EPSC2022-77, https://doi.org/10.5194/epsc2022-77, 2022.

Surface and lower atmosphere observations and modelling
12:10–12:20
|
EPSC2022-407
Julia Maia and Mark Wieczorek

One of the most informative ways of studying the interior structure and geodynamics of terrestrial planets is the joint investigation of gravity and topography data. In the case of Venus, this is in fact one of the only sources of information about the planet's interior, along with the lack of an active dynamo (e.g., Phillips and Russell, 1987), estimations of the moment of inertia (Margot et al., 2021) and tidal love numbers (Konopliv and Yoder, 1996). The firsts global gravity-topography analyses of Venus revealed unique characteristics. For long wavelengths, the planet presents correlations which are considerably higher than for Earth (Sjogren et al., 1980). Moreover, the apparent depth of compensation is large, globally deeper than 100 km (e.g., Kiefer et al., 1986). By analyzing the wavelength-dependent ratio between gravity and topography, the so-called spectral admittance, Kiefer et al. 1986 concluded that Venus' long-wavelength topography is mostly supported dynamically, i.e., by convective flows in the mantle.

Although today we know that some Venusian highlands, such as the crustal plateaus (e.g., Simons et al., 1997, Maia and Wieczorek, 2022) and Ishtar Terra (e.g., Kucinskas et al., 1996), are more consistent with being in a state of isostasy with significant variations on crustal thickness, it is broadly accepted that dynamic compensation is important on a global scale, notably at long wavelengths. Hence, one can attempt to predict Venus' gravity field and surface displacement using a geophysical model of mantle convection and how this couples to the surface. One of the most used instantaneous dynamic loading models was developed by Hager and Clayton (1989), where mantle flows, triggered by density anomalies, depend on radial viscosity variations.  On Venus, this model has been adopted to estimate mantle mass anomalies maps and to investigate the planet's mantle viscosity profile (e.g., Herrick and Phillips, 1992; Pauer et al. 2006; James et al. 2013).  Herrick and Phillips (1992) conclude that Venus mantle is consistent with a constant viscosity profile while Pauer et al. (2006) suggests that Venus could be more similar to Earth, where the mantle viscosity increases with depth and with a possible low-viscosity zone in the upper mantle.

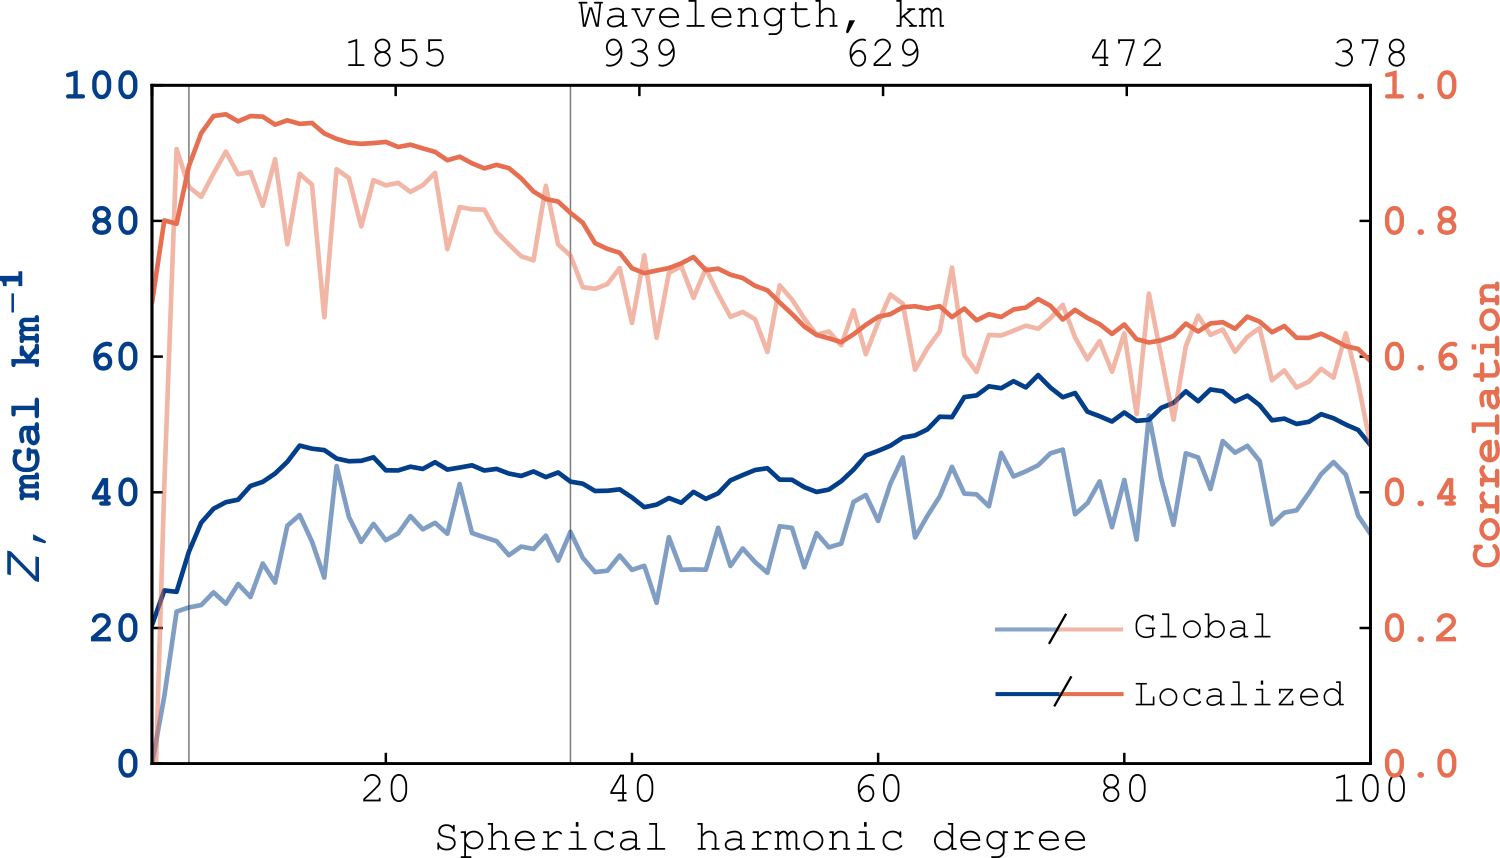
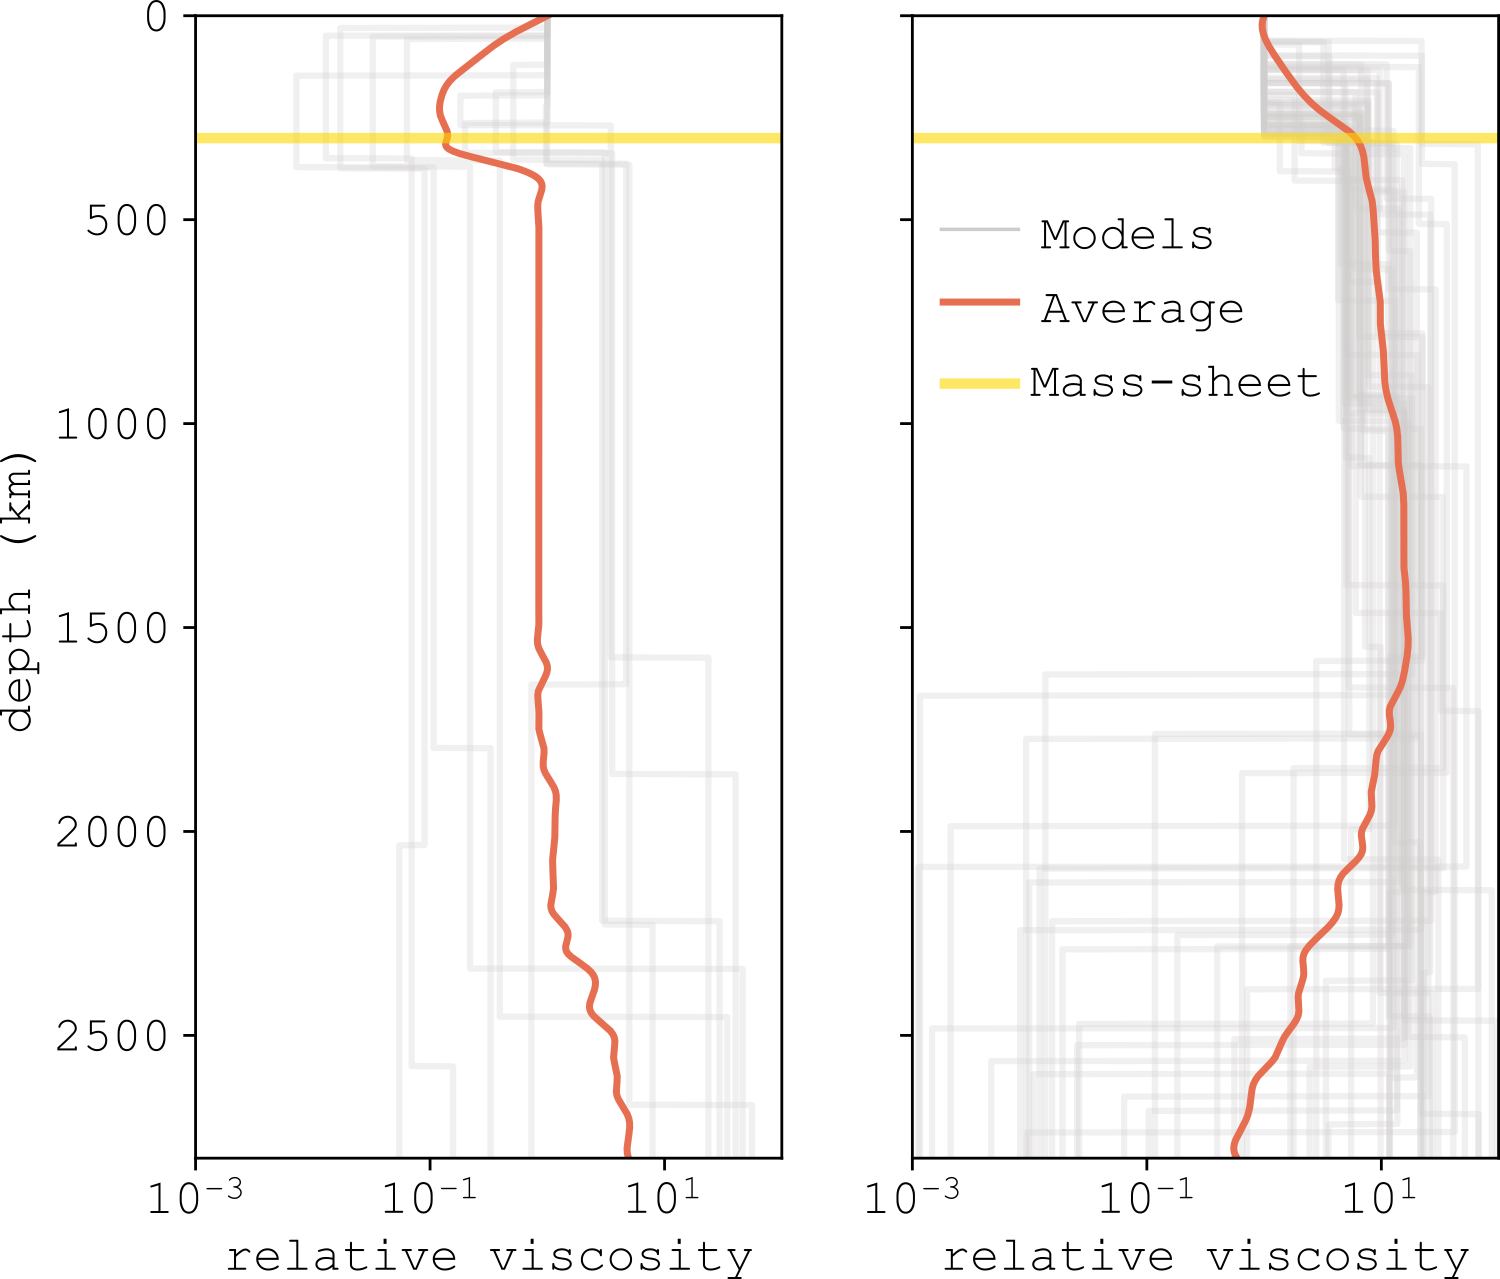
These studies investigate the global topography and gravity signals to make their predictions. However, there are major highlands on Venus, such as Ovda, Thetis and Ishtar Terra, that are inconsistent with dynamic support. Using the Hager and Clayton (1989) dynamic model we do a new mantle viscosity investigation that excludes those areas where the gravity and topography signals are best modeled by a combination of Airy isostasy and lithospheric flexure. Our study is performed in the spectral domain and a multitaper spatio-spectral localization approach (Wieczorek and Simons, 2007) is adopted to suppress the signals of Ishtar Terra and Western Aphrodite Terra. The figure below shows a comparison between Venus global spectral admittance and correlation and the tapered estimations. There is a clear increase in admittance and correlation when the localization tapers are applied, specially for long wavelengths where dynamic loading is expected to dominate. The difference is largely attributed to the high elevations associated with the highlands that are near a state of isostasy, and hence have low associated gravity signals.

Regarding the dynamic modeling, we consider a viscosity profile with four layers, where the viscosity and depth of each layer are randomly sampled following a log-uniform and a uniform distribution, respectively. After computing the predicted topography and gravity field, we multiply the data by several different orthogonal localization windows and calculate the predicted admittance.  The misfits between observations and predictions are computed in order determine the accepted models and constrain the mantle viscosity structure.

The range of models that properly fit the observed admittance can be roughly divided into two groups, illustrated in figure below. The first is overall characterized by a layer of relative low viscosity beneath the lithosphere with maximum thickness of about 400 km, followed by an increase of viscosity with depth down to the core-mantle boundary. The second set of models does not present a clear viscosity boundary between the lithosphere and the underlying mantle and, as for the first group, the viscosity tends to increase with depth. In this scenario, however, a large number of models present a basal low viscosity zone in the mantle with thicknesses ranging from about 300 to 1000 km. In the next steps of our study, we intend to pinpoint what is the most likely viscosity structure of Venus’ mantle, interpreting the results in the framework of a Bayesian analysis to assess the likelihood of each of these scenarios and considering the physical implications of the different models.

Hager, B. and Clayton, R. (1989) Mantle Convection, 657-763; Herrick, R. and Phillips, R. (1992) JGR, 97; James, P. et al. (2013) JGR-Planets, 118; Kiefer et al. (1986) GRL, 13; Konopliv and Yoder (1996) GRL, 23; Kucinskas et al. (1996) JGR, 101; Maia and Wieczorek (2022) JGR-Planets, 127; Margot et al. (2021) Nat Astron; Pauer et al. (2006) JGR, 111; Phillips and Russel (1987); Simons et al. (1997) JGI, 131; Sjogren et al. (1980) JGR, 85; Wieczorek and Simons (2007) J Fourier Anal Appl, 13

How to cite: Maia, J. and Wieczorek, M.: Towards new insights of Venus mantle viscosity structure, Europlanet Science Congress 2022, Granada, Spain, 18–23 Sep 2022, EPSC2022-407, https://doi.org/10.5194/epsc2022-407, 2022.

12:20–12:30
|
EPSC2022-371
The geologic evolution of Imdr Regio: a possible active hot spot on Venus.
(withdrawn)
Iván López, Lucía Martín, Alberto Jímenez-Díaz, Piero D'Incecco, Justin Filiberto, and Gaetano Di Achille
12:30–12:40
|
EPSC2022-1121
|
ECP
Shubham Kulkarni, Colin Wilson, and Patrick Irwin

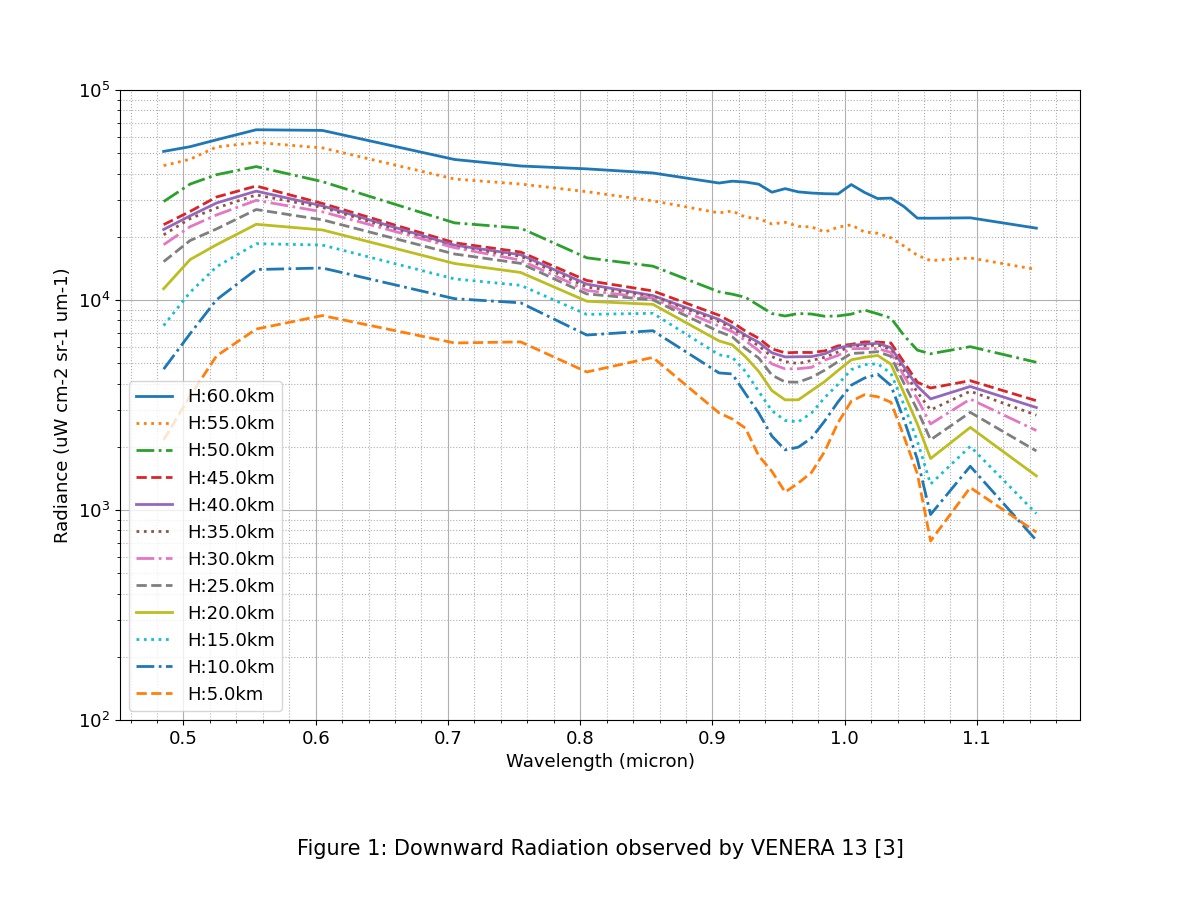
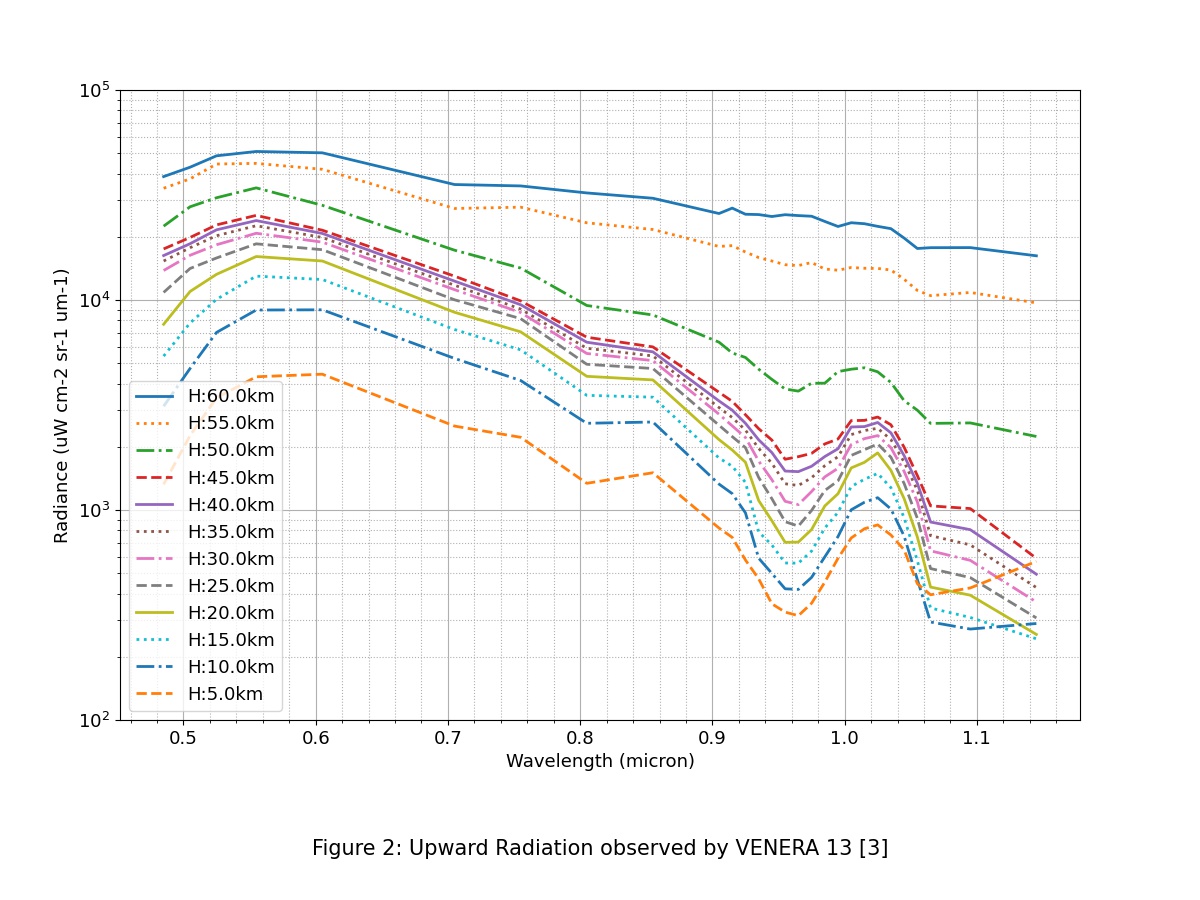
The scanning spectrophotometers (IOAV-2) onboard Venera 13 and 14 probes recorded the internal radiation field from an altitude of 62 km down to the surface, covering a wavelength range of 0.48 to 1.14 μm. The radiation was recorded from six directions with a field of view of 20°. The original data from the magnetic tapes were lost. However, a secondary dataset was created using the graphic material published earlier that contains the radiation only from two directions (one close to the zenith and one close to the nadir). While analysing the secondary dataset, [1] reported a rapid change in radiances indicative of a near-surface cloud layer. The presence of such a cloud layer could be indicative of aeolian or condensing species; furthermore, it would affect the viability of surface imaging from a balloon and other missions. Motivated by upcoming Venus missions, we re-analyze this dataset to learn more about a possible near-surface cloud layer. 

The secondary dataset is available in two formats: (a) High spectral resolution with low vertical resolution (e.g. 68 wavelengths x 11 altitudes for Venera 13) and (b) Low spectral resolution with high vertical resolution (e.g. 28 wavelengths x 52 altitudes for Venera 13). In this work, we use the second format to capture more information about the vertical structure of the atmosphere. We modify the NEMESIS radiative transfer and retrieval tool [2] for simultaneous fitting of upward and downward internal radiation at all altitudes. For example, the downward and upward spectra captured by Venera 13 [3] at twelve predefined altitudes, are shown in Figure 1 and Figure 2 respectively. 

Before assessing the presence and properties of a near-surface cloud layer, it is necessary to first match the downwelling radiance from the main cloud deck in the atmosphere of Venus. Hence, NEMESIS is first used to retrieve particle properties in the main cloud deck. Using retrieved cloud abundances we set up the model atmosphere which is used to retrieve the properties of a near-surface cloud layer. Subsequently, the simulations are run for different particle sizes, abundances, and compositions to find the best match with the measured spectra. The results are used to comment on the existence of the near-surface cloud layer and on the properties of its constituent particles. Uncertainties associated with the particularities of the Venera probe measurements and their effects on assessing the presence of near-surface cloud layer and subsequent retrievals are briefly discussed in the end. 


References: 

[1] Grieger, B., Ignatiev, N. I., Hoekzema, N. M., and Keller, H. U., in European Space Agency, (Special Publication) ESA SP, number 544, 63–70 (ESA Publications Division, Noordwijk, Netherlands, 2004). 

[2] Irwin, P. G., Teanby, N. A., de Kok, R., Fletcher, L. N., Howett, C. J., Tsang, C. C., Wilson, C. F., Calcutt, S. B., Nixon, C. A., and Parrish, P. D., Journal of Quantitative Spectroscopy and Radiative Transfer 109(6), 1136–1150 (2008).  

[3] Moroz, V. I., Moshkin, B. E., Ekonomov, A. P., Golovin, Y. M., Gnedykh, V. I., and Grigorev, A. V., Soviet Astronomy Letters (1982). 

How to cite: Kulkarni, S., Wilson, C., and Irwin, P.: Investigating the properties of a near-surface cloud layer from Venera 13 and 14 descent probe data, Europlanet Science Congress 2022, Granada, Spain, 18–23 Sep 2022, EPSC2022-1121, https://doi.org/10.5194/epsc2022-1121, 2022.

Middle and upper atmosphere observations and modelling
12:40–12:50
|
EPSC2022-1054
Takehiko Satoh, Takao Sato, Takeshi Horinouchi, Takeshi Imamura, and George Hashimoto

The 2-µm infrared camera (IR2) onboard Akatsuki observed a remarkable cloud feature in the Venus' night-side disk, a sharp discontinuity of cloud opacity which subtends latitudinally to some thousands of km (Peralta et al., 2020).  Though obvious and seemingly common in the Venus' atmosphere as similar features can be identified in imagery since the beginning of the night-side observations (Allen and Crawford, 1984), the mechanism of this emormous cloud cover (ECC) has not yet been explained.

To characterize this ECC (aerosol size parameters and column numbers), we have analyzed the Akatsuki/IR2 data, as well as the Venus Express/VIRTIS-M data. Six sets of the Akatsuki/IR2 data (MM-DD = 03-27, 07-22, 08-09, 08-18, 08-27, and 09-06) are measurable with varying photometric uncertainties, due to contaminations from the intense day crescent. Seven VEx/VIRTIS data, as tabulated in Peralta et al. (2020), are also measured by the consistent method with that for IR2 data.
A reference region, which is just west of the discontinuity and is seemingly not affected by the ECC, is defined as the background cloud (BC) region. Radiances at the BC and the ECC regions are measured for two IR2 filter passbands (1.735 and 2.26 µm). They are plotted in the correlation plot (radiance at 2.26 µm in horizontal axis and radiance at 1.735 µm in vertical axis). The BC-to-ECC slope can be used to infer the aerosol size and abundance that changes the BC region to the ECC region.

Comparison of obtained characteristics of the ECC for different observing times will be presented and implication to the possible mechanism of this large-scale phenomenon will be discussed.

How to cite: Satoh, T., Sato, T., Horinouchi, T., Imamura, T., and Hashimoto, G.: A photometric study of the Enormous Cloud Cover seen in theVenus' night-side disk, Europlanet Science Congress 2022, Granada, Spain, 18–23 Sep 2022, EPSC2022-1054, https://doi.org/10.5194/epsc2022-1054, 2022.

12:50–13:00
|
EPSC2022-921
Arnaud Mahieux, Séverine Robert, Frank Mills, Loïc Trompet, Shohei Aoki, Arianna Piccialli, Kandis Lea Jessup, and Ann Carine Vandaele

We report on detection and upper-limit of H2CO, O3, NH3, HCN, N2O, NO2, and HO2 above the cloud deck using the SOIR instrument on-board Venus Express.

The SOIR instrument performs solar occultation measurements in the IR region (2.2 - 4.3 µm) at a resolution of 0.12 cm-1, the highest of all instruments on board Venus Express. It combines an echelle spectrometer and an AOTF (Acousto-Optical Tunable Filter) for the order selection. SOIR performed more than 1500 solar occultation measurements leading to about two millions spectra.

The wavelength range probed by SOIR allows a detailed chemical inventory of the Venus atmosphere at the terminator in the mesosphere, with an emphasis on vertical distribution of the gases.

In this work, we report detections in the mesosphere, between 60 and 100 km.

Implications for the mesospheric chemistry will also be addressed.

How to cite: Mahieux, A., Robert, S., Mills, F., Trompet, L., Aoki, S., Piccialli, A., Jessup, K. L., and Vandaele, A. C.: Minor species in the Venus mesosphere from SOIR on board Venus Express: detection and upper limit profiles of H2CO, O3, NH3, HCN, N2O, NO2, and HO2, Europlanet Science Congress 2022, Granada, Spain, 18–23 Sep 2022, EPSC2022-921, https://doi.org/10.5194/epsc2022-921, 2022.

13:00–13:10
|
EPSC2022-309
Yukiko Fujisawa, Shin-ya Murakami, Norihiko Sugimoto, Masahiro Takagi, Takeshi Imamura, Takeshi Horinouchi, George L. Hashimoto, Masaki Ishiwatari, Takeshi Enomoto, Takemasa Miyoshi, Hiroki Kashimura, and Yoshi-Yuki Hayashi

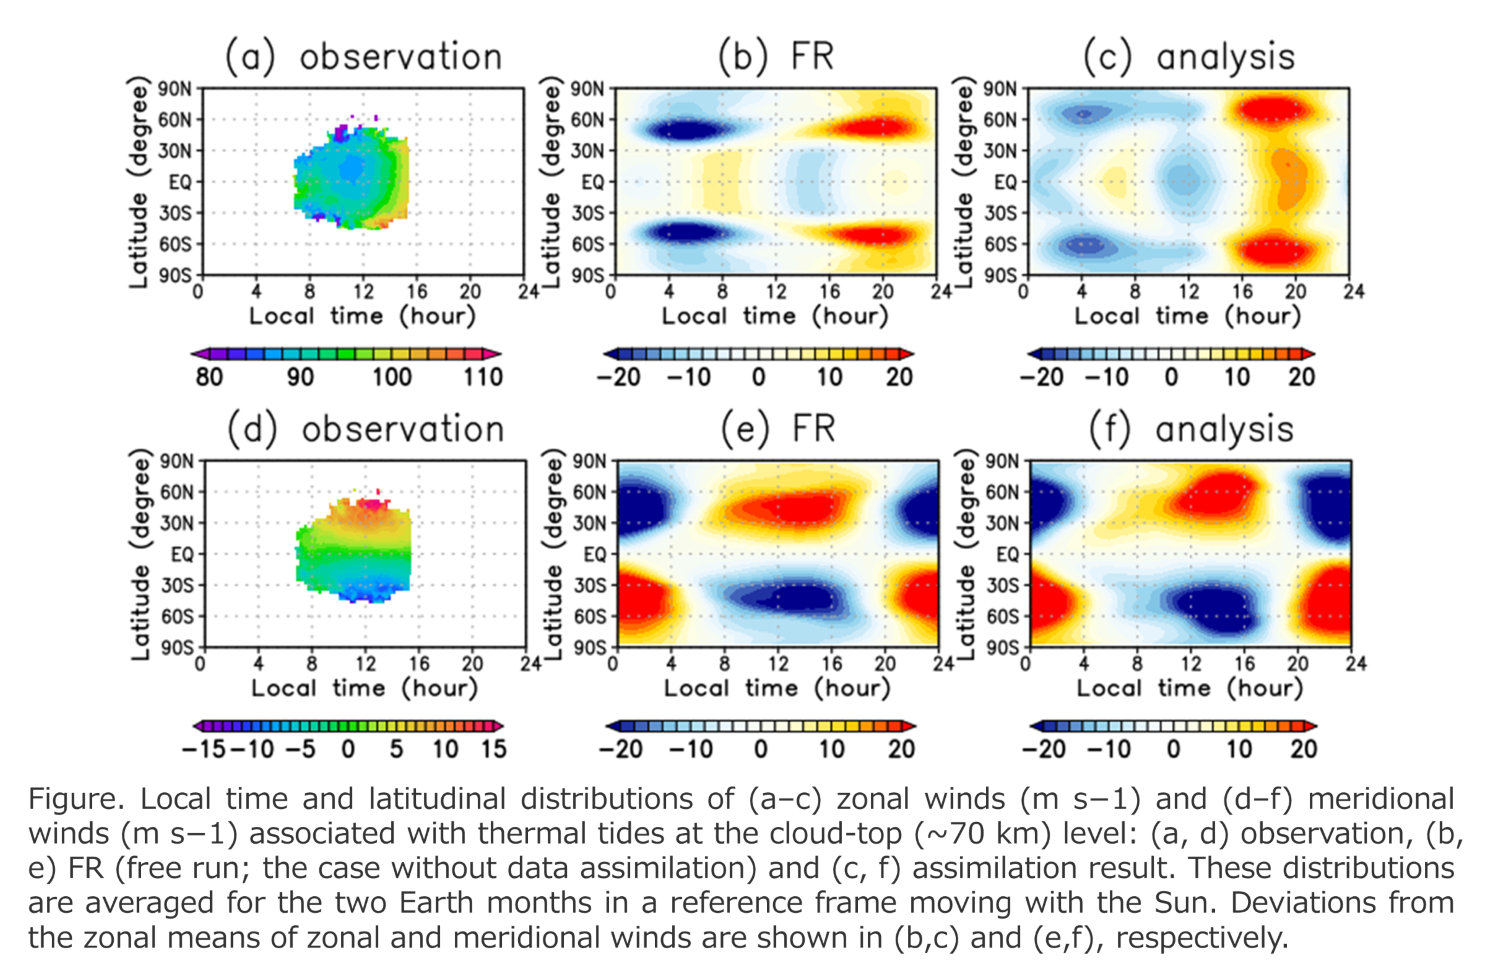
Observations of the Venus Climate Orbiter “Akatsuki” provide us with horizontal distributions of the horizontal winds derived from cloud tracking of the Ultraviolet Imager (UVI) and of temperature observed by the Longwave Infrared Camera (LIR). However, these observations are limited in altitude, local time (day or night side), and frequency. Then it is difficult to elucidate the general circulation of the Venus atmosphere, including various temporal and spatial scales, only from observations. In this study, we produced a Venus dataset (analysis) that has high temporal and spatial resolutions by assimilating horizontal winds derived by the Akatsuki observations. At the top of the cloud layer of Venus, there are planetary-scale atmospheric waves that are excited by the solar heating and move with the sun, called the thermal tides. In this presentation, we focused on thermal tides to verify the analysis.

We use the Venus atmospheric data assimilation system “ALEDAS-V" (Sugimoto et al., 2017) [1] for assimilation and the Venus atmospheric general circulation model “AFES-Venus" (Sugimoto et al., 2014) [2] for ensemble forecasts. AFES-Venus is a full nonlinear dynamical GCM on the assumption of hydrostatic balance, designed for the Venus atmosphere. ALEDAS-V uses the Local Ensemble Transform Kalman Filter, and is the first data assimilation system for the Venus atmosphere. We assimilated the cloud top (~70km) zonal and meridional winds obtained by tracking morphology, using Akatsuki UVI data (Horinouchi et al., 2021) [3] from September 1st to December 31st, 2018. The assimilation data (analysis) from October 1st to November 30th, 2018, is analyzed, because the root-mean-square-deviations (RMSD) from FR (free run; the case without data assimilation) are stable.

Figures (a) and (d) show the observed zonal and meridional winds, respectively. The zonal wind has a local minimum near 11 LT (local time) around the equator (Figure a). The meridional wind is the weakest at the equator and increases with latitude, and the amplitude is maximum around noon (Figure d) in the local time direction. Note that these winds obtained from observations exist only the dayside equatorward of 50° latitudes (Figure a and d).

Figures (b) and (e) show the deviations from the zonal means of zonal and meridional winds at an altitude of 70 km in the FR, respectively. For zonal wind, diurnal (zonal wavenumber 1) and semidiurnal (zonal wavenumber 2) tides are dominant at latitudes poleward and equatorward of 30, respectively (Figure b). The zonal wind deviation has a local minimum at 14-15LT, which is ~ 2 hours behind the observation (Figures a and b). The meridional wind deviation is polar and equatorial on the dayside and nightside, respectively (Figure e), and this distribution is consistent with Akatsuki's observation (Figure d).

Figures (c) and (f) show the zonal and meridional winds as a result of assimilation, respectively. The zonal wind in the equatorial region have a local minimum near 11 LT. The assimilation improved the semidiurnal tide closer to the observations (Figures a and c). The meridional wind is not so different from FR. This is probably because FR was originally very similar to observations (Figures d and f). These results are consistent with a previous study by Sugimoto et al. (2019) [4]. In addition, while the observed winds exist only on the dayside, the results of assimilation show that the horizontal winds field is modified significantly even on the nightside. It is suggested that spatially limited data assimilation can improve the general circulation of GCM.

In the future work, we are planning to release the assimilation dataset as the “objective analysis data” of Venus for the first time in the world.

[1] Sugimoto, N., et al. Development of an ensemble Kalman filter data assimilation system for the Venusian atmosphere. Scientific Reports 7(1), 9321 (2017).

[2] Sugimoto, N., et al. Baroclinic instability in the Venus atmosphere simulated by GCM. J. Geophys. Res. Planets 119, 1950–1968 (2014).

[3] Horinouchi, T., et al. Venus Climate Orbiter Akatsuki Cloud Motion Vector Data Set v1.0, JAXA Data Archives and Transmission System (2021).

[4] Sugimoto, N., et al. Impact of data assimilation on thermal tides in the case of Venus Express wind observation. Geophys. Res. Lett. 46, 4573–4580 (2019).

How to cite: Fujisawa, Y., Murakami, S., Sugimoto, N., Takagi, M., Imamura, T., Horinouchi, T., Hashimoto, G. L., Ishiwatari, M., Enomoto, T., Miyoshi, T., Kashimura, H., and Hayashi, Y.-Y.: Thermal tides reproduced in the assimilation results of horizontal winds obtained from Akatsuki UVI observations, Europlanet Science Congress 2022, Granada, Spain, 18–23 Sep 2022, EPSC2022-309, https://doi.org/10.5194/epsc2022-309, 2022.

13:10–13:20
|
EPSC2022-1141
Martin Pätzold, Matthias Hahn, Janusz Oschlisniok, Kerstin Peter, and Silvia Tellmann

RIU-Planetary Reseach has won funding support for the reprocessing and the interpretation of the original raw open-loop occultation data taken by the Pioneer Venus Orbiter radio science experiment ORO from 1979 to 1988. These original raw open-loop data are available from the PDS while original processed atmospheric and ionospheric (temperature and electron density, respectively) profiles from the Venus atmosphere are not. 

We shall apply modern software code together with a new version of the Venus gravity field and newly processed orbit data available as SPICE kernels.

A review of the original data sets showed a variety of observation lengths ranging from a few minutes to about 20 minutes duration. The longer observation sets contain presumably ingress and egress data. We shall present atmospheric and ionospheric profiles processed from exemplary original Pioneer Venus Orbiter raw open-loop data setsand compare them with VEX VeRa radio occultation profiles for comparable observation conditions. 


How to cite: Pätzold, M., Hahn, M., Oschlisniok, J., Peter, K., and Tellmann, S.: Reprocessing Pioneer Venus Orbiter radio occultation data, Europlanet Science Congress 2022, Granada, Spain, 18–23 Sep 2022, EPSC2022-1141, https://doi.org/10.5194/epsc2022-1141, 2022.

13:20–13:30
|
EPSC2022-19
|
ECP
|
MI
Lina Hadid and the MSA, MIA, MEA and MAG teams

On August 10, 2021, the Mercury-bound BepiColombo spacecraft flew for the second time by Venus for a Gravitationally Assist Maneuver. During this second flyby of Venus, a limited number of instruments were turned on, allowing unique observations of the planet and its environment. Among these instruments, the Mass Spectrum Analyzer (MSA) that is part of the particle analyzer consortium onboard the magnetospheric orbiter (Mio) was able to acquire its first ion composition measurements in space. As a matter of fact, during a limited time interval upon approach of the planet, substantial ion populations were recorded by MSA, with characteristic energies ranging from about 20 eV up to a few hundreds of eVs. Most notably, comparison of the measured Time-Of-Flight spectra with calibration data reveals that these populations are of planetary origin, containing both Oxygen and Carbon ions. The Oxygen observations are to some extent consistent with previous in situ measurements from the ion mass composition sensor onboard Venus Express and Pioneer Venus Orbiter. As for Carbon, we report here the first ever in situ evidences of such an ion species in the near-Venus environment from around 6 planetary radii. Relative to the predominant O+, we show that the abundance of C+ is about ~30%. Furthermore, changes in the orientation of the magnetic field suggest that these planetary ions are located in the distant magnetosheath flank in the immediate vicinity of the bow-shock region.

How to cite: Hadid, L. and the MSA, MIA, MEA and MAG teams: Evidence of planetary carbon and oxygen ions in the outer flank of Venus magnetosheath, Europlanet Science Congress 2022, Granada, Spain, 18–23 Sep 2022, EPSC2022-19, https://doi.org/10.5194/epsc2022-19, 2022.

Session wrap-up
Display time: Mon, 19 Sep 08:30–Wed, 21 Sep 11:00

Posters: Mon, 19 Sep, 18:45–20:15 | Poster area Level 1

Chairpersons: Anne Grete Straume-Lindner, Gabriella Gilli, Moa Persson
L1.18
|
EPSC2022-76
|
ECP
Joanna Egan, Alexander James, John Plane, Benjamin Murray, and Wuhu Feng

Background

In situ probe measurements and remote sensing have revealed that Venus has a highly organised cloud system. Comparisons between models of the expected spectra and observations reveal unexplained absorption in the near-UV to blue region of the spectrum. While many candidates for this “unknown absorber” have been proposed over the years, none have been conclusively demonstrated to match the physical and optical behaviour observed (Pérez-Hoyos et al., 2018, JGR Planets, 123).

One such candidate is ferric chloride (Krasnopolsky, 2017, Icarus, 286; Zasova et al., 1981, ASR, 1). Attempts to reliably determine its suitability have been hampered by the scarcity of representative spectra available. Absorbance spectra generally used in the literature are measured in ethyl acetate (Aoshima et al., 2013, Polymer Chemistry, 4), and therefore may not be representative of the absorption produced by ferric chloride in the Venusian clouds.

In addition to the absorption spectrum produced, the behaviour of absorber candidates must also be considered, including their rates and locations of production and loss, transport mechanisms, and lifetimes in the atmosphere. While much of this behaviour must be examined in atmospheric models, laboratory studies to establish reaction pathways and measure rates are needed to provide as much quantitative data as possible for model development.


Method and results

Literature spectra for ferric chloride employ UV-visible spectrometry using ethyl acetate as a solvent. We present absorption spectra of ferric chloride in sulphuric acid. This change of solvent produces an environment more closely aligned to that on Venus, where ferric chloride, if present, may exist as an impurity in the micron-sized sulphuric acid cloud droplets (Petrova, 2018, Icarus, 306).

In addition, mass spectrometry was used to investigate the kinetics and products of reactions of ferric chloride that could occur in the Venusian atmosphere. Behaviour predicted by these experiments can then be included in atmospheric models to test the lifetime and transport of ferric chloride and its reaction products in the atmosphere.


Conclusions

The unknown absorption was first observed close to 100 years ago, yet the mystery of its cause remains unsolved. More representative spectra of ferric chloride and a greater understanding of its behaviour in the atmosphere of Venus are critical to advancing the identification of the unknown absorber. As the absorber is located towards the top of the clouds and absorbs in the near-UV to blue region, it is responsible for large amounts of absorption of incident sunlight, and therefore has a significant impact on the Venusian energy budget. Accurate atmospheric modelling of the planet therefore requires an understanding of the absorber which can only be achieved once it has been conclusively identified.

How to cite: Egan, J., James, A., Plane, J., Murray, B., and Feng, W.: Laboratory experiments to constrain the identity of Venus’s unknown UV absorber, Europlanet Science Congress 2022, Granada, Spain, 18–23 Sep 2022, EPSC2022-76, https://doi.org/10.5194/epsc2022-76, 2022.

L1.19
|
EPSC2022-198
Martin Ferus, Giuseppe Cassone, Paul Rimmer, Franz Saija, Klaudia Mráziková, Antonín Knížek, and Svatopluk Civiš

Several of the Venera, Vega and Pioneer probe data as well as ground based observation support the presence of so-called Redox Disequilibrium Pairs (RDPs) in atmosphere of so hostile world as Venus (Greaves 2021). State of the art chemical networks cannot explain origin of an important RDP, phosphine, in oxidized atmosphere of Venus by a conventional processes (Bains 2021). We used the hybrid Density Functional Theory (DFT) for investigation of a series of chemical reaction pathways leading to the reduction of phosphate monoxide to phosphine. Our calculations indicated that a reaction network similar to photochemical synthesis of methane from carbon monoxide over acidic surfaces suggested for Mars (Civiš 2019) can also occur in clouds of Venus. As a seminal step, we have explored – via state-of-the-art quantum-based calculations – the a priori energetic feasibility of the following reaction:

HCO(radical) + PO = CO2 + PH (biradical).

Our calculations have shown that chemical conversion is constituted of three steps. Two of them are energetically favoured, however, the final conversion to phosphine is hardened by a significant activation barrier. This barrier can be overcome by a reaction of OPH radical with hydrogen radical. For assessing the potential of the newly introduced reaction mechanisms, models of the Venus and early Earth atmospheres in ARGO code and modified STAND chemical network were created and verified. Comparison of reaction yields suggests that this pathway is potentially effective enough and could be the source of phosphine recently discovered on Venus. 

We acknowledge the support provided by the Czech Science Foundation within the project reg. no. 21-11366S and by ERDF/ESF "Centre of Advanced Applied Sciences" (No. CZ.02.1.01/0.0/0.0/16_019/0000778). We acknowledge support of the Czech Academy of Sciences, Strategy AV21, project VP16. The Czech team is part of the VenSpec-H Consortium onboard the ESA EnVision mission.

References:

Civiš S. et al.: Formation of Methane and (Per)Chlorates on Mars. ACS Earth Space Chem. 2019, 3, 2, 221–232.

Bains W. et al.: Phosphine on Venus Cannot Be Explained by Conventional Processes. Astrobiology 2021, 10 (21), 1277-1304.

Greaves J. S. et al.:  Phosphine gas in the cloud decks of Venus. Nature Astronomy 2021, 5, 655–664.

How to cite: Ferus, M., Cassone, G., Rimmer, P., Saija, F., Mráziková, K., Knížek, A., and Civiš, S.: Abiotic chemical routes towards the phosphine synthesis in the atmosphere of Venus, Europlanet Science Congress 2022, Granada, Spain, 18–23 Sep 2022, EPSC2022-198, https://doi.org/10.5194/epsc2022-198, 2022.

L1.20
|
EPSC2022-399
|
ECP
Alexandra Le Contellec, Chloé Michaut, Francesco Maccaferri, and Virginie Pinel

Traces of volcanic deposits and evidence of magmatic intrusions are often found within complex impact craters (~10 to 100 km in radius) at the surface of terrestrial planets. Relying on these observations on the Moon as well as on mechanical models of magma ascent, Michaut and Pinel (2018) proposed that the surface unloading due to a crater could provide a driving pressure to the magma stalling at depth, allowing its ascent through the crust despite its negative buoyancy. This effect increases with the impact crater size.

On Venus, RADAR observations of the surface from the MAGELLAN NASA mission suggests two categories of impact craters: bright-floored and dark-floored craters (Figure 1), dark-floored ones representing a third of the crater population (Herrick et al, 1997). Both categories are found in the high plateaus as well as in the low volcanic plains.

Dark-floored craters are interpreted as craters having smooth floors, hence appearing dark on radar images, because of partial filling by lava after their formation (Sharpton, 1994). Bright-floored craters would therefore represent a non-modified stage for craters. Dark-floored craters indeed appear shallower than bright-floored ones in rim-to-floor depth measurements. Since the smooth surface is localized within the crater and is in general surrounded by a bright aureole, these observations suggest that the magma could indeed ascend through the crust because of the crater unloading.

Here, we use mechanical models of magma ascent in the crust combined with quantitative observations on Venusian craters to constrain the magma buoyancy and crust density on Venus that have allowed magma to reach the crater interior. We focus our study on a selection of craters in two main high plateaus of Venus: Ishtar Terra and Aphrodite Terra. Indeed, emissivity observations point to a low-density crust in the tesserae of the high plateaus (Gilmore et al, 2017), therefore suggesting that the magma may be negatively buoyant within the crust in these particular regions.


The filling thickness of dark-floored craters is estimated from the depth difference between bright and dark-floored craters. We calculate the stress and pressure fields generated by a surface unloading on top of a semi-infinite half-space in a cylindrical coordinate system using an analytical model ­­­or using COMSOL Multiphysics for a surface unloading on top of an elastic lithosphere of finite thickness.

From analytical models of magma ascent at the axis of a crater, we calculate the most probable crust to magma density ratio as well as magma storage depth that would fit the observed filling thickness. Results point to a magma slightly denser than the crust.

Since the stress field due to a surface unloading also tends to horizontalize magma flow at shallow depth, we also use 2D numerical models of magma ascent to study magma trajectory below the crater (Maccaferri et al, 2011) and to constrain the necessary ingredients for magma ascent up to the crater interior.


ACKNOWLEDGMENT

This project has received funding from the European Research Council (ERC) under the European Union's Horizon 2020 research and innovation program (grant agreement No. 101001689).


REFERENCES

 [1] Michaut, C. & Pinel, V. (2018). Magma ascent and eruption triggered by cratering on the Moon. Geophysical Research Letters, 45, 6408–6416.

 [2] Herrick, R., Sharpton, V., Malin, M., Lyons, S., Reely, K. (1997) "Morphology and Morphometry of Impact Craters.  University of Arizona Press, eds. S. W. Bougher, D. M. Hunten, and R. J. Phillips, pp. 1015-1046.

 [3] Sharpton, V. (1994). Evidence from Magellan for unexpectedly deep complex craters on Venus. Geological Society of America, Special Paper 293

 [4] Gilmore, M., Treiman, A., Helbert, J., Smreker, S. (2017). Venus surface composition constrained by observation and experiment. Space Science Reviews

 [5] Maccaferri,F., Bonafede, M., Rivalta, E. (2011). A quantitative study of the mechanisms governing dike propagation, dike arrest and sill formation.  Journal of Volcanology and Geothermal Research 208 (2011) 39–50


Figure 1. Examples of bright-floored crater (left) and dark-floored crater (right) in Aphrodite and Ishtar Terra (images obtained using JMars software). The craters represented here are Magnani and Piscopia.

How to cite: Le Contellec, A., Michaut, C., Maccaferri, F., and Pinel, V.: Modeling the eruption of magma within impact craters in the Highlands of Venus, Europlanet Science Congress 2022, Granada, Spain, 18–23 Sep 2022, EPSC2022-399, https://doi.org/10.5194/epsc2022-399, 2022.

L1.21
|
EPSC2022-501
Janusz Oschlisniok, Martin Pätzold, Silvia Tellmann, Bernd Häusler, and Michael Bird

Radio occultation measurements at Venus were applied to derive vertical profiles of temperature, pressure, number density and absorptivity in Venus’ atmosphere. For this purpose, an orbiter sounded the planet’s atmosphere with radio waves which were recorded at ground stations on Earth. While profiles of temperature, pressure and number density were derived below about 100 km from variations of the signal phase, the additional decrease of the signal amplitude allowed to determine the frequency dependent absorptivity. Venus Express sounded the atmosphere of Venus with radio waves at 13 cm (S-band) and 3.6 cm (X-band) wavelengths between the years 2006 and 2014. Absorptivity profiles were used to determine the abundance of gaseous sulfuric acid between about 40 and 55 km altitude and sulfur dioxide near the cloud base. The orbit of VEX allowed to sound the atmosphere over a wide range of latitudes and local times providing a global picture of the H2SO4(g) and SO2 distribution [1]. The resolution of the obtained profiles is in the order of the Fresnel size, i.e., up to a few hundred meters. Variations on smaller scales are the so-called radio scintillations. Those are the result of increased refractive index variations which are caused by small-scale density variations. A possible source for the latter are vertical propagating internal gravity waves. The frequency dependent radio scintillations were observed at altitude regions of enhanced atmospheric stability where the propagation of gravity waves is supported. Gravity waves provide therefore a plausible explanation for radio scintillations [2 - 3]. The radio scintillations analysis provides therefore valuable information on the intensity and the global distribution of gravity waves. The radio occultation experiment on EnVision is supported with a dual-frequency downlink consisting of an X-band (8.4 GHz) and a Ka-band (32 GHz) signal. As the Ka-band radio signal is sensitive to both, the gaseous and liquid part of H2SO4, the usage of both signals allows to determine simultaneously the gaseous and liquid H2SO4 content in the Venus atmosphere. Furthermore, both signals can be used to analyze the frequency dependent radio scintillations which occur between about 55 and 70 km altitude. At the same time, the lower scintillation region occurring below about 48 km can be analyzed. We present the latitudinal distribution of H2SO4(g) between 40 and 55 km altitude and that of SO2 near the cloud base derived from the VEX 3.6 cm radio signals between the years 2006 and 2014. On the basis of these VEX observation and model calculations we show expected EnVision X-band and Ka-band absorptivity profiles at different latitudinal regions. We also present power spectra of amplitude scintillations observed by VEX in the altitude region between about 55 and 70 km altitude and discuss expected scintillation effects for the EnVision spacecraft.


References:

[1] Oschlisnok, J., B. Häusler, M. Pätzold, S. Tellmann, M. K. Bird, K. Peter, T. P. Andert, Sulfuric acid vapor and sulfur dioxide in the atmosphere of Venus as observed by the Venus Express radio science experiment VeRa, Icarus, 362, 114405, 2021.

[2] Hinson, D. P. and J. M. Jenkins, Magellan radio occultation measurements of atmospheric waves on venus, Icarus, 114, (2), 310327, 1995.

[3] Gubenko, V. N., I. A. Kirillovich, D. V. Gubenko, V. E. Andreev, T. V. Gubenko, Activity of Small-Scale Internal Waves in the Northern Polar Atmosphere of Venus by Radio Occultation Measurements of Signal Intensity (Λ = 32 cm) from Venera-15 and -16 Satellites, Solar System Research, 55, 1, 1-10, 2021.

How to cite: Oschlisniok, J., Pätzold, M., Tellmann, S., Häusler, B., and Bird, M.: The abundance of H2SO4 and SO2 in the Venus atmosphere derived from radio occultation measurements and observed radio scintillations, Europlanet Science Congress 2022, Granada, Spain, 18–23 Sep 2022, EPSC2022-501, https://doi.org/10.5194/epsc2022-501, 2022.

L1.22
|
EPSC2022-566
Pascal Rosenblatt, Jean-Charles Marty, Gabriel Tobie, Caroline Dumoulin, and Sébastien Lebonnois

Introduction

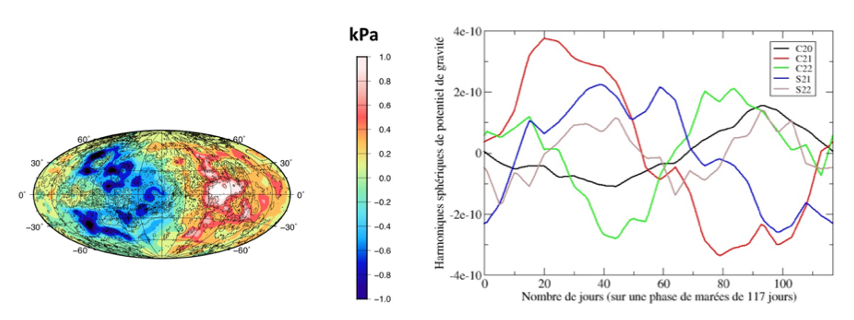
The thermal tides are the main cause of the atmospheric pressure variations on Venus, and are expected to generate temporal variations of the low-degree coefficients of the gravity field of the planet (Bills et al., 2020). However, these gravity variations have not yet been detected since the current Venus gravity solution is not accurate enough (Konopliv et al., 1996). In this study, we model the gravity signature of the thermal tides due to surface pressure variations and analyze whether it can be retrieved with the future tracking data of the EnVision spacecraft.


Modeling the thermal tides

The thermal tides are computed from the output of the Venus Climate Database (Lebonnois et al., 2021). The atmospheric pressure variations are derived as variations around the mean value over the tidal period of 117 Earth days (Figure 1). The associated gravity potential is computed using the following relationships (McCarthy and Petit, 2004):

where Clm(t)and Slm(t)are the time-varying part of the Stokes coefficients of the gravitational potential (land mbeing the degree and the order of the spherical harmonics expansion), R, Mand g, are the radius, the mass and the gravitational acceleration of the planet, respectively, and  is the load Love number of degree l. The spherical harmonics expansion of the load variations  are derived from the surface pressure variations provided by the VCD (Figure 1). This load Love number depends on the rheological properties of the internal layers of the planet (core, mantle, crust). These rheological properties mainly take into account the compressibility and the viscosity of these different layers (Dumoulin et al., 2017; Tobie et al., 2019).  

The EnVision gravity experiment.

The EnVision spacecraft orbit is an elliptical orbit with an altitude range between 220 km and 515 km and an inclination of 88 degrees allowing for high-resolution mapping of the Venus gravity field (Rosenblatt et al., 2021). The EnVision gravity experiment relies on the two-way radio link established on daily passages of at least 3.5 hours long to guarantee the data download required by the EnVision payload. A very stable reference X-band frequency (at 7.1 GHz) is generated at the ground station and sent to the spacecraft, which then sends back to the station a coherent downlink frequency (X-band at 8.4 GHz) thanks to the radio-transponder of the spacecraft telecommunication system. An additional Ka-band downlink coherent frequency (32 GHz) is also sent back to Earth to support the telemetry volume requirements. This two-way X/X-Ka radio link provides a precise Doppler tracking of the EnVision spacecraft over the six Venusian days of the mission science phase.


Figure 1: Simulation of the time-varying part of the gravity field due to the surface pressure variations. Left: Map of the pressure variations extracted from the Venus Climate Database – VCD (Lebonnois et al., 2021). It is centered on longitude 180° while the sub-solar point at longitude zero degree. The main signal is dominated by the second-degree harmonics (Bills et al., 2020). Right:time-variations of the second-degree harmonics of the gravitational potential due to the pressure variations over one tidal cycle (117 Earth-days).

Simulations of the retrieval of time-varying gravitational potential from the future EnVision tracking data

On the basis of the modeling of the thermal tides, we perform simulations of the EnVision gravity experiment following the procedure described in details in Rosenblatt et al. (2021). We thus use the GINS (Géodésie par Intégrations Numériques Simultanées) software developed by CNES (Marty et al., 2009). We simulate the EnVision tracking data with and without the contribution of the time-varying gravitational potential generated by the thermal tides. Then, we perform least squares fit of the difference between both simulated tracking dataset in order to assess the capacity to retrieve the temporal variations of the gravity field due to the thermal tides. The Doppler noise budget and other source of errors in the Precise Orbit Determination process are also taken into account as in Rosenblatt et al. (2021). The goal of this study is in particular to assess our ability to correct the effect of the thermal tides on the estimation of the k2 tidal potential Love number (real and imaginary part).


References:

Bills B.G. et al. (2020), Icarus, 340, article id. 113568 ; Dumoulin C., et al. (2017), Planets, 122 (6), 1338-1352; Konopliv A.S. & Sjogren W.L. (1996). JPL Publication 96-2 1996; Jet Propulsion Laboratory: Pasadena, CA, USA ; Lebonnois S. et al. (2021). The Venus Climate Database. EPSC2021-234, Europlanet Science Congress 2021, virtual meeting, 13-24 September, 2021; Marty J.C. et al. (2009), Planet. Space Sci. 2009,57, 350–363; McCarthy D.D. & Petit G. (Eds.) IERS Conventions (2003); IERS Technical Note 32; BKG: Frankfurt/Main, Germany, 2004; Rosenblatt P. et al. (2021),Remote Sensing, vol. 13, 1624; Tobie G. et al. (2019), Astronomy & Astrophysics, 630, id.A70, 11 pp.

How to cite: Rosenblatt, P., Marty, J.-C., Tobie, G., Dumoulin, C., and Lebonnois, S.: Detection of the gravity signature of Venus’ thermal tides with the EnVision radio-science experiment, Europlanet Science Congress 2022, Granada, Spain, 18–23 Sep 2022, EPSC2022-566, https://doi.org/10.5194/epsc2022-566, 2022.

L1.23
|
EPSC2022-621
|
ECP
Antonio Manjón-Cabeza Córdoba and Tobias Rolf

Introduction               The surfaces of Venus and Earth display striking differences in geology, tectonism, and volcanic activity, which is particularly intriguing given the similar radius and bulk composition of the two planets. The most evident difference is the lack of well-developed plate tectonics on Venus [e.g., 1]. However, Venus’ tectonic mode also differs from that of the classical stagnant-lid bodies – Mars, Mercury and the Moon [2]. A profound description and definition of Venus’ tectonic regime remains to be made [3], but it has to explain Venus’ relatively young and uniformly-aged surface under the condition of rather limited large-scale horizontal surface motion.

One promising hypothesis to explain the lack of mobile lid tectonics on Venus is that rheological healing is enhanced on Venus’ surface, because the high surface temperature causes faster growth of grains. Faster healing causes more rapid recovery from previous deformation that caused grain shrinking and weakening of crustal rocks [e.g., 4]. In principle, this should the planet to form a global network of coherent plates. Although this possibility has been demonstrated with theoretical scalings and thin-sheet modelling [4], no systematic study exists to investigate this process in fully dynamic models of mantle convection that self-consistently generate a range of tectonic modes relevant for Venus and Earth [e.g., 5,6]. Using such models coupled to grain size evolution (GSE), we test the hypothesis that enhanced grain growth – due to higher, Venusian surface temperature – is capable of shutting down mobile lid tectonics.


Methods         To test our hypothesis, we compute 2D models of mantle flow coupled to GSE in spherical annulus geometry using StagYY [7] in the extended Boussinesq approximation. We employ a rheology that accounts for diffusion and dislocation creep in a composite Arrhenius formulation, depending on stress and grain size. In addition, the models feature a yield stress, the maximum stress rocks can sustain before deforming plastically. Upon reaching it, the model rheology is dominated by pseudoplastic yielding, leading to locally reduced viscosity as described in previous works [see e.g., 5,6]. Grain size (D) is tracked using Lagrangian tracers following the equation [8]:

where k and c are (semi-)empirical factors for grain growth and reduction, respectively. E is the activation energy controlling the thermal sensitivity of the grain growth, p is the grain growth exponent, f is the temperature-dependent fraction of the dissipation ψ that is used to reduce grain size. In our systematic investigation, we vary the GSE parameters as well as the surface temperature of the planetary body to predict interior dynamics and surface tectonic modes as a function of the lithospheric yield stress. We then evaluate how applicable the models are to Earth and Venus.


Results            An example model assuming Earth-like surface temperature – representative of the Earth-like mobile lid regime – is shown in Figure 1. This model almost continuously features at least one site of major subduction, which cools the mantle to comparably moderate internal temperature. Low grain size is obtained mainly in subduction zones, while high grain size is characteristic of (hot) plumes. As a result, viscosity variations are smoothened with respect to models without grain size. An exception to that correlation is the low viscosity area below plates, where high temperatures correlate with low grain sizes, resulting in a weaker asthenosphere.

Figure 1: Snapshot of the (left) viscosity and (right) grain size field for a simulation with low surface temperature, representative of the mobile-lid regime. Values are dimensionless and are with respect to reference values of 6.21 Pa s for viscosity and 2.89x10⁶ m for grain size.

Upon increasing the yield stress, the simulations promote a more episodic and, eventually, a stagnant-lid behavior with a continuously immobile lithosphere, as it has been described before. However, the GSE parameters affect the transition from the mobile to stagnant via the episodic regime. In particular, episodic subduction occurs preferentially when grain growth is boosted with respect to grain reduction (increased ). However, neither enhanced grain reduction (increased ) nor enhanced grain growth seem to strongly change the critical yield stress for entering the stagnant lid regime

Cases with substantially higher surface temperature (as relevant for Venus) are to be performed for this abstract. According to the GSE equation, higher  should boost grain growth and therefore enhance episodicity. However, effects of increasing  are expected to differ from that of increasing  as above, because the former may have less impact on the deeper mantle than the latter, with possible implications for the mantle-lithosphere coupling. These differences will be presented.


Link to future Venus missions               Our study aims to shed light on the characteristics of Venus’ tectonic regime and its thermomechanical origin, thereby pointing to potential differences in lithospheric strength and structure as well as in plate-mantle coupling on Venus and Earth. The array of missions during the upcoming decay of Venus will deliver new observables linked to lithospheric structure, which will help to constrain such generic numerical models. In particular, VERITAS aims to map – structurally and compositionally – the surface of Venus, which will help to infer the stress state of the lithosphere and the interior of the planet [9,10]. Regardless, many other lithospheric and upper mantle characteristics will remain difficult to pinpoint with the next missions. Therefore, modelling studies such as ours provide important complementary insight, in particular with respect to Venus’ evolution to its current state.


References

[1] Phillips & Hansen, 1994, Annu. Rev. EPS 22, 597-654; [2] Tosi & Padovan, 2020, AGU Geophysical Monograph, 263, 455-489; [3] Byrne, 2021, PNAS 118; [4] Bercovici & Ricard, 2014, Nature, 508, 513-516; [5] Armann & Tackley, 2012, JGR Planets, 117(2); [6] Rolf et al., 2018, Icarus, 313, 107-123, [7] Tackley, 2008, PEPI, 171, 7-18; [9] Freeman et al., 2016, IEEE; [10] Cascioli et al., 2021, The Planetary Science Journal, 2(6)

How to cite: Manjón-Cabeza Córdoba, A. and Rolf, T.: The importance of Grain-Size Evolution for the tectonic regime divergence of Venus and Earth, Europlanet Science Congress 2022, Granada, Spain, 18–23 Sep 2022, EPSC2022-621, https://doi.org/10.5194/epsc2022-621, 2022.

L1.24
|
EPSC2022-941
Aleksandra Stryjska, Grzegorz Słowik, and Paweł Dąbrowski

Introduction:

Within the next decade, there are plans to carry out at least three space missions - Envision, DAVINCI+ and VERITAS - with which we could significantly broaden our current knowledge about Venus from the astrobiological point of view. A great supplement of the in-situ research carried out on Venus are the experimental tests carried out on Earth in a specially designed testing chamber with the reconstructed conditions encountered on Venus clouds. The need for such research, both in situ by probes and spacecraft on Venus, as well as in Earth's research laboratories, is suggested by the latest research results and formulated research hypotheses regarding potential life in the lower part of Venus clouds (at an altitude of 47.5-50.5 km above its surface) [1]. On the other hand, 3D-climate models indicate that this planet for a long time could have been characterized by an inhabited climate and have an ocean of water on its surface [2]. The discovery of phosphine in the clouds of Venus may also indicate the presence of microorganisms in the clouds of Venus [3].


Results and discussion:

Spectrophotometric UV-Vis-NIR tests of Acidithiobacillus ferrooxidans - strain 583 DSM have been carried out and the experimental data that have been obtained were compared with their counterparts characteristic of Venus clouds on the same wavelength [4]. The obtained dependence incident radiation wavelength vs. the transmittance for the studied bacteria Acidithiobacillus ferrooxidans, strain 583 DSM and Venus show similarity for specific wavelengths λ, which may indicate the potential existence in the clouds of Venus of microorganisms that are analogues of the terrestrial bacteria Acidithiobacillus ferrooxidans, strain 583 DSM with similar physicochemical properties. Further research of different types of acidophilic bacteria in the testing chamber with the reconstructed conditions encountered on the lower layer of Venus clouds will allow for the identification of further Earthly analogues of microorganisms potentially inhabiting Venus clouds.


References:

[1] Limaye S.S. et al. (2018) Astrobiology, 18, 1181-1198.

[2] Way  M.J  et  al. (2016) Geophys. Res. Lett., 43, 16,

      8376-8383.

[3] Greaves, J.S. et al. (2021) Nature Astronomy, 5, 655-

      664.

[4] Kuiper,  G.P. (1969) Comm. Lunar Planet. Lab., 101, 1-

      21.


Figure 1 
Scanning electron micrographs of Acidithiobacillus ferrooxidans, strain DSM 583.

How to cite: Stryjska, A., Słowik, G., and Dąbrowski, P.: Could Acidithiobacillus ferrooxidans be analogs of microorganisms potentially inhabiting Venus clouds?, Europlanet Science Congress 2022, Granada, Spain, 18–23 Sep 2022, EPSC2022-941, https://doi.org/10.5194/epsc2022-941, 2022.

L1.25
|
EPSC2022-713
|
ECP
Jianyu Liang, Norihiko Sugimoto, and Takemasa Miyoshi

Numerical simulation of Venus’ atmosphere is useful to understand the dynamics of the system. The Venus atmospheric data assimilation system “ALEDAS-V” (Sugimoto et al. 2017) based on the Venus atmospheric general circulation model “AFES-Venus” (Sugimoto et al. 2014) has been used to simulate Venus’ atmosphere and generated some key phenomena such as the super-rotation, baroclinic waves, and thermal tides. To further understand the dynamics of Venus’ atmosphere, Bred Vectors (BV) are computed with the AFES-Venus model. This method can identify different growing modes of the system and has been used to study the dynamics of the Earth (Toth and Kalnay 1993, 1997) and Martian atmospheres (Greybush et al. 2013).  However, to our knowledge, there has been no similar study on Venus’ atmosphere. To conduct the breeding cycle, we first produced a five (Earth) year free run of the AFES-Venus model initialized from an idealized zonal wind profile. Next, the forecast states on January 01 and August 25 in the 5th Earth year are used as the initial conditions for the control run and the perturbed run, respectively. These two initial conditions have the same sub-solar positions. To emphasize the active dynamics, the BV norm is defined by the temperature norm from the 60 km to 80 km altitudes, weighted by pressure and latitude. For the breeding cycle, a rescaling norm and rescaling interval are specified. During the breeding cycle, at every rescaling interval (including the initial time), if the norm is bigger than the specified rescaling norm, the BV is rescaled to the rescaling norm.

Different combinations of the parameters are tested. The BV amplitude generally remains stable throughout the whole year without significant seasonal variability (Figure 1), which is different from the Martian atmosphere. The growth rate of the BV amplitude can represent the characteristics of the instabilities. It is calculated by taking the natural logarithm of the ratio of the BV amplitude at the end of the time interval (before rescaling) to the amplitude at the beginning of the interval. It is then converted to the daily growth rate by dividing the ratio of the time interval to one day. When the rescaling norm is smaller or the rescaling interval is shorter, the average growth rate is higher (Figure 2). Further BV analysis will be conducted such as analyzing the BV structure by taking composite mean along the super-rotation and conducting BV breeding cycle without thermal tides. These results will be useful to understand the dynamics of the thermal tide, baroclinic waves, super-rotation, and other important features of Venus atmosphere.


Figure 1. The bred vector amplitude (K2 ) time evolution from the experiments with different rescaling days (1, 2, 5, 10, 20) and the same rescaling norm (10 K2 ).


Figure 2. The average daily growth rate of the bred vector amplitude (K2 ) for different combination of rescaling norm and rescaling days. The average is taken from February to December.


Reference

Greybush, S. J., E. Kalnay, M. J. Hoffman, and R. J. Wilson, 2013: Identifying Martian atmospheric instabilities and their physical origins using bred vectors. Q. J. R. Meteorol. Soc., 139, 639–653, https://doi.org/10.1002/qj.1990.

Sugimoto, N., M. Takagi, and Y. Matsuda, 2014: Baroclinic instability in the Venus atmosphere simulated by GCM. J. Geophys. Res. Planets, 119, 1950–1968, https://doi.org/10.1002/2014JE004624.

——, A. Yamazaki, T. Kouyama, H. Kashimura, T. Enomoto, and M. Takagi, 2017: Development of an ensemble Kalman filter data assimilation system for the Venusian atmosphere. Sci. Rep., 7, 9321, https://doi.org/10.1038/s41598-017-09461-1.

Toth, Z., and E. Kalnay, 1993: Ensemble Forecasting at NMC: The Generation of Perturbations. Bull. Am. Meteorol. Soc., 74, 2317–2330, https://doi.org/10.1175/1520-0477(1993)074<2317:EFANTG>2.0.CO;2.

——, and ——, 1997: Ensemble Forecasting at NCEP and the Breeding Method. Mon. Weather Rev., 125, 3297–3319, https://doi.org/10.1175/1520-0493(1997)125<3297:EFANAT>2.0.CO;2.

How to cite: Liang, J., Sugimoto, N., and Miyoshi, T.: Identifying the growing modes of Venus’ atmosphere using Bred Vectors, Europlanet Science Congress 2022, Granada, Spain, 18–23 Sep 2022, EPSC2022-713, https://doi.org/10.5194/epsc2022-713, 2022.

L1.26
|
EPSC2022-899
Séverine Robert, Paul Simon, Justin Erwin, Filip Vanhellemont, Emmanuel Marcq, Bruno Bézard, Jörn Helbert, and Ann Carine Vandaele

The VenSpec-H instrument is part of the EnVision payload. EnVision is a medium class mission to determine the nature and current state of geological activity on Venus, and its relationship with the atmosphere, to understand how Venus and Earth could have evolved so differently. The launch of the spacecraft is planned in 2031 for a 4 years mission duration.

VenSpec-H is part of the VenSpec suite [1], including also an IR mapper and a UV spectrometer [2] suite. The science objectives of this suite are to search for temporal variations in surface temperatures and tropospheric concentrations of volcanically emitted gases, indicative of volcanic eruptions; and study surface-atmosphere interactions and weathering by mapping surface emissivity and tropospheric gas abundances. Recent and perhaps ongoing volcanic activity has been inferred in data from both Venus Express and Magellan. Maintenance of the clouds requires a constant input of H2O and SO2. A large eruption would locally alter the composition by increasing abundances of H2O, SO2 and CO and perhaps decreasing D/H ratio. Observations of changes in lower atmospheric SO2, CO and H2O vapour levels, cloud level H2SO4 droplet concentration, and mesospheric SO2, are therefore required to link specific volcanic events with past and ongoing observations of the variable and dynamic mesosphere, to understand both the importance of volatiles in volcanic activity on Venus and their effect on cloud maintenance and dynamics.

To contribute to this investigation, VenSpec-H is designed to measure H2O, HDO, CO, OCS and SO2 both on the nightside and on the dayside. To ensure the reliability of the analysis, the BIRA-IASB radiative transfer code, ASIMUT-ALVL [3], has been scrutinized making sure all contributions were properly modelled. The radiances of the nightside atmosphere of Venus originate from the thermal emission of the surface and atmosphere while on the dayside they originate from the sunlight penetrating the atmosphere and bouncing back on the cloud cover.

While VenSpec-H will be able to measure 4 spectral ranges between 1 to 2.5 microns, we focused on the upper wavelengths’ range, from 2.35 to 2.5 microns, identified as Band#2 in VenSpec-H’s design and enabling simultaneous measurements of the different molecular species. A sensitivity study was performed on nightside spectra. The impacts of the molecular species (line by line and collision induced absorption) and of the aerosols were quantified. We will discuss the choices we have made in terms of absorption line parameters and clouds’ physical properties


Acknowledgements

This work has been performed with the support of the Belgian Science Policy Office (BELSPO), with the financial and contractual coordination by the ESA Prodex Office.


References

[1] J. Helbert et al., “The VenSpec suite on the ESA EnVision mission to Venus”, Proc. SPIE 11128, Infrared Remote Sensing and Instrumentation XXVII, 1112804 (2019).

[2] E. Marcq et al., “Instrumental requirements for the study of Venus’ cloud top using the UV imaging spectrometer VeSUV”, Advances in Space Research, 68 (2021) 275-291.

[3] A.C. Vandaele, M. Kruglanski and M. De Mazière, “Modeling and retrieval of atmospheric spectra using ASIMUT”, Proc. of the First 'Atmospheric Science Conference', ESRIN, Frascati, Italy, 2006.

How to cite: Robert, S., Simon, P., Erwin, J., Vanhellemont, F., Marcq, E., Bézard, B., Helbert, J., and Vandaele, A. C.: Consolidating the radiative transfer code to analyze VenSpec-H measurements, Europlanet Science Congress 2022, Granada, Spain, 18–23 Sep 2022, EPSC2022-899, https://doi.org/10.5194/epsc2022-899, 2022.

L1.27
|
EPSC2022-1113
Justin Erwin, Severine Robert, Ian Thomas, Eddy Neefs, Roderick De Cock, Emmanuel Marcq, Joern Helbert, and Ann Carine Vandaele

Introduction

The VenSpec-H instrument is part of the EnVision M5 mission payload, which has been selected by ESA in June 2021 for launch in 2031. EnVision is a medium-class mission to determine the nature and current state of geological activity on Venus, and its relationship with the atmosphere, to understand how Venus and Earth could have evolved so differently. VenSpec-H will target different molecular species in nadir viewing geometry, as to better characterize the surface-atmosphere interaction. VenSpec-H is part of the VenSpec suite [1], including also an IR mapper and a UV spectrometer [2].


Instrument

VenSpec-H is a nadir pointing, high-resolution (R~8000) infrared spectrometer that will perform observations in different spectral windows between 1 and 2.5 microns. This instrument was originally developed with direct heritage from NOMAD-LNO [3, 4] that is currently onboard ExoMars Trace Gas Orbiter.

Due to the scientific requirements of the EnVision mission, a series of modifications have been introduced to address the spectral coverage and SNR of the instrument. A significant effort is now undergoing to develop and validate these “new” components for the operational environments and mission lifetime.

The VenSpec-H instrument is comprised of two boxes as shown above, the instrument box and the electronics box. The instrument box contains a warm base plate (0°C operating temperature) where the filter wheel and detector/cooler are mounted, and a cold base plate (-45°C operating temperature) where the majority of the optical elements are mounted. The majority of the electronics are in a separate box to improve the thermal stability of the instrument box.


Consortium

The VenSpec-H consortium is led by Belgium with the participation of Spain, Netherlands, Switzerland, Germany, Portugal, and Czech Republic. The organization is outlined below.

With such a large consortium, communication and organization are essential. To this effect we hold regular full team meetings, as well as smaller focus groups on topics such as filter wheel, thermal/mechanical, optical development, and polarization.


Acknowledgements

This work has been performed with the support of the Belgian Science Policy Office (BELSPO), with the financial and contractual coordination by the ESA Prodex Office.


References

[1] Helbert, J., et al., Proc. SPIE 11128, Infrared Remote Sensing and Instrumentation XXVII, 1112804 (2019)

[2] Marcq et al., “Instrumental requirements for the study of Venus’ cloud top using the UV imaging spectrometer VeSUV”, Advances in Space Research, 68 (2021) 275-291.

[3] Neefs, E., et al., Appl Opt 54(28), 8494-520 (2015)

[4] Vandaele, A.C., et al., Space Science Reviews 214(5) (2018)


How to cite: Erwin, J., Robert, S., Thomas, I., Neefs, E., De Cock, R., Marcq, E., Helbert, J., and Vandaele, A. C.: VenSpec-H: Introduction to Instrument and Consortium, Europlanet Science Congress 2022, Granada, Spain, 18–23 Sep 2022, EPSC2022-1113, https://doi.org/10.5194/epsc2022-1113, 2022.

L1.28
|
EPSC2022-414
Therese Encrenaz, Thomas Greathouse, Rohini Giles, Thomas Widemann, Bruno Bézard, and Thierry Fouchet

Since 2012, we have been monitoring SO2 and H2O (using HDO as a proxy) at the cloud top of Venus, using the TEXES high-resolution imaging spectrometer at the NASA InfraRed Telescope Facility (IRTF) at Maunakea Observatory. Sixteen runs have been performed between 2012 and 2022. Maps have been recorded around 1345 cm-1 (7.4 microns, z = 62 km), where SO2, CO2 and HDO are observed, and around 530 cm-1 (19 microns, z = 57 km) where SO2 and CO2 are observed, as well as around 1162 cm-1 (8.6 microns, z = 66 km) where CO2 is observed. From the early beginning, SO2 plumes have been identified with an evolution time scale of a few hours. In 2020, an anti-correlation has been found in the long-term evolution of H2O and SO2; in addition,  the SO2 plume appearance as a function of local time seems to show two maxima around the terminator, indicating the possible presence of a semi-diurnal wave (Encrenaz et al. A&A 639, A69, 2020). After two years of interruption due to the pandemia, new observations have been performed in July 2021, September 2021, November 2021, and February 2022.   The main results of the new observations are listed below. (1)The SO2 abundance, which had been globally increasing from 2014 until 2019, has now decreased with respect to its maximum value. (2) The anti-correlation between H2O and SO2, which was maximum between 2014 and 2019 (cc = - 0.9) does not appear clearly in the recent observations. (3) The maximum appearance of the SO2 plumes at the equator and the terminators is confirmed, but appears stronger on the morning side.(4) A strong activity of the SO2 plumes is observed in September and November 2021, at a time when the disk-integrated SO2 abundance is low. At the same time, thermal maps at 1162 cm-1 (8.6 microns, z = 66 km) show a polar enhancement. This behavior could possibly be associated with the topography.


How to cite: Encrenaz, T., Greathouse, T., Giles, R., Widemann, T., Bézard, B., and Fouchet, T.: Ground-based HDO and SO2 thermal mapping on Venus between 2012 and 2022: : An update, Europlanet Science Congress 2022, Granada, Spain, 18–23 Sep 2022, EPSC2022-414, https://doi.org/10.5194/epsc2022-414, 2022.