
Titan’s atmospheric structure from Cassini/UVIS airglow observations
- 1GSMA/CNRS, REIMS, France (panayotis.lavvas@univ-reims.fr)
- 2LPL, University of Arizona, Tucson, USA
The Cassini/UVIS observations of Titan’s atmosphere extend from 2005 to 2017 providing a broad spatial and temporal view of the upper atmosphere including the seasonal change from Southern summer at the Cassini-Huygens arrival in 2005, to equinox (August 2009), to Northern summer (summer solstice in May 2017). The general emission characteristics of the illuminated Titan side are common among the observations: Near the ionospheric peak (~1100 km) the atomic and molecular emissions dominate the observed signal (Fig. 1). Atomic emissions include Ly-α (1216.7 Å) scattering from atomic hydrogen and emissions from N and N+ excited during the photolysis of N2, with major contributions at 1085 Å (N+, 3D0 à 3P), 1200 Å (N, 4D0 à 4S0 ) and 1493 Å (N, 2P à 4S0). Molecular emissions are dominated by the Lyman-Birge-Hopfield (LBH, α 1Πg à X 1Σg+) and Vegard-Kaplan (VK, A3Σu+ à Χ 1Σg+) bands, both in the FUV. These observations provide valuable constraints for the atmospheric structure.
We use a detailed forward model to simulate the observed emission, which relies on constraints from models of solar energy deposition (Lavvas et al. 2011) and N2 aiglow (Lavvas et al. 2015). Our simulations demonstrate that all observed emissions result from the excitation of atomic and molecular nitrogen and from scattering by atomic hydrogen (Fig. 1). Using such a detailed forward model for the inversion of the atmospheric properties is, however, inefficient due to the large computational times involved. Instead we propose a simplified retrieval focusing on specific atomic lines in the FUV range, which allows for an efficient atmospheric characterization with minimal computational effort, while preserving the benefits of the detailed forward modeling.
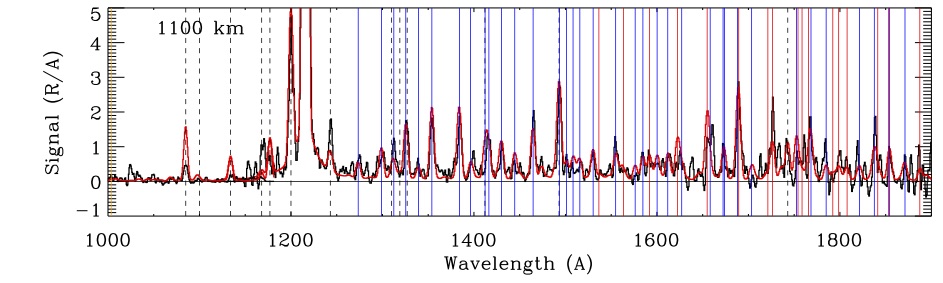
Figure 1: Observed (black) and simulated (red) limb spectra on Titan’s dayside during the 2016, DOY-015 PRIME observations. The top panel presents the average spectrum at 1100 km (100 km wide bin) demonstrating the strong Ly-α emission and the emissions from atomic (dashed lines) and molecular transitions (thin blue lines for LBH and thin red lines for VK bands).
References
- Lavvas P., Yelle R.V., Heays A.N., Campbell L., Brunger M.J., Galand M., Vuitton V., 2015. N2 state population in Titan’s atmosphere. Icarus, 260, p.29-59.
- Lavvas P., Galand M., Yelle R.V., Hayes A.N., Lewis B.R., Lewis G.,R. Coates A.J., 2011. Energy deposotion and primary chemical products in Titan’s atmosphere. Icarus, 213, 233-251.
How to cite: Lavvas, P. and Koskinen, T.: Titan’s atmospheric structure from Cassini/UVIS airglow observations, Europlanet Science Congress 2022, Granada, Spain, 18–23 Sep 2022, EPSC2022-447, https://doi.org/10.5194/epsc2022-447, 2022.