
Reflectance spectroscopy and optical microscopy laboratory analyses of terrestrial feldspathic rocks as analogs to Mars
 1,1,1
1,1,1- 1CRPG, CNRS-UMR7958, Université de Lorraine, 54500 Vandoeuvre-lès-Nancy, France (marie.barthez@univ-lorraine.fr)
- 2LMV, OPGC, IRD-UMR163, Université Clermont-Auvergne, 63178 Aubière, France
1. Introduction
Plagioclase feldspar (Plg) is a common mineral in terrestrial rocks. It is a solid solution between a Ca-rich (anorthite) and a Na-rich (albite) endmember, and it is most commonly classified based on its anorthite (An) content. Powders of anorthite-rich Plg were previously studied using reflectance spectroscopy in the visible near-infrared (VNIR) range [1]. They showed that Plg display a band centered around 1.3µm due to Fe2+ substitutions, and that the position of this absorption band is a function of the An content.
Other studies have investigated mixture of binary powders and showed that the Plg spectral signature is no longer visible when 10%, or more, of mafic minerals are added [2, 3]. According to these studies, a minimum of 90% of Plg are necessary in the rock composition for its spectral signature to be visible on the average spectrum of the rock. A more recent study, mixing large Plg and pyroxene grains [4], showed that at least 50% of mafic minerals are needed to mask the Plg spectral signature.
Therefore, in addition to the An content, the size of the grains and the associated minerals influence the spectral signature of Plg. Thus, the analysis of whole rocks, and not powders, appears to be more relevant as a comparison with remote sensing analysis of planetary surfaces.
The present study seeks to understand when Plg signatures are detectable, and how the Plg absorption band is affected by the nature of the host rock. In other words, does the spectral signature of Plg differ from one rock type to another, and if so, can a reflectance spectrum in VNIR be associated with a specific feldspathic rock type?
2. Method
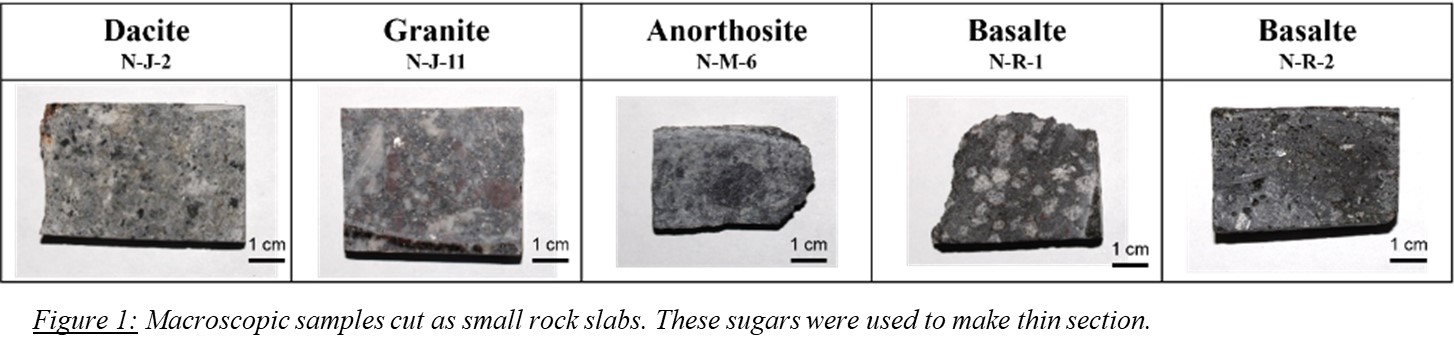
We combined petrological and spectral laboratory analyses of five terrestrial rock samples that contain Plg: an anorthosite (NM6), a granite (NJ11), two porphyritic basalts (NR1 and NR2) and a dacite (NJ2) (Figure 1).
Firstly, reflectance spectroscopy measurements were carried out on the macroscopic samples using an ASD Fieldspec 4 point-spectrometer. The instrument operates in three different wavelength ranges: VNIR (0.35 – 1 µm), SWIR 1 (1.001 – 1.801 µm), and SWIR 2 (1.801 – 2.5 µm), with a spectral resolution between 3 and 8 nm.
All resulting spectra (Figure 2) have an absorption band centered around 1.3µm with broad shoulders located around 0.8µm and 1.7µm. In order to accurately determine if this band is related to Plg in the rocks, additional analyses were performed.
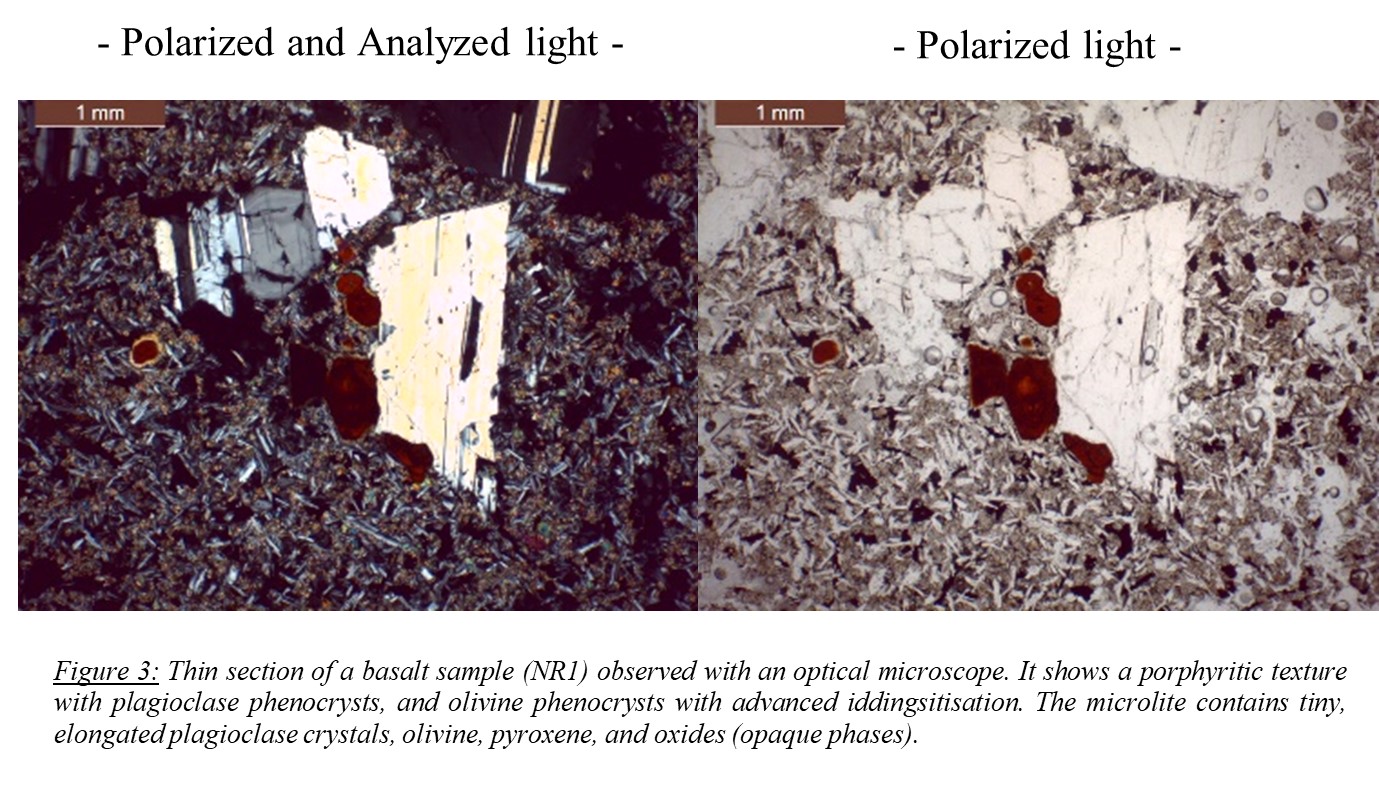
A petrographic study of each sample mineralogy (Figure 1) was carried out using an optical microscope as shown for sample NR1 in Figure 3.
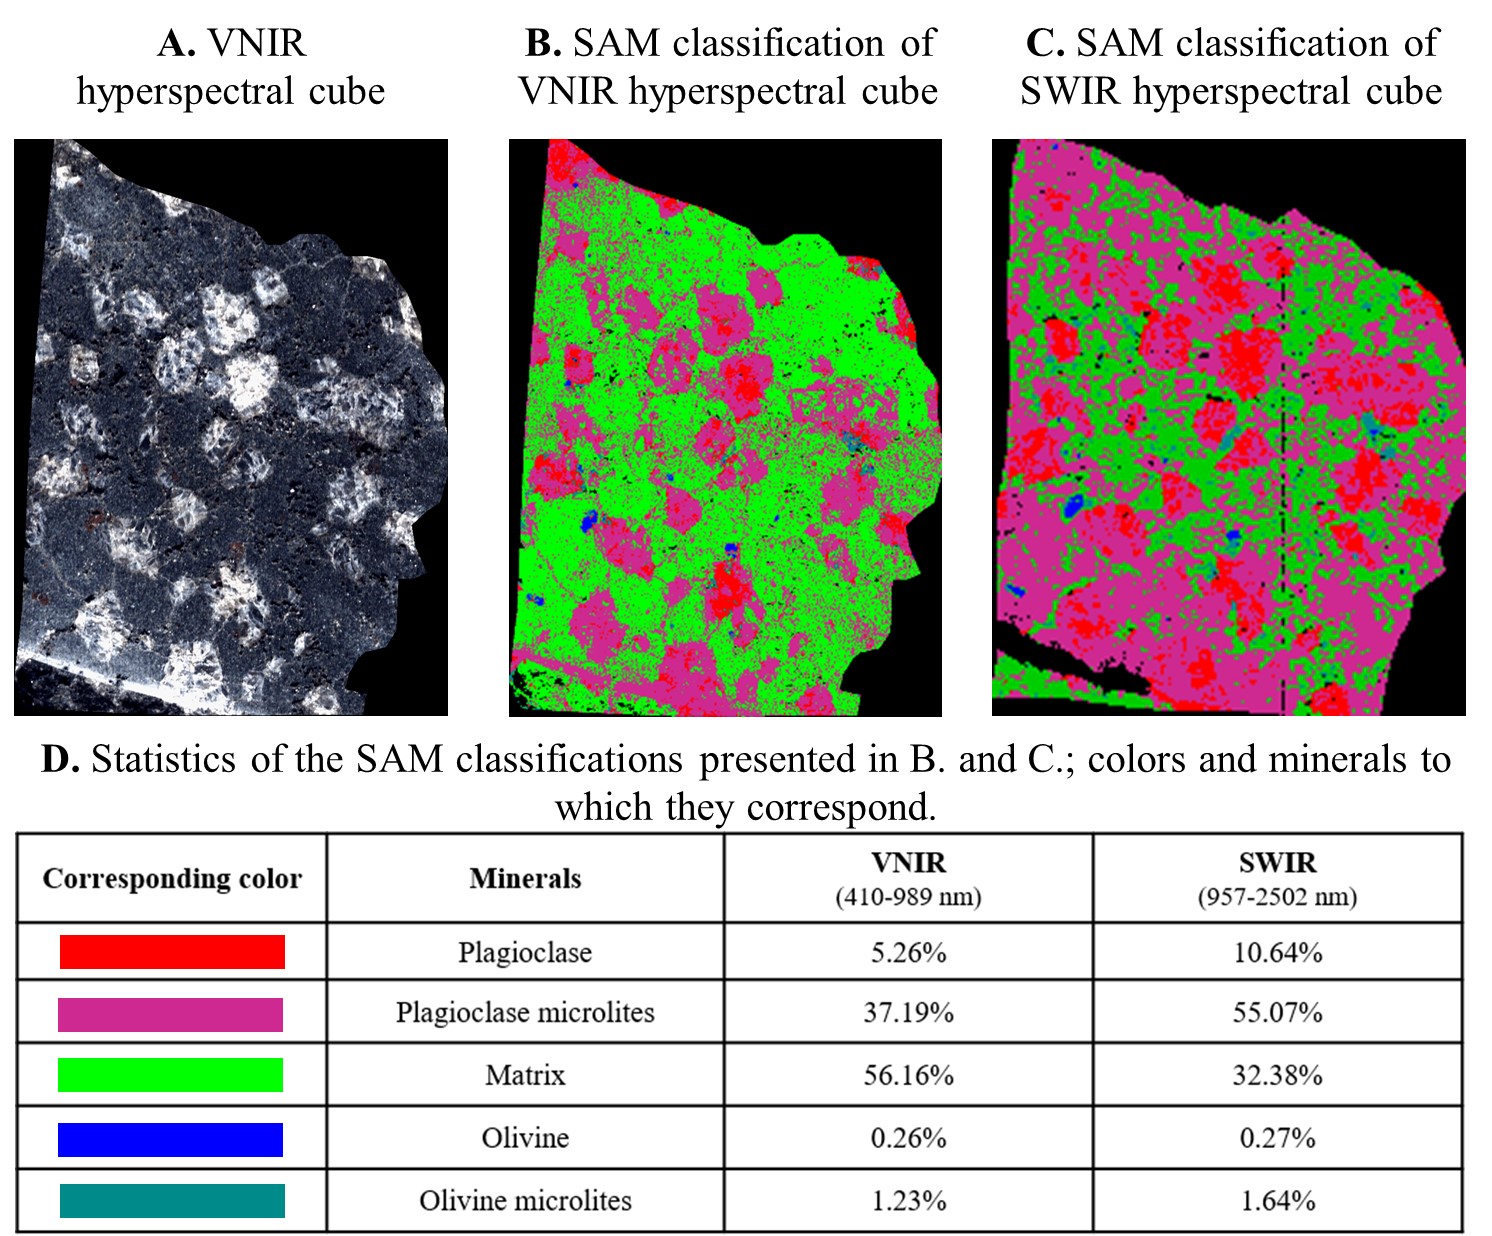
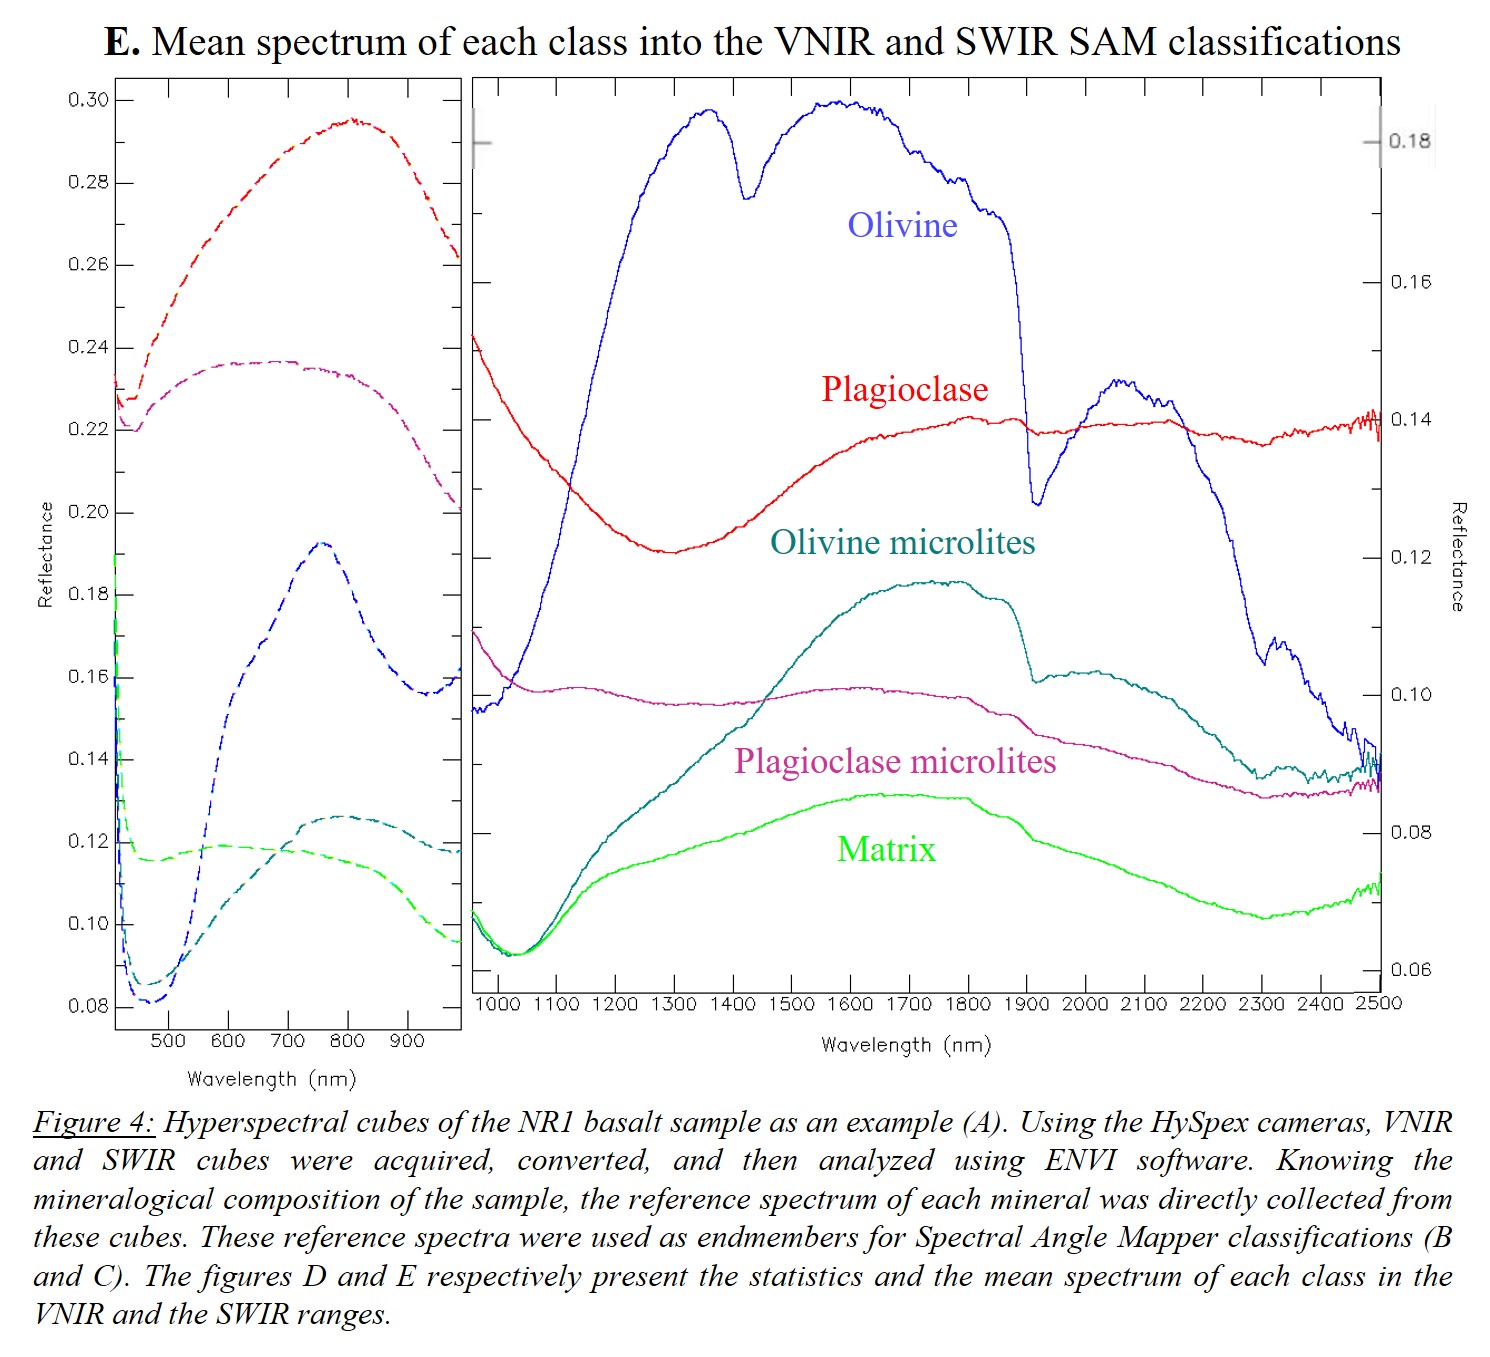
The use of hyperspectral cameras made it possible to further determine the spectral signature of each grain contained in these rocks (Figure 1). Hyperspectral cubes were acquired with the HySpex VNIR-3000-N and SWIR-640 cameras that acquire high-resolution data respectively from 0.4µm to 1µm, and from 0.96µm to 2.5µm, at a distance of 30cm from the sample. The resulting pixel size is about 29 µm in the VNIR, and 130 µm in the SWIR. The hyperspectral cubes are converted to reflectance using a reference target, and then analyzed with the ENVI software to classify the image pixels according to their spectral signature. Therefore, the different minerals in the rocks, which are often on a millimeter scale, are grouped into different classes. The statistics give the mean spectrum of each class, and therefore each mineral group (Figure 4).

3. Results and Discussion
For each sample, the mineralogical composition (Figure 3) and spectral signature of each mineral (Figure 4) are determined. We observe that only Plg has an absorption band centered at 1.3µm with broad shoulders at 0.8 and 1.7µm. In conclusion, this same absorption band, that we see on the average spectrum of the rock (Figure 2), is the spectral signature of Plg. However, it should also be noted that in the matrix of Figure 4, composed of Plg and iddingsitized olivine, this band is no longer visible. This is also the case for the other samples: some minerals can mask the spectral signature of Plg by overlaying or attenuating its absorption band.
Looking at the reflectance spectra (Figure 2), the position of the band seems to vary. It is centered around 1.2µm for dacite (NJ2) and granite (NJ11), around 1.25µm for basalts (NR1 and NR2), and 1.3µm for anorthosite (NM6). However, one must be careful with the interpretation: this shape might be related to the Plg chemical composition, but also the grain size, and the presence of other minerals contributing to the average rock spectra.
Our study, therefore, shows that it is indeed possible to detect the presence of Plg in a whole feldspathic rock, even though it does not contain 90% of feldspar, and regardless of its nature (e.g., sample NR1 shown in Figure 4 contains ~66% of Plg).
These results can be applied to the study of feldspathic rocks at the surface of rocky planets and more precisely of Mars. Indeed, recent detections of Plg [5, 6, 7] were made using the CRISM instrument (MRO) at the surface of Mars. The interpretation of these signatures, in terms of lithologies, is still under discussion given the variety of feldspathic rocks containing plagioclase [4, 5, 6, 7, 8] that exhibit the typical Plg absorption band. The construction of a reference library acquired on macroscopic rock fragments that we undertook should lead to a more accurate interpretation of Martian detections.
4. References
[1] J.B. Adams an L.H. Goullaud (1978). LPSC Conference, 9th, 3, 2901-2909 (A79-39253 16-91).
[2] D.A. Crown and C.M Pieter (1987). Icarus, 72(3), 492-506.
[3] L.C. Cheek et al. (2014). American Mineralogist, 99(10), 1871-1892.
[4] A.D. Rogers et H. Nekvasil (2015). Geophy.Res.Lett., 42, 2619-2626.
[5] J.J. Wray et al. (2013). Nature Geoscience, 6, 1013-1017.
[6] J. Carter et Poulet (2013). Nature Geoscience, 6, 1008–1012.
[7] J. Flahaut et al. (2020). EGU General Assembly (EGU2020-13377).
[8] A.D. Rogers et W.H. Farrand (2022). Icarus, 376, 114883.
How to cite: Barthez, M., Flahaut, J., Guitreau, M., Pik, R., and Ito, G.: Reflectance spectroscopy and optical microscopy laboratory analyses of terrestrial feldspathic rocks as analogs to Mars, Europlanet Science Congress 2022, Granada, Spain, 18–23 Sep 2022, EPSC2022-467, https://doi.org/10.5194/epsc2022-467, 2022.