
The colours of Jupiter in 2021
- SAF/ISMO, Nantes, France (chrispellier@sfr.fr)
- Introduction
The colours of the belts, zones, and individual features of Jupiter are known to encounter significant variations either on short or long time scales. Those variations are the results of chemical or physical changes of the planet's meteorology that are of much interest. In order to try to precisely describe the colours of the planet beyond simple assessments (either visually or from images), the author presents results obtained with tools found in the scientific litterature, to characterize the colours of Jupiter during the apparition of 2021.
Scientific references showing examples of the same kind of work are [1] and [2]
- Method
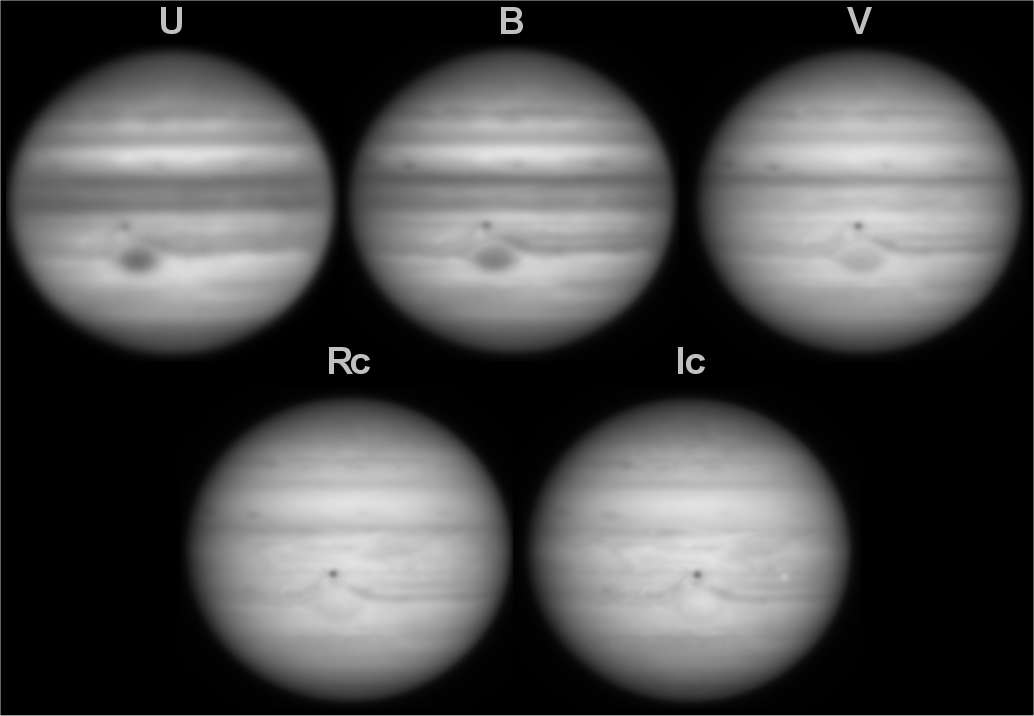
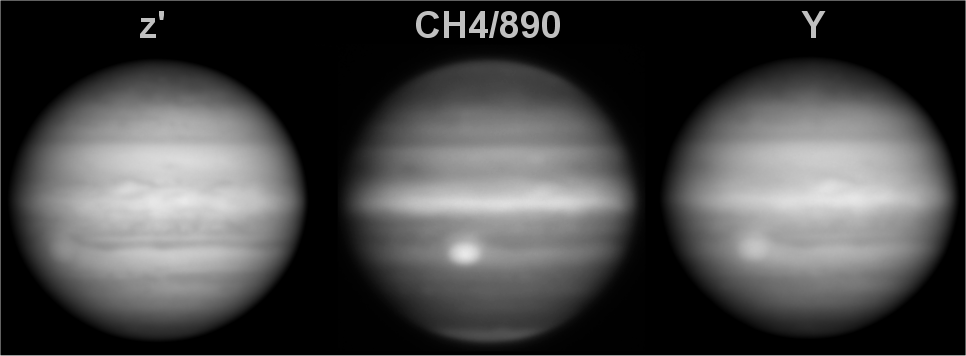
The planet is imaged with the method of lucky imaging, with a complete set of UBVRcIc plus z', CH4/890, and Y filters. Two cameras are used, one monochrome (ASI290MM from ZWO) and one colour, the ASI462MC, to benefit from its huge sensitivity in the near infrared wavelengths. Wavelet processing is not applied on the images. The geometric albedo of the planet is calculated for each one of the bands, thanks to the method exposed in EPSC2022-20, and the values are exploited with the following presentations. Figures 1 and 2 show photometric images taken respectively on September 6th, 2021, and September 23rd, showing the Great red spot.
- North-South scans
The goal is to characterize the photometric profile of the planet in direction of the polar axis, for each band of light. For this, images where longitudes estimated to be "representative" of the global state of the planet are used.
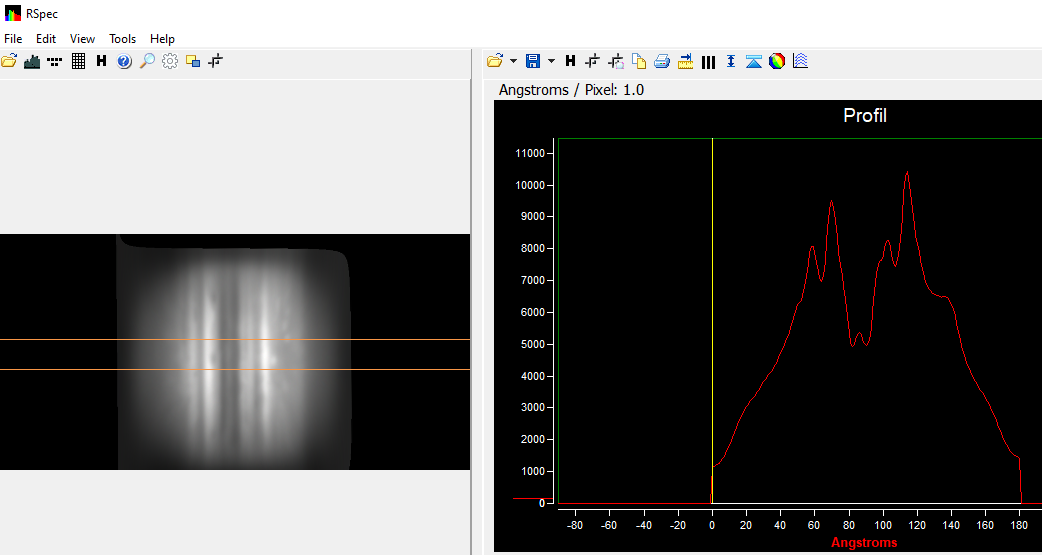
Another method would be to use images spanning a long range of longitudes. To diminish the sensitivity of a cut along a single line to local variations (i.e presence of individual spots...) the author used the software RSpec to select a wider range of longitudes around the central meridian (figure 3)
Images are not used directly: they are first sent into WinJupos and mapped onto equirectangular projection with planetographic latitude scale that allows to eliminate the moderate tilt of the globe, when present. The only thing not corrected is the small gradient of light brought by the polar tilt (the "winter" hemisphere being a bit less lit by the Sun). The photometric profile is calibrated in “wavelengths” from 0 to 180, to ease the building of the latitude scale (+90/-90°).
Finally, the profile is calibrated in intensity by calculating the albedo of a well identified region with the same method exposed in point 4 below. On figure 4 is an example of a final scan, all will be visible on the poster.

Ratios of some of those north-south scans can be made to provide colour indices that may reveal additionnal informations. Here is a B-Rc that may forms a good index of the colours of the planet, since the B band is where the maximum of variation occurs, when they are minimal in red (or IR) - figure 5:

- Spectra of individual features or regions
This work also allows to build spectra of individual features or regions, like the Great Red Spot, when measuring their particular albedo on the central meridian. Spectra will then only have a few points, depending on the number of filters used. To measure the albedo of individual features, the author used a circle of know radius (5 or 10 pixels...), noted the value of apparent brightness, and calculated what would be the brightness if this small area would be as large as the disk itself. Then by a simple rule of three, knowing what is the albedo of the global disk, it is possible to calculate the albedo of the feature of interest. An example of such spectra can be found in [2].
- References
[1] Mendikoa, I., Sanchez-Lavega,A., Pérez-Hoyos,S., Hueso,R., Rojas, J-F., Lopez-Santiago,J., "Temporal and spatial variations of the absolute reflectivity of Jupiter and Saturn from 0,38 to 1,7 µm with PlanetCam-UPV/EHU", Astronomy and Astrophysics, vol.607, november 2017.
[2] Simon AA, Wong MH, Rogers JH, Orton GS, De Pater I, Asay-Davis X, Carlson RW, Marcus PS, “Dramatic change in Jupiter's Great Red Spot from spacecraft observations”, The Astrophysical Journal Letters, 797:L31, 2014.
How to cite: Pellier, C.: The colours of Jupiter in 2021, Europlanet Science Congress 2022, Granada, Spain, 18–23 Sep 2022, EPSC2022-51, https://doi.org/10.5194/epsc2022-51, 2022.