Europlanet Science Congress 2022
Palacio de Congresos de Granada, Spain
18 – 23 September 2022
Europlanet Science Congress 2022
Palacio de Congresos de Granada, Spain
18 September – 23 September 2022
ODAA3
Professional-Amateur collaborations in small bodies, terrestrial and giant planets, exoplanets, and ground-based support of space missions

ODAA3

Professional-Amateur collaborations in small bodies, terrestrial and giant planets, exoplanets, and ground-based support of space missions
Convener: Marc Delcroix | Co-conveners: Ricardo Hueso, Anastasia Kokori, Maciej Libert
Orals
| Wed, 21 Sep, 10:00–13:30 (CEST)|Room Andalucia 1
Posters
| Attendance Mon, 19 Sep, 18:45–20:15 (CEST) | Display Mon, 19 Sep, 08:30–Wed, 21 Sep, 11:00|Poster area Level 2

Session assets

Discussion on Slack

Orals: Wed, 21 Sep | Room Andalucia 1

Chairpersons: Marc Delcroix, Anastasia Kokori
Terrestrial and Giant Planets, Small Bodies
Venus, Mars
10:00–10:15
|
EPSC2022-208
|
solicited
|
MI
Emmanouil Kardasis, Javier Peralta, Grigoris Maravelias, Masataka Imai, Anthony Wesley, Tiziano Olivetti, Yaroslav Naryzhniy, Luigi Morrone, Antonio Gallardo, Giovanni Calapai, Joaquin Camarena, Paulo Casquinha, Dzmitry Kananovich, Niall MacNeill, Christian Viladrich, and Alexia Takoudi

The cloud discontinuity of Venus is a planetary-scale phenomenon known to be recurrent since, at least, the 1980s. It was initially identified in images from JAXA’s orbiter Akatsuki.  This disruption is associated to dramatic changes in the clouds’ opacity and distribution of aerosols and is interpreted as a new type of Kelvin wave. The phenomenon may constitute a critical piece for our understanding of the thermal balance and atmospheric circulation of Venus. The  reappearance on the dayside middle clouds  four years after its last detection with Akatsuki/IR1 is reported in this work. We characterize its main properties using exclusively near-infrared images from amateur observations for the first time. The discontinuity exhibited tempοrаl variations in its zonal speed, orientation, length, and its effect over the clouds’ albedo during the 2019/2020 eastern elongation in agreement with previous rеρorts. Moreover, amateur observations are compared with simultaneous observations by Akatsuki UVI and LIR confirming that the discontinuity is not visible on the upper clouds’ albedo or thermal emission. While its zonal speeds are faster than the background winds at the middle clouds, and slower than winds at the clouds’ top, it is evidencing that this Kelvin wave might be transporting momentum up to upper clouds.

How to cite: Kardasis, E., Peralta, J., Maravelias, G., Imai, M., Wesley, A., Olivetti, T., Naryzhniy, Y., Morrone, L., Gallardo, A., Calapai, G., Camarena, J., Casquinha, P., Kananovich, D., MacNeill, N., Viladrich, C., and Takoudi, A.: Results from the professional-amateur collaboration to investigate the Cloud Discontinuity phenomenon in Venus’ atmosphere, Europlanet Science Congress 2022, Granada, Spain, 18–23 Sep 2022, EPSC2022-208, https://doi.org/10.5194/epsc2022-208, 2022.

10:15–10:25
|
EPSC2022-1268
David Arditti, Martin Lewis, Phil Miles, and Anthony Wesley

The early 2020 eastern (evening) elongation of Venus was a particularly favourable one for northern hemisphere observers, and the early 2022 western (morning) elongation was favourable for southern observers. A number of observers in both hemispheres achieved IR imaging at around 1000nm of the night-time surface of Venus when in crescent phase. This presentation reviews the equipment and methods used by successful imagers of the night side, including the sky criteria necessary (altitude, solar altitude and phase), and the results obtained.


IR narrowband images taken around 1000nm show relief on the night-time surface of the planet due to differential cooling; the mountain-tops cool faster than the valleys and so emit less IR radiation. In several bands this radiation is not fully absorbed by the atmosphere and can be detected with small earth-based telescopes (at least 200mm aperture) so long as the sky is dark enough, light scatter from the illuminated planet in telescope and camera is minimised, and there is sufficient blocking of shorter wavelengths. This has been demonstrated since 2009. The signal detected by this method is not 100% correlated with surface relief, but seems to be modulated by some atmospheric effects also.


There is a key observational trade-off of sky darkness against altitude of the planet. Acceptable results are not obtained until the signal from the surface is at least 50% above the noise due to the sky background, but below 10º altitude the noise is increased to unacceptable levels by atmospheric absorption.


The design of the sensor is found to be critical. Most sensors marketed to amateurs have too much internal scatter at these wavelengths to be usable at such low s/n ratios. However, good results have been obtained with a number of commercial cameras.

 The relationships between Venus’s rotation period and Earth and Venus’ orbital periods conspire to mean that essentially only one range of longitudes is imageable at all eastern elongations, and another at all western elongations. One reason for doing this work is the possibility that Venus could still have active vulcanism. If it does, and if it were on a large enough scale, this technique could potentially reveal. it. Observations in the period in question, however, did not generate any evidence of this being the case.

How to cite: Arditti, D., Lewis, M., Miles, P., and Wesley, A.: Amateur observations of the surface of Venus in 2020-22, Europlanet Science Congress 2022, Granada, Spain, 18–23 Sep 2022, EPSC2022-1268, https://doi.org/10.5194/epsc2022-1268, 2022.

10:25–10:35
|
EPSC2022-43
|
MI
Marc Delcroix, Jean Lilensten, Jean-Luc Dauvergne, Christophe Pellier, Emmanuel Beaudouin, and Mathieu Vincendon

Introduction

Amateur observations of atmospheric features on the limb or night side of Mars proved their interest ([1], [2]). This led JL, specialist in aurorae, to collaborate with JLD, advanced amateur astronomer, to coordinate ten amateurs for attempting the first observation from Earth of aurora above the limb or on the night side of Mars.


Observations

On Nov. 17th, 2020 (316° solar longitude), one of those amateurs, CP observed a suspect phenomenon over the night side of Mars. We identified an exceptional quality simultaneous observation by EB, over a three-hour timespan (fig. 1). Observation of the data set shows a 3000 km (from equator to South) detached layer on the night side, which seems to rotate with the planet on the day side, casting shadows before disappearing.

Fig. 1. Detached layer from 20H25 to 21H26 UT through red (R), green (G), and blue (B) filters. The disk is overexposed to better show the phenomenon.


Analysis

This feature could be an aurora, or a cloud system made from dust, H2O or CO2. With MV, specialist in Mars clouds, the collaborative team worked to characterize its altitude, its photometric properties, and its possible composition to determine its type.

a. Altitude

It was determined through several methods, using measures of the apparent position of the features on the images. Assuming the detached layer is seen at the time when the cloud emerges from night side, we used both a simple 2D method (fig. 2) and the 3D equations of [1] on the emergence images’ measures. Another method used the measure of the length of the shadow casted by the features. A last method measured the clouds fronts’ position following the features when it rotates on day side.

Amateurs MD, JLD and EB worked out those different methods which led overall to an altitude of 92 (+30/-16) km.

Fig. 2: Detached layer altitude determination with 2D geometric method.


b. Colour profile and albedo

Amateur CP performed UBVRI photometry ([3]) of the planet and the layer. Reference stars observed at the same airmass as the observation were used. Different features were measured (bright and dark terrains, polar cap) as well as the overall globe, and one part of the detached layer. Fig. 3 shows the respective albedos measured, showing how the different zones measured reflects sunlight. The detached layer reflectance is twice brighter in red than in blue (while bright reddish terrain like Amazonis is five times).


Fig. 3. Albedo of different Martian structures compared to those of the full globe and of the observed detached layer.


c. Size and optical depth of particles constituting the layer

Colour profile shows that the layer scatters light over the whole spectrum, inconsistent with Rayleigh scattering or single wavelength emission, suggesting a layer consisted of dust aerosols or ice crystals.

Professional MV used [4] to model ice scattering reflectance of CO2 and H2O, resulting in fig. 4, showing that the reflectance profile of the layer is compatible with either 1-2µm CO2 or 2(+/-1) µm H2O particle sizes.

Fig. 4. Spectrum of the detached layer derived from figure 3 (black dots) compared to scattering models of CO2 (red) and H2O (blue) clouds with various ice crystal particle sizes models


Possible interpretation

a. Aurorae

JL predicted ([5]) 140km altitude for blue or green aurorae, and 160km for red aurorae, incompatible with this observation. Blue and green aurorae should be brighter than red ones, which is incompatible with the colour profile we evaluated. The quiet solar conditions on Mars during the observation time is also not compatible with the auroral assumption.


b. Dust clouds

A regional dust storm was present at the opposite side of the detached layer, but its colour is different from our detached layer’s. While high dust layers could reach an altitude of 80km, they are continuous from the ground to high altitude, unlike this observed layer.


c. Water ice

Water ice cloud at altitudes compatible with our observation are possible, in particular during global dust storms but with smaller ice particles (0.1-0.5µm). Nonetheless our observation could be an atypical water ice cloud, i.e. with large grain size despite its high altitude.


d. CO2 ice cloud

Typical mesospheric Martian day side CO2 ice clouds observed by probes are compatible with our observation in terms of particle size, but smaller (only hundreds of km wide), usually earlier in the year. From Mars Climate Database simulation, CO2 frost point could be reached at equator at the altitude of our observation, but at the limit which could be explained by gravity waves or our cloud being on the colder night side. Most of the system is outside of the common place for CO2 clouds (fig. 5). Our observation could be then an atypical CO2 ice cloud.


Fig. 5: Localisation of the observation compared to:

Top: Magnetic anomaly with two previous observations ([1]).

Bottom: previous CO2 clouds (red stars) projected on an albedo map.


Conclusion

This observation is located on the West border of the main Martian magnetic anomaly (fig. 5). This could show that cosmic rays, like on Earth or Titan, may have acted, through ionization of the atmosphere’s gas or dust particles, as condensation nuclei for the cloud.


For the first time a huge cloud system was observed from Earth, from its appearance on the night side to its dissipation on the day side only thanks to amateurs’ observations. While looking for aurorae, the study of this observation ruled out this explanation, favouring an ice cloud system either made of water or CO2, but atypical regarding some of its characteristics compared to previous observations. Its localization aside the large magnetic anomaly also indicates a possible explanation of its formation through cosmic rays ([6]).


Bibliography

[1] Sánchez-Lavega, A., et al. 2015, Nature

[2] Sánchez-Lavega, A., et al. 2018, Icarus

[3] Mallama, A. 2007, Icarus

[4] Vincendon, M., et al. 2011, Journal of Geophysical Research (Planets)

[5] Lilensten, J., et al. 2015, Planetary and Space Science

[6] Lilensten, J., et al. 2022, A&A (to be published)

How to cite: Delcroix, M., Lilensten, J., Dauvergne, J.-L., Pellier, C., Beaudouin, E., and Vincendon, M.: Amateur observation of an atypical martian atmospheric feature: when serendipity leads to identify an atypical cloud system, Europlanet Science Congress 2022, Granada, Spain, 18–23 Sep 2022, EPSC2022-43, https://doi.org/10.5194/epsc2022-43, 2022.

Jupiter
10:35–10:45
|
EPSC2022-17
John Rogers, Shinji Mizumoto, Candice Hansen, Gerald Eichstädt, Glenn Orton, Thomas Momary, Gianluigi Adamoli, Robert Bullen, Michel Jacquesson, and Hans-Jörg Mettig

Introduction and Summary

The ongoing collaboration between amateur observers and the NASA JunoCam team is yielding insights into phenomena of Jupiter’s North Equatorial Belt (NEB), which in 2021 underwent rarely-seen, radical transformations in its appearance, activity, and jet speed.  Many of these changes reprise what occurred in 2011-12, and we expect that the present phenomena will clarify how a ‘NEB Revival’ develops and how diverse they can be.

NEB Revivals occurred frequently until 1926; but since then, the belt has shown only more modest variations (‘NEB expansion events’), with rapid broadening to the north accompanied by internal convective (‘rifting’) activity.  These have occurred every 3-5 years since 1987 [refs.1&4].  In one such cycle, in 2011-12, the visible dark belt became much narrower than usual then underwent the first NEB Revival since 1926 [refs.1-3].  Unfortunately, most of the activity occurred during solar conjunction. 

In 2021, the visible belt has again shrunk to a narrow south component [NEB(S)]; very dark cyclonic ‘barges’ persist in the whitened northern NEB; and the NEBs jet has accelerated to ‘super-fast’ speeds as the usual NEBs dark formations (NEDFs or ‘hot spots’) have disappeared. But unlike 2011, there have been outbreaks of small bright plumes in the NEB(S), which perturb the adjacent belt.


Fading and quiescence of the belt

A typical NEB expansion event, with vigorous rifting, occurred in the first half of 2020.  The activity subsided in Oct.-Dec.  In 2021 April, the NEB had the classic appearance a year after its expansion event (Figure 1): the expanded NEBn edge was partially faded again, and a prominent array of anticyclonic white ovals (AWOs) and dark brown ‘barges’ had developed.

Then the NEB rapidly faded, and by late August 2021 it was very faint apart from the very narrow, dark reddish-brown NEB(S), and the dark barges. The belt was also very quiet, with none of the usual rifting, and the NEDFs had become very subdued.

JunoCam images confirmed that the scale of turbulence progressively diminished in the later stages of the NEB expansion event, to perijove 34 (PJ34, 2021 June): large rifts give way to smaller-scale, complex rifting texture, and then to very small eddies (Figure 2).  This trend proceeded even further as the belt faded (Figure 2). At PJ36 and thereafter, the whitish cloud cover of the faded NEB has a strange texture of faint sinuous haze bands with little indication of the usual wind gradient.

Two types of low-contrast waves are also visible in some JunoCam images in the quiescent northern NEB from PJ34 to PJ39:

(i) Diffuse, roughly meridional bands at 12-16°N, with wavelengths ~1100-1450 km.

(ii) Mesoscale waves, with wavelengths <200 km.


Acceleration of the NEBs jet and disappearance of NEDFs

As the NEB rifting activity declined, by 2021 June most of the usual NEDFs had become ill-defined and less conspicuous. The last ones disappeared in August, and around that time, much faster tracks appeared on the JUPOS chart (Figure 3), representing smaller features on the NEBs.  In Nov-Dec., fast speeds were seen all around the NEBs, with drift in L1 (DL1) ranging from -51 to -79 deg/30d (u = 130-143 m/s). Thus the NEBs jet has accelerated to ‘super-fast’ speed, as it did in 2011 [refs.1&2].


Bright outbreaks in NEB(S)

With the NEB generally quiescent, small short-lived localised convective outbreaks in the dark NEB(S) have attracted attention.  These are quite common in normal circumstances but especially notable in 2021-22. The first two occurred in 2021 May, then others occurred roughly monthly from August, and more frequently in Dec. (Figure 4).

A typical outbreak begins with a small brilliant white spot in the NEB(S) at ~10°N.  After about a week it extends tenuous white streaks, and the dark brown NEB(S) may become broadened following the plume, and an extremely methane-dark spot appears nearby (Figure 5).  Initially the plume is retrograding (DL1 ≈ +1 to +2 deg/day), but then it moves south to the NEBs edge and becomes prograding (DL1 ≈ –1 to -2 deg/day).

All the outbreaks have occurred within a restricted longitude sector with DL1 ~ +0.4 to +1.7 deg/day (Figure 4). The latter speed would be appropriate for a disturbance in the observed latitude of ~10°N.

The visible appearance suggests that each outbreak begins with the eruption of a convective plume, and this leads to adjacent downdrafts (creating a clear deep hole that is methane-dark) and a disturbed wake (white streaks and reddish-brown belt). The methane-dark patches maintain the slow speed at 9°N, so they may be persistent waves like the usual NEDFs.

The JunoCam images at PJ38 and PJ39 fortunately captured all the types of feature in these outbreaks (Figure 6):

(i) Bright active outbreaks were a thick mass of bright white clouds, probably the top of powerful convective storms with hazes expanding from them. Wakes of whitish haze were seen, containing mesoscale waves at PJ39. 

(ii) NEBs festoons with super-fast speed showed long streaks and cross-cutting orange haze bands, consistent with deep-seated features, although these aspects may not be diagnostic.

(iii) Methane-dark patches were viewed suboptimally but could also be deep features.

Such an outbreak initiated the NEB Revival in 2012 [ref.3].  We will report on developments during 2022. 


Acknowledgements:  Some of this research was funded by NASA. A portion of this was distributed to the Jet Propulsion Laboratory, California Institute of Technology.

References:

1.  Rogers JH (2019) J.Brit.Astron.Assoc. 129, 13-26: ‘Jupiter’s North Equatorial Belt and Jet: I. Cyclic expansions and planetary waves.’

2.  ibid. pp.94-102: ‘II. Acceleration of the jet and the NEB Fade in 2011-12.’

3.  Rogers JH & Adamoli G (2019) ibid. pp. 158-169.   ‘III. The ‘great northern upheaval’ in 2012.’

[Available at:  https://britastro.org/node/15627 (preprints & abstracts) & https://britastro.org/node/7229 (published PDFs).]

4.  Rogers JH et al. (2019) ‘The cyclic expansions of Jupiter’s North Equatorial Belt in 2015-2017.’ EPSC Abstracts Vol. 13, EPSC-DPS2019-302 (2019).

Full details are available on the BAA Jupiter Section web site and the ALPO-Japan web site. 


How to cite: Rogers, J., Mizumoto, S., Hansen, C., Eichstädt, G., Orton, G., Momary, T., Adamoli, G., Bullen, R., Jacquesson, M., and Mettig, H.-J.: The transformation of Jupiter’s North Equatorial Belt in 2021-22, Europlanet Science Congress 2022, Granada, Spain, 18–23 Sep 2022, EPSC2022-17, https://doi.org/10.5194/epsc2022-17, 2022.

10:45–11:00
|
EPSC2022-769
Glenn Orton, Thomas Momary, Shawn Brueshaber, Candice Hansen, Scott Bolton, and John Rogers

Introduction

The extended portion of NASA’s Juno mission began on 1 August 2021 and will continue through September 2025. The extended mission expands Juno’s science goals beyond those of the prime mission, as noted at the last EPSC (Orton et al.  EPSC2021-58).  Atmospheric studies will continue to be among the foremost of science goals and an area in which the world-wide community of Jupiter observers can provide significant contextual support.  Juno’s remote-sensing observations will take advantage of the migration of its closest approaches (“perijoves” or PJs) toward increasingly northern latitudes.  The observations should include close-ups of the circumpolar cyclones and semi-chaotic cyclones known as “folded filamentary regions”. A series of radio occultations will provide vertical profiles of electron density and the neutral-atmospheric temperature over several atmospheric regions. The mission will also map the variability of lightning on Jupiter’s night side.

Physical Details of the Mission

The sequence of orbits and key investigations of the primary and extended missions are shown in Figure 1.  We note that on PJ34, the orbital period was reduced from 53 days to 43-44 days. It will be reduced shortly after this meeting on PJ45 to 38 days and again on PJ57 to ~33 days.

Figure 1. Progression of Juno orbits viewed from above Jupiter’s north pole with respect to local time of day. “PJ” designates a “perijove”, the closest approach to Jupiter on each numbered orbit. Following a Ganymede flyby on PJ34 (green orbit), the orbital period decreased from 53 days to 43-44 days (green + blue orbits). The “Great Blue Spot” (blue) orbits map an isolated patch of intense magnetic field. Following a close Europa flyby on PJ45 (aqua orbit), the period will decrease to ~38 days (orange orbits). Following close flybys of Io on PJ57 and PJ58 (black orbits) the period will decrease  to ~33 days (red orbits). In reflected sunlight, Jupiter will mostly appear as a crescent at perijoves following PJ58.

Some characteristics of perijoves of the extended mission are shown in Table 1. We caution that while the day of year for the perijoves is reasonably fixed, the exact times may change by hours in either direction and the longitudes will change accordingly.  Timing for later orbits up to PJ76, may be affected by currently unmodeled anomalies in satellite masses that could change dates and times.

Figure 2. Expected latitudes and longitudes to be measured by the 20 radio occultations of the Juno spacecraft between PJ52 and PJ77. Locations of ingress lie largely in the northern hemisphere - locations of egress in the southern hemisphere. Locations of the Galileo Probe and Voyager-1 radio occultations are also shown for reference.

Role of Amateur Astronomers

We’ve noted in the past at previous EPSC meetings how amateurs can contribute to the Juno mission via their collective world-wide 24/7 coverage of Jupiter. This applies also to the cadre of professional astronomers supporting the Juno mission and its reconnaissance of  the Jupiter system over a broad spectral range. In the past, these have alerted observers to strong interactions between the Great Red Spot and smaller anticyclones (Sanchez-Lavega et al. 2021. J. Geophys. Res. 126, e006686) and the occurrence and evolution of prominent and unusual vortices, such as “Clyde’s spot” (Hueso et al. 2022. Icarus 380,114994). During the last apparition, observations were made with the NASA Infrared Telescope Facility (IRTF) that showed slow-moving bright patches in the Equatorial Zone (EZ) that were observed more continuously among the amateur community with 890-nm (“methane”) filters. We also identified an intense 5-µm spot detected using IRTF imaging that coincided with an unusually dark spot in amateur methane-filtered images. The continued tracking of outbreaks in the southern part of the North Equatorial Belt (NEB) also greatly informed the Juno team and supporting astronomers regarding the systematic longitudinal distribution of outbreaks and the range of atmospheric features they generate. A perijove-by-perijove summary of Juno-supporting observations – past, current and planned - is available at the following web site: https://www.missionjuno.swri.edu/planned-observations.

We want to emphasize that by PJ50, Juno’s perijoves will have migrated to a part of the planet that is not in sunlight. At that point and through the end of the mission, images from this community will be extremely useful to order to provide a context for several investigations.  One of these will be chief on JunoCam’s agenda during this part of the mission: searches for lightning. But similar contextual information will be sought for measurements of thermal emission from the JIRAM instrument’s high-resolution maps of 5-µm emission, as well as the Microwave Radiometer (MWR) measurements of thermal emission from the deep atmosphere. Although the highest spatial resolution from these instruments will include high northern latitudes (see Table 1) that are not well resolved by small telescopes, measurements of mid-northern latitudes will continue to be made when JunoCam will not be able to provide a visual context.

Table 1. Current estimates for Juno extended mission perijoves PJ45-PJ53.  Timing for orbits PJ54 onward may be affected by currently unmodeled anomalies in satellite masses that could change dates and times. Accordingly we list perijove times to the nearest half hour and longitudes to the nearest 10°.  Orton et al. (EPSC2021-58) presented information for previous perijoves.


How to cite: Orton, G., Momary, T., Brueshaber, S., Hansen, C., Bolton, S., and Rogers, J.: The Juno Extended Mission: A Call for Continued Support from Amateur Observers, Europlanet Science Congress 2022, Granada, Spain, 18–23 Sep 2022, EPSC2022-769, https://doi.org/10.5194/epsc2022-769, 2022.

11:00–11:10
|
EPSC2022-20
Christophe Pellier
  • Introduction

The goal of this work is to calculate the geometric albedo of Jupiter in various photometric bands (and one non photometric). The geometric albedo is defined as the ratio between the brightness of Jupiter as observed as if it was placed at 1 Astronomical Unit (AU) from the Sun, and 1 AU from the observer, to that of a theoretical perfectly reflecting and flat surface of the same area. For this, the first result that must be obtained is the apparent magnitude of Jupiter in each desired band. The formula used to calculate the geometric albedo is taken from Mallama [1]

Photometry is usually performed using non variable stars as references. The process is complicated because it involves compensating for differences in airmass and differences in colour index. To the contrary of stars, moons are not steady sources of light, since their own magnitude is going to vary considering the solar angle, their position respective to Jupiter, and the observed longitude. But, this kind of variation can be predicted, and their effect on magnitude calculated with an acceptable precision for the ambition of this work.

  • Method

The planet is imaged with the method of lucky imaging, ensuring that one galilean moon is within the same field. After a selection of good frames, they are stacked with a unnormalized arithmetic addition. Then, it is possible to calculate the magnitude of Jupiter using the moon as reference, from the equation of simple differential magnitude, example for the V band:

Vjup = vjup + (Vmoon-vmoon)

Where the lower case represents the instrumental magnitude, the upper case the transformed/catalogue magnitude.

  • Photometry in U, B, V bands

The apparent magnitude of the moon in the image is adjusted from an article written by R.L.Millis and D.T.Thompson in 1975 [2]. They provide first the V magnitude of each one of the moon in function of the solar angle, and for various ranges of surface longitude. This data can be compared and modified following various modern ephemeris sources, so the V magnitude of the reference moon can be reliably obtained at the moment of observation.

Then, Millis and Thompson provide the value of the B-V and U-B colour index of each moon in function of the observed surface longitude; as a result, if one has a reliable value for V, he can hope to calculate with a good precision the value of the B and U bands at the moment of the observation. The figure 1 is taken from [2]:

  • Photometry in R and IR bands

Millis and Thompson do not provide data for R and IR bands, and to the knowledege of the author, no references are available in the litterature. However, one kind of data is available, which is the spectroscopic albedo of the moons. In particular, a good reference is found in two articles written by Belgacem and all [3] [4], for Europe and Ganymede, see figure 2 as example for Europe (data is from Calvin (1995)):

Such albedo spectra can be sent into various softwares (ISIS, Rspec) and tranformed into colour spectra, wich are obtained by multiplying them with that of a G2V star. Then, the colour spectra are transformed into flux spectra using the V magnitude of the moon at the moment of the observation.

If correctly done, flux spectra are reputed to be free from any bias and as a result, they can be used to calculate the magnitude of the object in any band, through again the equation of differential magnitude, tranforming the flux value into instrumental magnitude.

This allows to calculate the magnitude of the galilean moons in any R and IR bands, using the magnitudes of the Sun as a reference, since they are accurately known, or directly from another reliable magnitude from the moon itself – figure 3 (example):

  • Results

Following Millis and Thompson, accurate/coherent B and V values have been found, but U was too high, whatever the moon used. The U value is taken from Alpy600 spectro-photometry (not described here). Following the flux method, precise values of Rc and Ic came out. z' is too low, but the author would like to discuss the reference. The albedo value for the CH4/890 band looks correct taking into account the width of the filter used (20 nm). A value for Y is proposed, that looks at least to fit the Karkokschka's spectrum from 1995. See figure 4 below.

Circle: center of transmission, horizontal bar: FWHM, vertical bar is spread of the values, not the standard deviation.

  • References

Web pages of the author with a wider description of the method:

http://www.astrosurf.com/pellier/galilean-photometry_UBV.html

http://www.astrosurf.com/pellier/galilean-photometry_RIC.html

http://www.astrosurf.com/pellier/galilean-photometry_discussion.html

[1] Mallama A, Krobusek B, Pavlov H (2017) “Comprehensive wide-band magnitudes and albedos for the planets, with applications to exo-planets and Planet Nine”, Icarus, Vol 282, January 2017, pages 19-33.

[2] Millis RL, Thompson DT (1975), “ UBV Photometry of the Galilean Satellites”, Icarus, Vol 26, issue 4, December 1975, pages 408-419. 

[3] Belgacem I, Schmidt F, Jonniaux G, “Regional study of Europa's photometry”, Icarus, Vol 338, March 2020, 113525. 

[4] Belgacem I, Schmidt F, Jonniaux G, “Regional study of Ganymede's photometry”, Icarus, Vol 369, November 2021, 114631.

How to cite: Pellier, C.: Galilean Moons-based photometry for Jupiter, Europlanet Science Congress 2022, Granada, Spain, 18–23 Sep 2022, EPSC2022-20, https://doi.org/10.5194/epsc2022-20, 2022.

Asteroids
11:10–11:20
|
EPSC2022-433
Josef Hanus, Franck Marchis, Ryan Lambert, Paul Dalba, Joe Asencio, and Josef Durech

The recently developed Unistellar’s eVscope/eVscope2 and eQuinox telescopes have been delivered to more than 5,000 customers around the globe. These telescope owners already represent the largest worldwide network of potential citizen astronomers. Due to the unified design and user-friendly operation via a smartphone app, several types of useful scientific observations are enabled and supported by Unistellar.

Each individual frame is stored in the telescope and can be accessed in 12-bit TIFF format by the user for the following data processing and analysis. Moreover, the user can upload the data to Unistellar for further processing, which is the main concept of the campaign mode: Any owner of an eVscope can receive notifications on their smartphone of transient events visible in the sky, such as comets, supernovae, asteroid flybys, stellar occultations by asteroids, or other targets of interest, perform the observations and upload the data to Unistellar’s server.

In this contribution, we focus on

(i) light curve observations of asteroids, and

(ii) stellar occultations by asteroids.

Light curves represent the temporal changes of asteroids' brightness within the typical night observational window, which takes usually several hours. Light curve observations allow us to study asteroidal physical properties - rotation period, rotation axis, and the 3D shape model.

During the stellar occultation, the asteroid is passing in front of a bright star, which is occulted, the duration of this event is directly related to the asteroid's dimension. Various observers distributed on the ground can sample different parts of the asteroid, which can lead to an accurate size estimate, and possibly even to a shape model refinement.

In 2021 and 2022, we initiated several observing campaigns aiming at obtaining light curve data of several near-Earth asteroids (NEA) that were having close approaches to the Earth - e.g., NEAs 1999 AP10 and 2000 PQ9. Dozens of citizen scientists provided their observations. Here we show the initial results obtained by analyzing these optical data. We will also discuss the quality of the photometric data and the significance and potential of the eVscope network for the study of the physical properties of asteroids.

We selected asteroids that get bright enough for at least one month, which provides a sufficiently wide window of opportunity for the eVscope users that are often limited by the weather conditions. Also, these targets have unknown or poorly constrained physical properties, which results in the opportunity to contribute to the better characterization and understanding of the population of asteroids.

Within the Unistellar's eVscope network of citizen astronomers, we are targeting stellar occultations in order to estimate their dimensions with an accuracy non-achievable by commonly used techniques such as thermal modeling. This task is quite challenging, however, we will report the first successful observations of these events.

Acknowledgments

The work of JH and JD has been supported by the Czech Science Foundation through grant 22-17783S.

How to cite: Hanus, J., Marchis, F., Lambert, R., Dalba, P., Asencio, J., and Durech, J.: Lightcurve and stellar occultation observations of asteroids with the Unistellar's network of citizen astronomers, Europlanet Science Congress 2022, Granada, Spain, 18–23 Sep 2022, EPSC2022-433, https://doi.org/10.5194/epsc2022-433, 2022.

11:20–11:30
Coffee break
Chairpersons: Anastasia Kokori, Marc Delcroix
Exoplanets
12:00–12:15
|
EPSC2022-315
|
solicited
|
MI
Yves Jongen

1000 planetary transits measurements published in ExoClock by an amateur astronomer

Yves Jongen

Observatoire de Vaison, Vaison la Romaine, France

Abstract :

The ExoClock collaboration aims at improving the ephemerides of exoplanets that will be future targets for the Ariel mission.  ExoClock was launched in September 2019 and counts over 140 participants from more than 15 countries around the world.

A participant to the ExoClock Collaboration, the author has measured and published in ExoClock more than thousand planetary transit curves. The experimental equipment is composed of two identical telescopes (Plane Wave CDK 17”) of 430 mm diameter. One telescope is in Rasteau, in the South of France. The other telescope is installed at “Deep Sky Chile”, a telescope hosting facility located in the Rio Hurtado valley in Chile, not far from the Cerro Tololo, Gemini South and the brand-new Vera C. Rubin (LSST) observatories.

The poster will describe the experimental setup and the optical performances obtained at both sites, analyzing the strengths and weaknesses of each setup. The range of stars that can be best observed with each system will be described.

The poster will describe also the software used for the data acquisition and processing, as well as the tactics used in data processing to maximize the probability to obtain clean transit curves.

For high brightness stars, that could easily cause saturation in the camera, two solutions are compared: a slight defocusing, or averaging 2 4 or 8 short duration exposures for each step of the light curve

How to cite: Jongen, Y.: 1000 planetary transits measurements published in ExoClock by an amateur astronomer, Europlanet Science Congress 2022, Granada, Spain, 18–23 Sep 2022, EPSC2022-315, https://doi.org/10.5194/epsc2022-315, 2022.

12:15–12:25
|
EPSC2022-483
|
ECP
Anastasia Kokori

ExoClock (exoclock.space) is a project aiming to monitor transiting exoplanets through regular observations using small and medium scale telescopes. The project is part of the ephemerides working group of ESA's Ariel space mission and the main scope is to maximise the mission efficiency. This effort was launched in EPSC2019 and we are actively collaborating with both professional and amateur astronomers coming from various countries across the world. In this talk, I will talk about the organisation of the project and the main tools that are used to achieve an effective pro-am collaboration. I will also present the current status of the project and the results of the publications we have produced so far. Our research includes a collective analysis of light-curves aquired by ground telescopes most of which belong to amateur astronomers. This data are used in combination with other resources (literature data, space data and light curves from other networks) to update the ephemerides of exoplanets that are candidates for the Ariel space mission. The ExoClock network currently consists of 550 participants out of whom 420 are amateur astronomers, a number that highlights the significant contribution of amateurs in our project. 

How to cite: Kokori, A.: ExoClock project: a pro-am collaboration to monitor the exoplanet ephemerides for the Ariel space mission, Europlanet Science Congress 2022, Granada, Spain, 18–23 Sep 2022, EPSC2022-483, https://doi.org/10.5194/epsc2022-483, 2022.

12:25–12:35
|
EPSC2022-945
Florence Libotte and Mercè Correa

I this talk I will present the process to get observations on a Europlanet network telescope for an exoplanet transit.  The steps of obtaining and also analysing the exoplanet transit light curve will be described. These data are used for the future Ariel space mission organised by ESA. Moreover,  the talk will describe the process of writing the proposal for the request of the observation and in the particular case to the Instituto de Astrofísica de Canarias. In parallel, I will explain the way to obtain the funding for the telescope cost by Europlanet organization. Then I will go through the observations themselves and the live decisions regarding signal to noise, exposure time and so on in order to maximize the success probability. Then a report regarding the progress of the observation(s) is written and sent to the organisers. After the part of obtaining the observation, I will describe he process of analysing the images with the ExoClock HOPS software. Details will be provided on how to work with it, how to choose comparison stars, how to get the best light curve and to determine the exact moments of the ingress of the transit and the egress of it. Once the light curve is produced, it is uploaded in the ExoClock website and after reviewing it gets published at the ExoClock database. I would like to highlight that main partners in this work are two women, what is not so common in this field.

How to cite: Libotte, F. and Correa, M.: Exoplanet observations: amateur experience from the Europlanet Telescope network, Europlanet Science Congress 2022, Granada, Spain, 18–23 Sep 2022, EPSC2022-945, https://doi.org/10.5194/epsc2022-945, 2022.

12:35–12:45
|
EPSC2022-1176
The PLATO-TESSt - preparing planet candidate validation for PLATO
(withdrawn)
Günther Wuchterl
General pro-am collaborations
12:45–13:00
|
EPSC2022-1135
|
ECP
Helen Usher, Colin Snodgrass, Nicolas Biver, Günter Kargl, Gražina Tautvaišienė, Nick James, Filip Walter, and Jakub Černý

Comet observation and analysis is an area where amateur observers can make a significant contribution.  Their observations allow regular monitoring of comets, alerting the professional community to interesting events, and providing raw data to supplement professional data.  The links between the professional and amateur communities are therefore very important.  

Comet analysis is challenging.  Encouraging the community to agree consistent methodologies, and parameters for analysis, will result in a more robust data set for monitoring and analysis.

The last comet workshop was held in 2015 and the comet community welcomed the opportunity to meet again.  

The main aims and objectives of the workshop were agreed, following consultation, to be:

  • To foster stronger working relationships and cooperation within the professional and amateur comet community, based on a shared understanding of the challenges and opportunities.
  • To take stock of where cometary science stands post-Rosetta and how Pro-Am observations fit into potential future research. 
  • To draw together the various strands of work currently going on within the community, particularly on coordination, techniques, standards and archiving and agree the way forward.
  • To consider how best to encourage, and equip, more people to become involved in the study of comets, whether directly through observation (including access to the Europlanet Telescope Network), or through analysis of online data sources.  
  • To explore how cometary science can be used in outreach and education.

It was also agreed that speakers should include a wide range of amateurs, students and professional astronomers, and that allowing ample time for panel-led discussions was very important.  The panels should include specialists and society representatives.

An accessible location was chosen, the Stefanik Observatory in Prague, along with online access. 

We will report on the outcomes from the hybrid workshop and the proposed next steps.


Acknowledgements

The workshop has been organised in cooperation with Europlanet 2024 Research Infrastructure (RI), the British Astronomical Association, Planetum Prague, and the Czech cometary community SMPH. 

Europlanet 2024 RI has received funding from the European Union’s Horizon 2020 research and innovation programme under grant agreement No 871149.  

How to cite: Usher, H., Snodgrass, C., Biver, N., Kargl, G., Tautvaišienė, G., James, N., Walter, F., and Černý, J.: Strengthening Pro-Am Comet Community Cooperation: Report on Europlanet Pro-Am Workshop (10-12 June 2022) , Europlanet Science Congress 2022, Granada, Spain, 18–23 Sep 2022, EPSC2022-1135, https://doi.org/10.5194/epsc2022-1135, 2022.

13:00–13:10
|
EPSC2022-1222
Daniel Nicolae Berteșteanu, Marcel Popescu, Radu Mihai Gherase, Jad Alexandru Mansour, Bogdan Alexandru Dumitru, Bogdan Stanciu, Anastasia Perrotta, Marian H. Naiman, Octavian Blagoi, Tudor Dumitru, and Ana Lupoae

The technological progress of electronic, optic and mechanic domains brought high performance astronomy equipment at affordable prices for student and amateur astronomers.  As a result, the amateur astronomers contribution to scientific publications has increased exponentially (e.g. Knapen 2011, Mousis et al. 2013). For example, various transient events and long term monitoring  of celestial bodies can be observed  with a telescope having an aperture of 0.2-0.5 m, and CCD or CMOS detector (e.g. Gherase et al. 2015).

Also, such equipment allows to attract students for a career in science and technology. The "astronomical concepts  and images have universal appeal, inspiring wonder and resonating uniquely with human questions about our nature and our place in the universe" (National Academies Press, 2021). Thus, we believe that fundamental concepts related to the scientific method can be learned by a student who comes with questions related to celestial bodies, makes his own observations, processes the acquired images, analyzes the obtained data, and then presents his new findings to the community.

Motivated by these facts we developed  T025 – BD4SB telescope. The acronym is represented by the aperture of the telescope (0.25 m) and the project through which we financed its acquisition (Big Data for Small Bodies). We installed this robotic telescope on the roof of the old Bucharest Astronomical Institute. This location corresponds to Minor Planet Center observatory code 073. Here we describe the setup, highlight some of the obtained results, and we discuss the perspectives.

Setup
The components of the instrument are: a Lacerta 250/1000 Newtonian telescope mounted on  a Sky Watcher EQ6 Pro Go-To equatorial mount, a 14 bit QHY 294M Medium Size Cooled CMOS Camera, and a mini PC Beelink computer for controlling the setup. Including the auxiliaries (guiding telescope and camera, cables, and adapters) the cost of this setup was about 6k euros (as of 2020).  Additionally, a permanent internet connection and electrical power are needed. This setup gives a field of view of 44x66 arcminutes, and a projected pixel size of 0.956 arcesc/pixel.

Fig.1 The  T025 – BD4SB prepared for observations.

The full control of  this instrument is made using the Nighttime Imaging 'N' Astronomy – NINA software interface (https://nighttime-imaging.eu/). The data reduction is performed using the IRAF and its PyRAF counterpart in Python. We designed a general pipeline based on Python scripts to perform the bias and flat corrections, to find the astrometric solution using Source Extractor and SCAMP software, and to retrieve the photometry of all sources in the images.  All data is stored on a dedicated server and we intend to make it online available. Additionally, we use Astrometrica, Tycho, MPO Canopus and HOPS (HOlomon Photometric Software)  programs for specific tasks.

The median magnitude limit is ~20  V band magnitude. Because we are observing from a light polluted area (although we are located in the Carol Park from Bucharest, and the area is surrounded by a lot of trees), the sky brightness varies between the seasons, and consequently the limiting magnitudes are in the range of 19 – 20.7. These limiting magnitudes could be obtained in about ~15 min total exposure time, and they are imposed by the brightness of the sky. The median seeing is ~2.8 arcsec, but the range of variability is 1.8 -4 arcsec.


Observations and results
The objectives of our project is to obtain high quality astrometric and photometric data which can be used for university student projects (including those for bachelor thesis and master thesis) and for participating in scientific publications.  Thus, we make the following types of observations: 1) astrometric observations of asteroids and comets, prioritizing the newly discovered NEAs or those with uncertain orbits; 2) photometric observations of Solar System bodies with the aim to obtain accurate light-curves  for deriving the spin-properties and their shape; 3) the occultations which are performed in various international campaigns; 4) follow-up of various exoplanets transits; 5) light-curves of variable stars.

We reported more than 100 observations to the Minor Planet Center. These include three  confirmations of newly discovered NEAs, and the participation to the  IAWN campaign for 2019 XS (Farnochia et al. 2022). We obtained the light-curves and rotation-periods for four NEAs, designated 4660, 153591, 12711, 2019 XS. We obtained more than 65 hours of data for asteroid (4660)Nereus which (Mansour et al. EPSC 2022).

One of the challenging observation was  obtained during the nights of November 10-11, 2021 for the NEA 2019 XS (absolute magnitude of 23.87).   The object moved with an apparent rate of 20-30 arcsec/min, so we could use an exposure time of 5-10 sec and we had to change the field several times during the night. The result (Fig. 2) shown strong evidences that 2019 XS is a tumbling asteroid.


Fig.2 The light-curves obtained for 2019 XS. Colors correspond to different fields and the black line is a median of every 9 points.


Another result we highlight is the four transits we observed for exoplanets TOI-1259Ab, WASP-10b, HAT-P-3b. The lightcurves were submitted to  TRESCA-Exoplanets (http://var2.astro.cz/EN/tresca/) database.  They show that such setup can obtain photometric measurements with a precision in the range of mili-magnitudes for targets as faint as 14.


Fig.3  The transit of WASP-10b exoplanet .


Acknowledgments
This work was supported by a grant of the Romanian National Authority for Scientific Research – UEFISCDI, project number PN-III-P1-1.1- TE-2019-1504, contract number TE 173/23/20/2002.

References
1. Johan H. Knapen 2011, Proceedings of ”Stellar Winds in Interaction”
2. Mousis et al. 2014, Experimental Astronomy, Volume 38, Issue 1-2, pp. 91-191
3. Radu-Mihai Gherase et al. 2015, Romanian Astronomical Journal, Vol. 25, No. 3, p.241
4. Astronomy and Astrophysics in the New Millennium; The National Academies Press. https://doi.org/10.17226/9839
5. Farnochia et al. 2022, PSJ, accepted

How to cite: Nicolae Berteșteanu, D., Popescu, M., Mihai Gherase, R., Alexandru Mansour, J., Alexandru Dumitru, B., Stanciu, B., Perrotta, A., H. Naiman, M., Blagoi, O., Dumitru, T., and Lupoae, A.: The T025 – BD4SB a pro-am collaboration for planetary sciences, Europlanet Science Congress 2022, Granada, Spain, 18–23 Sep 2022, EPSC2022-1222, https://doi.org/10.5194/epsc2022-1222, 2022.

13:10–13:20
|
EPSC2022-940
Iñaki Ordoñez Etxeberria, Ana Guijarro Román, Ángel Rafael López Sánchez, Enrique Diez Alonso, Itziar Garate Lopez, Joaquín Álvaro Contreras, Miriam Cortés Contreras, and Salvador Ribas

Non-professional astronomers can significantly contribute to key research projects in Astronomy. The collaboration between professional and amateur astronomers is known as ProAm collaboration. Since 2009 the Spanish Astronomy Association (SEA) has housed a specific working group promoting the relationship between professional and amateur astronomers: the ProAm Commission.

The SEA ProAm Commission has just published a report analyzing the status of the ProAm collaboration in Spain. It is the first time that such analysis has been performed in Spain.

Data were collected using the information provided in recent amateur astronomy conferences. An exhaustive search of scientific publications in which amateur astronomers had participated was also carried out. And a survey to both amateur and professional astronomers was conducted to compile key information.

This report confirms that Spanish amateur astronomers collaborate significantly with professional astrophysicists, with around a 100 of them being regularly included in science publications and astronomical circulars. The number of ProAm collaborations is steadily increasing with time. More than 200 peer-reviewed publications and almost 5000 astronomical circulars including Spanish amateur astronomers have been published to date. However the fraction of women involved in ProAm collaborations is low: 4% and 7% for the professional and amateur astronomers, respectively. This significant gender gap needs to be addressed.

Both amateur and professional astronomers requested to improve communication channels in both directions. The SEA ProAm Commission is addressing this issue with the development of a specific webpage, https://proam.sea-astronomia.es .

In addition, since 2021 the SEA ProAm Commission organizes informative sessions on a monthly basis with the aim of promoting the visibility of the ProAm collaboration in Spain.

The SEA ProAm Commission is also coordinating several training courses to increase the observing and data processing skills of amateur astronomers. So far two courses have been held: 'Python Course for amateur astronomers' and the 'Astronomical Calculation Course'. All the training courses (material and recordings of the sessions) and the dissemination sessions of the ProAm projects are publically available in the SEA ProAm Commission webpage.

Finally, we have defined a code of good conduct applicable to ProAm collaborations and relationships in astronomy, where the rules and good practices to be followed are brought together to guarantee the well-being of all the people who participate in ProAm projects.

How to cite: Ordoñez Etxeberria, I., Guijarro Román, A., López Sánchez, Á. R., Diez Alonso, E., Garate Lopez, I., Álvaro Contreras, J., Cortés Contreras, M., and Ribas, S.: ProAm Commission of the Spanish Astronomical Society: assessment of ProAm collaboration in Spain and how to improve it, Europlanet Science Congress 2022, Granada, Spain, 18–23 Sep 2022, EPSC2022-940, https://doi.org/10.5194/epsc2022-940, 2022.

13:20–13:30
|
EPSC2022-651
Grazina Tautvaisiene, Ricardo Hueso, Edyta Podlewska-Gaca, Guenter Kargl, Sarunas Mikolaitis, and Itziar Garate-Lopez

The Europlanet 2024 Research Infrastructure (RI) provides free access to the world’s largest collection of planetary simulation and analysis facilities, data services and tools, a ground-based observational network and programme of community support activities (https://www.europlanet-society.org/europlanet-2024-ri/). 

A new collaboration between telescopes around the world has been launched in 2020 to provide coordinated observations and rapid responses in support of planetary research from space missions and in follow-ups of new events. The Europlanet Telescope Network (EPN-TN) is providing professional and trained amateur observers with access to small and medium-sized telescopes located around the globe (https://www.europlanet-society.org/europlanet-2024-ri/telescope-network/).

The EPN-TN currently comprises 16 observatories with 46 telescopes ranging from 40 cm to 2 m in size. The network can be accessed free of charge to carry out projects on a wide variety of scientific studies about the Solar System and exoplanets, as well as related astronomical investigations. The network is open for new infrastructures.

 The first scientific results achieved with EPN-TN were  presented at the Europlanet Telescope Network Science Meeting held on the 6-11 February, 2022. Among 210 participants from 43 countries, there were 80 amateur astronomers participating  (http://mao.tfai.vu.lt/europlanet2022/). The network aims to strengthen collaborations between professional and amateur astronomers, who are playing an increasingly important role in planetary research. Observing time applicants from amateur astronomers are very welcome. 

We will overview the EPN-TN and its potential in fostering the collaboration between professional and amateur astronomers.


Acknowledgements

Europlanet 2024 RI has received funding from the European Union’s Horizon 2020 research and innovation programme under grant agreement No 871149.

How to cite: Tautvaisiene, G., Hueso, R., Podlewska-Gaca, E., Kargl, G., Mikolaitis, S., and Garate-Lopez, I.: Europlanet 2024 RI: Fostering the collaboration between professional and amateur astronomers, Europlanet Science Congress 2022, Granada, Spain, 18–23 Sep 2022, EPSC2022-651, https://doi.org/10.5194/epsc2022-651, 2022.

Display time: Mon, 19 Sep 08:30–Wed, 21 Sep 11:00

Posters: Mon, 19 Sep, 18:45–20:15 | Poster area Level 2

Chairpersons: Ricardo Hueso, Marc Delcroix
L2.81
|
EPSC2022-51
Christophe Pellier
  • Introduction

The colours of the belts, zones, and individual features of Jupiter are known to encounter significant variations either on short or long time scales. Those variations are the results of chemical or physical changes of the planet's meteorology that are of much interest. In order to try to precisely describe the colours of the planet beyond simple assessments (either visually or from images), the author presents results obtained with tools found in the scientific litterature, to characterize the colours of Jupiter during the apparition of 2021.

Scientific references showing examples of the same kind of work are [1] and [2]

  • Method

The planet is imaged with the method of lucky imaging, with a complete set of UBVRcIc plus z', CH4/890, and Y filters. Two cameras are used, one monochrome (ASI290MM from ZWO) and one colour, the ASI462MC, to benefit from its huge sensitivity in the near infrared wavelengths. Wavelet processing is not applied on the images. The geometric albedo of the planet is calculated for each one of the bands, thanks to the method exposed in EPSC2022-20, and the values are exploited with the following presentations. Figures 1 and 2 show photometric images taken respectively on September 6th, 2021, and September 23rd, showing the Great red spot.

  • North-South scans

The goal is to characterize the photometric profile of the planet in direction of the polar axis, for each band of light. For this, images where longitudes estimated to be "representative" of the global state of the planet are used.

Another method would be to use images spanning a long range of longitudes. To diminish the sensitivity of a cut along a single line to local variations (i.e presence of individual spots...) the author used the software RSpec to select a wider range of longitudes around the central meridian (figure 3)

Images are not used directly: they are first sent into WinJupos and mapped onto equirectangular projection with planetographic latitude scale that allows to eliminate the moderate tilt of the globe, when present. The only thing not corrected is the small gradient of light brought by the polar tilt (the "winter" hemisphere being a bit less lit by the Sun). The photometric profile is calibrated in “wavelengths” from 0 to 180, to ease the building of the latitude scale (+90/-90°).

Finally, the profile is calibrated in intensity by calculating the albedo of a well identified region with the same method exposed in point 4 below. On figure 4 is an example of a final scan, all will be visible on the poster.

Ratios of some of those north-south scans can be made to provide colour indices that may reveal additionnal informations. Here is a B-Rc that may forms a good index of the colours of the planet, since the B band is where the maximum of variation occurs, when they are minimal in red (or IR) - figure 5:

  • Spectra of individual features or regions

This work also allows to build spectra of individual features or regions, like the Great Red Spot, when measuring their particular albedo on the central meridian. Spectra will then only have a few points, depending on the number of filters used. To measure the albedo of individual features, the author used a circle of know radius (5 or 10 pixels...), noted the value of apparent brightness, and calculated what would be the brightness if this small area would be as large as the disk itself. Then by a simple rule of three, knowing what is the albedo of the global disk, it is possible to calculate the albedo of the feature of interest. An example of such spectra can be found in [2].

  • References

[1] Mendikoa, I., Sanchez-Lavega,A., Pérez-Hoyos,S., Hueso,R., Rojas, J-F., Lopez-Santiago,J., "Temporal and spatial variations of the absolute reflectivity of Jupiter and Saturn from 0,38 to 1,7 µm with PlanetCam-UPV/EHU", Astronomy and Astrophysics, vol.607, november 2017.

[2] Simon AA, Wong MH, Rogers JH, Orton GS, De Pater I, Asay-Davis X, Carlson RW, Marcus PS, “Dramatic change in Jupiter's Great Red Spot from spacecraft observations”, The Astrophysical Journal Letters, 797:L31, 2014.

How to cite: Pellier, C.: The colours of Jupiter in 2021, Europlanet Science Congress 2022, Granada, Spain, 18–23 Sep 2022, EPSC2022-51, https://doi.org/10.5194/epsc2022-51, 2022.

L2.82
|
EPSC2022-553
|
ECP
Edyta Podlewska-Gaca, Krzysztof Langner, Emil Wilawer, Przemysław Bartczak, Itziar Garate Lopez, Ricardo Hueso, Gunter Kargl, Colin Snodgrass, and Grazina Tautvaisiene

We present PlAnetaRy SciencE Collaboration tool (PARSEC), a service for coordinating the Solar System observations for observers and researchers. Parsec contains observational campaign coordination tool with alert system and email notifications. The service can be found at www.parsec-europlanet.eu.

In the framework of the Europlanet-2024-RI project we are  developping  a generalized Alert System for observations, which will notify and allow participating observatories to select appropriate targets across the diverse range of planetary science topics. This will provide both regular monitoring of targets and alerts for events  requiring time-critical and/or spatially distributed observations (e.g. stellar occultations by asteroids). The service will be based on the existing alert system software created to coordinate amateur observations of asteroids in support of the ESA Gaia mission (Gaia-GOSA, www.gaiagosa.eu, Santana-Ros et al., 2016).

We have chosen a toolset for the service development: PARSEC (PlAnetaRy SciencE Collaboration tool) which is a webapp created in Python, Flask and bootstrap frameworks with additional C++ code and postgresql database. The main features were programmed, thereby enabling request views on the main page, request filtering by observation date, target category, ownership, campaign view, and a notification system. The user can also establish preferences for notifications and follow requests/campaigns. In the „Requests” view there is the possibility of adding, editing, deleting, commenting the observational needs. Similarly, in „Campaigns” the user can start and coordinate observing campaigns of objects or events. In addition, observational alerts on topics related to planetary atmospheres are announced at the PVOL database (http://pvol2.ehu.eus/pvol2/) including in some cases detailed observation ephemeris and links to relevant campaigns around each alert. The service is currently under developmend, and testing by users is strongly recommended. The service can be found at www.parsec-europlanet.eu.

Santana-Ros T., Marciniak A., Bartczak P., 2016, “Gaia-GOSA: A Collaborative Service for Asteroid Observers”,MPBull, 43, 205


How to cite: Podlewska-Gaca, E., Langner, K., Wilawer, E., Bartczak, P., Garate Lopez, I., Hueso, R., Kargl, G., Snodgrass, C., and Tautvaisiene, G.: PARSEC Alert System, Europlanet Science Congress 2022, Granada, Spain, 18–23 Sep 2022, EPSC2022-553, https://doi.org/10.5194/epsc2022-553, 2022.

L2.83
|
EPSC2022-854
Ricardo Hueso, Jon Legarreta-Exegibel, Agustín Sánchez-Lavega, Iñaki Ordoñez-Etxeberria, Stéphane Erard, and Itziar Garate-Lopez

The Planetary Virtual Observatory & Laboratory database (PVOL, http://pvol2.ehu.eus/pvol2/) contains a large set of amateur observations of solar system planets and is a tool that has been widely used in pro-am collaborations. PVOL is integrated in the Virtual European Solar and Planetary Access (VESPA, http://vespa.obspm.fr/planetary/data/) set of services developed through Europlanet 2020 RI and Europlanet 2024 RI, further increasing its visibility in the professional astronomy landscape. The essential content of PVOL is images of the planets obtained by amateur astronomers. This content is continuously updated by registered users, and a web manager who uploads submissions from not registered users sent by email to pvol@ehu.eus.

Close to planetary oppositions, daily observations of Mars, Jupiter and Saturn allow detailed surveys of their atmospheric activity. Near maximum elongation of Venus, amateur images unveil large-scale structures in the clouds. Amateur observations of Uranus and Neptune are not so common, but amateurs obtain very valuable observations of these atmospheres in special cases when alerts of new large atmospheric features are sent. The potential for science of these data sets is very large, and PVOL contains a list of >40 scientific publications led by researchers from several independent teams using data from PVOL in different  domains. Further observations of Galilean moons and even our Moon can be submitted to PVOL where the data can serve different purposes, including educational ones. Thus, PVOL is increasing is role as a general service to the planetary sciences community and the amateur astronomers collaborating with different research groups.

Figure 1 shows a set of various images of planets available in the database.

Figure1: Set of amateur images in the PVOL database obtained by different observers and covering different scientific domains.

In recent years, new data types have been added including: (i) Maps of Junocam images of Jupiter (see Figure 2), (ii) photometry and spectroscopic data. The system also keeps track of publications using PVOL data and supports specific campaigns, like the Venus BepiColombo flyby, or the search for Jovian Impacts in collaboration with the DeTeCt project at http://www.astrosurf.com/planetessaf/doc/project_detect.php. In addition, PVOL contains an alert section where observational alerts are updated regularly besides submissions by email to specific e-mail lists of amateur astronomers.

In this contribution we review the status of the data in PVOL (see Figure 3) and additional services and we indicate future plans for PVOL including a better handling of photometric and spectroscopic data submitted by amateur astronomers.


Figure 2: One of the many Junocam maps of Jupiter in the PVOL database.

Figure 3: Number of observations per target currently stored in PVOL. Jupiter numbers include maps of Jupiter obtained by the Junocam instrument on the Juno mission.


Acknowledgements

We are very grateful to the large community of amateur astronomers submitting their observations to PVOL. We are also grateful to C. Hansen and G. S. Orton for their generous collaboration in helping us with data from the Junocam instrument, and also from their continuous support of pro-am activities around Juno. Europlanet 2024 RI has received funding from the European Union’s Horizon 2020 research and innovation programme under grant agreement No 871149.


How to cite: Hueso, R., Legarreta-Exegibel, J., Sánchez-Lavega, A., Ordoñez-Etxeberria, I., Erard, S., and Garate-Lopez, I.: Status of the PVOL Image database and future prospects, Europlanet Science Congress 2022, Granada, Spain, 18–23 Sep 2022, EPSC2022-854, https://doi.org/10.5194/epsc2022-854, 2022.

L2.84
|
EPSC2022-67
Harri Haukka, Veli-Pekka Hentunen, Markku Nissinen, Tuomo Salmi, Hannu Aartolahti, Jari Juutilainen, Esa Heikkinen, and Harri Vilokki

Introduction

Taurus Hill Observatory (THO) [1], observatory code A95, is an amateur observatory located in Varkaus, Finland. The observatory is maintained by the local astronomical association Warkauden Kassiopeia. THO research team has observed and measured various stellar objects and phenomena. Observatory has mainly focused on exoplanet light curve measurements, observing the gamma rays burst, supernova discoveries and monitoring [2]. We also do long term monitoring projects [3].

The results and publications that pro-am based observatories, like THO, have contributed, clearly demonstrates that pro-amateurs are a significant resource for the professional astronomers now and even more in the future.

High Quality Measurements

The quality of the telescopes and CCD-cameras has significantly developed in 20 years. Today it is possible for pro-am's to make high quality measurements [4] with the precision that is scientifically valid. In THO we can measure exoplanet transits < 10 millimagnitude precision when the limiting magnitude of the observed object is 15 magnitudes. At very good conditions it is possible to detect as low as 1 to 2 millimagnitude variations in the light curve.

Season 2021 – 2022 Exoplanet Observations Review

A total of about 30 exoplanet observations and transit measurements were made during the observation season 2021/2022. All the measurements have been uploaded to the TRESCA database [5]. In total, about 250 light curve observations have now been sent directly to TRESCA from the Taurus Hill Observatory.

The season highlights that we consider to be most important could be the clear time deviations from the forecasts for a few TESS candidates, and in particular the Qatar-8b transit time deviations. The TOI1582.01b transit was not detected during the predicted period at all, so it differed quite a bit from the predicted one. These observations are presented in the following figures.

Figure 1: TOI1168.01b. The transit occurred about 1.7 hours earlier than predicted. Image: TRESCA.

Figure 2: TOI1455.01b. The transit occurred 1.6 hours earlier than predicted. Image: TRESCA.

Figure 3: TOI1582.01b. Not any clear transit was detected. Image: TRESCA.

Figure 4: TOI2152.01b. The transit occurred about 20 minutes earlier than predicted. Image: TRESCA.

Figure 5: Qatar-8b. The transit happened about three hours later than predicted. Image: TRESCA.

Adapting a New Camera for Measurements

The main equipment throughout the winter were Celestron C-14 SC telescope with a Paramount MEII tripod and an SBIG ST-8XME CCD camera with Baader Bessell BVRI photometric filters.

During the spring 2022, the ASI2600MM Pro CMOS camera was tested for the first time in Taurus Hill Observatory with a Chroma I filter connected to a Meade 16” ACX -telescope (with a Paramount ME tripod) for light curve measurements in the WASP-12b observations on March 31, 2022. At the same time, the object was also detected with an SBIG ST-8XME CCD camera connected to the Celestron C-14 SC -telescope. The results were very similar, so the CMOS camera is well suited for light curve measurements. An interesting feature of the transit of  the WASP-12b was that immediately after the actual transit there is a very small dimming of 3 to 5 mmag, which lasts for about 30 minutes. MaxIm DL v6.08 software was used for imaging and image calibration, AIP4Win v2.4.10 software was used for photometric measurements.

The weather was even throughout the dark winter season from August to the end of April. The clearest nights were in March-April. The winter was very rainy overall, there was an exceptional amount of snow. In addition to exoplanet observations, Taurus Hill Observatory focused on comet imaging, DS imaging and the detection of GRB 220101A after-gamma glow, for which circular GCN 31356 [6] was published.

Acknowledgements

The Taurus Hill Observatory will acknowledge all the cooperation partners, Finnish Meteorological Institute and all financial supporters of the observatory.

References

[1] Taurus Hill Observatory website, http://www.taurushill.net

[2] A low-energy core-collapse supernova without a hydrogen envelope; S. Valenti, A. Pastorello, E. Cappellaro, S. Benetti, P. A. Mazzali, J. Manteca, S. Taubenberger, N. Elias-Rosa, R. Ferrando, A. Harutyunyan, V.-P. Hentunen, M. Nissinen, E. Pian, M. Turatto, L. Zampieri and S. J. Smartt; Nature 459, 674-677 (4 June 2009); Nature Publishing Group; 2009.

[3] A massive binary black-hole system in OJ 287 and a test of general relativity; M. J. Valtonen, H. J. Lehto, K. Nilsson, J. Heidt, L. O. Takalo, A. Sillanpää, C. Villforth, M. Kidger, G. Poyner, T. Pursimo, S. Zola, J.-H. Wu, X. Zhou, K. Sadakane, M. Drozdz, D. Koziel, D. Marchev, W. Ogloza, C. Porowski, M. Siwak, G. Stachowski, M. Winiarski, V.-P. Hentunen, M. Nissinen, A. Liakos & S. Dogru; Nature - Volume 452 Number 7189 pp781-912; Nature Publishing Group; 2008

[4] Transit timing analysis of the exoplanet TrES-5 b. Possible existence of the exoplanet TrES-5 c; Eugene N Sokov,  Iraida A Sokova, Vladimir V Dyachenko, Denis A Rastegaev, Artem Burdanov, Sergey A Rusov, Paul Benni, Stan Shadick, Veli-Pekka Hentunen, Mark Salisbury, Nicolas Esseiva, Joe Garlitz, Marc Bretton, Yenal Ogmen, Yuri Karavaev,Anthony Ayiomamitis, Oleg Mazurenko, David Alonso, Sergey F Velichko; Monthly Notices of the Royal Astronomical Society, Volume 480, Issue 1, October 2018, Pages 291–301, https://doi.org/10.1093/mnras/ sty1615

[5] TRESCA; var2.astro.cz/tresca/transits.php?pozor=Veli-Pekka Hentunen&object=&page=1&lang=cz  

[6] Hentunen V-P, Nissinen M, Heikkinen E; GCN 31356; https://gcn.gsfc.nasa.gov/gcn/gcn3/31356.gcn3

How to cite: Haukka, H., Hentunen, V.-P., Nissinen, M., Salmi, T., Aartolahti, H., Juutilainen, J., Heikkinen, E., and Vilokki, H.: Taurus Hill Observatory Season 2021 – 2022 Exoplanet Observations Review, Europlanet Science Congress 2022, Granada, Spain, 18–23 Sep 2022, EPSC2022-67, https://doi.org/10.5194/epsc2022-67, 2022.

L2.85
|
EPSC2022-802
Steven M Hill and John Rogers

Abstract

As a potential pro-am complement to professional Jovian ammonia observations, continuum-divided 645 nm ammonia absorption observations were made using a small telescope. This paper presents highlights of observations during 2020 and 2021. If this low-cost technique can be promulgated among amateurs, then routine atmospheric monitoring of Jupiter would reach a new level of sophistication.

Introduction

New microwave and MIR observations, along with models, reveal much about Jupiter's ammonia cycle at depth. For example, the Juno MWR instrument permits the retrieval of the average ammonia abundance to a depth of 100 bar [1]. Additional recent work has used MIR observations to probe to depths of several bars [2-3]. Similarly, there have been efforts at global retrievals using hyperspectral imaging in the optical and NIR [4-5]. Complementing these efforts have been notable improvements in the understanding of the ammonia optical and NIR absorption bands [6]. Slit spectrometry data extend an already long record [7]. Finally, recent work has shown the efficacy of imaging Jovian upper tropospheric features in the 645 nm ammonia absorption band [8], which the current paper expands upon.

Observations

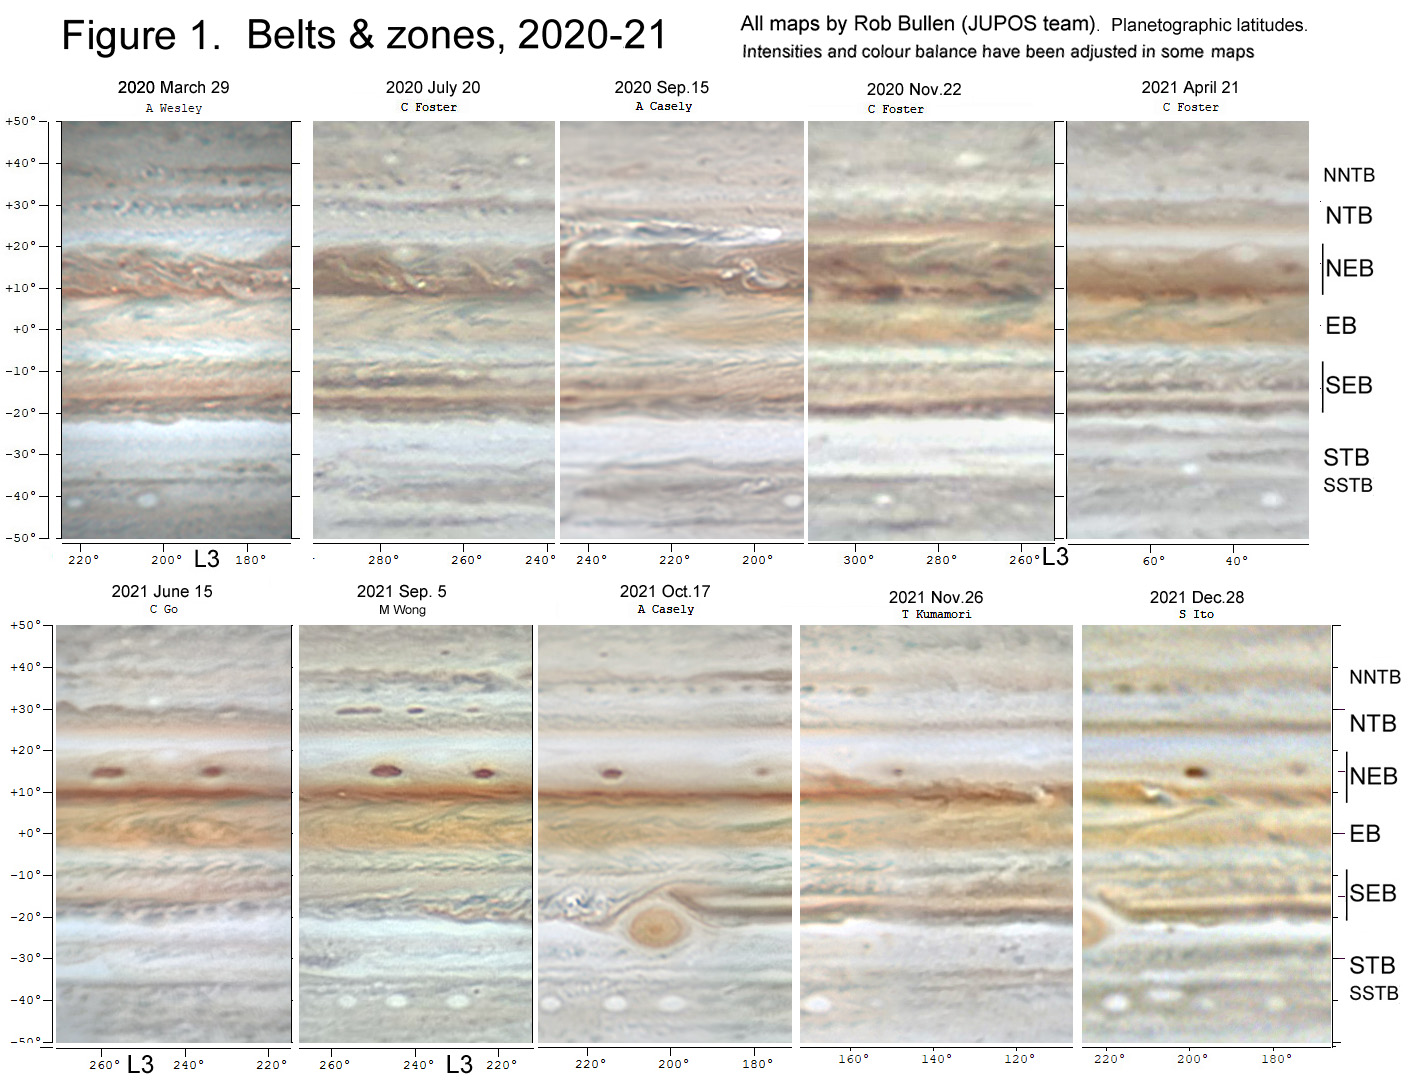
Thirty-nine usable observing sessions were carried out during 2020-2021 from the author’s observatory in Denver, Colorado. Fig. 1 shows the observations versus System I longitude. It also depicts Juno perijoves. During July and September 2020 observations overlap with the longitudes observed by Juno on PJ28 and PJ29. The best adjacent observations in 2021 occurred in October (PJ37). Also, near Juno perijove (PJ36), the System 1 longitude range of 140-180 degrees was observed multiple times. This allows for observing the evolution of features in the Equatorial Zone (EZ).

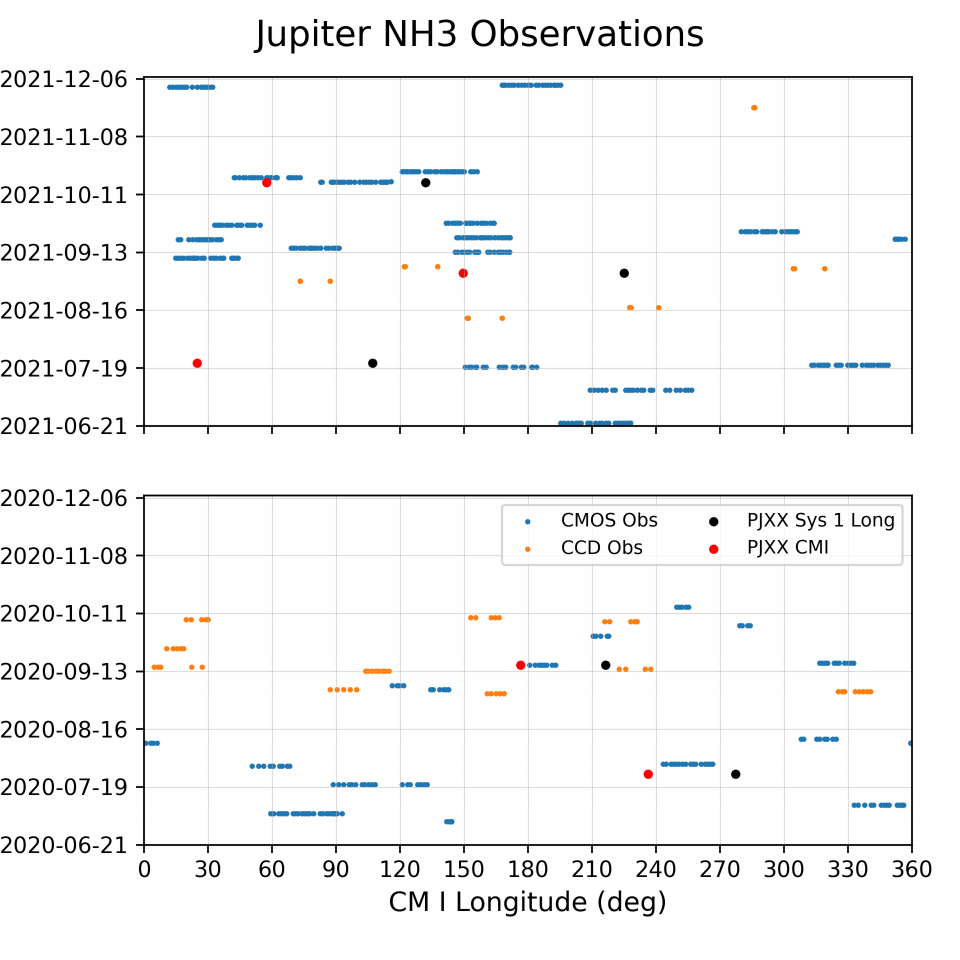
Figure 1: Observing sessions in 2020 (bottom) and 2021 (top). Individual images contributing to ammonia absorption observations are shown (CMOS: blue; CCD: orange). Juno perijove longitudes (Sys. 1) and Earth-facing central meridians (Sys. 1) at perijove are indicated in black and red respectively.

Highlights

Fig. 2 shows the NEB has reduced ammonia absorption, the EZ is enhanced, and the GRS is reduced. Note the correlation and lack of correlation with obvious visible features. There is a reduction correlated with the GRS, but the reduced absorption region from about 15-25N includes both bright and dark features.

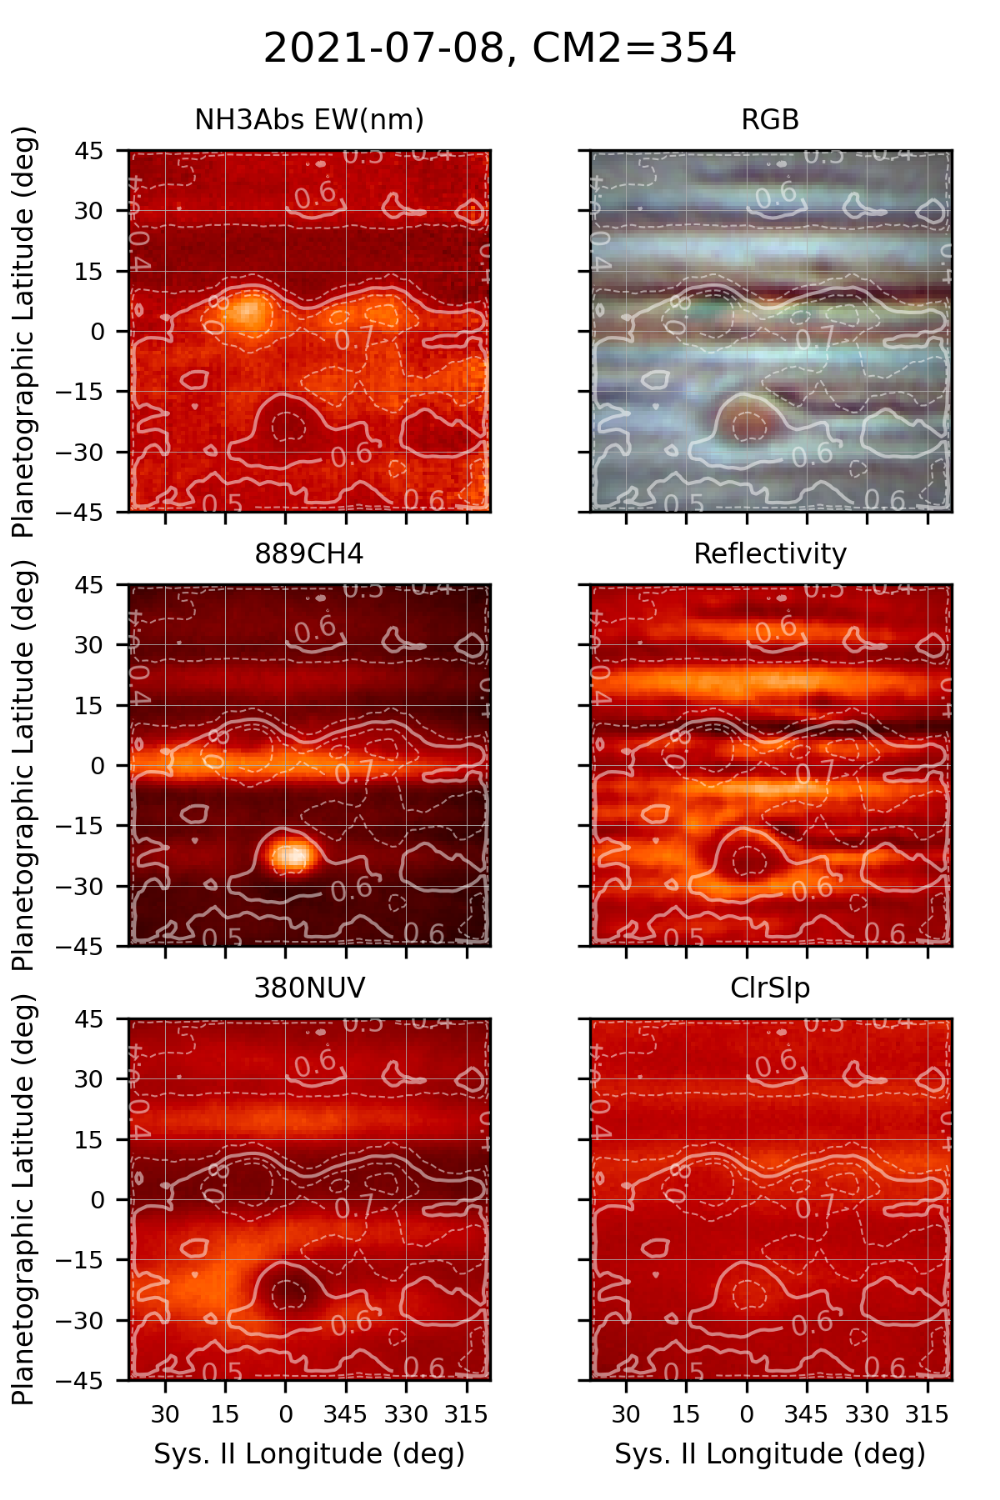
Figure 2: Ammonia absorption and context maps. Brightness scaling is arbitrary and adjusted for visual effect. Contour levels are estimated ammonia absorption equivalent width in nm. “ClrSlp” is relative color slope with redder areas shown as brighter.

Fig. 3 shows the EZ and NEB, including ammonia absorption enhancements near plumes and dark features. Dark features look deep into the atmosphere and the bright plumes represent high clouds.

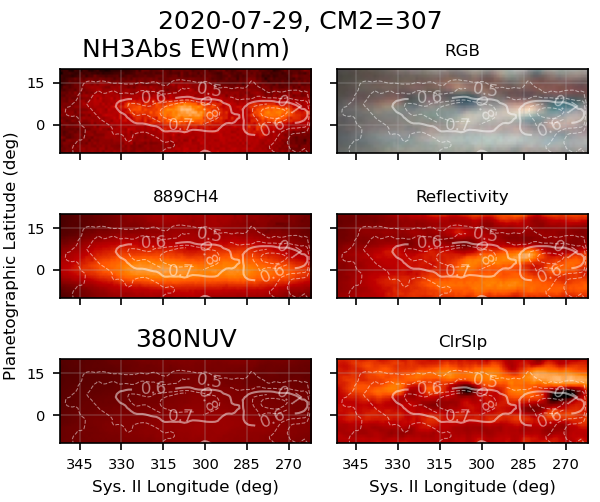
Figure 3: Same as Figure 4 but focused on the northern EZ.

The GRS is shown from July through September 2021 in Fig. 4. Ammonia absorption is reduced over the GRS due to the high-altitude scattering layer there. This reduction has also been noted in spectroscopic observations [7].

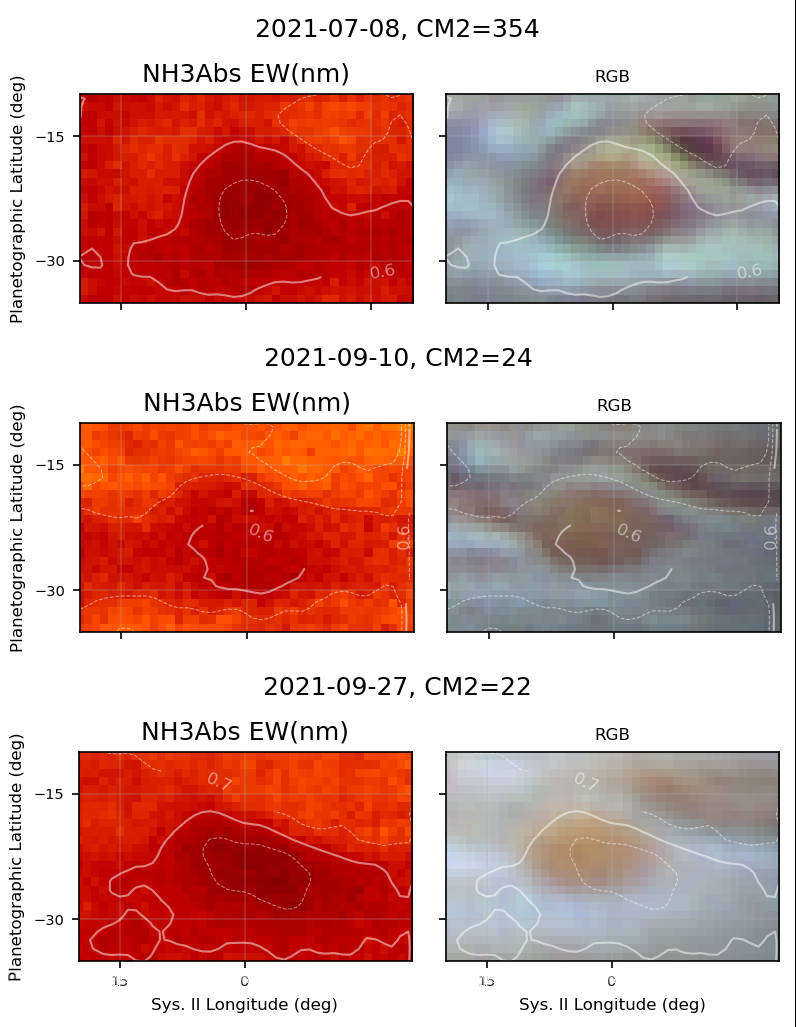
Figure 4: Reduced ammonia absorption over the Great Red Spot at three epochs in 2021.

Retrieval Potential

A scatter plot of 889 nm brightness versus 645 nm NH3 equivalent width (Fig. 5) shows the distributions of different latitude bands. High brightness in the methane band indicates higher cloud tops, which leads to a shorter absorption path. Thus, the GRS (high brightness red ‘tail’ in the 15-30S band) has a high reflecting layer. The ammonia EW is low, consistent with the short absorption path. The NEB (brown) shows uniformly low methane brightness, indicating deeper cloud tops, but also shows low ammonia absorption. This supports an actual depletion in ammonia abundance.

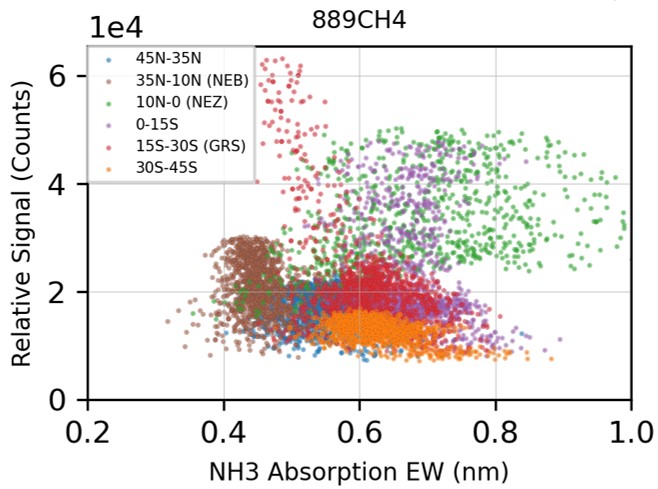
Figure 5: Scatter plot 889 nm methane relative signal versus 645 nm ammonia equivalent width for different meridional bands (2021-07-08, CM2 354 deg).

The scatter plot analysis suggests that a simple Reflecting Layer Model might provide meaningful first-order retrievals of atmospheric properties [9]. The goal during 2022 will be to retrieve reflectivity, cloud top pressure, and ammonia abundance by extending this model. In addition, observations will be shared on amateur collaboration websites.

Summary and Conclusion

This paper highlights two years of continuum-divided ammonia absorption imaging of Jupiter. The method shows detail inaccessible with other imaging techniques. The observations will be tested for utility in a simple atmospheric retrieval model and will be shared during the 2022 apparition.

References

[1] Guillot, T., et al. (2020), Storms and the Depletion of Ammonia in Jupiter: II. Explaining the Juno Observations, Journal of Geophysical Research (Planets), 125, e06404.

[2] Fletcher, L. N., et al. (2020), Jupiter's Equatorial Plumes and Hot Spots: Spectral Mapping from Gemini/TEXES and Juno/MWR, Journal of Geophysical Research (Planets), 125, e06399.

[3] Fletcher, L. N., et al. (2021), Jupiter's Temperate Belt/Zone Contrasts Revealed at Depth by Juno Microwave Observations, Journal of Geophysical Research (Planets), 126, e06858.

[4] Braude, A. S., P. G. J. Irwin, G. S. Orton, and L. N. Fletcher (2020), Colour and tropospheric cloud structure of Jupiter from MUSE/VLT: Retrieving a universal chromophore, Icarus, 338.

[5] Dahl, E. K., N. J. Chanover, G. S. Orton, K. H. Baines, J. A. Sinclair, D. G. Voelz, E. A. Wijerathna, P. D. Strycker, and P. G. J. Irwin (2021), Vertical Structure and Color of Jovian Latitudinal Cloud Bands during the Juno Era, The Planetary Science Journal, 2, 16.

[6] Irwin, P. G. J., N. Bowles, A. S. Braude, R. Garland, S. Calcutt, P. A. Coles, S. N. Yurchenko, and J. Tennyson (2019), Analysis of gaseous ammonia (NH3) absorption in the visible spectrum of Jupiter - Update, Icarus, 321, 572.

[7] Teifel', V. G., V. D. Vdovichenko, P. G. Lysenko, A. M. Karimov, G. A. Kirienko, N. N. Bondarenko, V. A. Filippov, G. A. Kharitonova, and A. P. Khozhenets (2018), Ammonia in Jupiter's Atmosphere: Spatial and Temporal Variations of the NH3 Absorption Bands at 645 and 787 Nm, Solar System Research, 52, 480.

[8] Hill, S. (2021), Experimental Observations of Jupiter in the Optical Ammonia Band at 645 nm, edited, pp. EPSC2021-2260.

[9] Mendikoa, I., S. Pérez-Hoyos, and A. Sánchez-Lavega (2012), Probing clouds in planets with a simple radiative transfer model: the Jupiter case, European Journal of Physics, 33, 1611.

How to cite: M Hill, S. and Rogers, J.: Jupiter Ammonia Absorption Imaging: Highlights 2020-21, Europlanet Science Congress 2022, Granada, Spain, 18–23 Sep 2022, EPSC2022-802, https://doi.org/10.5194/epsc2022-802, 2022.