Analysis of the Lunar South Polar Region for PROSPECT, NASA/CLPS
- 1ESA, ESTEC, Netherlands (sarah.boazman@esa.int)
- 2Research Centre for Astronomy and Earth Sciences, Konkoly Thege Miklos Astronomical Institute, Hungary.
The south polar region is an area of renewed interest of lunar exploration because of the presence of volatiles including water ice at the surface or just beneath the surface (e.g., Deutsch et al., 2020, Hayne et al.,2015, Kring et al., 2020, Lemelin et al., 2021, Lemelin 2020, Li et al., 2018). PROSPECT is an instrument selected for flight on the 10th NASA Commercial Lunar Payload Services (CLPS) mission and aims to sample the lunar surface up to 1 m depth. Samples will be analysed for volatiles, and the gases given off when the samples are heated will be analysed by an onboard laboratory containing two spectrometers. PROSPECT will develop our understanding of the abundance and origin of volatiles in the south polar region and will also perform In-Situ Resource Utilisation experiments, extracting oxygen from lunar minerals (Heather et al., 2022). NASA CLPS-10 will be a static lander, so for PROSPECT to be able to sample the most volatile rich lunar soils, it is essential to select the correct landing site, with conditions most suited to the presence of volatiles while meeting all necessary engineering constraints.
Methods and Datasets:
We have used a combination of datasets with GIS remote sensing methods to investigate the south polar region (75°-90° S), including Lunar Reconnaissance Orbiter (LRO) images; NAC (Narrow Angle Camera) and WAC (Wide angle camera) (Robinson et al., 2010). We have analysed the elevation of the region using the LOLA 30 m/pixel dataset. Slope maps were created and classified into less than 10° and less than 5° to analyse the areas that are the most accessible. The surface temperatures of the region have also been analysed using both seasonal data from Diviner and data from the Oxford Thermal Model (King et al., 2020, Kereszturi et al., 2022). M3 ice exposures of the region have been identified and compared with surface temperatures and the slopes within the region (Li et al., 2018). The Mazarico et al., 2011 illumination model was also used alongside a toolkit from iSPACE (Luxembourg) to investigate the Earth visibility, horizon, and surface illumination (ispace (ispace-inc.com). Additionally hazards to landing such as craters and boulders have been identified within the region.
Results:
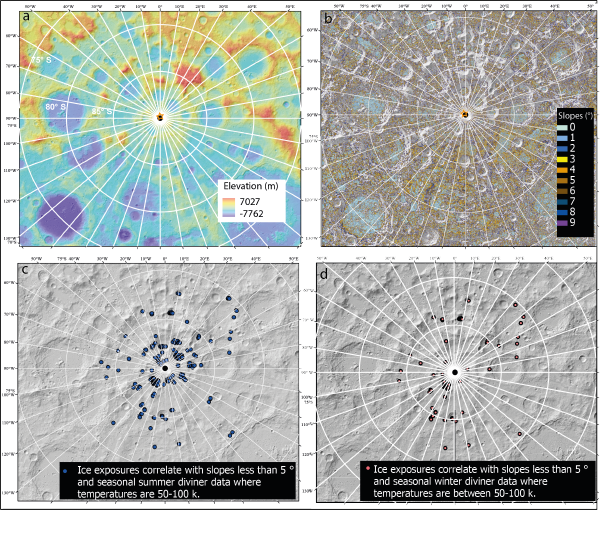
The south polar region shows large variations in elevation and slopes present due to the highly cratered surface and additionally the topography shows elevated areas and large ridges. However, there are large areas that have slopes less than 10°, which would be suitable for landing a mission that carries PROSPECT or for a future EVA (Figure1).
Temperature analysis from seasonal Diviner data shows that there are areas within the region that reach temperatures less than 100 K during the summer and winter and would allow for water ice to be stable if present. There are large areas that have temperatures less than 100 K that also have slopes less than 10° and therefore would be potentially a safe area to land and sample. The M3 ice exposures support the seasonal Diviner temperature data findings and there are areas where the slopes are less than 5° that correlate with the surface temperatures less than 100 K and with ice exposures shown by M3. (Figures 1c and d).
Future work:
This initial investigation into volatiles within the south polar region has highlighted some areas where there is evidence to suggest water ice may be present in areas where there are slopes less than 10°. These areas will be further investigated to study their accessibility, illumination conditions and Earth visibility. Additionally, other datasets such as KAGUYA will be used to understand the mineralogy of these regions of interest. These regions of interest will be analysed further by mapping potential hazards such as craters, boulders, and rock falls to assess the accessibility of these areas, for PROSPECT and for future missions.
Acknowledgement: This work was supported by the H82 POLICETECH project.
References:
Deutsch, A., et al., (2020) Icarus, 336.
Hayne, P., et al., (2015) Icarus, 255, 58-69
Heather, D.J. et al., (2022) EPSC, This meeting
Kring, D., et al., (2020) LPSC, 51st
Kereszturi, A., et al., (2022) EPSC, This meeting
Lemelin, M., et al., (2021) Planetary Science Journal, 2(3).
Lemelin, M., et al., (2020) LPSC 51st
Li, S., et al., (2018) Earth, atmospheric and planetary sciences, 115(36)
Mazarico,E., et al., (2011) Icarus,1066-1081,211(2)
Robinson, M., et al., (2010) Space Science Reviews, 81-124,150(1-4)

Figure 1: a) Elevation map using the LOLA (30m/pixel) dataset overlaid on a hillshade derived from the LOLA dataset. B) slope map derived from the LOLA (30m/pixel) showing areas where slopes are less than 10°. C) Data points show the locations of where M3 ice exposures (Li et al., 208) can be found which correlate with areas where slopes are less than 5° and where the seasonal diviner summer data shows average temperatures of 50-100 k. d) Data points show the locations of where M3 ice exposures (Li et al., 208) can be found which correlate with areas where slopes are less than 5° and where the seasonal diviner winter data shows average temperatures of 50-100 k.
How to cite: Boazman, S., Kereszturi, A., Heather, D., Sefton-Nash, E., Orgel, C., Tomka, R., Houdou, B., and Lefort, X.: Analysis of the Lunar South Polar Region for PROSPECT, NASA/CLPS, Europlanet Science Congress 2022, Granada, Spain, 18–23 Sep 2022, EPSC2022-530, https://doi.org/10.5194/epsc2022-530, 2022.

