TP3
Session assets
Orals: Wed, 21 Sep, 12:00–18:30 | Room Manuel de Falla
Introduction: Floor-Fractured Craters (FFCs) are unique lunar landforms that have witnessed and recorded tectonic and volcanic activity in the form of distinct structural features [1]. FFCs are common around the edges of mare basins, and their ages span the lunar history [2,3]. They offer insights into the region’s magmatic, thermal and morphological evolution and are candidates for further investigation to comprehend the Moon’s crustal evolution. Therefore, the detailed analysis of FFCs would give new insights into a better understanding of the volcanic activity on the Moon. In connection with this, we selected a Posidonius crater on the nearside of the Moon to perform detailed geological and geophysical analysis to understand the volcanic history.
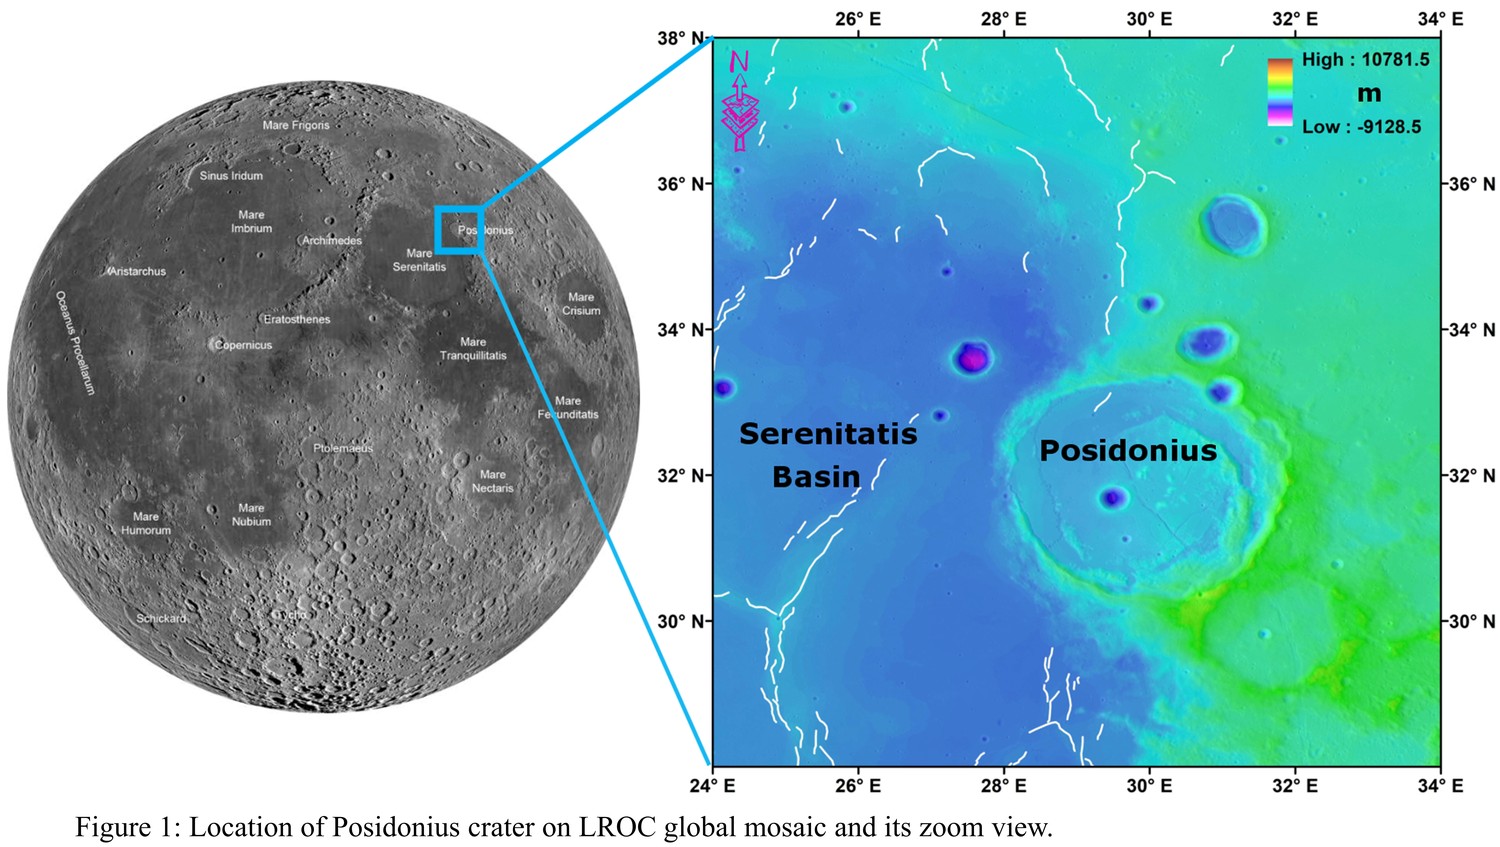
The Posidonius crater is ~95 km in diameter and is categorised as a Class-III Floor-Fractured crater located on the northeastern rim of the Serenitatis basin [4], with a center latitude and longitude of 31.88°N and 29.99°E as shown in Figure 1. The wide annular depression called moat is noted on the western side of the crater nearest to the exterior Mare Serenitatis plain. The mare infill is divided into two basaltic units by ~180 km long, curvy lava channel known as Rimae Posidonius. The existence of large and small-scale graben and sinuous rille and basaltic infill indicate that tectonic, as well as volcanic processes, deformed the Posidonius crater.
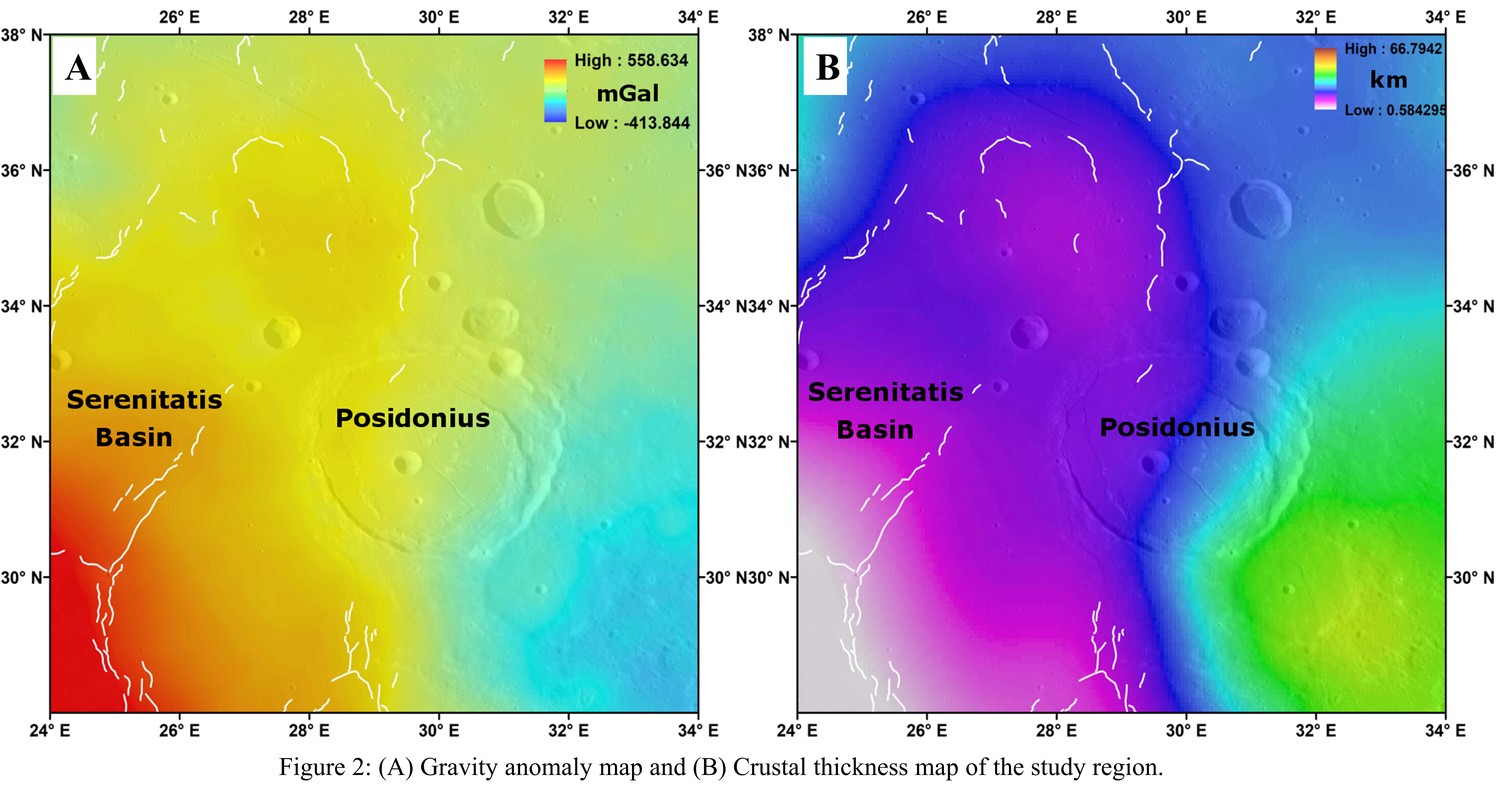
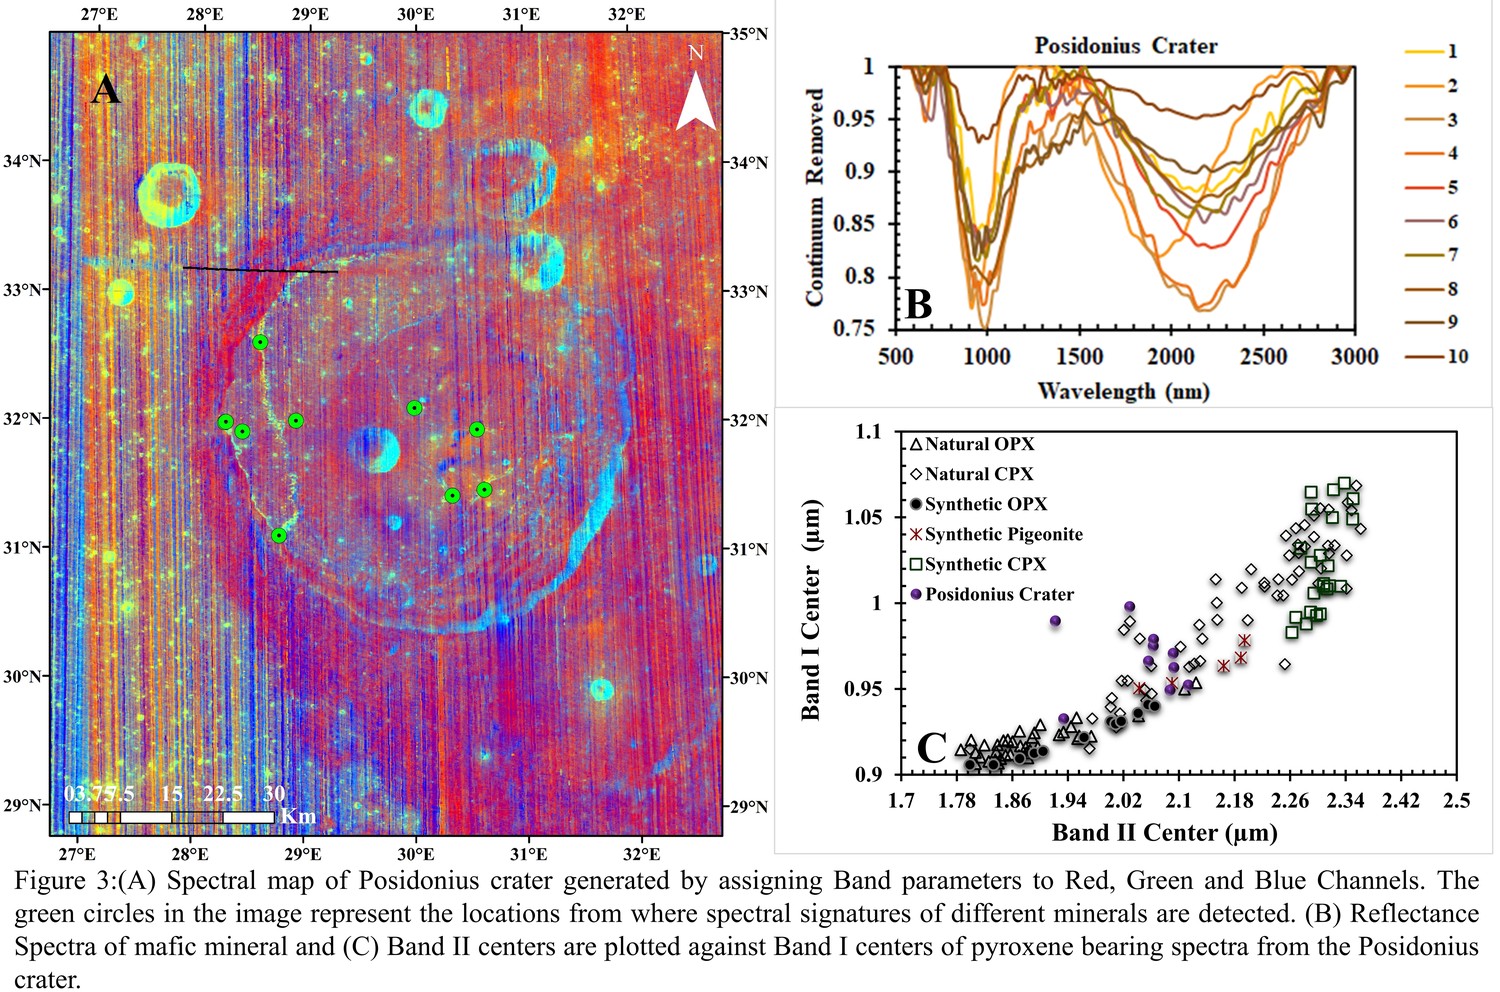
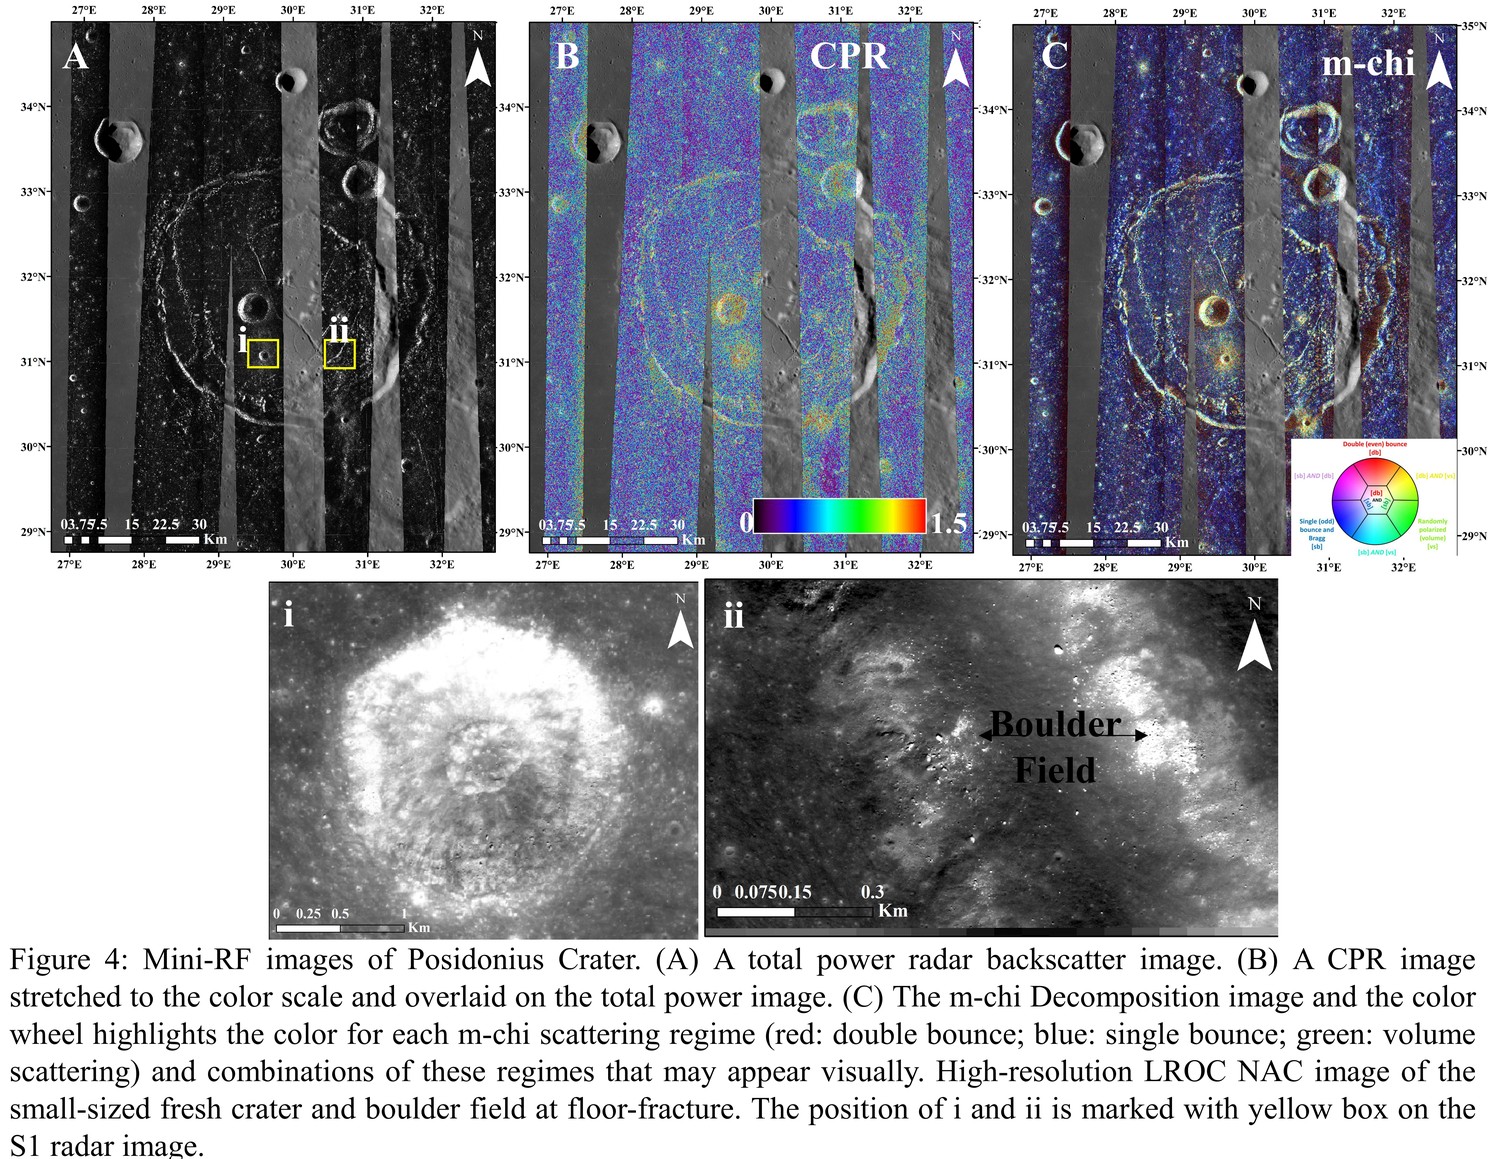
Data and Methodology: The gravity data from Gravity Recovery and Interior Laboratory (GRAIL) of degree and order 660 was used to map the gravity anomalies. The global lunar crustal thickness model-1 was used to see the crustal thickness variations. The composition of the crater and eastern part of Mare Serenitatis was derived using Moon Mineralogy Mapper (M3) onboard the Chandrayaan-1 mission [5]. Band parameters were calculated for mapping first-order mineralogical variation [6]. LRO (Lunar Reconnaissance Orbiter) Mini-RF S-band data was processed to derive CPR and daughter products [7] for the physical characterisation of the study region [8]. LRO NAC (Narrow-Angle Camera) of spatial resolution ~0.5-2 meters/pixel [9] was used to identify and map the structural features.
Results and Discussion:
The gravity anomalies ranged from -413 to 558 mGal (Figure 2A), with high values observed at the outer rim of the Serenitatis basin and low values found at the east, south-east of the Posidonius crater. These anomalies show the decreasing trend towards the northern part of Posidonius crater, indicating that the possible source of volcanic history is the Serenitatis basin. The crustal thickness (Figure 2B) shows low at Serenitatis and Posidonius crater, which suggests the volcanic source is shallow level. Minerals were identified using VNIR spectral characteristics. The crater exhibits exposures of mafic minerals detected from Rimae Posidonius, Floor-Fractures, central peak ring, and mare unit (Figure 3A). Pyroxene spectral shows absorption near 1000 nm and 2000 nm due to Fe2+ and Ca2+ contribution [10]. M3 data suggests that the mare unit is dominated by the subcalcic ferroaugite to Ferroaugite rich rocks such as basalt (Figure 3B and 3C). Spectra of bedrock exposures from rimae and ridge show the presence of magnesium-pigeonite, which suggests the rapid cooling of magma at high temperature. Hence, the enigmatic rimae Posidonius represent the shallow lava flow resulting from a turbulent flow of low-viscosity, high-temperature, rapid cooling lava that erodes the pre-existing mare deposits in Posidonius crater.
Mini-RF Circular Ratio Polarisation (CPR) and m-chi decomposition map of crater display the radar-bright characteristics of tectonic features and small-sized fresh craters. The Posidonius crater exhibits low-CPR values suggesting the maturity scale of the crater. Still, the central peak ring, rimae Posidonius, floor fracture, and small-sized fresh crater show high CPR values due to boulder fields in the vicinity. High-CPR value region represents the mixed scattering of double bounce and volumetric scattering (yellowish hue) as they expose fresh and/or dihedral geometrical surface concentrated at the base or in the vicinity of peak ring, linear/sinuous features, and secondary craters (Figure 4).
Conclusions:
The geological (M3, Mini-RF, and NAC analysis) and geophysical (gravity, crustal thickness) observations in this area revealed extensive eruptions during formation and after formation. It is also observed that the lithospheric loading of the Serenitatis basin influences the origin and modifications of this crater. The detailed analysis and mapping of this region are under process.
Acknowledgements
SP and MRELM acknowledge support for this work through an internal grant (8474000336-KU-SPSC). AVSK is thankful to the director, CSIR-NGRI, Hyderabad, for all the support.
References:
[1] Chauhan, M. et al. (2021) Lunar and Planetary Science Conference (LPSC) 2548, 1843.
[2] Jozwiak, L. M. et al. (2012) JGR:Planets 117(E11).
[3] Jozwiak, L. M. et al. (2015) Icarus 248, 424-227.
[4] Salem, I. B. et al. (2022) Remote Sensing 14(4), 814.
[5] Pieters, C. M. et al. (2009) Current Science, 500-505.
[6] Purohit, A. N. et al. (2021) Journal of Earth System Science 130(1), 1-23.
[7] Raney, R. K. et al. (2012) JGR: Planets 117(E00H21), 1-8.
[8] Patel, S. M. and Solanki, P. M. (2018) Proceedings ACRS, TS70.
[9] Robinson, M. S. et al. (2010) Space Science reviews 150, 81-124.
[10] Klima, R. L. et al. (2011) Meteorite and Planetary Science 46, 379-395.
How to cite: Patel, S., Satyakumar, A. V., and El-maarry, M. R.: Extensive volcanic activity within the Posidonius crater, nearside of the Moon, Europlanet Science Congress 2022, Granada, Spain, 18–23 Sep 2022, EPSC2022-97, https://doi.org/10.5194/epsc2022-97, 2022.
Introduction: The Aristarchus Plateau is a unique region on the Moon, hosting its highest concentration of rilles including the widest and deepest rille [1], its most extensive dark mantle deposits [2], as well as rare exposures of both, very olivine-rich and very silicate-rich materials [3–6]. As such, the plateau has been considered as one of the most promising exploration sites apart from the lunar poles for decades [7–10]. To facilitate future in-situ operations and devise traverse plans on the plateau, we are mapping a 285 km2 area centered at 50.53°E 24.51°N, which includes crater Herodotus G, ~27 km northwest of the rim of crater Herodotus (Fig. 1, black outline). For context, and as there exists no dedicated, peer-reviewed map of the Aristarchus Plateau, we are producing a regional map (~103 km2) centered at 50.75°E 26.11°N, encompassing the entire plateau and the Montes Agricola. Here we present a progress report on this regional map (Fig. 1).
Data: A 7 m/pixel mosaic of SELENE (“Kaguya”) Terrain Camera (TC) morning images, i.e., with homogeneous illumination from the east [11] serves as our map base. We also utilize several other datasets (for explanation of abbreviations see references): LOLA-Kaguya (merged topography and derivatives [12]); LROC-WAC (high and low incidence [13]), Clementine (NIR and UV-VIS mosaics [14]); Diviner (rock abundance, CF position, and temperature [15]); Arecibo-Green Bank radar (S-band circular polarization, [16]). Pre-Kaguya/LRO maps including the Aristarchus plateau are also consulted for reference and regional context [17–19].
For our local mapping (Fig. 1, black rectangle), we will also consult three LROC-NAC mosaics (two opposing high incidence and one low incidence [13]) as well as NAC-derived stereo topography [20,21].
Methodology: Regional mapping is carried out at a scale of 1:80,000. Initial identification and digitization of linework and units is conducted on our basemap (Kaguya TC) in conjunction with merged LOLA-Kaguya data (topography, hillshade, and slopemap). Further unit characterization and delimitation is based on all datasets listed in the Data section.
Our regional mapping approach is similar to the composite map by [18]. However, we will map mineralogic units that lack corresponding morphologic or albedo signatures (e.g., olivine-rich areas on the southeastern rim of Aristarchus [3,4] or silicic areas in several specific locations [5,6]) as overlay textures instead of assigning separate units. For our local map we plan a mapping scale of 1:15,000 using LROC-NAC mosaics at different incidence angles as basemaps.
Initial results: We identified 45 potential volcanic collapse structures (irregular pits; IRPs; Fig. 1, red units) ranging in areal extent from ~0.3 km2 to ~110 km2 with a mean at ~7 km2. Most of these structures have not been reported in previous investigations and all but six IRPs are located on the Aristarchus plateau. IRPs were defined as depressions fulfilling at least three of the following criteria: 1) Irregular shape; 2) Anomalous depth-diameter-ratio; 3) Not surrounded by spectral signatures consistent with impact ejecta; 4) Connected to or closely associated with a rille or with a partially breached rim.
In our map, the term “rille” is defined as linear depression indicating a formation by volcanic drainage, i.e., it has to fulfill two of the following criteria: 1) Sinuous trace; 2) Following the topographic gradient; 3) Connected to or closely associated with an IRP. We mapped a total of 100 rilles with total, maximum, and minimum lengths of 1724 km, 110 km, and 0.5 km, respectively. Additionally, we identified 78 highly degraded rilles and segments, for a total rille length of ~2033 km. This includes at least 37 rilles and rille segments that have not been identified in previous investigations [1,18]. We also detected two ~3.7 km long and up to ~24 m high, sinuous ridge segments approaching Rima Krieger. Two more ~2.5 km and ~5 km long sinuous ridges are located north of the Montes Agricola. If these represent inverted rilles, they would triple the number of such features identified on the Moon [1].
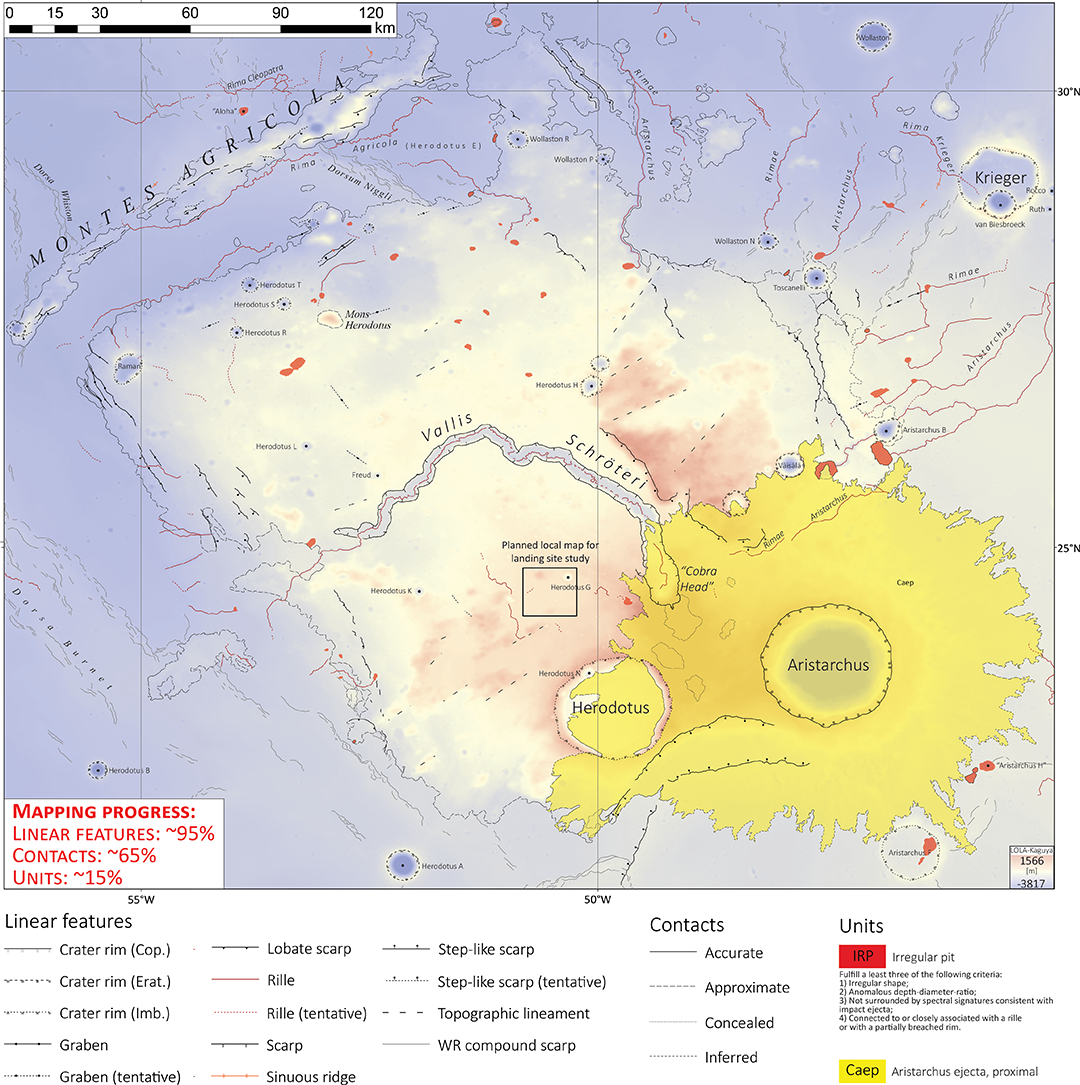
Figure 1: Current state of our regional geomorphologic map of the Aristarchus Plateau (mapping scale 1:80,000); background is the merged LOLA-Kaguya Lunar Digital Elevation Model (LDEM). While preliminary linework is complete, mapping of units has just commenced. The black rectangle south of the image center outlines the area of our local mapping (scale 1:15,000) for potential landing site assessment.
References: [1] D.M. Hurwitz et al., PSS 79–80 (2013) 1–38. [2] L.R. Gaddis et al., Icarus 161 (2003) 262–280. [3] S. Le Mouélic et al., GRL 26 (1999) 1195–1198. [4] J.A. Arnold et al., JGR-P 121 (2016) 1342–1361. [5] P.G. Lucey et al., JGR 91 (1986) 344–354. [6] J.F. Mustard et al., JGR 116 (2011) E00G12. [7] R. O’Connell, A. Cook, NASA Authorization for Fiscal Year 1970, 1969. [8] C.R. Coombs et al., in: Sp. 98, Reston, VA, 1998, pp. 608–615. [9] E. Jawin et al. (2021) Bull. Am. Astron. Soc., 53, . [10] T.D. Glotch et al., Planet. Sci. J. 2 (2021) 136. [11] J. Haruyama et al., Earth, Planets Sp. 60 (2008) 243–255. [12] M.K. Barker et al., Icarus 273 (2016) 346–355. [13] M.S. Robinson et al., SSR 150 (2010) 81–124. [14] A.S. McEwen, M.S. Robinson, Adv. Sp. Res. 19 (1997) 1523–1533. [15] J.L. Bandfield et al., JGR 116 (2011) E00H02. [16] B.A. Campbell et al., Icarus 208 (2010) 565–573. [17] H.J. Moore, USGS I-Map 465, 1965. [18] T.A. Lough et al. (2011) LPS XLII, abstract #2013. [19] H.J. Moore, USGS I-Map 527, 1967. [20] Z.M. Moratto et al. (2014) LPS XLV, abstract #2892. [21] M.R. Henriksen et al. (2015) Second Planet. Data Work., pp. 2–3.
How to cite: Bernhardt, H., Clark, J. D., and Robinson, M. S.: Regional and Local Geomorphologic Mapping of the Aristarchus Plateau, Europlanet Science Congress 2022, Granada, Spain, 18–23 Sep 2022, EPSC2022-280, https://doi.org/10.5194/epsc2022-280, 2022.
Within the next decade, humans are slated to return to the Moon via NASA’s Artemis Program. A driving goal of this program is to establish a sustained presence at one or more sites near the lunar south pole. Artemis astronauts are expected to participate in a diverse suite of scientific investigations, many of which leverage the extreme illumination and thermal environment at the lunar poles [1].
The lunar south pole is also relevant to geological investigations providing new insight into fundamental planetary processes. Specifically, Goal 1b of the Artemis III Science Definition Team Report [1] is to probe planetary differentiation and evolution processes including formation of a magma ocean, crust, mantle, and core.
The Artemis program will address this goal in several ways. The lunar south pole is set within highlands crustal terrane far-removed from previous lunar sample return missions (e.g., the Apollo and Luna programs). Sampling local crustal material will provide important insight into ancient crust-building processes (i.e., differentiation of the lunar magma ocean).
Ejecta from nearby impact basins will provide further insight into a wider range of planetary processes. Specifically, the lunar south pole is in the vicinity of the ~2000 km South Pole – Aitken Basin (SPA), the oldest and largest impact structure preserved on the Moon. Due to its size, age, and unique geophysical properties, SPA impact melt and ejecta samples are critical to unraveling lunar differentiation, the interior structure of the lower crust and upper mantle, and lunar chronology. Unusual volcanic resurfacing across SPA reveal complexities in the Moon’s thermal evolution [2]–[4]
SPA ejecta is associated with pronounced geochemical and mineralogical signatures, including Th, Fe, Ti, KREEP, and high-Ca pyroxene elevated relative to the surrounding highlands [5]. These compositional properties are consistent with exposure of late-stage lunar magma ocean cumulates[6].
These ancient mantle materials excavated by SPA are concentrated in the NW quadrant of the basin, presumably downrange from the impact[5], [7]. However, the relevant compositional signatures are also observed across the southern region of the basin, encompassing the lunar south pole (Figures 1+2). Using these compositional properties as a guide, Artemis astronauts will be able to identify and return candidate lunar mantle materials for detailed analyses in terrestrial laboratories.
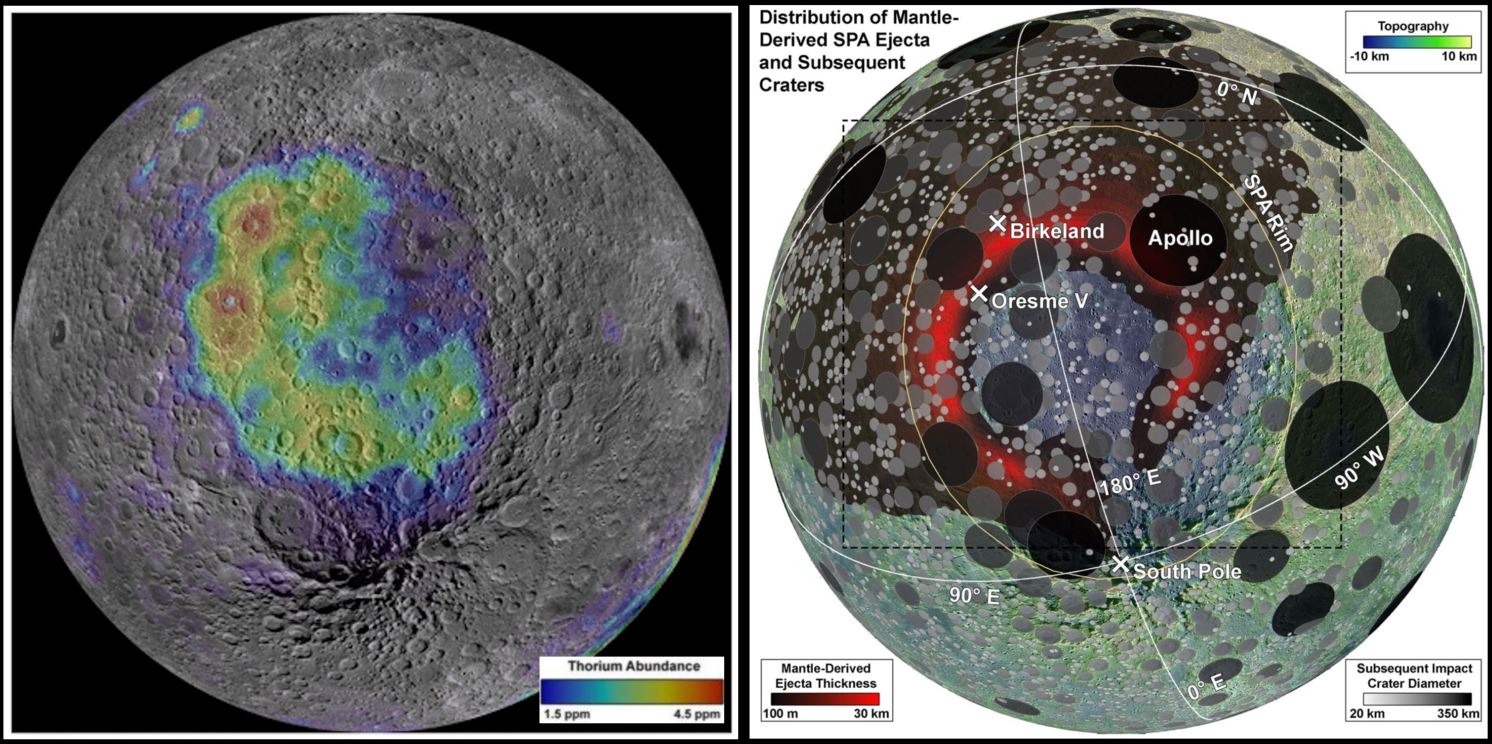
Figure 1: The expected distribution of mantle materials ejected by SPA and modified by subsequent impact events (right) closely matches the distribution of thorium, a possible marker of late-stage lunar magma ocean cumulates (left) [5]. Small elevations in thorium persist across the south polar region.
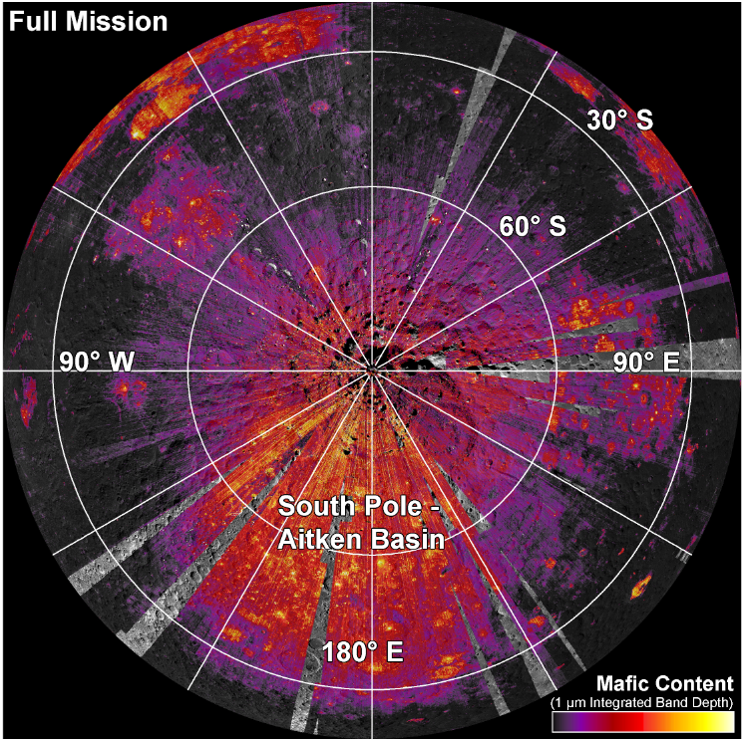
Figure 2: 1 micron Integrated Band Depth maps constructed from Moon Mineralogy Mapper data reveal an elevated pyroxene abundance across the south polar region associated with SPA [8].
While fragments of SPA material are likely to be sampled at the Artemis site(s), the most recent planetary science decadal survey [9] strongly recommends a more direct approach to maximize the sample return of the Artemis program. Endurance-A [10], a mission concept study performed at the Jet Propulsion Laboratory and released with the Decadal survey, is a long-range robotic rover that would collect samples from multiple points of interest along a traverse beginning in central SPA and ending at a rendezvous with Artemis astronauts (Figure 3). As currently planned, the rover would collect and deliver up to ~100 kg of samples from ~12 sites, providing a diverse overview of the basin addressing numerous high-priority lunar science questions relevant to solar system chronology and lunar evolution. The rover is outfitted with a suite of instruments providing sampling context and in situ science measurements.
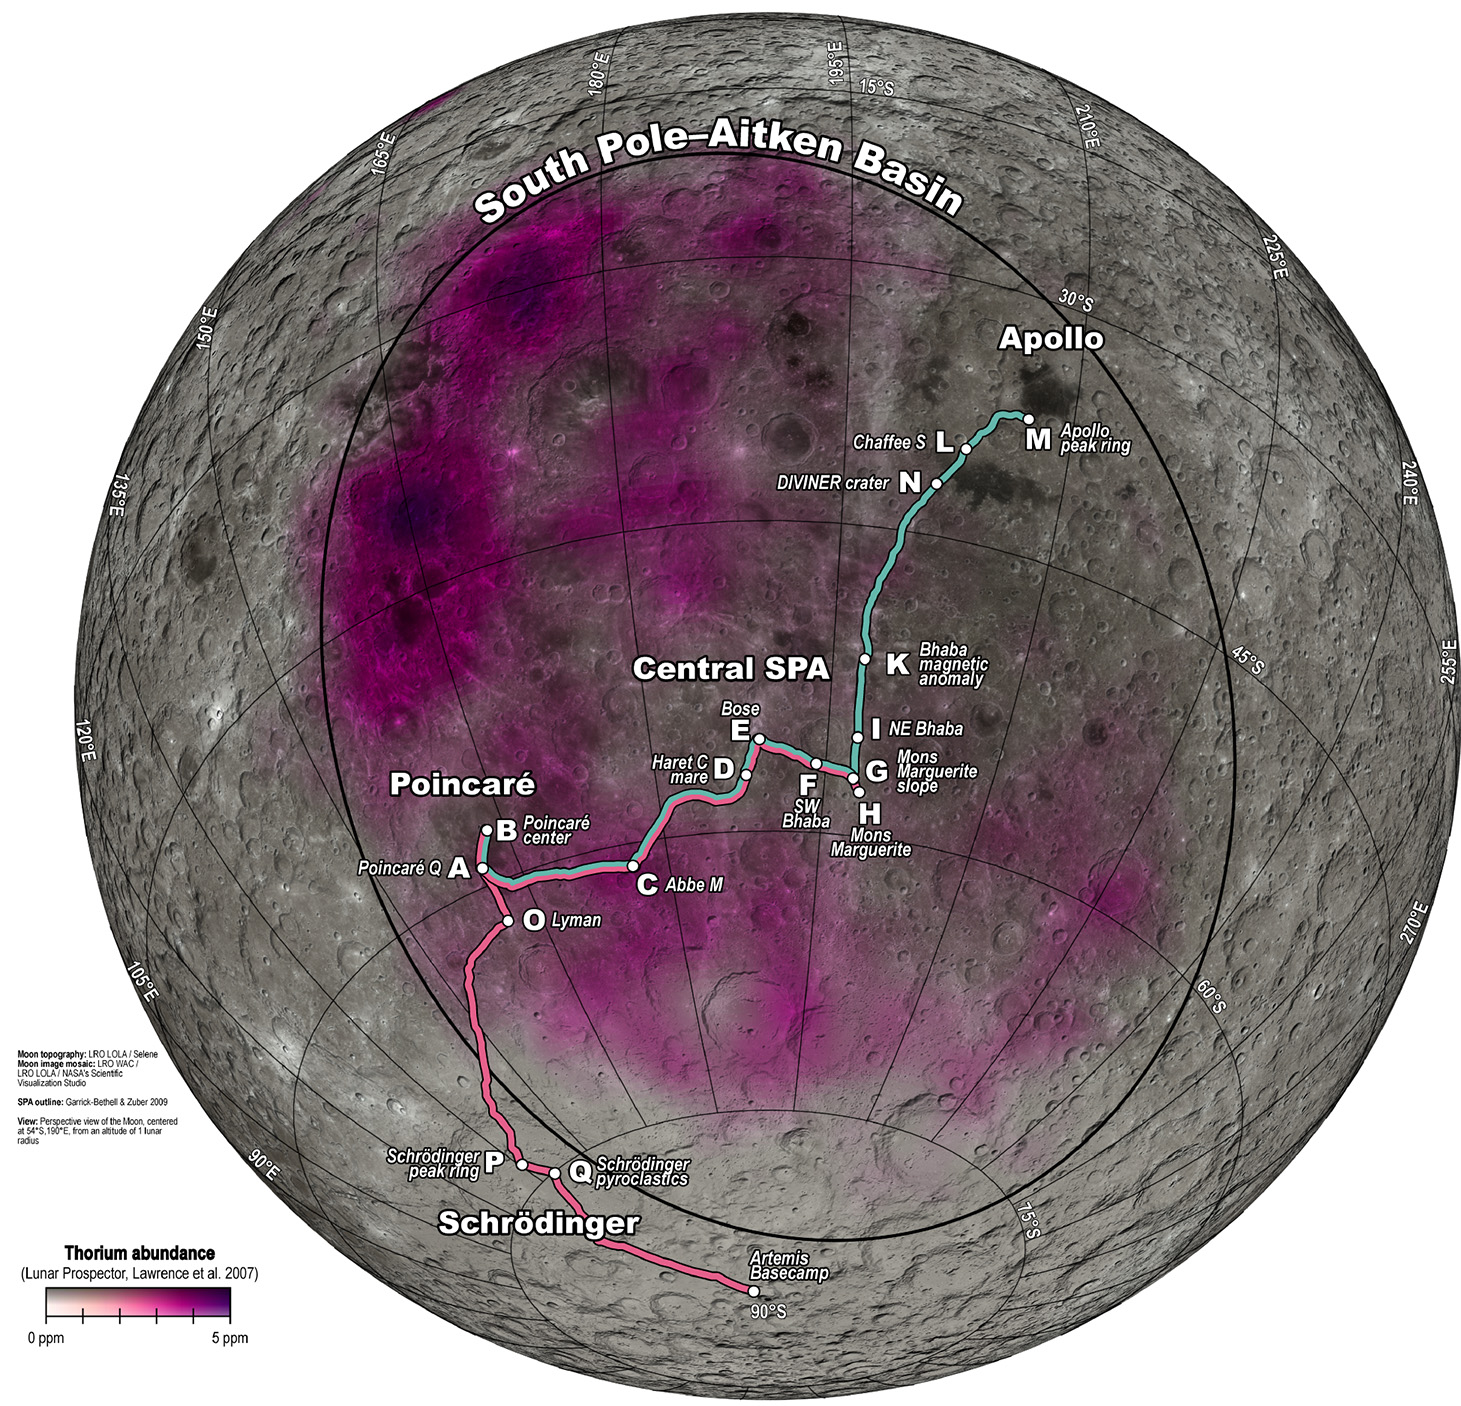
Figure 3: An example traverse for Endurance-A (purple) beginning in at Mons Marguerite (an unusual volcanic construct) and sampling SPA impact melt (SW Bhabha, Bose), mare basalts (Haret C mare), high-Th mantle ejecta (Abbe M), subsequent impact melt (Poincare, Schrodinger peak ring, Lyman), and pyroclastic materials (Schrodinger pyroclastics) en route to the Artemis base camp [10].
[1] Weber et al., in Lunar and Planetary Science Conference, 2021, no. 2548.
[2] James and Kiefer, in AGU Fall Meeting Abstracts, 2017, vol. 2017.
[3] Moriarty and Pieters, (2015), Geophys. Res. Lett., vol. 42, no. 19,
[4] Moriarty and Pieters, (2018), J. Geophys. Res. Planets, vol. 123, no. 3,
[5] Moriarty et al., (2021), J. Geophys. Res. Planets, vol. 126, no. 1,
[6] Moriarty et al., (2021), Nat. Commun., vol. 12, no. 1,
[7] Melosh et al., (2017), Geology, vol. 45, no. 12,
[8] Moriarty and Petro, in Lunar and Planetary Science Conference, Mar. 2020.
[9] National Academies of Sciences et al., (2022).
[10] Keane et al., (2022).
How to cite: Moriarty, D. and Petro, N.: Insights into Lunar Differentiation, Evolution, and Chronology from the Artemis Program, Europlanet Science Congress 2022, Granada, Spain, 18–23 Sep 2022, EPSC2022-295, https://doi.org/10.5194/epsc2022-295, 2022.
Introduction
The early Moon was covered by a global lunar magma ocean (LMO) whose solidification set the initial stage for the subsequent thermochemical evolution. Equilibrium solidification leads to a homogeneous initial mantle composition, while fractional solidification leads to a layered heterogeneous mantle composition. This difference is crucial for the subsequent thermochemical evolution of the lunar mantle and the amount of secondary crust produced. Estimates of the thickness of the secondary crust, which consists of Mg-suite rocks and basaltic lava flows, and the composition of these rocks from surface measurements and Apollo samples can be combined with models of the interior dynamics to gain insight into the evolution of the lunar mantle.
In our study we model the solid state convection in the lunar mantle and focus on the mixing and partial melt production during convection. We consider both a homogeneous initial mantle composition, as it was used in previous studies (e.g., Ziethe et al., 2009), and a heterogeneous mantle composition that formed by fractional crystallization of the LMO.
We compute the amount of partial melt and compare our results to estimates of the Moon’s secondary crust. This allows us to constrain parameters such as the initial temperature for the homogeneous case and the temperature dependence of the viscosity for the heterogeneous case. Our models can provide critical information about the location and timing of partial melt, and for the more realistic heterogeneous case, also about the components that undergo melting.
Petrological modeling
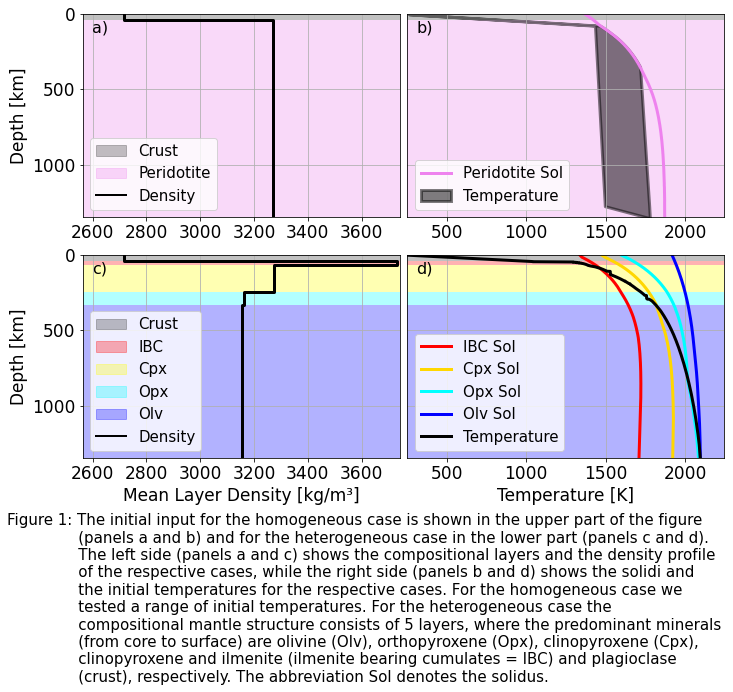
For the initial mantle composition in the homogeneous lunar mantle case we chose KLB-1 peridotite (Zhang and Herzberg, 1994). The solidus, liquidus and density change due to mantle depletion were calculated with alphaMELTS. The initial temperature profiles vary from a cold to an intermediate temperature following Laneuville et al. (2013) (Figure 1b).
For the heterogeneous lunar mantle case we follow the approach described by Schwinger and Breuer (2021) to compute the fractional solidification of the LMO using the bulk lunar mantle composition of O‘Neil (1991). The resulting compositional structure of the mantle consists of 5 layers, for which the predominant minerals are shown in Figure 1c. For each of these layers we calculate an average density, solidus and liquidus profiles, and their changes due to mantle depletion. The initial temperature profile follows the crystallization temperatures of the cumulates (Figure 1d).
Geodynamical modeling
We use the mantle convection code GAIA (Hüttig et al., 2013) to model the thermochemical evolution of the lunar mantle for both the homogeneous and heterogeneous case. We solve the conservation equations of mass, linear momentum, thermal energy, and composition using the extended Boussinesq Approximation in a 2D quarter cylinder geometry. The temperature- and depth-dependent viscosity follows an Arrhenius law, and we track material properties (e.g., melting temperature, density, degree of depletion, amount of heat producing elements) employing a particle-in-cell method (Plesa et al., 2013).
All simulations consider core cooling and radioactive decay. Additionally, we account for latent heat consumption during mantle melting and the increase of solidus and density changes due to mantle depletion (Breuer et al., 2018). Our models track the timing and depth of the melting events and the components that melt.
Produced melt forms the secondary crust and successful models must fit the secondary crust thickness with values between 2 to 10 km. This range accounts for basaltic lava flows that comprise less than 1% of today's crust (Head, 1976) and the Mg-suite rocks that may comprise 6% to 30% (Tompkins and Pieters, 1998, Wieczorek and Zuber, 2001). Though, recent findings show that at least some rocks of the Mg-suite are impact melts (White et al., 2020).
Results
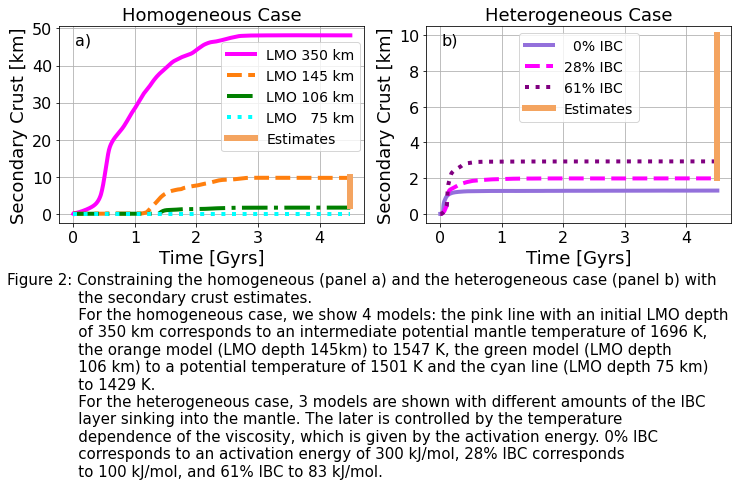
For the homogeneous case, our models show that a relatively cold initial potential mantle temperature of 1501 - 1547 K is required to match the secondary crust estimates of 2 to 10 km. The cold temperatures correspond to abnormally small initial magma ocean depths of only 106 - 145 km and are not able to produce early mantle melting as required to explain the oldest ages of basalts (Figure 2a).
For the heterogeneous case the initial temperature profile is determined by the crystallization temperatures and is thus a fixed parameter. In this case, the IBC cumulates with their high density and low solidus temperature can significantly affect convection and subsequent partial melting. We consider a reference viscosity of 1e21 Pa s. For models with a strong temperature-dependence of the viscosity (i.e., activation energy of 300 kJ/mol) the IBC remains trapped beneath the crust, and only 1.3 km of secondary crust are produced. In contrast, if we consider a lower temperature-dependence of the viscosity (i.e., activation energy of 83 kJ/mol), then up to 61% of IBC sinks into the mantle, producing an average secondary crust thickness of up to 2.9 km (Figure 2b).
Conclusion and Outlook
Our coupled petrological-geodynamical models indicate that a heterogeneous mantle composition yields more comparable results to estimates of the secondary crustal thickness than a homogeneous mantle. In the heterogeneous case, at least part of the IBC layer needs to be recycled into the mantle to match the estimates, indicating a low activation energy e of the viscosity, a low reference viscosity or additional mechanisms to destabilize the IBC layer. In the homogeneous case, our models show that only cold initial temperatures can produce a secondary crust thickness comparable to the estimates - but these are not consistent with the timing of secondary crust formation.
In future work, we will investigate the composition of the partial melt over time using the thermodynamic software Perple_X and compare our results to the composition of mare basalts. In addition, we plan to test the consequences of a heterogeneous shallow magma ocean on the thermochemical evolution and mantle melt production.
Future missions that could return additional information about the thickness and composition of the secondary crust would greatly help to improve our numerical models and constrain the thermochemical history of the Moon.
Acknowledgements
I.B. and S.S. were supported by DFG SFB-TRR170, (subprojects C4 and A5).
How to cite: Bernt, I., Plesa, A.-C., Schwinger, S., Collinet, M., and Breuer, D.: Homogeneous versus heterogeneous lunar mantle: Constraints from secondary crust production, Europlanet Science Congress 2022, Granada, Spain, 18–23 Sep 2022, EPSC2022-646, https://doi.org/10.5194/epsc2022-646, 2022.
The evaluation of candidate landing sites for a solar powered ice drilling mission for the Moon was done at the southern polar region. Selection criteria were low slope angle surface, occasionally solar illuminated location with direct Earth radio access, together with <125 K temperature at 1 m depth. The survey showed thee-four areas where all of these needs were satisfied at sites close to each other (see the Figuew 1 below). Considering these regions, the maximal diameter for safe and scientifically relevant landing ellipse sizes are around 0.5-1 km diameter, while containing <20% of unfavourable locations can be larger around 2-4 km. The best location is around -27.03 W -86.75 S, where solar illumination can have 30% of time at least and WEH values are elevated.
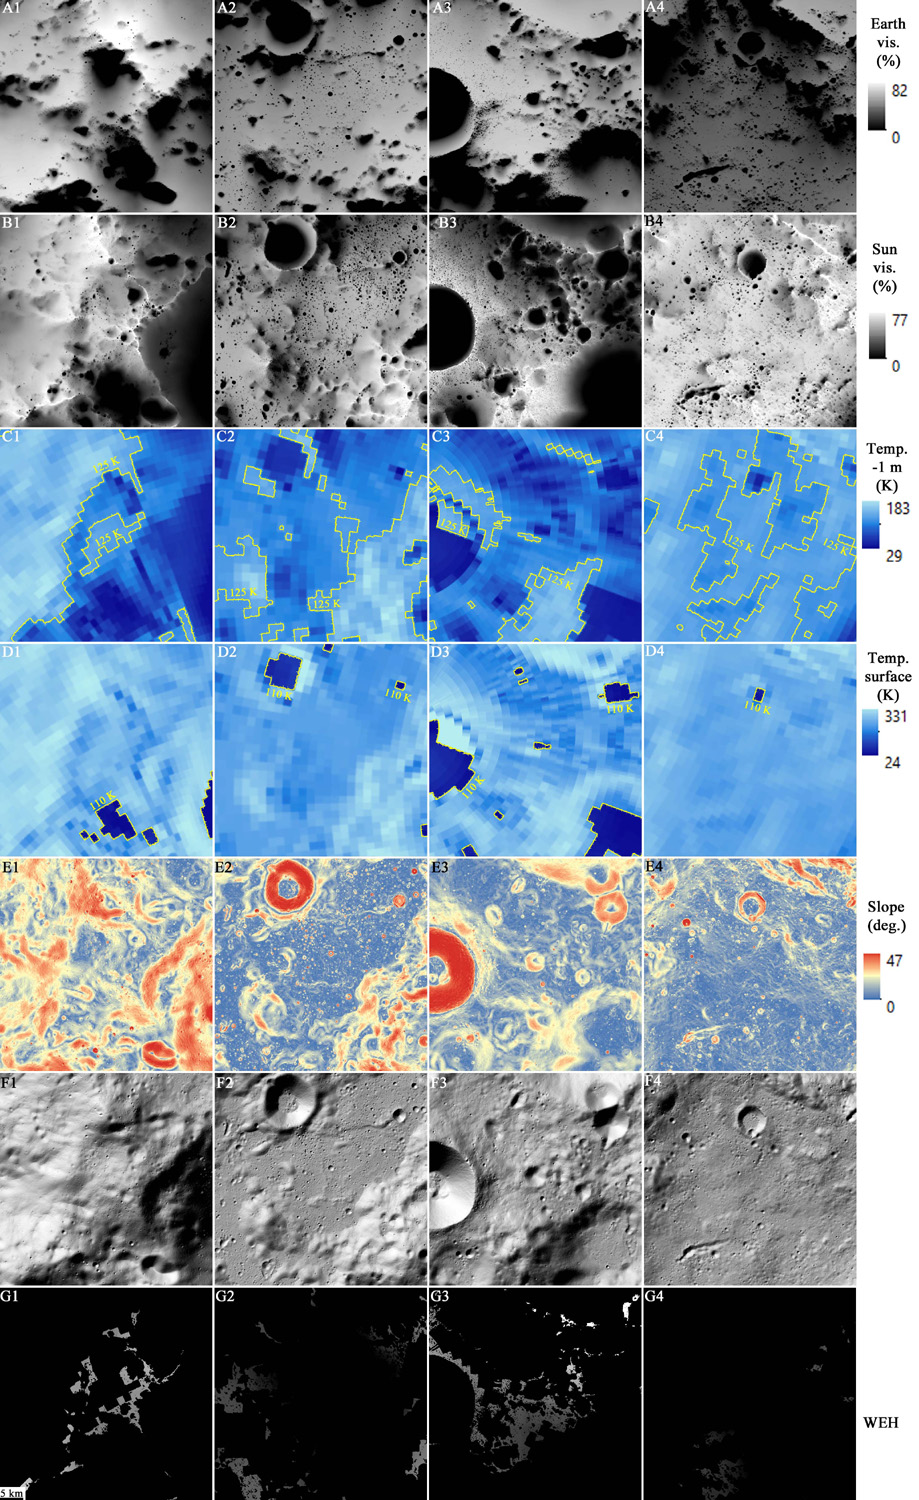
Figure 1. Insets of magnified versions of the four candidate areas.
How to cite: Kereszturi, A., Boazman, S., Heather, D., Tomka, R., and Warren, T.: Four candidate landing sites at the southern lunar polar region to drill water ice using solar powered missions, Europlanet Science Congress 2022, Granada, Spain, 18–23 Sep 2022, EPSC2022-346, https://doi.org/10.5194/epsc2022-346, 2022.
The south polar region is an area of renewed interest of lunar exploration because of the presence of volatiles including water ice at the surface or just beneath the surface (e.g., Deutsch et al., 2020, Hayne et al.,2015, Kring et al., 2020, Lemelin et al., 2021, Lemelin 2020, Li et al., 2018). PROSPECT is an instrument selected for flight on the 10th NASA Commercial Lunar Payload Services (CLPS) mission and aims to sample the lunar surface up to 1 m depth. Samples will be analysed for volatiles, and the gases given off when the samples are heated will be analysed by an onboard laboratory containing two spectrometers. PROSPECT will develop our understanding of the abundance and origin of volatiles in the south polar region and will also perform In-Situ Resource Utilisation experiments, extracting oxygen from lunar minerals (Heather et al., 2022). NASA CLPS-10 will be a static lander, so for PROSPECT to be able to sample the most volatile rich lunar soils, it is essential to select the correct landing site, with conditions most suited to the presence of volatiles while meeting all necessary engineering constraints.
Methods and Datasets:
We have used a combination of datasets with GIS remote sensing methods to investigate the south polar region (75°-90° S), including Lunar Reconnaissance Orbiter (LRO) images; NAC (Narrow Angle Camera) and WAC (Wide angle camera) (Robinson et al., 2010). We have analysed the elevation of the region using the LOLA 30 m/pixel dataset. Slope maps were created and classified into less than 10° and less than 5° to analyse the areas that are the most accessible. The surface temperatures of the region have also been analysed using both seasonal data from Diviner and data from the Oxford Thermal Model (King et al., 2020, Kereszturi et al., 2022). M3 ice exposures of the region have been identified and compared with surface temperatures and the slopes within the region (Li et al., 2018). The Mazarico et al., 2011 illumination model was also used alongside a toolkit from iSPACE (Luxembourg) to investigate the Earth visibility, horizon, and surface illumination (ispace (ispace-inc.com). Additionally hazards to landing such as craters and boulders have been identified within the region.
Results:
The south polar region shows large variations in elevation and slopes present due to the highly cratered surface and additionally the topography shows elevated areas and large ridges. However, there are large areas that have slopes less than 10°, which would be suitable for landing a mission that carries PROSPECT or for a future EVA (Figure1).
Temperature analysis from seasonal Diviner data shows that there are areas within the region that reach temperatures less than 100 K during the summer and winter and would allow for water ice to be stable if present. There are large areas that have temperatures less than 100 K that also have slopes less than 10° and therefore would be potentially a safe area to land and sample. The M3 ice exposures support the seasonal Diviner temperature data findings and there are areas where the slopes are less than 5° that correlate with the surface temperatures less than 100 K and with ice exposures shown by M3. (Figures 1c and d).
Future work:
This initial investigation into volatiles within the south polar region has highlighted some areas where there is evidence to suggest water ice may be present in areas where there are slopes less than 10°. These areas will be further investigated to study their accessibility, illumination conditions and Earth visibility. Additionally, other datasets such as KAGUYA will be used to understand the mineralogy of these regions of interest. These regions of interest will be analysed further by mapping potential hazards such as craters, boulders, and rock falls to assess the accessibility of these areas, for PROSPECT and for future missions.
Acknowledgement: This work was supported by the H82 POLICETECH project.
References:
Deutsch, A., et al., (2020) Icarus, 336.
Hayne, P., et al., (2015) Icarus, 255, 58-69
Heather, D.J. et al., (2022) EPSC, This meeting
Kring, D., et al., (2020) LPSC, 51st
Kereszturi, A., et al., (2022) EPSC, This meeting
Lemelin, M., et al., (2021) Planetary Science Journal, 2(3).
Lemelin, M., et al., (2020) LPSC 51st
Li, S., et al., (2018) Earth, atmospheric and planetary sciences, 115(36)
Mazarico,E., et al., (2011) Icarus,1066-1081,211(2)
Robinson, M., et al., (2010) Space Science Reviews, 81-124,150(1-4)
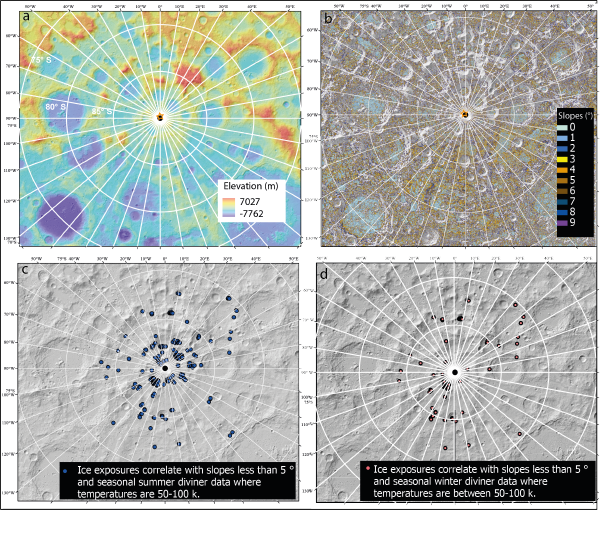
Figure 1: a) Elevation map using the LOLA (30m/pixel) dataset overlaid on a hillshade derived from the LOLA dataset. B) slope map derived from the LOLA (30m/pixel) showing areas where slopes are less than 10°. C) Data points show the locations of where M3 ice exposures (Li et al., 208) can be found which correlate with areas where slopes are less than 5° and where the seasonal diviner summer data shows average temperatures of 50-100 k. d) Data points show the locations of where M3 ice exposures (Li et al., 208) can be found which correlate with areas where slopes are less than 5° and where the seasonal diviner winter data shows average temperatures of 50-100 k.
How to cite: Boazman, S., Kereszturi, A., Heather, D., Sefton-Nash, E., Orgel, C., Tomka, R., Houdou, B., and Lefort, X.: Analysis of the Lunar South Polar Region for PROSPECT, NASA/CLPS, Europlanet Science Congress 2022, Granada, Spain, 18–23 Sep 2022, EPSC2022-530, https://doi.org/10.5194/epsc2022-530, 2022.
Introduction: PROSPECT is a payload in development by ESA for use at the lunar surface. Development to date has been for implementation on the Russian-led Luna-Resours Lander (Luna 27) mission. With the recent ESA Council decision to cease all cooperation with Russia on the Luna missions, the PROSPECT Project Team is in the process of redirecting the implementation towards flight on a NASA CLPS mission in the 2025/2026 timeframe. This opportunity was already agreed and in place with NASA at the beginning of 2022.
PROSPECT Overview: PROSPECT will perform an assessment of the volatile inventory in the near surface lunar regolith (down to ~ 1 m), and complete elemental and isotopic analyses to determine the abundance and origin of any volatiles discovered [1]. PROSPECT also has ISRU capabilities and will aim to complete in-situ extraction of oxygen from lunar minerals, which will constitute potential science return from anywhere on the Moon. PROSPECT is comprised of the ProSEED drill module and the ProSPA Analytical Laboratory (AL) plus the Solids Inlet System (SIS), a carousel of sealable ovens for evolving volatiles from regolith.
ProSEED can collect two icy samples of different sizes and mechanical properties in a single sampling operation, with the smaller sample of ~45 mm3 being delivered to ProSPA. The drill rod also has integrated temperature sensors and a sensor to measure the electrical permittivity of the lunar soil along the borehole.
The ProSPA laboratory will receive samples from the drill, seal them in miniaturized ovens, and process them via ramped (EGA), stepped (isotopic) or single step (ISRU) heating up to 1000 °C, completing physical and chemical processing of released volatiles, and analysing the obtained constituents via Ion Trap or Magnetic Sector mass spectroscopy.
ProSEED and ProSPA will also each carry small cameras. The ProSEED Imaging System (IS) has multispectral capabilities via 6 LEDs ranging from 451 to 970nm. This will provide images of the drilling area and excavated subsurface regolith to monitor activities and deliver contextual information. ProSPA’s Sample Camera (SamCam [2]) will provide multispectral 3-dimensional images of the samples in the ovens, providing information on their morphology, grain size, volume and mineralogy.
Development status: Development to date has been for Luna 27, where PROSPECT was entering Phase C/D. As the package is the same for CLPS, this progress is not lost, and Critical Design Reviews for the major components will be completed this year in preparation for implementation on the NASA CLPS mission.
Drill Testing. The ProSEED Development Model was successfully tested in December 2019, demonstrating drilling and sampling in ambient, cold and thermal vacuum laboratory conditions. Tests included drilling into a well-characterized NU-LHT-2M simulant mixed with inclusions [3] covering a plausible range of regolith characteristics [e.g. [4]]. The main functionalities of the drill system were successfully demonstrated and required performances were achieved in these tests.
ProSPA Bench Development Model (BDM). The BDM of the ProSPA analytical lab at the Open University has been tested to demonstrate science performance against measurement requirements, verifying the evolved gas analysis (EGA), demonstrating ISRU capabilities [5, 6], and testing the performance of oven seal materials [7].
Science Activities: a number of science activities are being pursued alongside and in support of the technical development.
Volatile Preservation: Efforts continue on understanding the capability of PROSPECT to sufficiently preserve the volatile content in regolith throughout the sampling-analysis chain for a range of expected volatile contents and operational environments, e.g. [8, 9]. Detailed modelling and experimental work are helping to constrain the potential effect on measured D/H of sublimation of lunar water ice (e.g. [10]). Recent analysis has demonstrated that volatile loss is most significant during sample retrieval phase and work is underway to further investigate the effects of frictional heating during this critical phase. This will help ensure that even in a ‘hot operational case’, the original volatile inventory can be determined with sufficiently small uncertainties.
ProSEED Imaging System Testing: In summer 2021, members of the Science Team at IAPS in Italy have successfully tested the Engineering Model of the ProSEED Imaging System. Testing included measuring the spectral profile of each of the LEDs, characterizing the geometric, radiometric and spectral response of the camera, and assessing the impact that dust deposition may have on the camera sensitivity. Images taken of samples during the testing are now being analysed by the broader Science Team to see what can be ascertained from the multispectral data alone.
Contamination Analyses and Isotopic Measurement Capability: This year, a contamination framework has been developed to assess all vectors of potential contamination relevant to elemental and isotopic measurements. Science performance looks good with the current approach to cleanliness and contamination. The Science Team also recently revisited the science requirements related to isotopic measurements for ProSPA to allow for testing of instrument performance in line with the expected cleanliness and contamination parameters.
Landing site analyses: Existing work focusing on the 8 candidate sites for Luna 27 (e.g., [11]) is now being extended to more regional analyses in preparation for the NASA CLPS landing site selection process [12, 13]. Studies will target locations balancing science objectives, operational constraints and safety. The complex thermal and radiative environment at potential landing sites will be a key part of this analysis.
References: [1] Trautner, R. et al., (2018) Proc. Int. Astronaut. Congr. IAC, Vol. 2018-October. [2] Murray, N. J. et al. (2020) LPSC, LPI, Abs #. 1918. [3] Martin, D. J. P. and Duvet, L., (2019) LPSC, LPI, Abs #. 2663. [4] Hayne, P. O. et al., (2017) JGR Planets 122 (12), 2371–2400. [5] Sargeant, H. M. et al., (2020) Planet. Space Sci. 180 (104751). [6] Sargeant, H. M. et al., (2020) LPSC LPI, Abs #. 2058. [7] Abernethy, F. A. J. et al., (2020) Planet. Space Sci. 180 (104784). [8] King, O. et al., (2019) Planet. Space Sci. 104790. [9] Formisano, M. et al., (2019) Planet. Space Sci. 169. [10] Mortimer, J. et al., (2018) Planet. Space Sci. 158, 25–33. [11] Boazman, S. et. al., (2022) LPSC LPI. [12] Boazman, S. et al., (2022) EPSC, this meeting. [13] Kereszturi, A. et al., (2022) EPSC, this meeting.
How to cite: Heather, D., Fisackerly, R., Trautner, R., Houdou, B., Boazman, S., Barber, S., and Reiss, P. and the PROSPECT Science Team and Industrial Consortium: The ESA PROSPECT Payload: Science Activities and Development Status, Europlanet Science Congress 2022, Granada, Spain, 18–23 Sep 2022, EPSC2022-533, https://doi.org/10.5194/epsc2022-533, 2022.
Introduction
Spacecraft measurements show heterogeneously distributed magnetic field signals [1] indicative that the surface of the Moon is, at least, locally magnetized. The sources of those magnetic anomalies are yet not fully understood, as most of them are not related to known geological structures or processes (e.g. swirls). Some hypothesis to explain the origin of the magnetic sources include contamination from impactors that could deliver iron-rich material to the lunar surface [2], and heating associated with localized magmatic activity that could thermochemically alter rocks to produce strong magnetic carriers [3]. However, for both cases, an inducing field that could magnetize the lunar crust, such as a global magnetic field generated by a core dynamo, is required.
How a body gets magnetized depends on which geological processes occur, and different conclusions can be reached depending on the magnetization type. For example, for a thermoremanently magnetized terrain, magnetic information is valuable to constraint the paleopole position of a dipolar ambient magnetic field present during the geological process [e.g. 4, 5]. Some magnetic anomalies are associated with swirls which can help to constrain the sources geometry [3]. However, many other isolated anomalies are not, precluding us to constrain the sources shape. Here we propose another method, which is not dependent on the association of magnetic anomalies with swirls or geological structures, to elucidate the origin of the magnetic sources by constraining the location and geometry of the underlying magnetization.
Method
The magnetization geometry is inferred from orbital synthetic magnetic field measurements using an inversion scheme that assumes unidirectional magnetization while making no a priori assumptions about its shape [6]. This method has been previously used to infer the direction of the underlying magnetization [4-8] but it has not been used to infer the geometry of the sources.
The performance of the method is tested by conducting a variety of inversions. First, we build synthetic magnetic field observation grids, resulting from known buried uniformly magnetized bodies of different geometries. Three main geometries are used to mimic the main geological structures potentially magnetized at the lunar crust. Those are thin vertical cylinders, parallelepipeds and half horizontal cylinders to mimic basins, dykes, and lava tubes, respectively. For each case, we vary the thickness, the depth to the top layer and the horizontal size of the magnetized body, as well as the inducing field direction. To mimic the lunar case [4] for each uniformly magnetized body buried in the planet, the input synthetic magnetic observations are distributed in a grid at 30km altitude whereas the a priori dipoles mesh is placed at the surface. The best fitting direction of magnetization and the corresponding nonnegative dipoles distribution solution, is obtained from a nonnegative least squares inversion.
Results
Results from our synthetic tests show that this method is able to recover the location of the buried magnetized body. As an example, Figure 1 shows that stronger nonnegative dipoles from the best fitting solution are lying over the uniformly magnetized half horizontal cylinder. Figure 2 shows the sum of dipole moments as a function of longitude and latitude when varying the depth of the half horizontal cylinder magnetized body.
In general, we find in our inversions results a good correlation between the positions of the stronger dipole moments and the magnetized body, for the three tested shapes. When varying the thickness of the magnetized body, we find that thicker the body is, stronger are the dipole moments over the location of the body. When varying the depth of the body from 10 km to 60 km under the surface, the method retrieves correctly the position of the magnetized body although the accuracy on locating the body slightly decreases at same time that the strength of the dipole moments diminishes. By varying the magnetization direction from 0º to 180º from vertical, the method correctly retrieves the position of the magnetized body, however is less performant when the magnetization is horizontal to
the surface.

Figure 1: Best fitting inversion solution for a uniformly magnetized half horizontal cylinder at 10 km depth, radius of 1 degree, and magnetization vector pointing radially out from the surface. Dipole moments distribution as a function of (left) longitude and (middle) latitude. Distribution of nonnegative dipoles at the surface (right) where stronger dipoles are in hot colors.
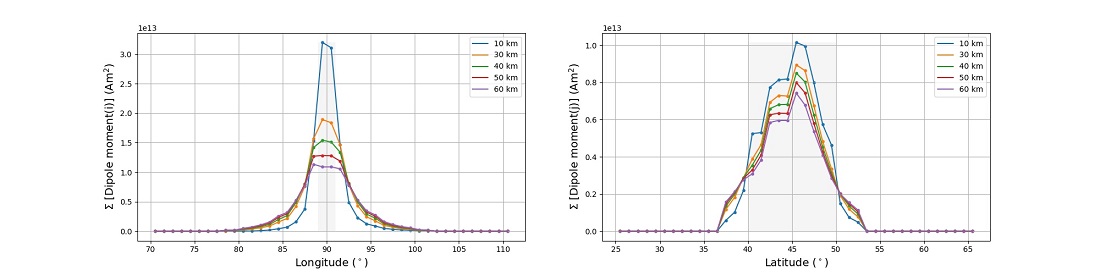
Figure 2: Sum of the dipole moments of the best-fit solution as a function of (left) longitude and (right) latitude, for the horizontal half cylinder case where depth varies (each depth corresponds to a color). Bins of 1 degree are used. Gray shadow locates the buried magnetized body.
Conclusion
The Parker’s method [6] initially designed to retrieve the magnetization direction of a uniformly magnetized body for paleopole location purposes is surprisingly performant in locating the position of the magnetized material. Three different volumes representative of the main geological structures that might be magnetized on the lunar surface have been successfully tested. Such an analysis can be performed on many lunar magnetic anomalies, including those which are not related to swirls or impact craters, i.e., the mechanisms that have been most studied up to now. This will help to elucidate the geological history of the Moon and key features of the lunar dynamo evolution.
Acknowledgements JSO is funded by the European Union’s Horizon 2020 research and innovation programme under the Marie Sklodowska-Curie grant agreement SIGMA no 893304. This work has been partially funded by the Spanish Programme for Research, Development and Innovation under the project MINOTAUR of reference PID2020-119208RB-I00.
Bibliography
[1] Tsunakawa, H. et al. (2015), JGR Planets, 120, 1160–1185, doi:10.1002/2014JE004785.
[2] Wieczorek, M. A. et al. (2012). Science, 335(6073), 1212–1215. https://doi.org/10.1126/science.1214773
[3] Hemingway, D. J., & Tikoo, S. M. (2018). JGR Planets, 123, 2223– 2241. https://doi.org/10.1029/2018JE005604
[4] Oliveira, J. S., and Wieczorek, M. A. (2017), JGR Planets, 122, 383– 399, doi:10.1002/2016JE005199.
[5] Oliveira, J. S. et al. (2019), JGR Planets, 10.1029/2019JE005938, 124, 9, (2382-2396).
[6] Parker, R. L. (1991), JGR, 96, 16,101–16,112, doi:10.1029/91JB01497.
[7] Oliveira, J. S., et al. (2017), JGR Planets, 122, 2429– 2444. https://doi.org/10.1002/2017JE005397
[8] Thomas, P. et al. (2018), JGR Planets, 123, 1140– 1155. https://doi.org/10.1002/2017JE005511
How to cite: Oliveira, J. S., Vervelidou, F., Wieczorek, M. A., and Díaz Michelena, M.: Constraints on the lunar magnetic sources location using orbital magnetic field data, Europlanet Science Congress 2022, Granada, Spain, 18–23 Sep 2022, EPSC2022-1164, https://doi.org/10.5194/epsc2022-1164, 2022.
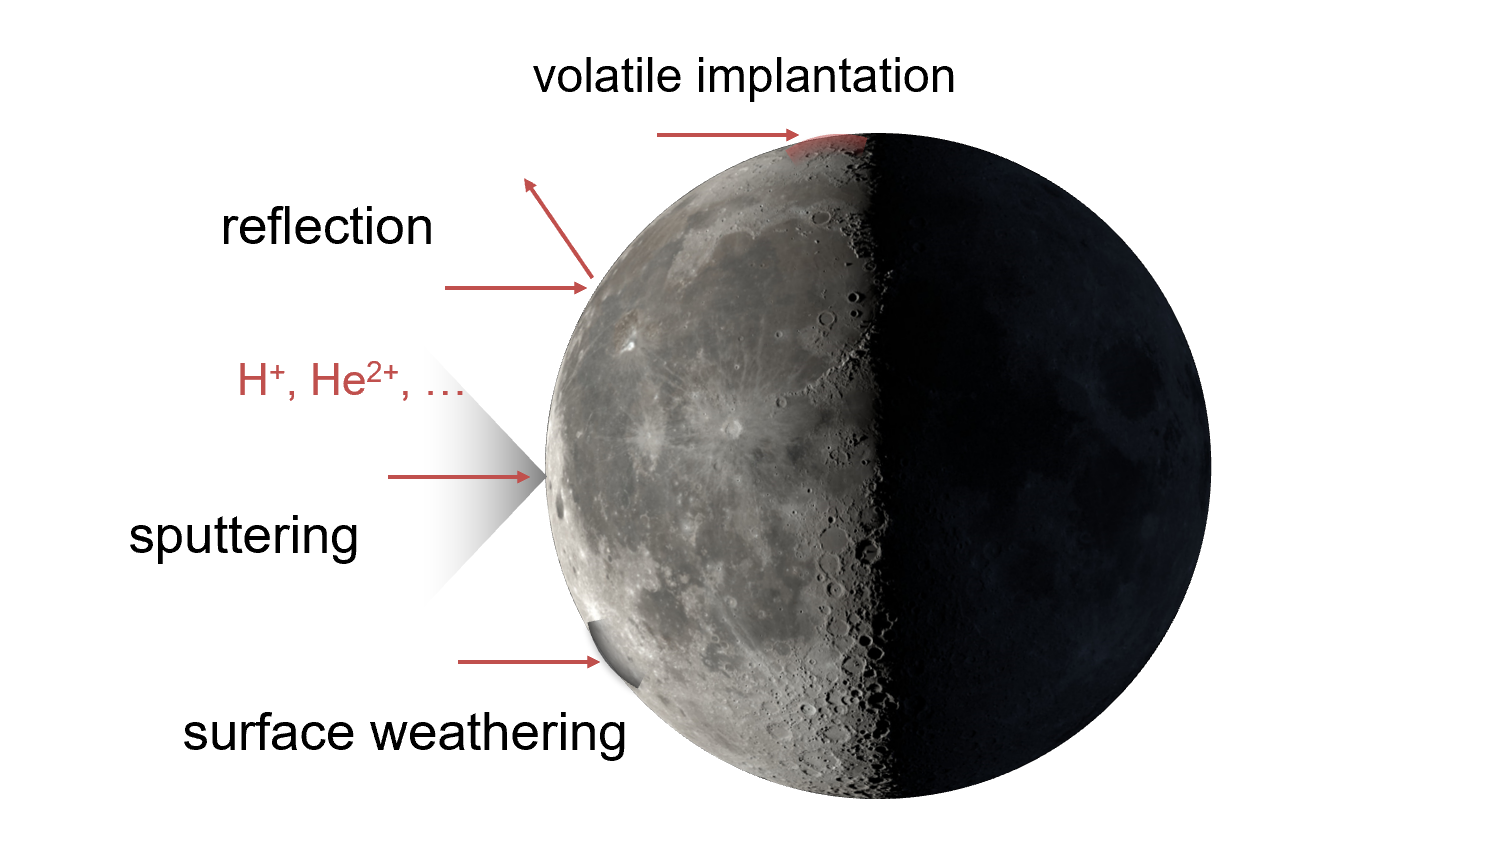
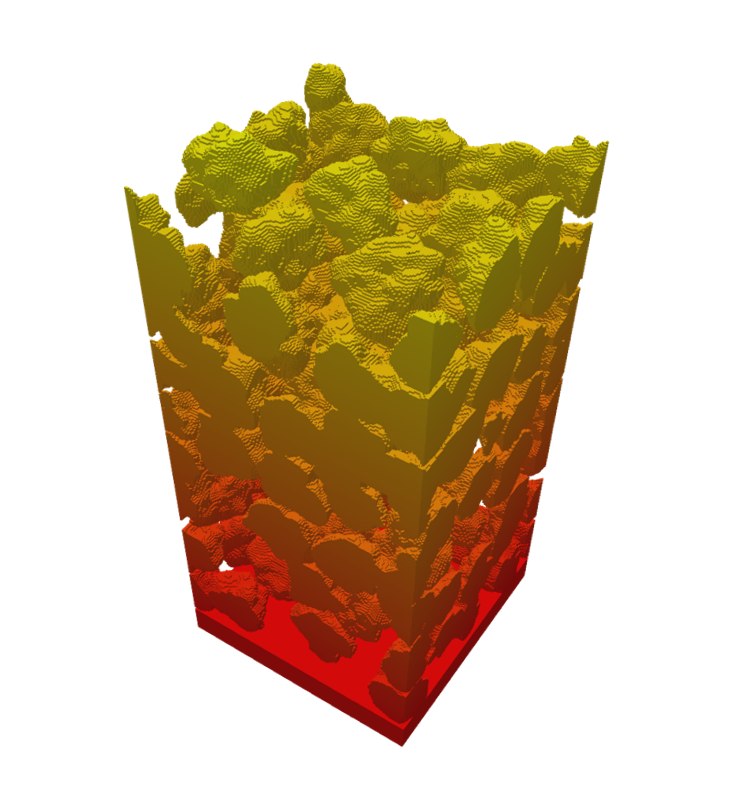
Figure 1, left: Ions interacting with the Moon cause a multitude of phenomena that influence its surface as well as its environment. Right: An example for a regolith setup used for SDTrimSP-3D simulations.
Ions from the solar wind and the Earth’s magnetosphere continuously impact the Moon [1, 2], which affects its surface and its particle environment (see Fig. 1). Due to the complex granular structure of the lunar regolith, an exact understanding of its interaction with precipitating ions is challenging. A better description of the occurring effects is essential for improving models of space weathering and exosphere formation. Important insights have been provided by the analysis of solar wind protons that are scattered as energetic neutral atoms (ENAs) [3-5]. Several observed characteristics are potentially linked to the regolith morphology, but a detailed description of the occurring processes is still lacking.
To answer open questions on the interaction of ions with the lunar regolith, we have implemented a regolith grain model in the ion-solid interaction code SDTrimSP-3D [6]. This simulation program sequentially traces all scattering events between atoms that are set into motion by an impacting ion. Grain shapes with varying fractal dimensions can be realized using a spherical harmonics expansion [7], with an example for a regolith setup being shown in the right image of Fig. 1.
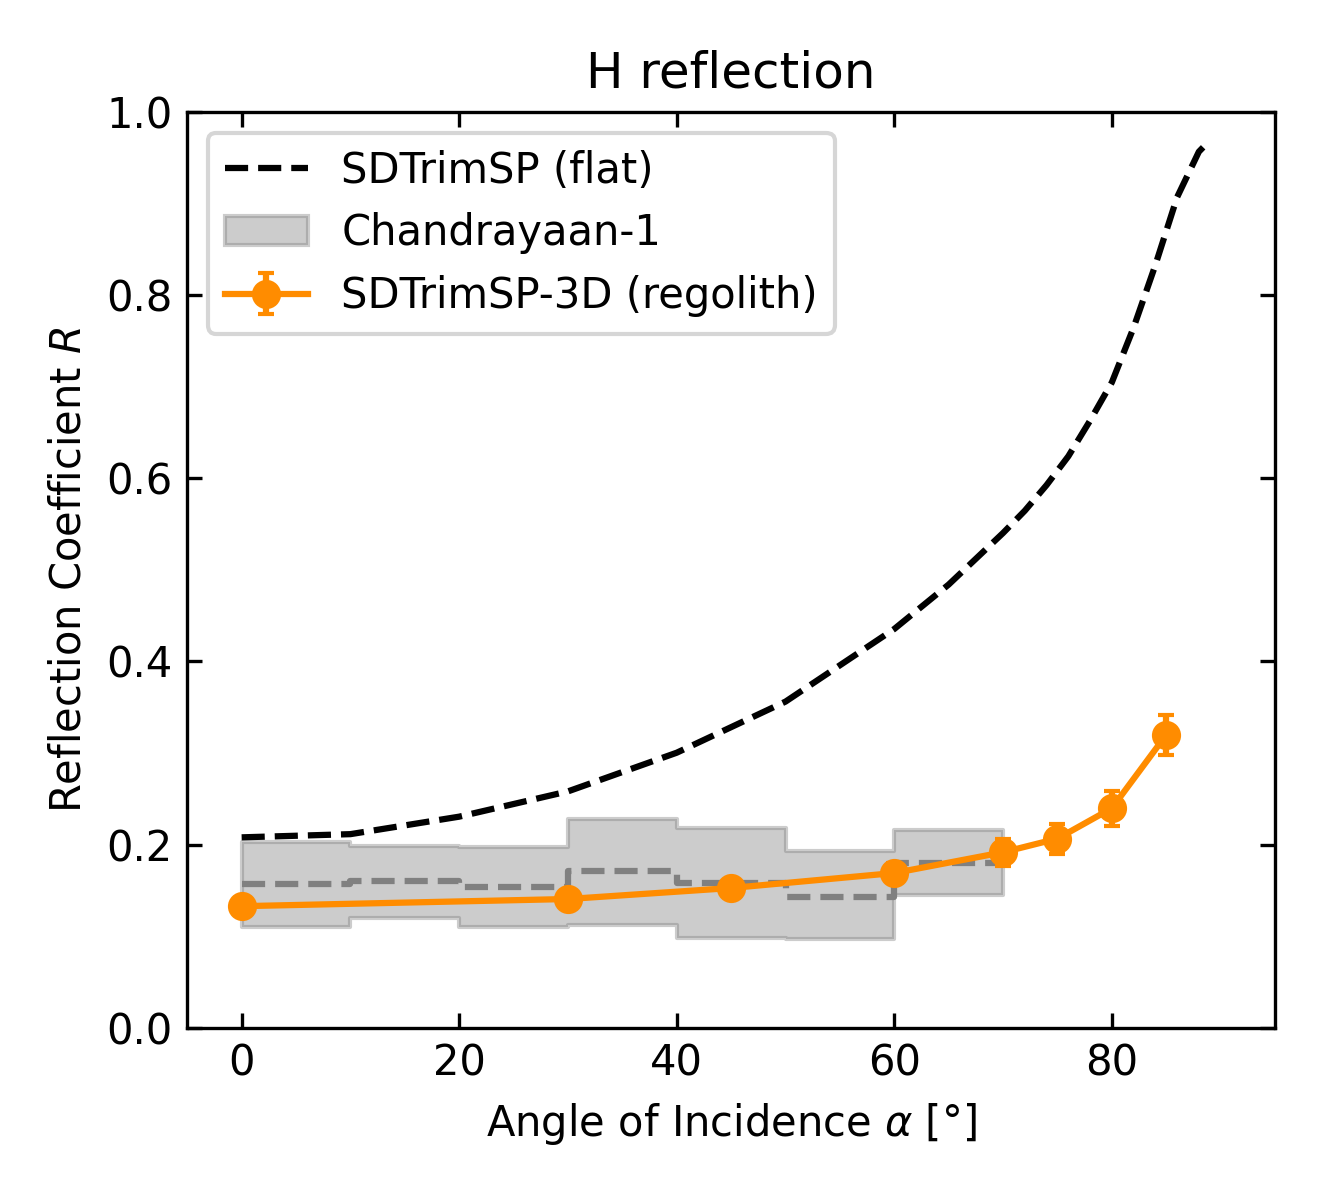
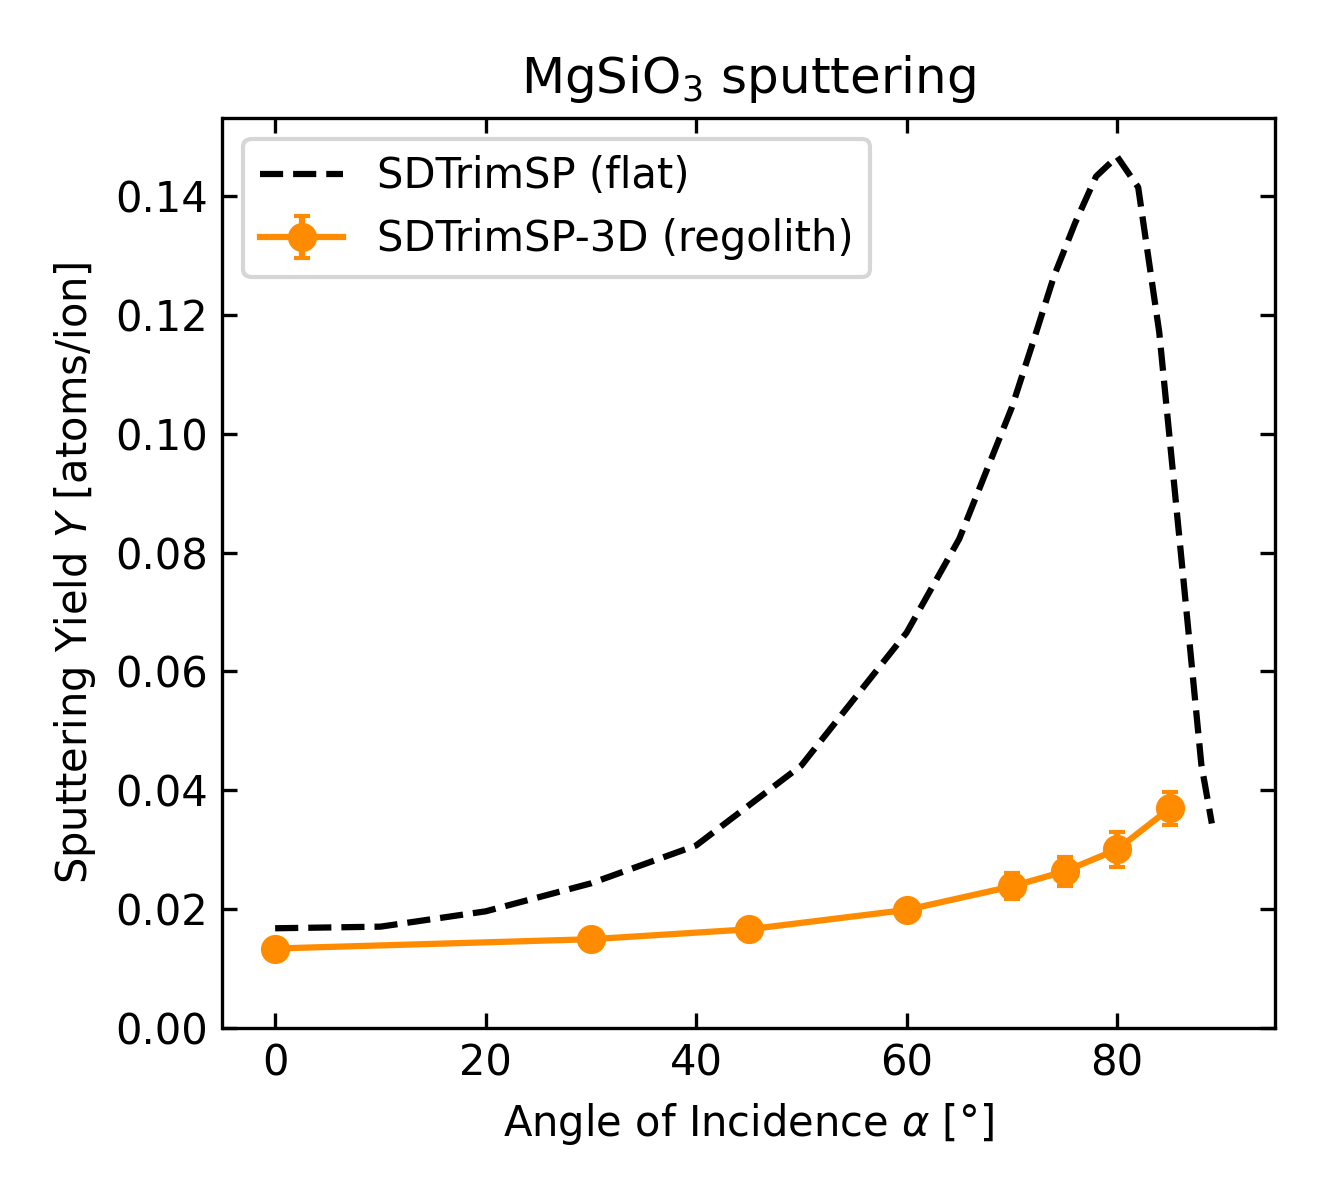
Figure 2, left: Chandrayaan-1 observations of the reflection coefficient (from [8]) are well reproduced by the regolith simulations with SDTrimSP-3D. Right: Sputter yields from regolith are also predicted to have a strongly decreased angular dependence.
Using the above-described inputs, simulations of the reflection coefficient and sputtering yields of solar wind protons impacting an enstatite (MgSiO3) regolith were performed. As shown in Fig. 2, both reflection and sputtering are found to be much less dependent on the angle of incidence compared to a flat surface. Overall, the ENA reflection coefficients from Chandrayaan-1 [8] can be very well reproduced with the regolith simulations. Lower ENA emission energies as well as a preferential backwards scattering as measured by Chandrayaan-1 [9,10] are also observed in SDTrimSP-3D. The major results of these spacecraft measurements can thus be connected to the granular regolith morphology. Therefore, the SDTrimSP-3D regolith simulations represent an important step towards an improved description of space weathering and the particle environment of the Moon.
References
[1] A.R. Poppe, W.M. Farrell, J.S. Halekas, J. Geophys. Res.: Planets, 123 (2018), 37.
[2] Q. Nénon, A.R. Poppe, Planet. Sci. J., 1 (2020), 69.
[3] M. Wieser, et al., Planet. Space Sci. 57 (2009), 2132.
[4] D.J. McComas, et al., Geophys. Res. Lett. 36.12 (2009).
[5] A. Zhang, et al., Planet. Space Sci. 189 (2020), 104970.
[6] U. von Toussaint, A. Mutzke, A. Manhard, Phys. Scripta T170 (2017), 014056.
[7] D. Wei, et al., Comp. Geotech. 104 (2018), 1.
[8] A. Vorburger, et al., J. Geophys. Res.: Space Phys. 118.7 (2013), 3937.
[9] Y. Futaana, et al., J. Geophys. Res.: Planets 117 (2012), E05005.
[10] A. Schaufelberger, et al., Geophys. Res. Lett. 38.22 (2011).
How to cite: Szabo, P. S., Poppe, A. R., Biber, H., Mutzke, A., Pichler, J., Jäggi, N., Galli, A., Wurz, P., and Aumayr, F.: Energetic neutral atom emission and sputtering of lunar regolith from 3D simulations, Europlanet Science Congress 2022, Granada, Spain, 18–23 Sep 2022, EPSC2022-300, https://doi.org/10.5194/epsc2022-300, 2022.
Solar wind precipitating onto the lunar surface results in the emission of energetic neutral atoms from the surface [1,2]. Emitted energetic neutral atoms consist of neutralized and backscattered solar wind protons and of sputtered surface materials. The sputtered population is a source population for the tenuous lunar exosphere and, given sufficient energy, escapes directly to space. Other mechanisms like photon stimulated desorption and micrometeoroid impact vaporization provide likely larger fluxes to the exosphere, but solar wind sputtering results in higher particle energies, which are easier accessible for measurements. The Advanced Small Analyzer for Neutrals (ASAN) is one of the payloads onboard of the Yutu-2 rover of the Chinese Chang'E-4 mission to the far-side of moon. The ASAN instrument (Figure 1) is an 8th generation instrument of the SWIM family [3,4]. ASAN measures energetic neutral atoms in an energy range from 10eV to 10keV with an energy resolution dE/E between 16% and 100% depending on species and energy. The mass resolution of ASAN is sufficient to separate hydrogen, oxygen and two heavy mass groups Si-group and Fe-group, named after the center mass in the group. The field of view of ASAN is a single angular pixel pointing to the lunar surface. The mobility of the rover allows investigating pristine lunar regolith, undisturbed by the landers retro rockets, at different locations. The instrument has been successfully operating for more than 3.5 years on the lunar surface since the landing of Chang'E-4 on 3rd January 2019. A wide range of solar wind conditions and observation geometries could be covered. We present mass resolved average energy spectra of sputtered energetic neutral atom fluxes from the lunar surface and compare the result with a semi-empirical model of the interaction. Mass resolved energy spectra reveal clearly two different populations of energetic neutral atoms, backscattered solar wind and sputtered surface particles. The energy spectra can be explained by a simple scattering model where impinging solar wind protons either are a) reflected through a single binary collision with a surface atom or b) undergo a two stage process where the impinging solar wind proton is backscattered from deeper atomic layer and then transfers its momentum to an atom on the surface in a binary collision resulting in the emission of a (sputtered) surface atom. In the energy range of concern these two mechanisms are sufficient to describe the observed mass dependent energy spectra. Total particle fluxes obtained by this model serve as a first estimation of the flux provided to the lunar exosphere through solar wind sputtering.
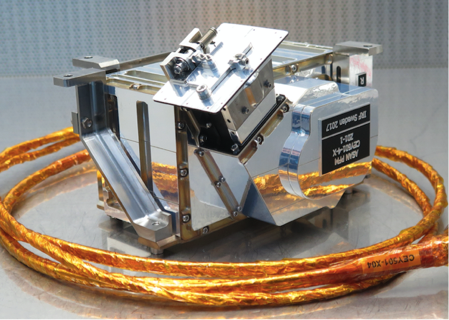
Figure 1: The ASAN instrument was built and is operated in collaboration between the Swedish Institute of Space Physics (IRF) and the National Space Science Center (NSSC), Chinese Academy of Sciences (CAS).
[1] Wieser, M. et al.: Extremely high reflection of solar wind protons as neutral hydrogen atoms from regolith in space. Planetary and Space Science, 57(14-15):2132 – 2134, 2009.
[2] McComas, D.J, et al.: Lunar backscatter and neutraliza- tion of the solar wind: First observations of neutral atoms from the moon. Geophys. Res. Lett., 36(12), 06 2009..
[3] Wieser, M. and Barabash, S.: A family for miniature, easily reconfigurable particle sensors for space plasma measurements. Journal of Geophysical Research: Space Physics, 121(12):11,588–11,604, 2016.
[4] Wieser, M., S. Barabash, X. D. Wang, A. Grigoriev, A. Zhang, C. Wang, and W. Wang. The Advanced Small Analyzer for Neutrals (ASAN) on the Chang’E-4 Rover Yutu-2. Space Science Reviews, 216(4):73, 2020.
How to cite: Wieser, M., Barabash, S., Wang, X.-D., Zhang, A., Wang, C., and Wang, W.: Sputtering of the lunar surface by solar wind: New data directly from the lunar surface, Europlanet Science Congress 2022, Granada, Spain, 18–23 Sep 2022, EPSC2022-444, https://doi.org/10.5194/epsc2022-444, 2022.
The surface of the Moon and other airless planetary bodies is usually covered by a regolith layer. The meteoroids and interplanetary dust particles bombarding such highly pulverized layer may excavate with a yield up to 1000 times of the impactor’s own mass. The excavated ejecta grains with relatively high speeds are the main components of the dust cloud around airless bodies. Faster grains with speeds exceeding the escape velocity of a planetary body contribute to the interplanetary dust environment.
In order to understand the formation of the dust cloud around airless planetary bodies, it is necessary to deeply understand how ejecta grains are launched from regolith surfaces. We performed new oblique impact experiments on particulate targets to determine the angular and size distributions of ejecta. The spherical Aluminum projectiles of 4 mm were fired by a light gas gun at speeds of around 4.1 km/s. The targets were B4C powders with median diameters of 17 µm and the incident angles were 15°, 30°, and 45° to the target surface. Around the target, arrays of thin Al foils with thicknesses of 15 µm were installed, which were penetrated by high speed ejecta grains. The resulting holes were analyzed with computer vision methods. Our preliminary result is that we found (1) the sizes of major ejecta grains are comparable with median diameters of the target powder; (2) the angular distributions of ejecta varies with the incident angle of the impactor.
How to cite: Li, Y., Yang, J., Sommer, M., Li, X., and Srama, R.: Measurement of micron-sized ejecta generated from oblique impact experiments with regolith simulant targets, Europlanet Science Congress 2022, Granada, Spain, 18–23 Sep 2022, EPSC2022-551, https://doi.org/10.5194/epsc2022-551, 2022.
Morpho-stratigraphic maps lay the groundwork for the geologic characterization of a planetary surface. Nevertheless, they do not provide the same level of information as geologic Earth maps. They thus need to be integrated with information derived from the multispectral and hyperspectral data.
The Clementine-based map produced for the lunar far side Tsiolkovskiy crater (20.4°S, 129.1°E) [1] allowed a first understanding of the composition, in particular for the basaltic infilling, of this crater.
In this work, the higher spectral and spatial resolution data obtained by the M3 imaging spectrometer [2] were used to derive a set of spectral indices (reflectance at 540 nm, band depth at 1000 and 2000 nm, and the spectral slope between 540 nm and the maximum of the first and second shoulder of the band depth at 1000 nm) helpful in enhancing compositional variations of the area. Rather than interpreting each index separately, 10 Spectral Units (Figure 1) conveying the spectral information fulfilled by all the spectral parameters were defined [3]. Notably, three Spectral Units discriminated on the smooth infilling of Tsiolkovskiy, which are fairly well correlated with the ones described on the basis of the Clementine UVVIS color ratio basemap, present the lowest reflectance values and the strongest absorptions around 1000 and 2100-2200 nm.
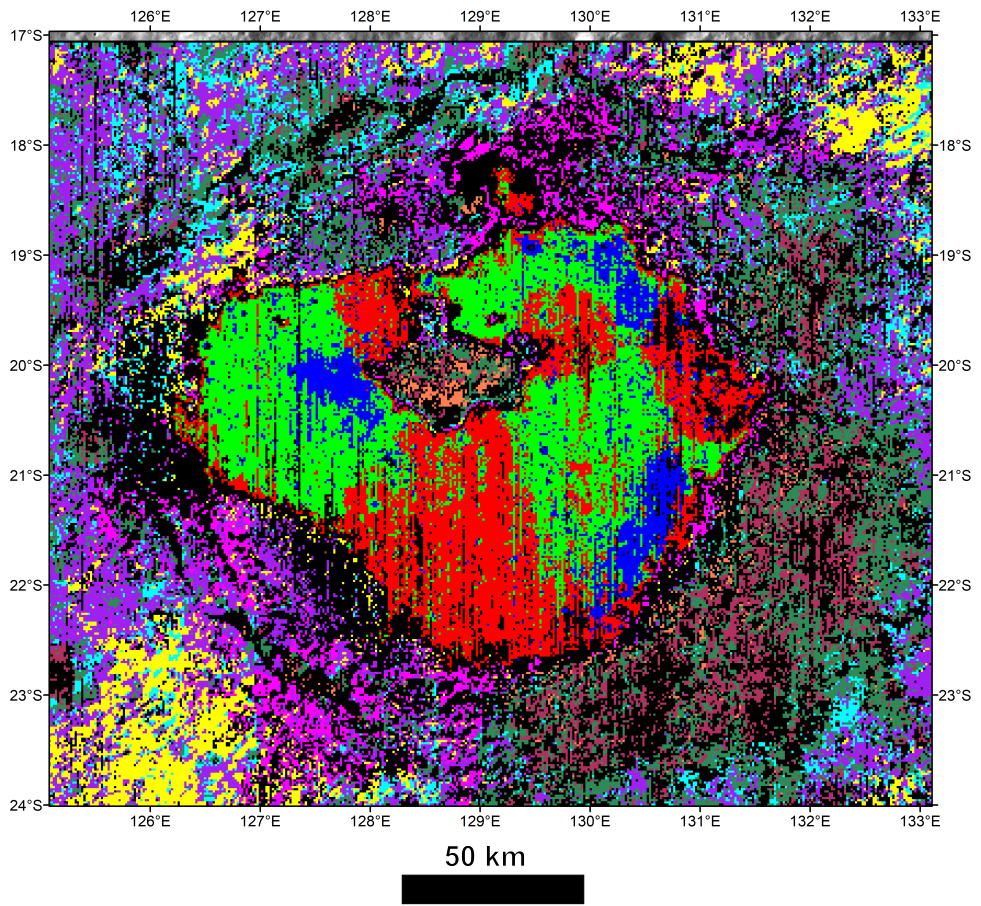
Figure 1. Spectral Units map of Tsiolkovskiy crater. Each unit summarizes the information held in several spectral parameters.
Given that pyroxenes are among the most common minerals on the Moon, we then compared the absorption band centers at 1000 and 2000 nm of the Spectral Units with those of RELAB synthetic pyroxenes [4,5]. The analysis revealed that most of the material of Tsiolkovskiy is characterized by a mineralogy similar to pigeonite or augite, a low Ca and Mg content and relatively high Fe. Some Spectral Units, however, do not fall inside a defined range and show a displacement of the band center at 1000 nm, possibly indicating the influence of a different component to be further investigated.
This work represents a step forward in the understanding of the mineralogical and compositional analysis of the Tsiolkovskiy crater and in the integration between morpho-stratigraphic and spectral units and between spectral units defined on different multispectral data.
Acknowledgements: We gratefully acknowledge funding and support from the PRIN-INAF2019-MELODY project and support from the EU’s H2020 research and innovation program under grant agreement No. 871149 (GMAP).
References: [1] Tognon et al., 2021, MDPI. [2] Pieters et al., 2009, Current Science. [3] Zambon et al., 2022, JGR. [4] Klima et al., 2011, Meteoritics and Planetary Science [5] Klima et al., 2011, JGR.
How to cite: Tognon, G., Zambon, F., Carli, C., and Massironi, M.: Spectral properties of the lunar Tsiolkovskiy crater through Spectral Units identification and analysis, Europlanet Science Congress 2022, Granada, Spain, 18–23 Sep 2022, EPSC2022-622, https://doi.org/10.5194/epsc2022-622, 2022.
The release of gases from regolith is studied with a Monte Carlo model in order to improve models of surface-boundary exospheres in the inner solar system. This kinetic model quantifies the competition between adsorption, desorption, and Knudsen and surface diffusion in three-dimensional granular media. The regolith is simulated as a computer-generated sphere packing with grain size distributions selected from lunar samples, whose voids present realistic paths for mass transport of trapped gases. In this work previous studies of exemplary gas-surface systems (argon, water, sodium) are extended by building sphere packings of varying macroporosity (0.4-0.6). Furthermore, the new calculations include light scattering and heat transfer. Results quantify the effect of regolith porosity on 1) gas residence time, 2) gas angular distribution, and 3) the magnitude of grain-to-grain temperature variations in vacuum. The findings are useful for understanding measurements from laboratory experiments as well as spaceborne measurements (e.g., LADEE, MESSENGER, Bepi Colombo).
How to cite: Sarantos, M., Tsavachidis, S., and Prem, P.: Effects of regolith porosity on exospheric gas release and retention, Europlanet Science Congress 2022, Granada, Spain, 18–23 Sep 2022, EPSC2022-626, https://doi.org/10.5194/epsc2022-626, 2022.
The shattering and abrasion of boulders on the Moon produce regolith. The study of these processes is thus relevant for our understanding of the nature and evolution of the lunar surface. The shattering rate, i.e., the erasure rate, of boulders on the Moon [e.g., Hörz et al., 1975] has been recently updated in [Rüsch et al., 2022]. Here we present the effect of low velocity secondaries on the erasure rate of boulders.
The model presented in [Rüsch et al., 2022] tracks the energy imparted by meteoroids on lunar boulders of different sizes. The imparted energy is a function of the size-frequency distribution and flux of meteoroids, and their velocity probability function. After having accumulated a certain amount of energy, through either one or multiple impacts, a boulder shatters and appears undetectable in images (“erased”). The shattering threshold behind which lunar boulders “disappear” is size dependent as described by the specific energy function [e.g., Housen and Holsapple, 1999; Benz and Asphaug, 1999]. This threshold has been determined using the size-frequency distribution of a boulder fields of known radiometric age on the Moon (Tycho). In addition to meteoroids with their characteristic high velocity (~10s km/s) the model also considers low velocity (0.5 km/s) impactors that represent secondaries, i.e., ejecta from primary impact craters. The flux and size-frequency of these secondaries is described in [Costello et al., 2018].
As presented in [Rüsch et al., 2022], the destruction rate for boulders larger than ~1 m is controlled by the flux of high velocity meteoroids. The rate for boulders smaller than ~1 m, instead, is dominated by the impact of low-velocity projectiles (Figure 1). For ~1 cm sized boulder, the destruction rate including low-velocity secondaries is about one order of magnitude higher relative to the rate due to primary alone. Despite the low velocity, the high number of secondaries, produced by the -4 exponent of the size frequency distribution power law, has a non-negligeable effect on small rocks.
If the model of lunar secondaries [Costello et al., 2018] considered here is valid, the erosion rates measured on cm-sized rocks returned by the Apollo missions [e.g., Hörz et al., 1975] represent the combined effects of meteoroids as well as secondaries. This result should be considered when erosion rates of Apollo samples are extrapolated to other bodies.
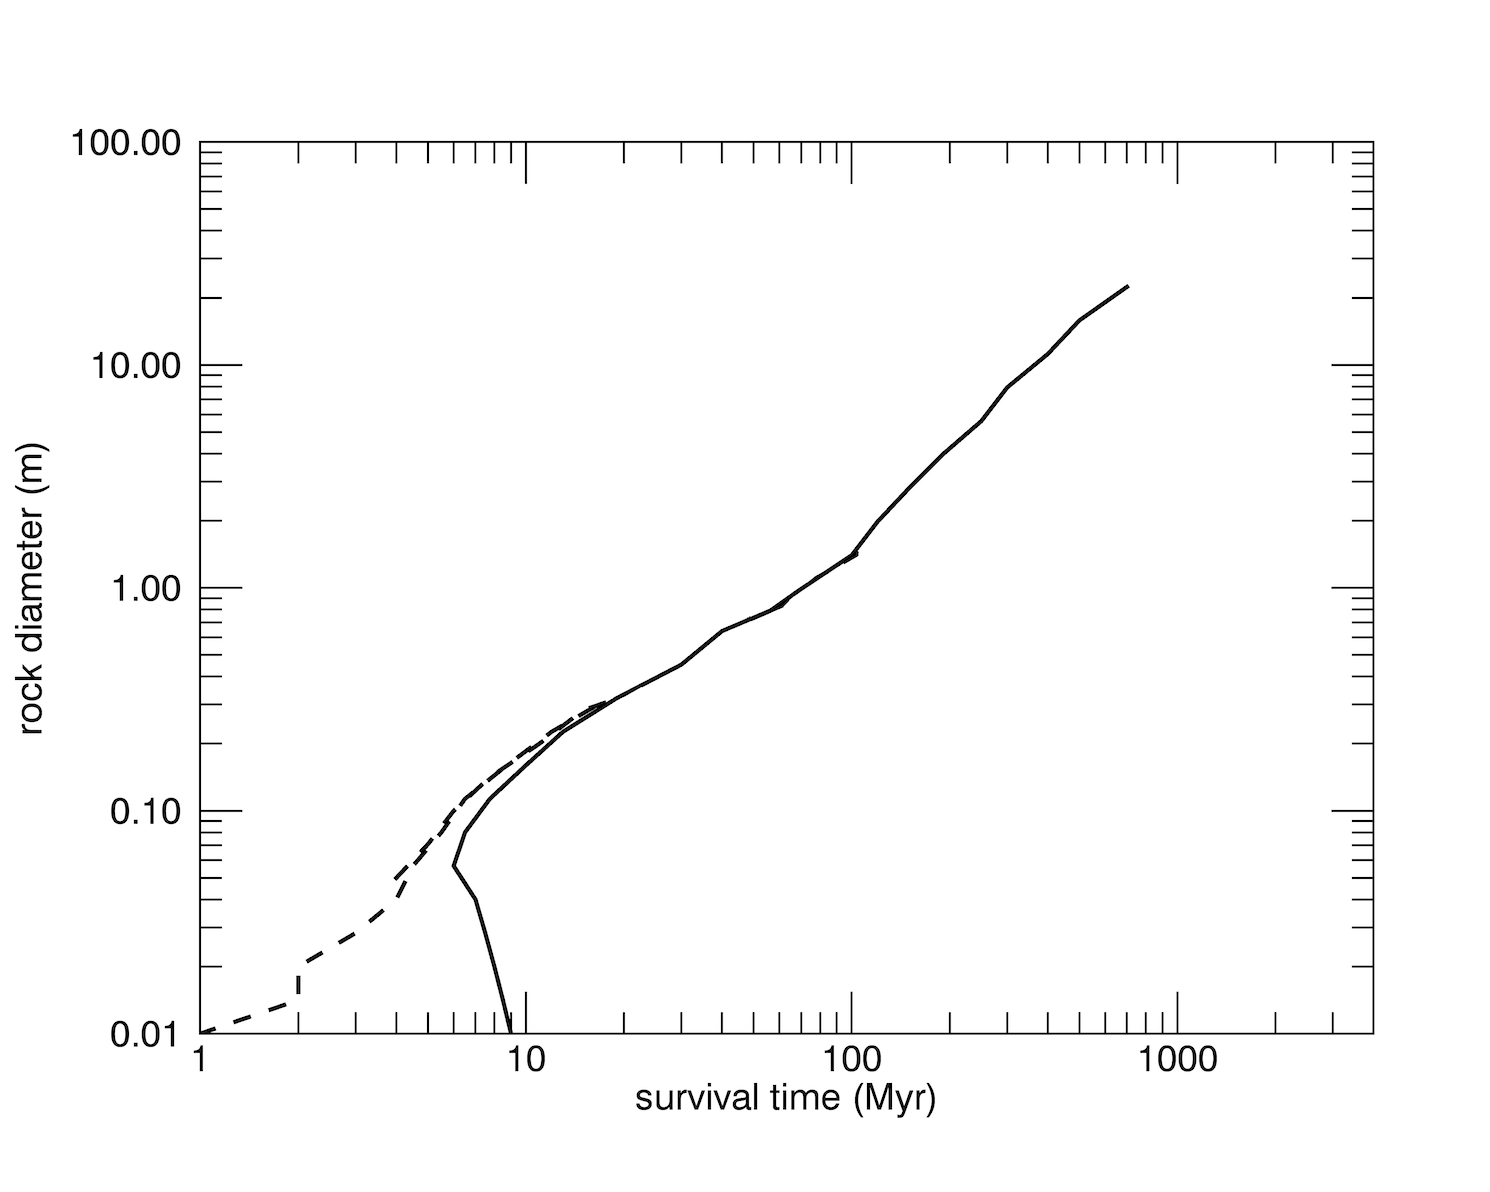
Figure 1. The survival time is defined as the time after which there is a 90% probability for a rock of given diameter to be erased. The solid line represents the effect of high velocity meteoroids. The dashed line represents the combined effects of high velocity meteoroids and low-velocity secondaries, i.e. ejecta of primary craters. Small irregularities in the curves are model artifacts.
References:
Costello, E.S., Ghent, R.R., Lucey, P.G., 2018. The mixing of lunar regolith: vital updates to a
canonical model. Icarus 314, 327–344
Housen, K.R., Holsapple, K.A., 1999. Scale effects in strength-dominated collisions of rocky
asteroids. Icarus 142, 21–33.
Benz, W., Asphaug, E., 1999. Catastrophic disruptions revisited. Icarus 142, 5–20.
Hörz, F., Schneider, E., Gault, D.E., Hartung, J.B., Brownlee, D.E., 1975. Catastrophic rupture
of lunar rocks: a Monte Carlo simulation. The Moon 13, 235–258.
Rüsch, O., Marshal, R. M., Iqbal, W., Pasckert, J. H., van der Bogert, C. H., Patzek, M., 2022, A Model for the Evolution of Lunar Rock Size-Frequency Distributions, LPSC 53rd, LPI Contribution No. 2678, id.1376.
How to cite: Ruesch, O., Marshal, R., Iqbal, W., Pasckert, J. H., van der Bogert, C., and Pasckert, M.: Destruction rates of lunar rocks (1cm to 60 m) by impact shattering, Europlanet Science Congress 2022, Granada, Spain, 18–23 Sep 2022, EPSC2022-916, https://doi.org/10.5194/epsc2022-916, 2022.
Introduction:
Analyses of samples returned by the Apollo Program have provided fundamental insights into the origin-history of the Earth-Moon system and how planets and solar systems work. Several special samples that were collected or preserved in unique containers or environments (e.g., Core Sample Vacuum Container (CSVC), frozen samples) have remained unexamined by standard or advanced analytical approaches. The Apollo Next Generation Sample Analysis (ANGSA) initiative was designed to examine a subset of these samples. The initiative was purposely designed to function as a participating scientist program for these samples, and as a preparation for new sample return missions from the Moon (e.g., Artemis) with processing, preliminary examination (PE), and analyses utilizing new and advanced technologies, lunar mission observations, and post-Apollo science concepts. ANGSA links the first generations of lunar explorers (Apollo) with future generations of lunar explorers (Artemis) [1-4].
Progress and Results:
Teamwork for gas extraction from CSVC 73001: To extract any potential gas phase from the CSVC, the European Space Agency (ESA) designed, built, tested, and delivered to JSC a CSVC piercing tool. To collect-store the gas phase, WUStL designed, built, and delivered to JSC a gas manifold system. Together these tools were used to open and sample the CSVC. Preliminary analyses of these gases are being carried out at UNM (Z. Sharp) and WUStL (R. Parai), which will determine whether a lunar component can be detected in the gas.
Extrusion of 73001: Following extraction of gas, the lower part of the double drive tube (73001) was imaged (µXCT, multi-spectral imaging), extruded, dissected, sieved, and examined (Pass 1 and 2). Pass 3 will remain unsieved and will be a target for PE by early career ANGSA scientists-engineers. ANGSA team members participated in the PE of 73002.
Frozen samples: The cold curation facility for processing Apollo 17 frozen samples was approved in mid-December 2021. These samples were processed and allocated in early 2022. Studies are advancing to define differences in preservation of (a) volatiles between frozen and unfrozen samples; (b) thermoluminescence kinetics in lunar samples [e.g., 5]; and (c) chronology.
Stratigraphy of 73001-73002: The stratigraphy of the double drive tube has been examined by multiple approaches. For 73001-73002, the stratigraphy was documented by µXCT imaging [6], reflectance properties [7,8], IS/FeO [8], major, minor, and trace element geochemistry [9,10], grain size/modal proportions [8,11,12], and continuous thin sections [13].
µXCT imaging of lithic fragments: Lithic fragments >4 mm in size were removed from the double drive tube during sampling passes 1-2 (73001-73002); from unsieved Pass 3 > 1cm fragments were removed. µXCT images of hundreds of these lithic fragments were produced. Fragments include a variety of breccias (some with a significant number of spherical glasses), high-Ti basalts with different cooling histories, a variety of “lower-Ti” basalts, and unique lithologies presumably derived from the South Massif. The ANGSA lithic analysis group is carrying out collaborative studies of these fragments [6,14].
Less than 1mm lithic fragments: During processing of Passes 1 and 2 from the double drive tube, samples were sieved into > 1 mm and < 1 mm size fractions. The < 1 mm size fractions were further sieved into 1000-500, 500-250, 250-150, 150-90, 90-20, and <20µm size fractions for selected intervals. In addition to determining modes of each size fraction within the stratigraphy, lithic fragments were also classified and documented. Impact melt rocks and breccias were abundant. Igneous lithologies include ferroan anorthosites, Mg-suite, “felsites”, low-Ti basalts, pyroclastic glasses, and a variety of high-Ti basalts [11,12,15]. Observations (e.g., volatiles, stable isotopes, organics, cosmogenic radionuclides, space weathering) were placed within the context of core stratigraphy [e.g., 16-21].
References: [1] Shearer et al. (2020) 51st LPSC abst.#1181 [2] Shearer (2008) Presentation to CAPTEM. [3] Shearer et al. (2019) 50th LPSC abst. #1412. [4] G. Lofgren (2007) personal communication. [5] Sehlke et al (2022) 53rd LPSC abst. #1267.[6] Zeigler et al. (2022) 53rd LPSC abst.#2890. [7] Sun et al. (2022) 53rd LPSC abst. #1890. [8] Morris et al. (2022) 53rd LPSC abst. #1849. [9] Neuman et al. (2022) 53rd LPSC abst.#1389. [10] Valenciano et al. (2022) 53rd LPSC abst.#2869. [11] Simon et al. (2022) 53rd LPSC abst.#2211. [12] Cato et al. (2022) 53rd LPSC abst.#2215. [13] Bell et al. (2022) 53rd LPSC abst.#1947. [14] Yen et al (2022) 53rd LPSC abst.#1547. [15] Valencia et al. (2022) 53rd LPSC abst#2608. [16] Cano et al. (2021) AGU Fall Meeting abst.; [17] Gargano et al. (2022) 53rd LPSC abst#2450 . [18] Recchuiti et al (2022) 53rd LPSC abst.#2193. [19] Elsila et al. (2022) 53rd LPSC abst.# 1212. [20] Welten et al. (2022) 53rd LPSC abst.#2389. [21] McFadden et al. (2022) 53rd LPSC abst. #1539.
How to cite: Shearer, C. and Zeigler, R. and the ANGSA Science Team: Using an analog lunar sample return mission to grow a lunar sample community and prepare for human return to the Moon’s surface. An update on the progress of the ANGSA initiative., Europlanet Science Congress 2022, Granada, Spain, 18–23 Sep 2022, EPSC2022-747, https://doi.org/10.5194/epsc2022-747, 2022.
Introduction: Apollo planned for the future, retaining a suite of specially curated pristine samples. One of these samples is an Apollo 17 double drive-tube core (73001/73002) [1], which samples down to 70 cm below the lunar surface within the ‘light mantle’ unit in the Taurus Littrow Valley (TLV) [2]. Models estimate a low temperature of ~250 K [3] at this depth, conducive for cold-trapping of volatiles. The lower core segment (73001) has been kept within a Core Sample Vacuum Container (CSVC) since 1972 when it was sealed under vacuum at the surface of the Moon [4]. On Earth, CSVC 73001 was sealed in a secondary outer vacuum container (OVC) at a pressure of ~6×10⁻² mbar [5]. One of the science goals for Apollo 17 was to target samples that may have trapped gases released from the lunar interior via the Lee-Lincoln fault [1]. The vacuum sealed CSVC 73001 presents a prime opportunity to investigate for such gases. Here we present the preparation and execution of a unique gas extraction event of CSVC 73001, as part of the Apollo Next Generation Sample Analyses (ANGSA) Program. This activity was led by an ANGSA subteam including the European Space Agency (ESA), Washington University St Louis (WUStL), JSC Apollo Sample Curation Facility and University of New Mexico (UNM).
Gas Extraction Set-Up & Challenges: A gas extraction set-up was created composed of two main hardware components: a piercing tool, designed and built by ESA, which interfaces with an ultra-high vacuum (UHV, order of pressure, ×10-9 mbar) gas extraction manifold developed and built by WUStL [6]. Technical and scientific challenges for the hardware design include: preserving the pristinity of the regolith and sample gases, avoiding contamination, preventing isotopic fractionation, capability to operate under UHV; accounting for limitations of dexterity when working within a dry N2 glovebox, and delivering on precision piercing of the CSVC stainless steel base without piercing the Teflon cap of the sample holder within.
Design and Manufacture: Following a hardware literature review [e.g., 4,7], an ‘agile’ iterative design approach was undertaken. This included: deriving a set of design requirements based on science, curation and technical needs; experimentally deriving the required piercing force and piercing tip dimension; iterative breadboarding; and regular consultation with ANGSA team members. The piercing tool was machined and manufactured at ESA and the extraction manifold built and calibrated at WUStL. Mechanical testing of the piercing tool under ambient conditions aided operational refinement and piercing tip calibration. Subsequent extensive testing under UHV demonstrated efficient, repeatable use of the piercing tool in meeting the objectives and identified challenges and requirements. The tested hardware underwent stringent cleaning and baking (heated in a vacuum oven at 180ºC for 72 hours) prior to being installed at JSC.
Outer Vacuum Container Gas Extraction: The OVC containing the CSVC and constituent sample was interfaced directly with the gas extraction manifold and a ‘blank’ sample of the background collected under UHV (order of ×10-9 mbar). A 100 cc ‘test’ aliquot and two gas samples were sequentially collected of the OVC gas, each for a duration of 15 minutes. The OVC gas could be important, if the CSVC may have leaked over the past 50 years. Initial (uncalibrated for system volume) pressures of the OVC sample (order of ×10-2 mbar) are consistent with that of the OVC when it was originally sealed.
Piercing the CSVC: The CSVC was extracted from the OVC and rendered XCT images showed the most challenging scenario of the sample holder with the Teflon cap in direct contact with the CSVC base. The CSVC was transferred to the piercing tool and interfaced with the gas extraction manifold (Fig.1). Extensive He-leak testing indicated no atmospheric leaks. Monitoring of pressures and RGA spectra (using a quadrupole mass spectrometer) indicated that the CSVC may be leaking. The manifold was isolated with the system pressure at 8.7×10⁻⁹ mbar and the piercing commenced. A satisfying ‘pop’ marked successful piercing of the CSVC base. Test aliquots (100 cc); two ‘short’ 15 minute duration samples (uncalibrated pressure, ~6 mbar) and ‘long’ extraction (~1-2 week duration) samples were collected. Pressures and RGA spectra were monitored throughout from which a set of hypotheses on how well the OVC and the CSVC have performed have been made and will be tested as part of laboratory analyses of the gas. Analyses include determining general gas composition (Z. Sharp at UNM) and noble gas isotope ratios (R. Parai at WUStL). In particular, 20Ne/22Ne and 128Xe/130Xe can assess for presence of lunar gas [8].
Findings and Lessons Learned: The full performance of the piercing tool and CSVC is still to be fully assessed. First XCT and optical images of the CSVC base indicate a high-level of tool performance in terms of not having pierced the Teflon cap and producing an adequate size of hole. A baseline set of requirements and sequence of events have been demonstrated for a gas extraction procedure, which is informing a new generation of (volatile-rich) sample return missions (e.g., Artemis; Mars Sample Return). Synthesis of the CSVC performance will also inform development of easy to use containers with longer lasting, contaminant-free seals.
Other lessons learned include recommendations to: produce physical duplicates and digital twins of flight hardware; further research into hardware degradation during flight and with time; ensure early definition of mission goals and consultation with science teams and curators (critical for providing clear driving requirements for hardware development); include flexibility in sample container designs and interfaces that account for the entire return sample life-time needs and not just at point of collection.
Figure 1: Gas extraction setup composed of an UHV manifold and piercing tool.
References: [1] Meyer C. (2011) Lunar Sample Compendium. [2] Schmitt et al. (2017) Icarus, 298, 2-33. [3] Keimh S.J. and Langseth M.G. (1973) Proc. 4th Lunar Sci. Conf. 2503-2513. [4] Allton J.A. (1989) JSC23454, NASA. [5] Butler P. (1973) Lunar Sample Info. Catalog, NASA JSC. [6] Parai. R et al. (2021) LPSC LII, Abs #2665. [7] NASA JSC (1971) CSVC Technical Drawing, M-11306. [8] Curran, N.M. et al. (2020) PSS, 182, 104823.
How to cite: McDonald, F., Schild, T., Bamsey, N., Apolloni, M., Biella, R., Butenko, Y., Dowson, A., Eckley, S., Gross, J., Jolliff, B., Lindner, R., Makaya, A., McCubbin, F., Meshik, A., Parai, R., Pravdivtseva, O., Sharp, Z., Shearer, C., Zeigler, R., and Science Team, A.: A unique lunar gas extraction event as part of the ANGSA Program and the lessons learned for a new generation of sample return missions, Europlanet Science Congress 2022, Granada, Spain, 18–23 Sep 2022, EPSC2022-1117, https://doi.org/10.5194/epsc2022-1117, 2022.
NASA’s Moon Trek (https://trek.nasa.gov/moon/) is one of a growing number of interactive, browser-based, online portals for planetary data visualization and analysis produced by NASA’s Solar System Treks Project (SSTP). Moon Trek continues to be enhanced with new data and new capabilities enabling it to facilitate the planning and conducting of upcoming lunar missions by NASA and its partners; scientific research; as well as public engagement.
Moon Trek’s innovation visualization and analysis tools are already being used by a growing number of missions and scientists around the world. The tools deployed including interactive 2D and 3D visualization, a DEM and Ortho Mosaic Image production pipeline as well as tools for distance measurement, elevation profile generation, solar altitude and azimuth calculation, 3D print file generation, virtual reality visualization generation, lighting analysis, electrostatic surface potential analysis, slope analysis, rock detection, crater detection, rockfall detection, and profiling of raster data.
Moon Trek is adding a new set of visualization and analysis tools include line of sight analysis (facilitating communications planning and detailed studies of solar illumination), traverse path planning, and 3D traverse path visualization tool, among others. This presentation will highlight Moon Trek’s latest tools and demonstrate their use cases.
How to cite: Law, E. and Day, B.: NASA Moon Trek’s New Visualization and Analysis Tools, Europlanet Science Congress 2022, Granada, Spain, 18–23 Sep 2022, EPSC2022-93, https://doi.org/10.5194/epsc2022-93, 2022.
Introduction
The Moon as our nearest celestial object is one of the most important bodies for space resource exploration and planetary science. However, knowledge of the physical properties of the lunar regolith is required for the exploitation of lunar resources and for understanding the Moon's geologic history. This knowledge comes mainly from Apollo in-situ experiments and returned samples (Heiken et al., 1991), but the global distribution of these properties is still poorly understood. Remote sensing measurements offer the opportunity to derive properties of unsampled areas with the help of models.
In our study, a microphysical thermal model for the lunar regolith was developed and the simulated surface temperatures were compared with thermal emission measurements from the Diviner radiometer (Paige et al., 2010) on board the Lunar Reconnaissance Orbiter (LRO) to derive regolith properties. This work expands upon previous investigations of lunar regolith properties using Diviner data (e.g., Hayne et al., 2017), by more directly simulating physical properties such as particle size and porosity.
Thermophysical model
The thermophysical model is based on the heat transfer equation and takes as input the physical and thermophysical properties of the modelled material, namely the bulk density, thermal conductivity and heat capacity of the lunar regolith. In order to describe these properties as continuous functions of e.g., depth or temperature, parameterised models of these properties are again needed.
The bulk density profile is described by the stratification model developed by Schräpler et al. (2015), in which the volume filling factor is a function of the grain radius and depth. The steepness of the transition between loose packing at the surface and dense packing at large depths is described by a single parameter. In addition, the density at the deepest model layer, defining the highest volume filling factor, is also a free parameter. The thermal conductivity at all depths is modelled as a function of grain radius, local volume filling factor and temperature (Gundlach & Blum, 2012) and the heat capacity is temperature dependent (Hayne et al., 2017). In our study, the highlands and the maria are modelled separately, taking into account their difference in albedo (Feng et al., 2020), mass density (Kiefer et al., 2012) and thermal conductivity (e.g., Cremers & Birkebak, 1971; Cremers & Hsia, 1974). Fig. 1 shows an example of modelled surface temperatures at the lunar equator.

Derivation of lunar regolith properties
Comparison of simulated surface temperatures with regolith temperatures measured by Diviner (Bandfield et al., 2011) allows us to constrain the free parameters in our thermophysical model (Fig. 2). We selected lunar regolith temperature data from a narrow band around the lunar equator for the highlands and the maria separately and determined the best fitting parameter set to investigate differences between these two types of terrains. For this comparison, only night-time temperatures were used, because they are most sensitive to subsurface thermophysical properties, such as thermal conductivity and bulk density. Fig. 2 shows the Diviner measurements together with the best-fitting thermophysical model runs. The best fits suggest smaller grain sizes and greater bulk densities in the maria compared to the highlands. By comparing the simulated and measured regolith temperatures for individual pixels on the lunar surface, maps of the investigated regolith properties can be produced. The final results along with the derived properties will be presented at the conference.

Conclusion
In this work, we derived lunar regolith properties by matching synthetic surface temperatures from a microphysical thermal model with LRO/Diviner regolith temperature measurements. The investigated parameters are regolith grain size, the transition width from low to high volume filling factor and the deep layer density. The surface temperatures in the highlands and the maria were analysed and modelled separately. During the EPSC, we will report on our findings and present the models and data in more detail.
References
Bandfield et al. (2011), J. Geophys. Res., 116, E00H02.
Cremers & Birkebak (1971), Lunar Planet. Sci. Conf. Proc. 2, 2311.
Cremers & Hsia (1974), Lunar Planet. Sci. Conf. Proc. 3, 2703-2708.
Feng et al. (2020), J. Geophys. Res., 125, E06130.
Gundlach & Blum (2012), Icarus, 219, 618-629.
Gundlach & Blum (2013), Icarus, 223, 479-492.
Hayne et al. (2017), J. Geophys. Res., 122, 2371-2400.
Heiken et al. (1991), Lunar Source Book, Cambridge University Press.
Kiefer et al. (2012), Geophys. Res. Lett., 39, L07201.
Paige et al. (2010), Space Sci. Rev., 150, 125-160.
Schräpler et al. (2015), Icarus, 257, 33-46.
How to cite: Bürger, J., Gundlach, B., Blum, J., Hayne, P., Läuter, M., and Kramer, T.: Lunar regolith properties derived from LRO/Diviner data and thermophysical modelling, Europlanet Science Congress 2022, Granada, Spain, 18–23 Sep 2022, EPSC2022-92, https://doi.org/10.5194/epsc2022-92, 2022.
1. Introduction
Knowing the photometric properties of a surface can give us insight into its physical properties. Images with several different observation conditions can be used to constrain the parameters of a semi-physical model like the Hapke model [1].
The Wide Angle Camera onboard the Lunar Reconnaissance Orbiter (LROC WAC) [2] provides unprecedented coverage of the lunar surface for a variety of phase angles. The field of view of the Narrow Angle Camera (LROC NAC) [2] is much smaller and therefore, also the possible phase angles are limited but the resolution is around 1 m/pixel.
Sato et al. [3] have used WAC images to create global maps of the Hapke parameters binned into areas of 1 degree/pixel [3]. In this work, we calculate photometric parameters on the pixel level. Velikodsky et al. [4] investigated the relative contributions of coherent backscatter and shadow hiding opposition effects based on WAC images and, similar to [3], find that the total strength of the opposition effect is inversely correlated with albedo.
The landing of a spacecraft on the lunar surface can change the physical properties of the regolith [5], e.g., by compacting the very porous lunar regolith.
2. Methods
Our method consists of three main steps. Firstly, the WAC or NAC EDR images are downloaded from the PDS and processed with ISIS3 [6]. This process includes calibration and map projection. The NAC images are mapped to a common resolution of 1.6 m/pixel and the WAC images are mapped to a resolution of 400 m/pixel. The sub-solar and sub-spacecraft points are extracted using the campt command in ISIS3.
Secondly, suitable images are co-registered in MATLAB to a common reference image and we calculate the incidence, emission, and phase angles based on the trajectory of the LRO, the sub-solar point, and either the GLD100 [7] in the case of WAC images or a Shape from Shading Digital Elevation Model [8] in the case of NAC images. Due to its large field of view, the phase angle changes significantly within one WAC image. For NAC images the emission angle can be assumed as constant for our region of interest.
Thirdly, we employ the NUTS sampler of pymc3 [9] to infer the posterior density of the parameters of the Hapke model [1] given the data. This Bayesian inference technique [10] also provides us with information about the respective uncertainties. Because several parameters of the Hapke model have a similar influence on the total reflectance, we limit our analysis to three parameters, namely, the single scattering albedo (w), the amplitude of the shadow hiding opposition effect (BS0), and the surface roughness (θb).
3. Results
For the landing site of Chang’e 5, we selected and co-registered 19 LROC NAC images, 8 before landing and 11 after landing. The phase angles range from approximately 45 degrees to nearly 90 degrees. For the Reiner Gamma swirl, we selected and coregistered 9 LROC WAC images and selected the wavelength channel at 605 nm. All outcrops of the regions of interest are shown in Figure 1. One can see that the image after the landing is overall brighter compared to that before the landing for a similar phase angle. The western part of the Reiner Gamma swirl is also clearly visible by its increased brightness (see Figure 1c). The resulting maps for albedo, shadow hiding amplitude, and mean of the standard deviation of the likelihood function (σ) are shown in Figure 2. The parameter σ describes the quality of the fit of the model and the data and can be interpreted similarly to a root mean squared error. Overall, the albedo increases from before the landing to after the landing, and BS0 decreases around the rover landing site. Very high values of BS0 coincide with shadows of the rover or craters and also correlate with high values of σ. Values with a σ value above 0.07 are labeled as invalid and are, therefore, omitted for future analysis. Pixels with an albedo larger than 0.21 have been labeled as on-swirl or landing-site. The histograms of the BS0 values are shown in Figure 3. They show that the landing site and on-swirl pixels show a significantly weaker shadow hiding effect than the surrounding surface.

Figure 1: Images of similar phase angle for the landing site before (a) and after (b) the landing of Chang’e 5 as well as for the western part of Reiner Gamma (c).
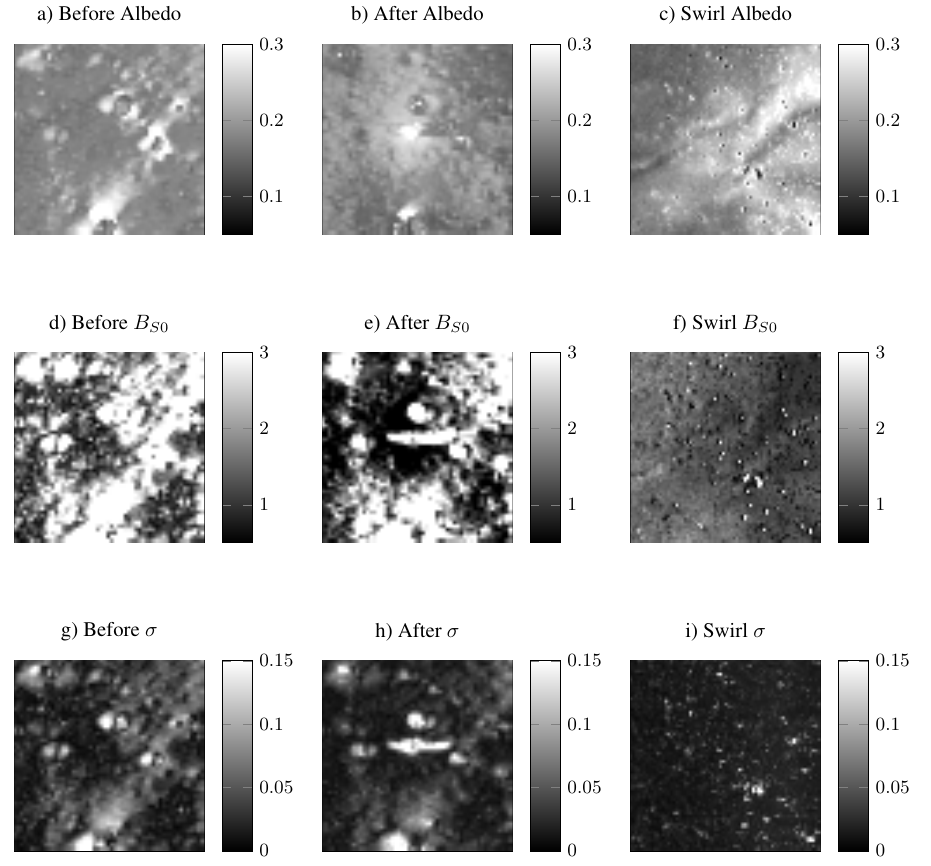
Figure 2: Maps of Hapke parameters.

Figure 3: Distribution of BS0 for the landing site after the landing and the Reiner Gamma swirl.
4. Conclusion
The landing of the Chang’e 5 rover on the Moon has changed the photometric properties of the surface. The albedo has increased and the shadow hiding opposition effect is less strong such that the phase curve has become flatter. This is generally the case for higher albedos but the reduction is nonetheless significantly even below the value expected for the brighter highlands [3]. Similarly, swirls show a reduced opposition effect. A physical explanation could be that the porosity of the regolith is reduced by fast-streaming gas from the landing rocket jet and from a passing comet, respectively (see [5]).
References
[1] B. Hapke (2012). Theory of reflectance and emittance spectroscopy, Cambridge.
[2] M.S. Robinson et al. (2010). Space science reviews, 150(1):81–124.
[3] H. Sato et al. (2014). JGR Planets, 119(8):1775–1805.
[4] Y.I. Velikodsky et al. (2016). Icarus, 275:1–15.
[5] V.V. Shevchenko (1993). Astronomy Reports, 37:314–319.
[6] J. Laura et al. (2022). URL https://doi.org/10.5281/zenodo.6329951.
[7] F. Scholten et al. (2012). JGR Planets, 117, E00H17.
[8] A. Grumpe et al. (2014). Advances in Space Research, 53(12):1735–1767.
[9] J. Salvatier et al. (2016). PeerJ Computer Science, 2:e55.
[10] A. Gelman et al. (1995). Bayesian Data Analysis, Chapman and Hall/CRC.
How to cite: Hess, M., Wöhler, C., and Qiao, L.: Photometric Modelling for Chang’e 5 Landing Site and Reiner Gamma Swirl, Europlanet Science Congress 2022, Granada, Spain, 18–23 Sep 2022, EPSC2022-147, https://doi.org/10.5194/epsc2022-147, 2022.
Introduction
The study and investigation of local scale geological features (boulders and boulder fields) of planetary/asteroid surfaces can provide insight on the evolution of the regolith and the contribution of various processes to their formation. Numerous studies have employed photometric modelling to study the surface properties of the lunar regolith on a regional and local scale (e.g., [1], [2], [3]). In this study we characterize the roughness exhibited by rock rich fields. We do so by employing a Normalized Logarithmic Phase Ratio Difference (NLPRD) metric to measure and compare the slope of the phase curve (reflectance versus phase angle) of a rock-rich field to a rock-free field. We calculate the NLPRD on model derived synthetic images of rock-rich fields and compare it to the NLPRD calculated from fully resolved rock fields in the LROC/NAC data.
Method
The first step in our approach consists of the construction of a set of digital terrain models (DTMs) representative of the most probable geologic contexts. The contexts are concerned with the rock and debris aprons shape and reflect the abrasion stage of the rock – Non-Abraded (flat top), Non-Abraded (angular), Mildly and Highly Abraded (Fig 1). Two size frequency distributions of rocks are used as input for the purpose of testing its effect on the resultant NLPRD
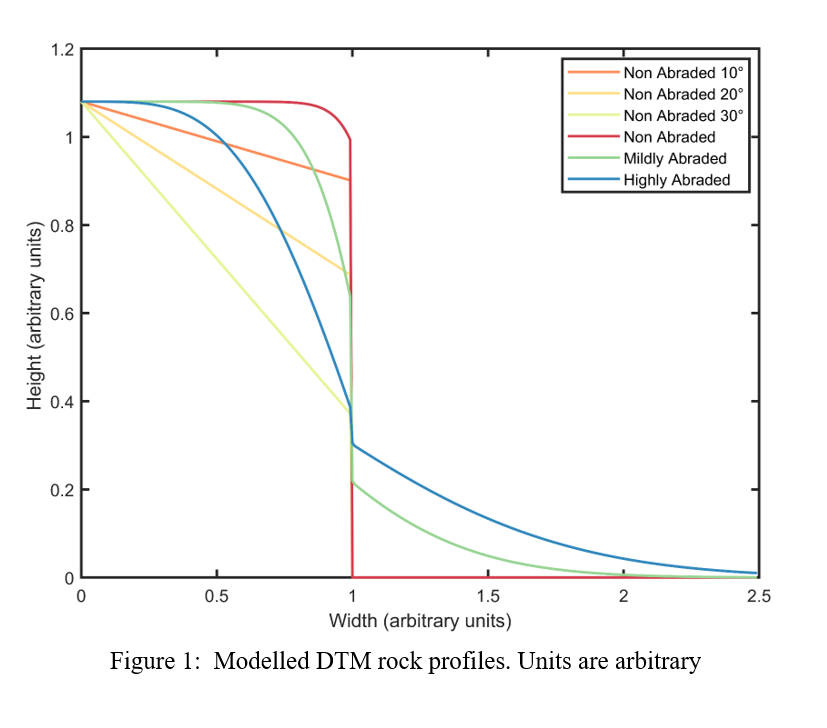
The synthetic DTMs are then converted to a synthetic reflectance image by utilising the Hapke model [4].
The NLPRD is then calculated as :

where F and B denote the mean reflectance of reference rock free area and rock rich area (boulder field), respectively. In the case of the synthetic images the mean reflectance is the spatially averaged model reflectance. In the case of the NAC data, the mean reflectance is calculated by averaging the I/F reflectance of each NAC pixel within each digitised polygon around a rock rich field (B) and a region with no resolved rocks(F). The selection the NAC areas is presented further below. P2 and P1 refer phase angles such that P2>P1. Effectively, the and are phase ratio images. We consider phase ratios is two configurations. Configuration 1 is a ratio of images acquired at the same incidence angle but varying emission angle – we address configuration 1 as emission ratio. Configuration 2 is a ratio of images acquired at varying incidence angle, but the emission angle is kept at nadir – we address configuration 2 as incidence ratio.
Results
The variations in model derived NLPRD as a function of rock abundance for both the emission and incidence ratio is shown in Figure 2. From figure 2a and 2b , we see that rocks do not exhibit uniform photometric behaviour the phase ratio configuration. The abundance and morphology of rocks contribute strongly to how rough it appears in reference to a rock free surface. Relatively high values of roughness can be achieved by modelling non-abraded tall rocks whereas for the same height, the tilting on the top of the rock consistently produces low roughness and much lower than the roughness of the rock-free field in both configurations.
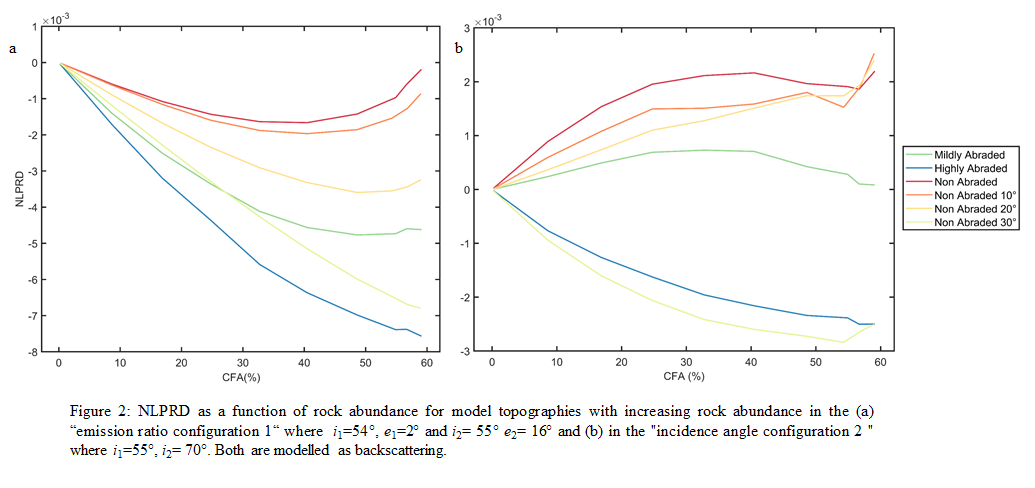
When comparing the model derived NLPRD to the NLPRD calculated from the LROC NAC data, in both configurations, the roughness of some boulder fields are explained by the modelled scenarios presented in Figure 2 whereas the roughness of some boulder fields are higher than the modelled lines. In the case of configuration 2, this mismatch is partially due to the regional topographic slopes, which is not an issue in configuration 1 as we use topographically corrected data from [6]. Overall, we find that with the addition of more parameters, the model lines explain the data to a greater extent, however this is often accompanied by additional complexity. Model lines are able to explain the observed roughness of the boulder fields in the NAC data when a combination of a double rock arrangement is coupled with an increase in macroscopic roughness of the rocks themselves (ϴb) or with a decrease in rock single scattering albedo(w). From the NLPRD of boulder fields in the vicinity of North Ray crater, we find that boulder fields on the west are rougher than those on the south east. This pattern might be indicative of spatial heterogeneity in the ejecta blanket ([5], [6]).
Conclusive remarks
From our study we find that rock morphology (shape) and thus nature of rocks creates different photometrical roughness or no photometrical roughness relative at all to a rock free surface. Rock morphology and rock size frequency distribution have the largest effects on the computed NLPRD.
Rock fields that are visually and photo-geologically indistinguishable have different photometric roughness characteristics in image ratios. We find that roughness of actual rock fields can be higher or lower than the model derived roughness, which might be due to the exclusion of additional parameters such as the macroscopic roughness or the modification of parameters such as the single scattering albedo of rock fields.
References:
[1] Watkins R.N. et al. (2019) JGR-P, 124, 2754–2771 [2] Sato et al. (2014) JGR-P, 119,1775-1805 [3] Lin et al. (2020) A&A,638 [4] Hapke (2012) Theory of Reflectance and Spectroscopy [5] Mustard el al. (2011) JGR-P, 116 [6] Velichko et al. (2020) PSS, 193
How to cite: Marshal, R. M., Rüsch, O., Wöhler, C., Wohlfarth, K., and Velichko, S.: Photometry of rock-rich surfaces on the Moon, Europlanet Science Congress 2022, Granada, Spain, 18–23 Sep 2022, EPSC2022-871, https://doi.org/10.5194/epsc2022-871, 2022.
Introduction: NASA’s Mini-RF instrument on the Lunar Reconnaissance Orbiter (LRO) is currently operating in concert with the Goldstone deep space communications complex 34 meter antenna DSS-13 to collect bistatic radar data of the Moon. These data provide a means to characterize the scattering properties of the upper meter of the lunar surface, as a function of bistatic angle, at X/C-band wavelengths (4.2 cm) and are being collected to address a variety of LRO science objectives. Here, we discuss efforts to address objectives related to the form and abundance of water ice and its vertical distribution.
Background: For each bistatic observation, the lunar surface is illuminated with a circularly polarized, chirped signal that tracks the Mini-RF antenna boresight intercept on the surface of the Moon. The receiver operates continuously and separately receives the horizontal and vertical polarization components of the signal backscattered from the lunar surface. The resolution of the data is ~100 m in range and ~2.5 m in azimuth but can vary from one observation to another, as a function of the viewing geometry. For analysis, the data are averaged in azimuth to provide a spatial resolution of 100 m. This yields an ~25-look average for each sampled location.
The data returned provide information on the structure (i.e., roughness) and dielectric properties of surface and buried materials within the penetration depth of the system (up to ~50 cm) [1-4]. The bistatic architecture allows examination of the scattering properties of a target surface for a variety of bistatic angles. Laboratory data and analog experiments, at optical wavelengths, have shown that the scattering properties of lunar materials can be sensitive to variations in bistatic angle [5-7].
Water ice can exhibit a strong response at radar wavelengths in the form of a Coherent Backscatter Opposition Effect (CBOE) and the circular polarization ratio (CPR) of the returned data can be a useful indicator of such a response—i.e., measured CPRs for icy materials typically exceed unity [8]. This effect has been observed in radar data for the floors of polar craters on Mercury [8,9]. However, ground-based radar observations of the lunar south polar region did not observe this effect [10]. This result was supported by later Mini-RF and Mini-SAR (Chandrayaan-1) monostatic observations of Cabeus (84.9°S, 35.5°W; 98 km dia.) [11] but was contradicted by Mini-RF bistatic observations that showed a clear opposition response, at S-band (l=12.6 cm) for Cabeus crater floor materials [12].
Observations/Results: Mini-RF S-band observations of the floor of Cabeus cover bistatic angles of 0.5° to 8.6° for incidence angles ranging from 82.4° to 86.6° (Figure 1). CPR measurements for the floor of the crater, as a function of bistatic angle, show a clear opposition surge; something not observed for the floors of nearby, similar-sized craters that were sampled at S-band wavelengths (e.g., Casatus, Klaproth, Blancanus, and Newton A and G) [12]. The opposition peak of Cabeus floor materials has a width of ~2° and features a ~30% increase in CPR. The bistatic observations of the region surrounding Cabeus indicate that mean CPR values for the portion of its floor that was imaged by Mini-RF are less than that of the surrounding highlands for bistatic angles > ~1.8° but similar to that of nearby radar-facing slopes. Mean CPR values for the imaged floor of Cabeus are higher than that of surrounding highlands and nearby radar-facing slopes for bistatic angles of 0.5° to 1.8°. Mini-RF data for bistatic angles < 0.5° were not acquired during the bistatic campaign. However, Mini-RF monostatic data (i.e., bistatic angle of 0°) of the crater floor were acquired at an incidence angle of 48° [11] and ground-based CPR measurements at a bistatic angle of 0.37° and large (> 80°) incidence angles have been made [e.g., 14]. Elevated CPRs were not observed in either case.
Mini-RF X-band observations of the floor of Cabeus cover equivalent incidence angles but a smaller range of bistatic angles than have been sampled at S-band. Initial analysis of these data show no indication of a CBOE. Data for the floor of Amundsen crater (84.5°S, 82.8°E; 103 km dia.), however, do suggest an opposition response. Its character is distinctly different from the S-band response observed for Cabeus, though (Figure 2). This could indicate that, if water ice is present in Cabeus crater floor materials, it is buried beneath ~0.5 m of regolith that does not include radar-detectible deposits of water ice.

Figure 1. Plot of mean CPR versus bistatic angle for Cabeus, sampled in 5 bistatic S-band observations targeting Cabeus floor materials

Figure 2. Plot of mean CPR versus bistatic angle for Amundsen floor materials sampled in 3 bistatic X-band observations.
References: [1] Campbell et al. (2010), Icarus, 208, 565-573; [2] Raney et al. (2012), JGR, 117, E00H21; [3] Carter et al. (2012), JGR, 117, E00H09; [4] Campbell (2012), JGR, 117, E06008; [5] Hapke et al. (1998), Icarus, 133, 89-97; [6] Nelson et al. (2000), Icarus, 147, 545-558; [7] Piatek et al. (2004), Icarus, 171, 531-545; [8] Harmon J. K. et al., (1994) Nature, 369, 213–215. [9] Harmon J. K. and Slade M. A. (1992) Science, 258, 640–643. [10] Campbell D. B. et al. (2006) Nature, 443, 835–837. [11] Neish C. D. et al. (2011) JGR, 116, E01005. [12] Patterson G. W. et al. (2017) Icarus 283, 2-19; [13] Campbell et al., 2006, Nature 443, 835-837.
How to cite: Patterson, W., Stickle, A., and Morgan, G.: Mini-RF Bistatic Observations of South Polar Craters on the Moon, Europlanet Science Congress 2022, Granada, Spain, 18–23 Sep 2022, EPSC2022-1095, https://doi.org/10.5194/epsc2022-1095, 2022.
On the way to robotic exploration on the Moon AI is going to play an increasingly important role in geomorphological studies. With the fast-growing amount of available data to be processed a direct human analysis is becoming steadily more difficult to achieves. Machine learning is a branch of AI and computer science which through the use of statistical methods utilize data and algorithms to simulate human learning behavior, characterized by the ability to automatically improve accuracy through experience. The success of these methods together with the readily available machine learning codes has resulted in an increasing deployment of this approach in all fields of geoscience, in particular for image recognition and classification tasks. Independent verification of the gained results from these studies is often difficult to achieve, partly due to the enormous amount of data to be handled, partly because the AI methods have features that make them hard to check (Szegedy et al., 2014). The effect of data bias is well known (Torralba et al., 2011) but other factors can also play a role. To exemplify and investigate the question of the trustworthiness of AI-based results in remote sensing we confront results from a recent AI-driven research study in planetary geomorphological science which analyzed a staggering data set of high-resolution lunar images with the help of Convolutional Neural Networks (CNNs) to construct a global lunar boulder map (Bickel et al. 2020) with a human-based analysis approach. We show which factors are crucial when preparing such studies and discuss the implications.
References:
Bickel et al., 2020, Impacts drive lunar rockfalls over billions of years, Nature Communications, https://doi.org/10.1038/s41467-020-16653-3
Szegedy et al., 2014, https://doi.org/10.48550/arXiv.1312.6199
Torralba et al., 2011, Unbiased Look at Dataset Bias, IEEE Conference on Computer Vision and Pattern Recognition (CVPR), 2011
How to cite: Mall, U. and Kloskowski, D.: Is it time for the human data analyst to retire in the era of artificial intelligence (AI)? A critical examination in scientific data analysis., Europlanet Science Congress 2022, Granada, Spain, 18–23 Sep 2022, EPSC2022-288, https://doi.org/10.5194/epsc2022-288, 2022.
Please decide on your access
Please use the buttons below to download the presentation materials or to visit the external website where the presentation is linked. Regarding the external link, please note that Copernicus Meetings cannot accept any liability for the content and the website you will visit.
Forward to presentation link
You are going to open an external link to the presentation as indicated by the authors. Copernicus Meetings cannot accept any liability for the content and the website you will visit.
We are sorry, but presentations are only available for users who registered for the conference. Thank you.
Posters: Mon, 19 Sep, 18:45–20:15 | Poster area Level 1
Introduction: Several future missions to the Moon will be devoted to robotic and human explorations in search for ice deposits and other resourses. Ground Penetrating Radar (GPR) is considered a fundamental geophysical instrument to detect water ice inside the regolith and to map the distribution of the volatiles in the lunar polar regions. The success of GPR survey relies on the capability to discriminate between dry and ice-saturated regolith or to detect lenses of relatively pure water ice. To reach this goal an intense laboratory activity is required to characterize the radar response of the lunar regolith as a function of mineralogical composition and different physical conditions (e.g., compactions, temperature, ice content). Here, we present new dielectric measurements of lunar regolith simulants in a broad range of frequencies and for different soil porosities, to improve the interpretation of radar data collected on the Moon. Such measurements have been carried out in the framework of the PrIN INAF “MELODY” (Moon multisEnsor and LabOratory Data analysis) research project, which is devoted to combining past and present lunar data to improve our knowledge on the lunar surface and shallow subsurface properties.
Laboratory measurements: GPR measurements allow one to retrieve signal wave velocity and attenuation in the lunar subsurface [1]. Such parameters are related to complex dielectric permittivity and magnetic permeability, from which some chemical-physical properties of the lunar soil and rocks can be inferred. We apply dielectric spectroscopy techniques for two pairs of commercially available, certified lunar soil analogues (Exolith Lab, 2021a, 2021b) [2, 3] to characterize the radar response of the regolith as a function of mineralogical composition and different physical conditions (e.g., temperature, porosity, and ice content). The investigation of these analogues helps us understand the most reliable lunar soil. Such analogues reproduce the composition of both lunar maria and highlands. The maria analogues are LMS-1D (particle size < 0 – 30 μm) and LMS-1 particle size < 0.04 – 300 μm). The highlands soil simulants are LHS-1D (particle size < 0.04 – 35 μm) and LHS-1 (particle size < 0.04 – 400 μm). The analogues mineralogy are reported in Tab. 1 and Tab. 2.
The measurements are performed at room temperature in the frequency range 100 kHz to 3 GHz, using a Vector Network Analyzer VNA (Agilent E5071C). The VNA ultimately provides the the electromagnetic parameters of the simulant through the Nicholson-Ross-Weir algorithm (NRW) [4]. This method allows one to retrieve both complex dielectric permittivity and magnetic permeability; however due to the negligeble magnetic properties of the samples, here only the dielectric permittivity is reported. Measurements are performend with a coaxial probe line characterized by a multiwire shield cage. Regolith analogues were first oven-dried at 105°C for 24 hours to remove residual water; then the samples are inserted in the teflon cage and different compaction are obtained through a vibration plate.
Results and future work: Fig. 1 (a and b) report the real and imaginary parts of the dielectric permittivity as a function of frequency for the Maria simulant having the smallest particle size range. Fig. 2 (a and b) illustrates the same parameters for the highland simulant. Note that for the two samples a different range of compaction is obtained. The real part of permittivity is frequency independent and decreases with increasing porosity because of the air trapped in the pores, as expected. For lunar maria it ranges from 1.8 to 2.2 (𝜙 from 70% to 60%), while the highland simulant shows higher values between 2.3 and 2.9 (𝜙 from 56% to 44%). Re- garding the imaginary part, it does not show a dependency on porosity, while it shows the same trends at every compaction over the frequency range for both simulants. The next step of the project will be the characterization of the dielectric behaviour of the simulants in a broad range of temperatures (200K – 373K).
Acknowledgements: We acknowledge support from the research project: “Moon multisEnsor and LabOratory Data analYsis (MELODY)” (PI: Dr. Federico Tosi), selected in November 2020 in the framework of the PrIN INAF (RIC) 2019 call.

References: [1] Jol, Harry M., ed. Ground penetrating radar theory and applications. elsevier, 2008. [2] Exolith Labs, U. of C.F LMS-1 Lunar Mare Simulant Spec Sheet (2021). [3] Exolith Lab, U. of C.F LHS-1 Lunar Highland Simulant Spec Sheet (2021). [4] Nicolson, A. M., & Ross, G. F. (1970). Measurement of the intrinsic properties of materials by time-domain techniques. IEEE Transactions on instrumentation and measurement, 19(4), 377-382.
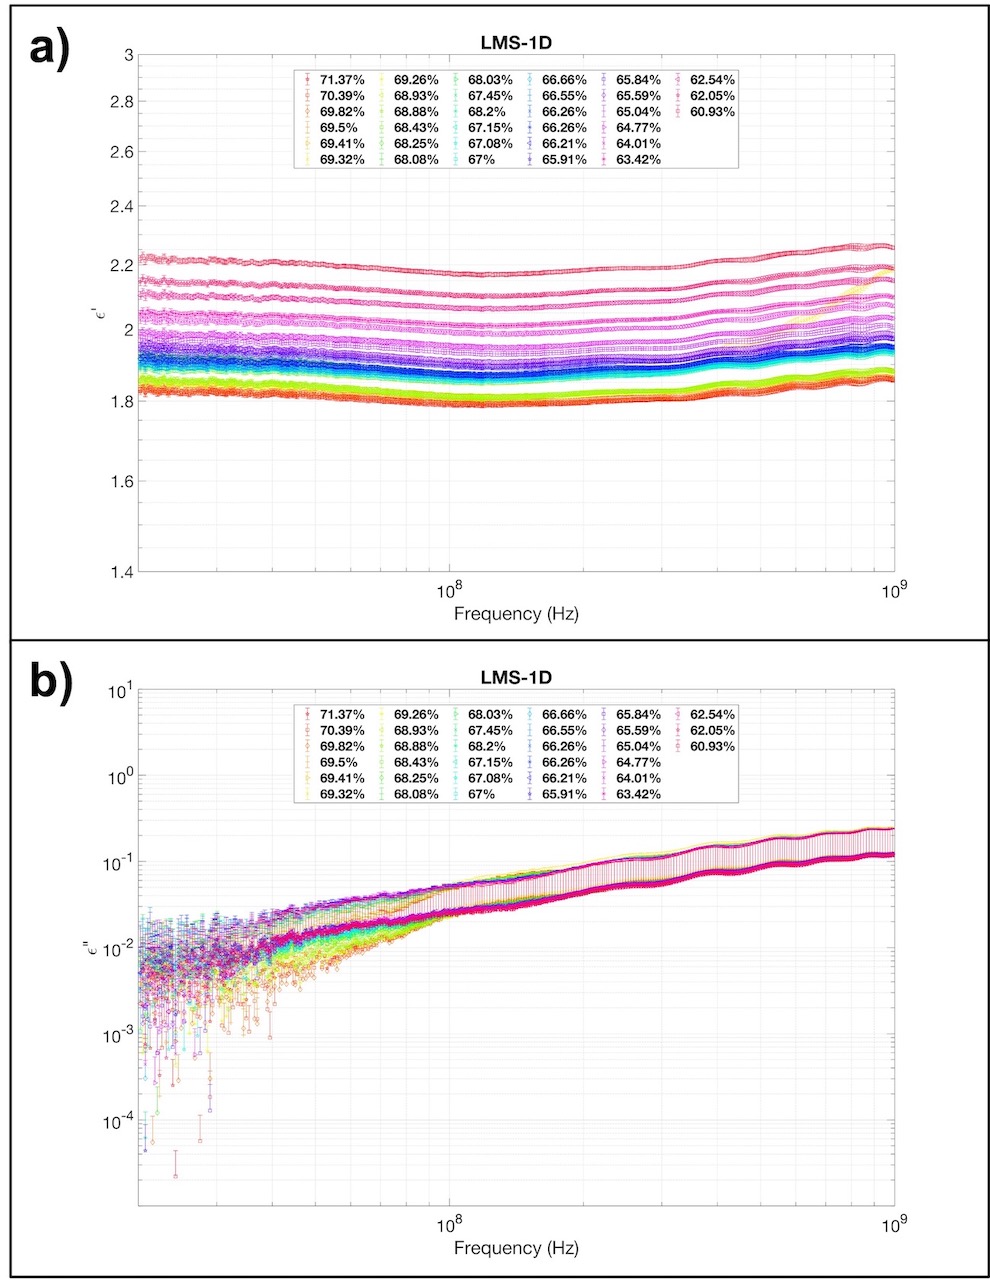
Figure 1: Real (a) and Imaginary (b) part of the permittivity as function of frequency of sample LMS-1D at varying compaction.
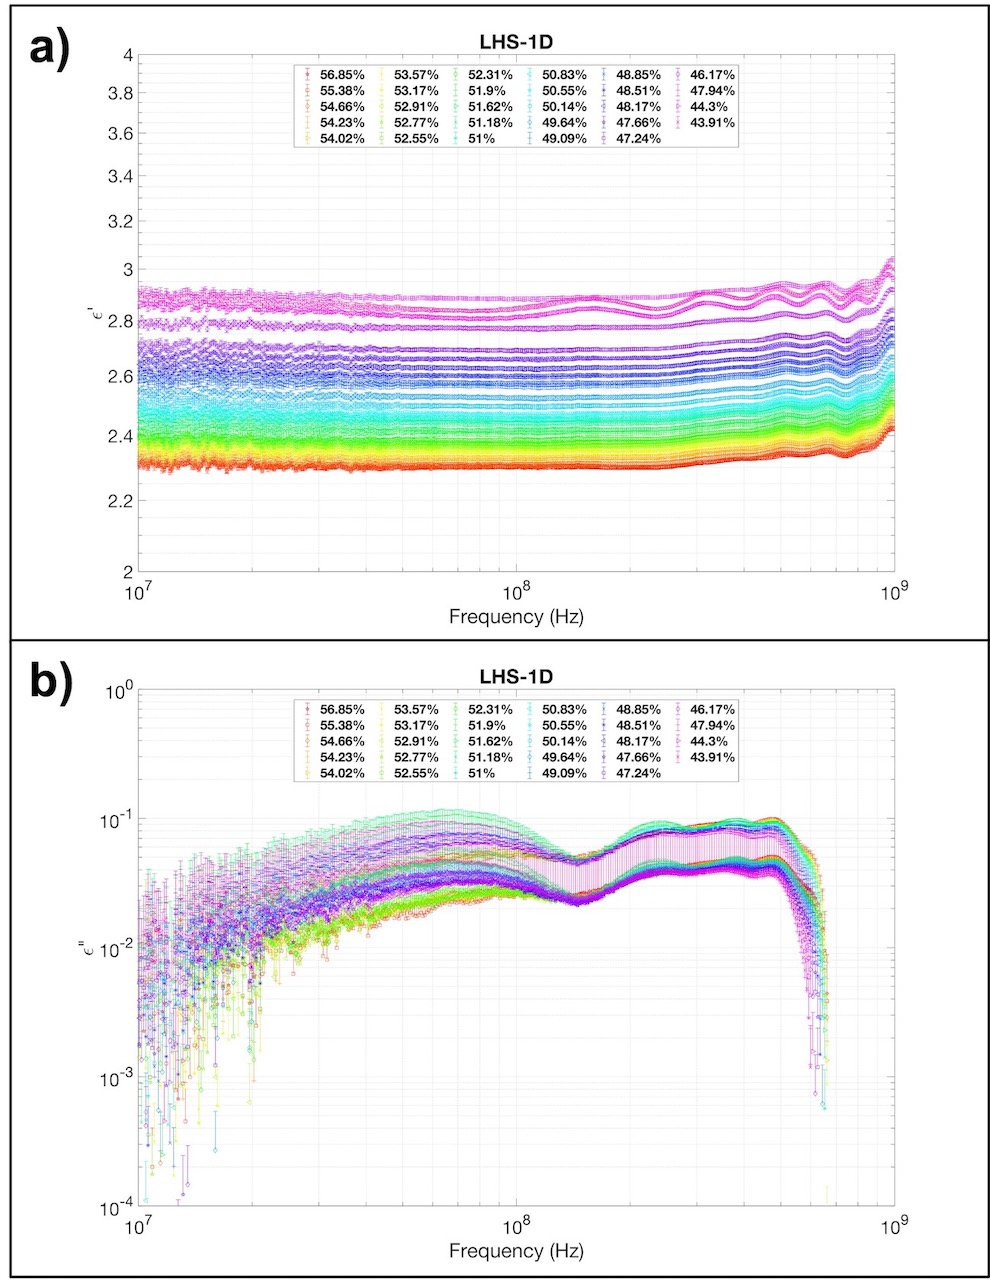
Figure 2: Real (a) and Imaginary (b) part of the permittivity as function of frequency of sample LHS-1D at varying compaction.

Table 1: Mineralogy of lunar Highlands analogues LHS-1 and LHS-1D.

Table 2: Mineralogy of lunar Maria analogues LMS-1 and LMS-1D
How to cite: Martella, C. H., Cosciotti, B., Lauro, S. E., Mattei, E., Tosi, F., and Pettinelli, E.: Dielectric measurements of lunar soil analogues at different compactions within the Melody project., Europlanet Science Congress 2022, Granada, Spain, 18–23 Sep 2022, EPSC2022-243, https://doi.org/10.5194/epsc2022-243, 2022.
This study investigates the lunar plasma environment when embedded within Earth's magnetotail. We use data from 10 years of tail crossings by the Acceleration, Reconnection, Turbulence, and Electrodynamics of the Moon's Interaction with the Sun (ARTEMIS) spacecraft in orbit around the Moon. We separate the plasma environments by magnetosheath-like, magnetotail lobe-like, and plasma sheet-like conditions. Our findings highlight that the lobe-like plasma is associated with low densities and a strong magnetic field, while the plasma sheet is characterized by higher densities and a weaker magnetic field. These regions are flanked by the fast, predominantly tailward flows of the terrestrial magnetosheath. During a single lunar crossing, however, the magnetotail displays a wide range of variability, with transient features—including reconnection events—intermixed between periods of lobe-like or sheet-like conditions. We compare and contrast the Moon's local magnetotail plasma to the environments near various outer-planet moons. In doing so, we find that properties of the ambient lunar plasma are, at times, unique to the terrestrial magnetotail, while at others, may resemble those near the Jovian, Saturnian, and Neptunian moons. These findings highlight the complementary role of the ARTEMIS mission in providing a deeper understanding of the plasma interactions of the outer-planet moons.
How to cite: Liuzzo, L., Poppe, A., and Halekas, J.: A statistical study of the Moon's magnetotail plasma environment, Europlanet Science Congress 2022, Granada, Spain, 18–23 Sep 2022, EPSC2022-291, https://doi.org/10.5194/epsc2022-291, 2022.
The Apollo 17 manned mission landed in the Taurus Littrow valley on the Moon in December 1972. The geology of this site, on the eastern edge of Mare Serenitatis, was thoroughly investigated during extra vehicular activities performed during three days spent at the surface [1, 2]. A total of 111 kg of well-documented rock and soil samples were collected and brought back to Earth during this last Apollo mission. Among several waypoints of interest, astronauts spent more than one hour to investigate five large boulder fragments at Station 6, lying at the base of a long boulder trail descending from the North Massif. These boulders might originate in material emplaced as a result from the ejected melt sheet from the Crisium impact event [2], or Serenitatis impact event [3, 4]. In a recent study [5], we used scanned photographs taken in situ with astronaut’s Hasselblad cameras to reconstruct a 3D model of each of the boulders using photogrammetry techniques [6].
In addition to the 3D reconstruction of the boulders themselves reported in [5], we pushed the reconstruction process one step further by taking advantage of the fact that the rock samples hammered from the boulders at Station 6 were thoroughly documented once brought back on Earth in the Lunar Receiving Lab facility in Houston. In particular, several stereoscopic photographic pairs were systematically acquired for a significant number of the samples. When a sufficient number of viewpoints have been acquired, this potentially allows a complete photogrammetric 3D reconstruction of the rocks themselves. We used as input original photographs available on the Lunar and Planetary Institute website (https://www.lpi.usra.edu/lunar/samples/atlas/). We first performed a color balancing of the scans of these photos. Then, masks corresponding to a detouring of the rocks were applied to avoid errors induced by the fixed background in the photogrammetric project. By manually adding tie points, we were able to compute a detailed textured 3D model of sample 76315 (a micropoikilitic impact melt breccia), sample 76215 (a vesicular micropoikilitic impact melt breccia), and sample 76015 (another vesicular micropoikilitic impact melt breccia, which was chipped off top corner of Block 5 of the big boulder at Station 6). The full reconstruction process is illustrated in Fig. 1 for sample 76215.
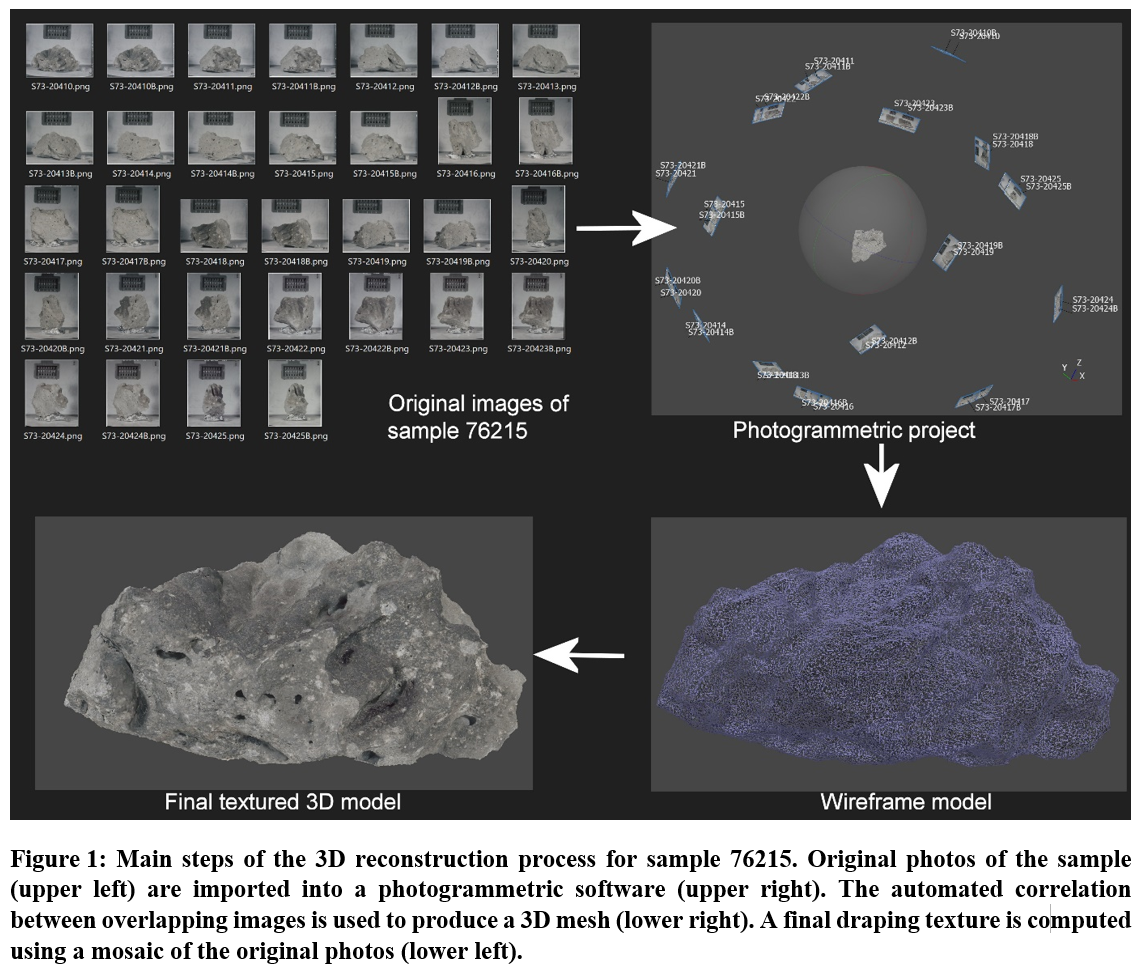
We have posted the 3D models of these samples on the Sketchfab web platform at https://sketchfab.com/LPG-3D to allow their easy visual inspection. These 3D models are of particular interest as these lunar samples have been broken into multiple pieces after being photographed. The 3D numerical model can therefore be thought as a kind of historical heritage of the original rocks, which do not exist anymore in their original form. Using this reconstruction, we can obtain a copy of the shape of these original rocks using a 3D-Printer (Fig. 2). They can also be viewed using augmented reality, with a cellphone or a tablet, or even manipulated in virtual reality on Sketchfab using a VR headset (Fig 2). From a more scientific point of view, the 3D models theoretically allow to replace the samples in their original position and orientation directly on the 3D models of the original boulders themselves (Fig 3). This is of particular interest to retrieve the precise original orientation of the sample, to investigate for example the characteristics of coatings. On sample 76015, at least three different units show various degree of alteration, which can be correlated with the original position of the sample with respect to its environment. The upper sky-facing side is the most affected by space weathering effects, with a well-developed patina. On its lower edge, a less altered face protected by a crevice might correspond to a lower alteration degree developed during only 20 million years, the approximate age of the impact generating the fall of the boulders from the North Massif slopes according to radiogenic dating.
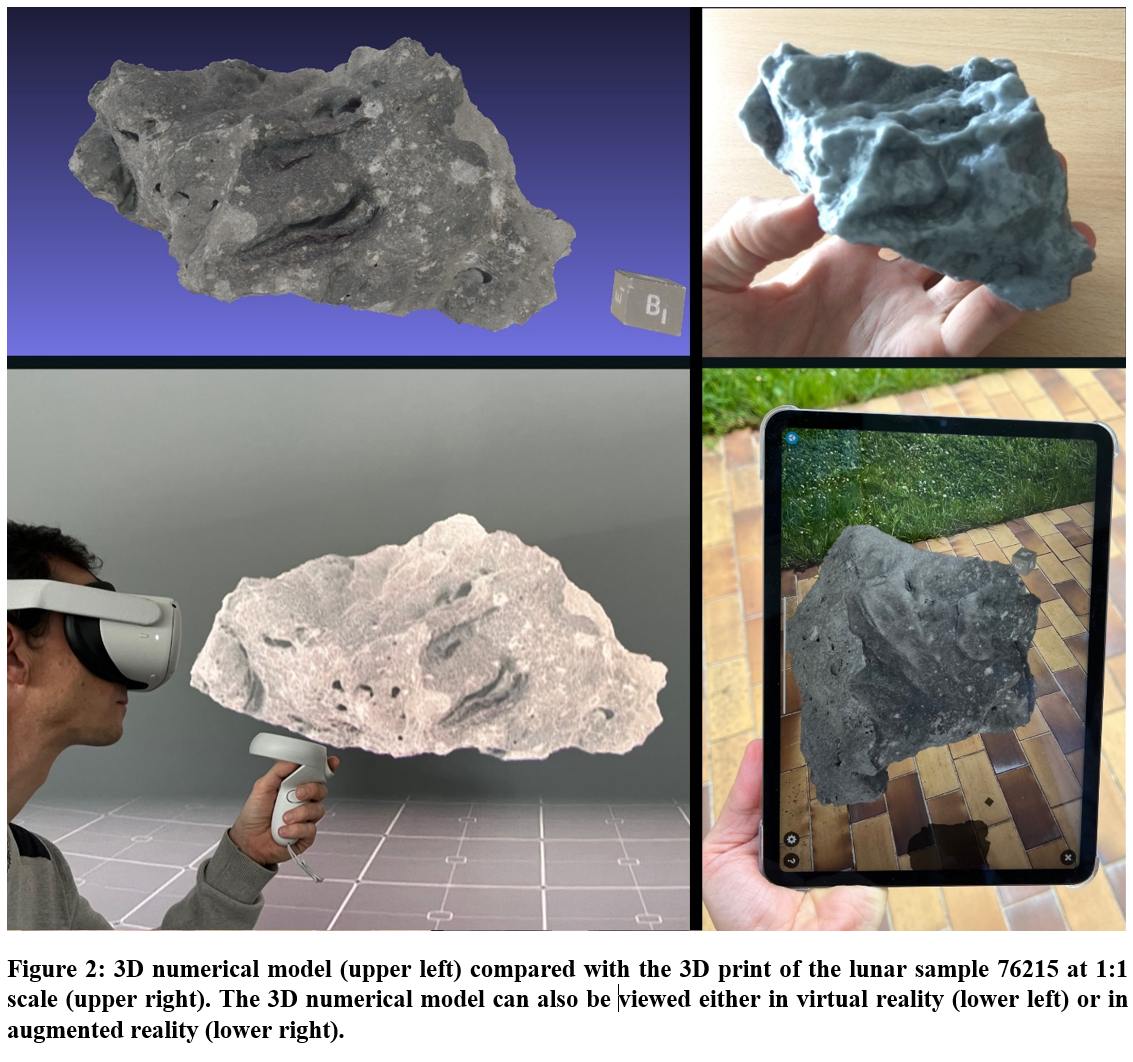
References :
[1] Wolfe, E.W. et al. Geologic investigation of the Taurus-Littrow Valley: Apollo 17 landing site. U.S. Geol. Survey. Prof. Pap. 1981, 1080, 225–280., 1981
[2] Schmitt, H.H. et al., Revisiting the field geology of Taurus-Littrow. Icarus 2017, 298, 2–33, doi:10.1016/j.icarus.2016.11.042, 2017.
[3] Spudis, P. D., and G. Ryder, Apollo 17 impact melts and their relation to the Serenitatis basin, Proc. Lunar Planet. Sci. Conf., 12th, 133–148, 1981.
[4] Hurwitz and Kring, Identifying the geologic context of Apollo 17 impact melt breccias, Earth and Planetary Science Letters, 436, 64–70, 2016.
[5] Le Mouélic, S. et al. Investigating Lunar Boulders at the Apollo 17 Landing Site Using Photogrammetry and Virtual Reality, Remote Sensing, 12 (11), DOI: 10.3390/rs12111900, 2020.
[6] Favalli, M. et al., Multiview 3D reconstruction in geosciences. Comput. Geosci. 2012, 44, 168–176, 2012.
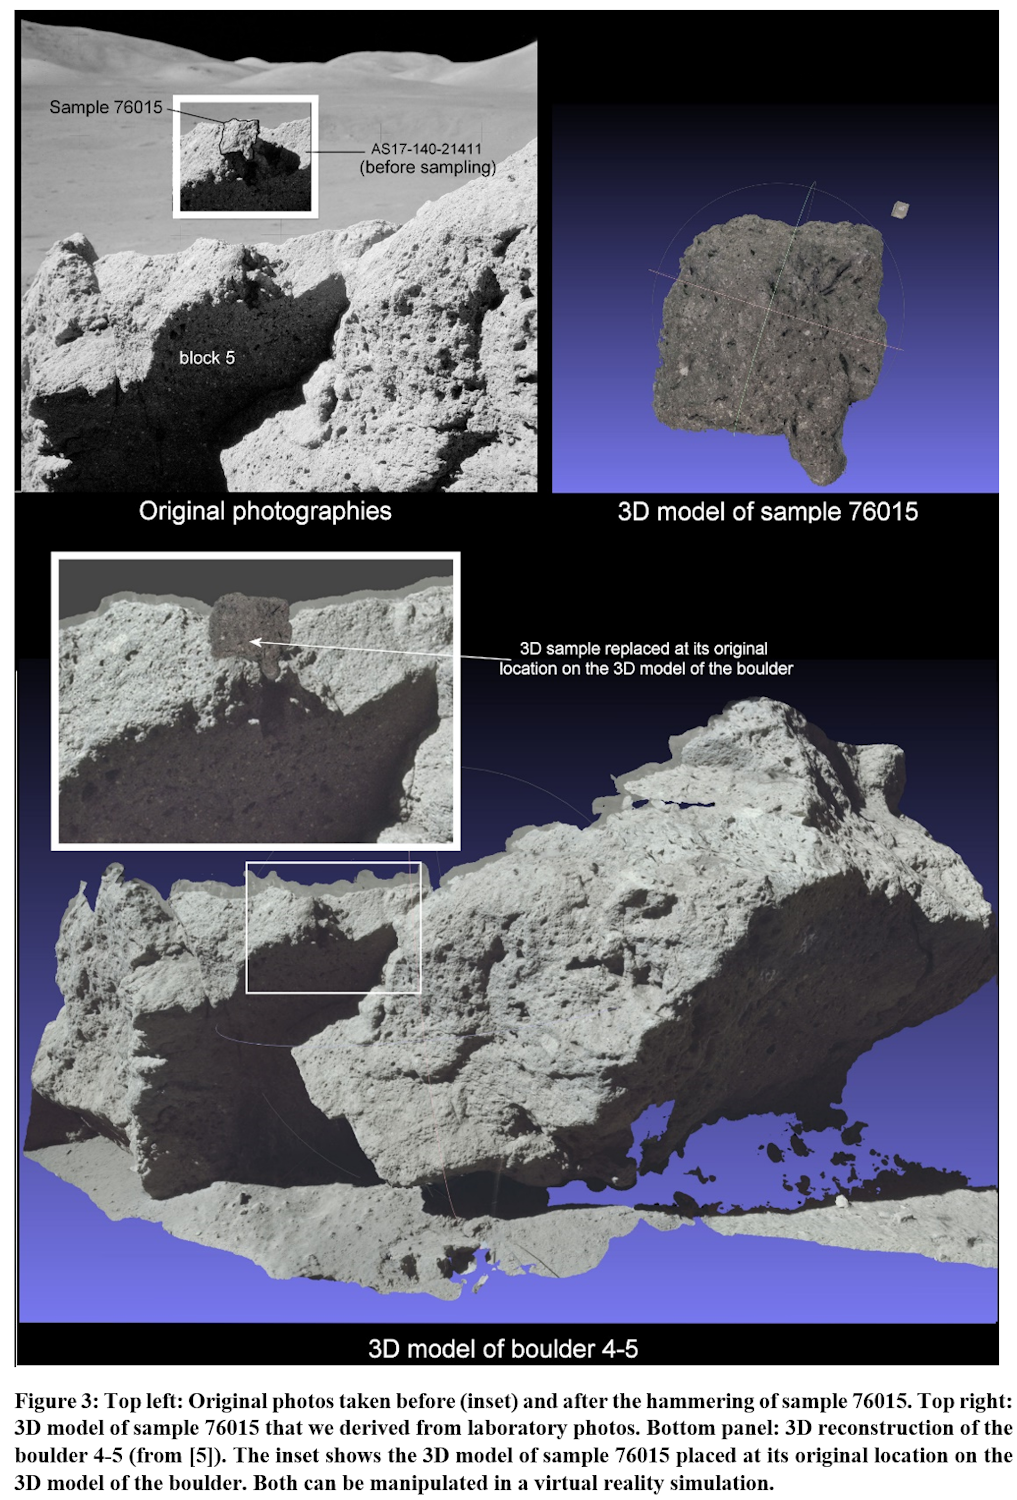
How to cite: Le Mouélic, S., Macquet, L., Schmitt, H., Mangold, N., Caravaca, G., Seignovert, B., and Le Menn, E.: 3D reconstruction of lunar rock samples collected at North Massif Station 6 during the Apollo 17 mission , Europlanet Science Congress 2022, Granada, Spain, 18–23 Sep 2022, EPSC2022-348, https://doi.org/10.5194/epsc2022-348, 2022.
Introduction:
Subsidence or collapse craters, also called pit craters, can be found on the Moon and throughout the Solar System, including our planet. These depressions in the terrain are not formed by the impact of any projectile but rather by the collapse of the soil over a void, usually creating circular-shaped hollows. There are several formations causes, such as the collapse of the roof of underground lava tubes or dikes [1]; collapsed magmatic chambers under loose material; tectonic movements produced by faults; or caused by the presence of water or ice in the subsurface [e.g., 2].
Similar to how lava tube pits are formed on the Earth, on the Moon, these features could be the entrance to underground caves formed when lava ceilings are not resistant enough to support their weight and collapse [3, 4]. Some of them could even be interconnected if their origin is the same volcanic tube through which lava flowed in the past. Consequently, planetary pit craters and potential subsurface caves are promising astrobiological regions due to their properties to preserve their own microclimate [5], the shielding they offer against radiation (below or at 6 meters depth) [6] and the protection they offer against harsh surface conditions. There is also direct evidence found of surface exposed water ice in the lunar polar regions [7] and in simple craters [8], so they could have water ice reservoirs inside or near them. Caves have been described as possible first human settlements on the Moon and Mars, offering a permanent and safe refuge for astronauts and equipment storage [9]. On top of that, the protection that is providing this natural shelter offers an additional interest: an intact lava tube in pristine conditions gives us a lot of useful information to better understand the geological history of the Moon.
The aim of this study is to define a list of the best pit craters, suitable for establishing an exploration lunar base, so that future missions to the Moon can benefit from this information.
Methodology:
We analyze a catalogue of 278 pit craters from the atlas obtained thanks to NASA's Lunar Reconnaissance Orbiter mission to detail their possible habitability, giving priority to the potential lava tube candidates found [10, 11], and considering the following points of view: morphological characteristics; the proximity of each other’s and its possible internal connections; associations with various geological structures (such as lobate scarps, wrinkle ridges, maria or impact craters); their possible origin; geological materials and their proximity to areas abundant in resources ISRU (water ice, REE or other materials); their proximity to areas more suitable for landing on the Moon; proximity to current and future human and robotic missions.
We mapped and located the best candidates by overlaying current pit crater locations from the LROC atlas to different global and regional lunar datasets such as the global geologic map of the Moon (USGS, [12]), in order to obtain the information on the different regions on the moon and their properties (material type and age); the Kaguya (SELENE) mission maps, covering latitudes from -60° to 60°; and the north and south pole LOLA LRO lunar maps, that provide the information on the elevation profile. A wrinkle ridges layer is also added to find some clues about how the pit craters in an area might be connected and how large the subsurface caves would be.
To analyze each of the pit craters a python library is developed, extending the capabilities of the python QGIS modules and its main objective is to relate the pit craters with their origin, according to the region where they are located, their morphological properties and their relative location to nearby pit craters or resources as water ice or regolith.
Summary and future work:
Python library will have as a primary output an ordered list of the best candidates for pit craters to establish a human lunar base. Further on, our observations and individual selection of the most potentially suitable pits can be analyzed in depth using the gravitational field of the Moon or by checking LRS radar data (SELENE mission).
Acknowledgement:
LMP acknowledges support from the Margarita Salas UCM postdoctoral grants funded by the Spanish Ministry of Universities with European Union funds - NextGenerationEU.
References:
[1]: Favre, G. (1993), Proceedings of the 3rd International Symposium on Vulcanospeleology, 37–41; [2] Boston, P. J. (2004), Encyclopedia of Caves and Karst Science, 355–358; [3]: Hong, I-S., et. al. (2014), J. Astron. Space Sci. 31(2), 131-140; [4]: Okubo, C. H., and Martel, S.J., (1998). J. of Volcanology and Geothermal Research 86, 1–18; [5]: Phillips-Lander, C., et al. (2020) MACIE Decadal Survey white paper; [6]: De Angelis G, et al. (2002). LPSCXXXIII; [7]: Li, S., et al. (2018). PNAS, 115 (36) 8907-8912; [8]: Rubanenko, L., et al. (2019) Nat. Geosci. 12, 597-601; [9] Titus, T.N., et al. (2021), Nat Astron 5, 524-525; [10]: Coombs C.R., et al. (1992) 2nd Lunar Bases and Space Activities of the 21st Century, 1, 219-229; [11] Wagner, R.V. and Robinson, M. S. (2021) 51th LPSC, #2530; [12]: Fortezzo, C.M., et al. (2020) 51st LPSC, #2760
How to cite: López-Martínez, G. and Parro, L. M.: Are pit craters habitable? Geological analysis and description of their structural potential as lunar bases., Europlanet Science Congress 2022, Granada, Spain, 18–23 Sep 2022, EPSC2022-604, https://doi.org/10.5194/epsc2022-604, 2022.
Introduction: Electrons emitted from the lunar surface include photoelectrons, cold secondary electrons, and backscattered electrons, all of which contribute to the surface-charging environment. Among these electron populations, secondary electrons have been well characterized by previous studies but not so much for the other two populations that make up the high-energy tail. Recently, we reported of oxygen Auger electron observations at the Moon by the ARTEMIS (Acceleration, Reconnection, Turbulence, and Electrodynamics of the Moon's Interaction with the Sun) spacecraft, which provides a unique feature to identify photoelectrons emitted from the lunar surface. This Auger feature allows for the creation of empirical templates for photoelectrons and backscattered electrons to disentangle these two populations and examine their characteristics separately.
Methodology: By utilizing the Auger electron feature, we identify cases that are separately dominated by either photoelectrons or pure backscattered electrons and then create energy spectral templates for each population, when the Moon is immersed in the solar wind. With such templates, we then fit the total measured electron spectrum from the lunar surface as observed by ARTEMIS from mid-2012 to the end of 2020 and determine the relative contributions of the two populations.
Results: For photoelectrons, we find that (1) Auger electron fluxes are correlated with solar X-ray photon fluxes as expected; and, (2) there is a dawn-dusk asymmetry in Auger electron fluxes, caused by a selection bias as downward electrons are mainly halo electron on the dusk side, lower in flux than strahl electrons on the dawn side. For backscattered electrons, we find the backscattering ratio (the flux ratio of backscattered electrons and downward electrons at the same energy) varies geographically due to different proportions of surface backscattered electrons and non-adiabatic magnetic scattering by crustal magnetic fields. In addition, for surface backscattering, the backscattering ratio decreases with increasing energies, ranging from <20% at 50 eV to <10% at 500 eV. Lastly, comparing the two populations, within the solar wind, backscattered electron fluxes are mostly higher than photoelectron fluxes and, thus, photoelectrons are not so frequently observed when the Moon is in the solar wind.
How to cite: Xu, S., Poppe, A., Szabo, P., Harada, Y., Halekas, J., and Chamberlin, P.: Characteristics of Lunar Photoelectrons and Backscattered Electrons, Europlanet Science Congress 2022, Granada, Spain, 18–23 Sep 2022, EPSC2022-725, https://doi.org/10.5194/epsc2022-725, 2022.
Abstract
Mobile robotic surface platforms are critical for the exploration of the solar system. In the past, robotic ex-
plorers were limited by their abilities to navigate and traverse challenging terrain, such as boulder fields and
slopes steeper than 15°. The ESA topical team ’LEAP’ studies the feasibility of using an innovative loco-
motion system - a dynamically walking quadrupedal robot - to address challenging terrain and unlock hard-
to-reach, but high-reward scientific targets. Here, we present preliminary results of this assessment, includ-
ing 1) the selection of several promising science targets that are inaccessible by traditional means, 2) our
robotic platform, 3) a provisional payload suite that can address relevant science questions, and 4) sugges-
tions for future hard- and software developments.
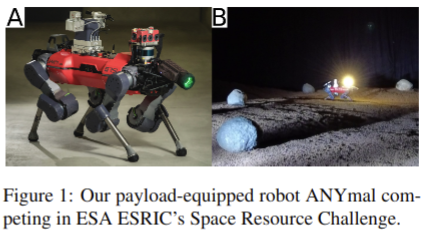
Plain Language Summary
Geologically interesting sites, such as outcrops, slopes, and caves, are often difficult to access. The
ESA Topical team ’LEAP’ studies the feasibility of using an innovative locomotion platform - a legged
robot - to access such sites, potentially enabling unprecedented sampling and science opportunities. In
this work, we present our preliminary findings.
1. Mission scenario
Triggered by ESA’s call for ideas(https://tinyurl.com/mrxn8f5u) on exploring the Moon with a large European lander (L3), we have
formed a topical team to assess the potential of an innovative robotic platform to provide access to
high-risk & high-reward targets on the moon(Fig. 1). ’LEAP’ (Legged Exploration of the
Aristarchus Plateau) is considering science targets on the Aristarchus plateau (AP).
AP is a geologically uniquely diverse region that hosts one of the highest
concentrations of volcanic features - including an irregular mare patch (IMP) and widespread evidence
for multiphased volcanism (Glotch et al., 2020). While our analysis of the plateau and the literature is
currently ongoing, we identified four geologic targets that appear to be inaccessible by traditional surface
assets, but could potentially enable transformational science: #1 the flank and peak of Herodotus Mons, #2
pits in Aristarchus’ IMP, #3 skylights and fractured terrain around Aristarchus crater’s central peak, and
#4 the bright outcrops at Cobra Head (Fig. 2a). The identified targets enable the study of a large
number of highly relevant science objectives, including many of ESA’s priority goals, such as: A) the
analysis of new and diverse (silicic, basaltic, and other) samples, B) the detection & characterization
of volatiles, C) deployment of geophysical instruments, D) the characterization of the lunar dust envi-
ronment, while E) demonstrating unprecedented surface mobility (ESA, 2019). Sites could be traversed
by one or multiple quadruped robots within one lunar day, starting from, for example, ESA’s L3(https://tinyurl.com/2p8vfd9n).

Legged locomotion systems are ideal to navigate difficult terrain on Mars or the Moon. They are less
likely to get stuck in loose regolith and can traverse slopes up to 25° or steeper, including large rocks
and other obstacles. LEAP uses the quadrupedal robot ANYmal (Hutter et al., 2017). ANYmal can
adapt its walking mode to different environmental conditions. These modes range from energy-efficient,
over traversing, to stabilized walking. The latter allows to satisfy measurement requirements of the
instruments. The traversing mode allows for 0.5 m/s to cross low-risk & low-interest areas efficiently.
ANYmal can use its limbs to manipulate the environment, including trenching and scraping. ANYmal’s
locomotion system proved its reliability in dusty environments as the joints need to only allow rotations of
up to 270° and are sealed against dust. The robot can recover and get back on its feet from any position and
is able to fall back to three- or even two-legged walking if one or two legs fail.
3. Instrumentation
The initial design has a payload mass budget of 15 kg and provides between 15 W to 100 W of
power, depending on the current thermal loads. For the (autonomous) operation of the robot, two baseline
instruments are used: lidars and cameras, which provide 3D information for navigation.
robot, such as a ground-penetrating radar, a gravimeter, neutron or mass spectrometers or a
sampling arm, & VIS/NIR/UV imager, and a Raman spectrometer. The current list of pay-
loads allows the robot to address a wide range of science questions related to geomorphology, mineralogy,
and petrography. We are currently refining the selection of payloads.
agreement 4000135310/21/NL/PA/pt.
How to cite: Bambach, P., Bickel, V., Kolvenbach, H., Valsecchi, G., Steininger, H., Eaton, N., Hiesinger, H., and Patel, M.: LEAP - Legged Exploration of the Aristarchus Plateau, Europlanet Science Congress 2022, Granada, Spain, 18–23 Sep 2022, EPSC2022-856, https://doi.org/10.5194/epsc2022-856, 2022.
Introduction
Lunar robotic and human exploration efforts are ramping up, as exemplified by ongoing studies and missions from different space agencies, such as NASA and ESA with the Artemis program (e.g. NASA, 2020). In this scenario, the identification of potential resource deposits is of primary importance for the future exploration of planetary bodies (e.g. Lewis et al., 1993; van der Bogert et al., 2021). One of the most important deposits on Earth, but not well studied outside our planet, are the intrusive igneous processes and their derivative features. This work is the first step in ongoing research to evaluate the potential of this kind of geological setting on the Moon. We conducted a detailed analysis of an intrusive complex named Valentine Domes.
The Valentien Domes are located at the west margin of the Serenitatis Basin (30.69° N, 10.20° E). According to Wöhler and Lena (2009), they consist of two different edifices, a small one to the north and a big asymmetric dome 70 km wide to the south. The same authors identified a large fault at the east side of the bigger edifice, indicating that it originated as a laccolith (Schmiedel et al., 2017).
Data
In order to conduct the geomorphological and tectonic interpretation of the zone, we collected and processed 23 images taken by the Narrow-Angle Camera (NAC) onboard the Lunar Reconnaissance Orbiter (LRO). A high-resolution stereo-derived DEM was also generated using the Ames Stereo Pipeline (ASP)(Beyer et al., 2022). We also used some basemaps of the Moon, such as a global visible mosaic made with takes from the Wide Angle Camera (WAC), and a digital elevation model (DEM) derived from the Kaguya mission.
We coupled the prior analysis with mineralogical information derived from two hyperspectral cubes taken by the Moon Mineralogy Mapper (M3), onboard Chandrayann-1.
Results
Figure 1 shows the geomorphological map of the zone.
The area is dominated by lava flood plains that show variations in their albedo. Darker lavas accumulated close to the rim of the basin, while in the centre of the Serenitatis and Imbrium basins the lavas have a lighter tone. The two domic features identified by Wöhler and Lena (2009) lie close to the rim of the basin, but we identified what looks to be a third dome to the south of the principal structure. This newly identified dome has a maximum altitude of 90 meters and it steeps gently to the surroundings. No faulting is visible near the dome, which leads us to classify it as a domed laccolith (Schmiedel et al., 2017).
The uplands located on the rim of the Serenitatis Basin can be divided into Hilly materials (Him) and more dissected Hummocky materials (Hum). These materials at a first glance appear similar to a handful of small mounds located inside and around the Valentine Domes, this led Lena et al. (2018) to describe these features as kipukas from the floor of the basin. From the analysis using data from M3, we found that there is an apparent difference in composition between these mounds and the Him and Hum units. The units of the rim seem to have a major amount of plagioclase, which could point to a genetic difference between them and the mounds inside de domes. Thus, we mapped these features as different units: Secondary domes (Sd) and Secondary linear features (Slf).
We identified linear rilles crossing the main structure dome and the newly discovered dome. These lineations cross both domes almost by their centre, and in the case of the main dome, the rile is weakly aligned with the secondary domes inside it.
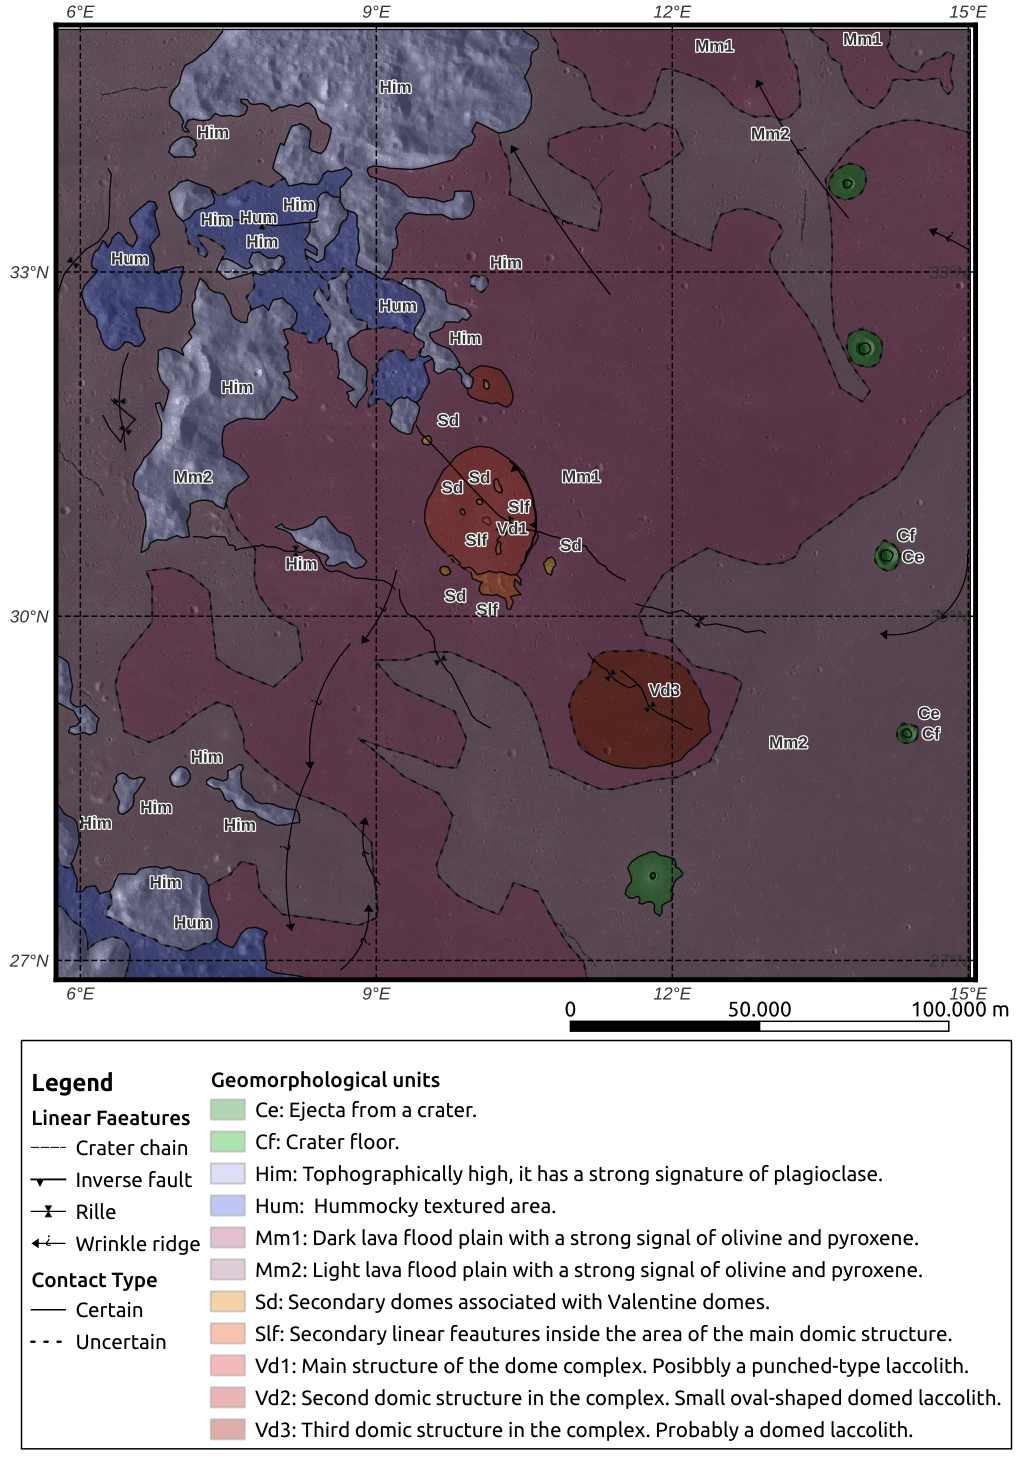
Figure 1: Geomorphological map of the Valentine Domes and northwest Serenitatis Basin.
Discussion and conclusions
The discovery of a new dome south of the principal structure could imply that the Valentine Domes complex is more intricate than previously thought. This is supported by the presence of linear riles crossing the domes, which according to Head and Wilson (1992), points to the existence of stagnated dykes not far beneath the surface. The secondary domes and the thrust fault cutting the main structure are hints that plutonic rocks could be located on the surface, alongside useful mineralizations.
Acknowledgments
This project has received funding from the European Union’s Horizon 2020 research and innovation program under grant agreement No 101004214.
How to cite: Suarez Valencia, J. E. and Pio Rossi, A.: Geomorphologic mapping of the Valentine Domes in the Moon, intrusive domes, and their mineral resource potential, Europlanet Science Congress 2022, Granada, Spain, 18–23 Sep 2022, EPSC2022-923, https://doi.org/10.5194/epsc2022-923, 2022.
EXPLORE Horizon 2020 Research & Innovation project:
The project’s main goal is to develop and grant access to six scientific data applications (SDAs) that facilitate the exploitation of data from planetary space & astrophysics missions. Within the six EXPLORE’s SDAs, L-Explo and L-Hex provide access to a selection of higher-level data from existing Lunar orbital and in-situ missions. Users can access all SDAs on the EXPLORE platform, https://explore-platform.eu [1].
L-Explo and L-Hex objectives:
Both SDAs share the common aim of retrieving meaningful information for surface characterization, geologic mapping, resource evaluation, and mission planning purposes. Specific aims comprise the discovery of possible new targets of interest, landing-site characterization, and traverse engineering.
Processing pipelines:
We have developed several processing pipelines (coded in python) that are shared across the lunar SDAs and include band composition, spectral profile plots, spectral indexes generation, and vectorial data visualization. Additional specific and advanced processing capabilities are under development and notably include Machine Learning pipelines for automated data analysis and features extraction. To improve and broaden the scope of these pipelines, we are working with the planetary community, through the Europlanet GMAP (Geologic MApping of Planetary bodies) collaboration [2], to test and improve our services and tools.
System architecture:
Since the objectives of both SDAs share many elements, they are designed with a common robust backend-frontend architecture.
The frontend provides a unified interface, based on a customized TerriaJS web framework [3], as shown in Figure 1.
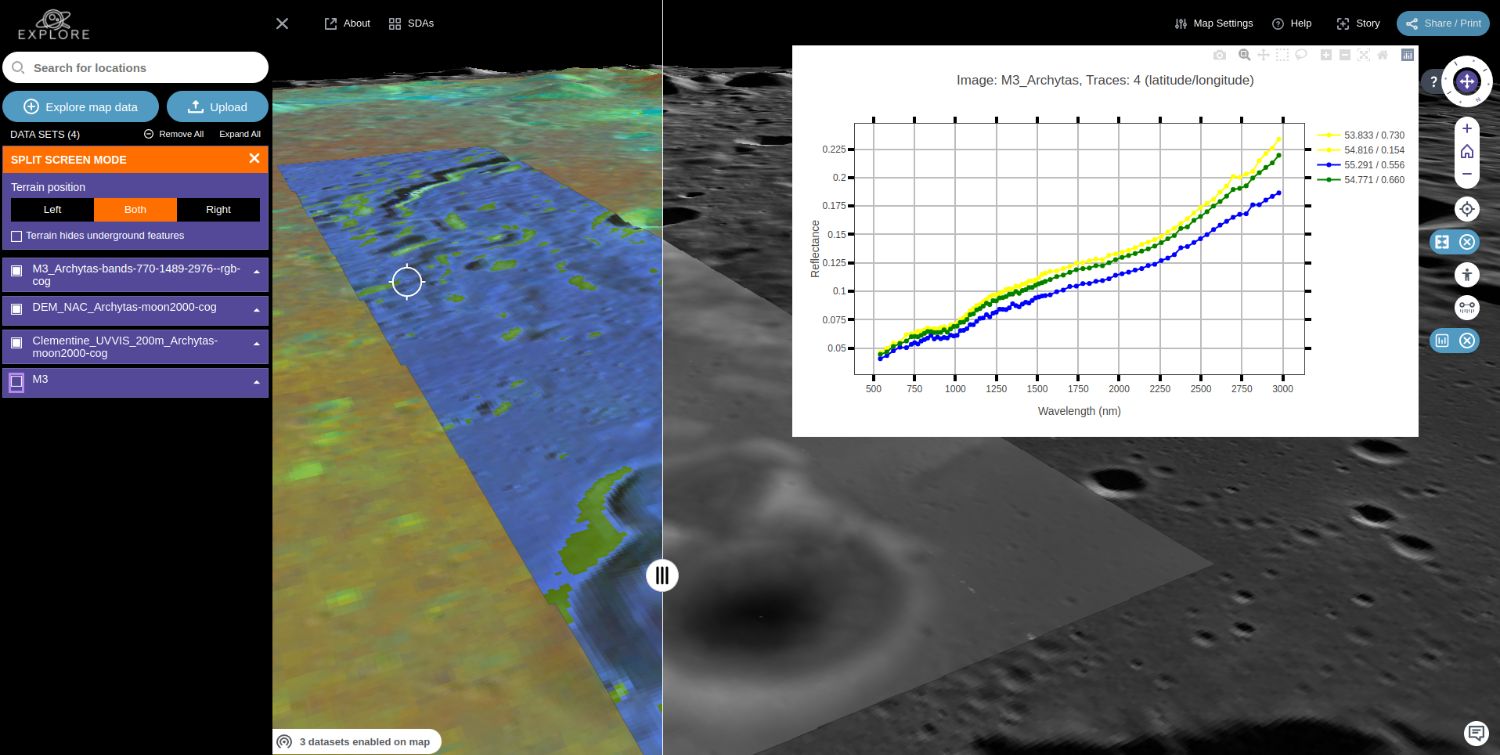
Figure 1. Example of the frontend showing multiple spectral datasets, a Digital Elevation Model, and visible imagery using split-screen functionality. An example plot of sampled spectral profiles is also shown.
This interface grants a fluid workflow between L-Explo and L-Hex including also split-screen and pedestrian visualizations. The frontend performs on-the-fly most of the pipelines, such as the interactive plot of spectral signatures by querying the data through the backend.
The backend comprises dockerized instances of Geoserver [4] to publish data and FastAPI [5] to perform all the processing tasks.
Data:
Each SDAs have access mostly to the same higher-level data, derived from public data archives [6], processed using the pipelines, and ingested in the backend.
Conclusion:
L-Explo and L-Hex are novel web-services, that are complementary to similar services offer access to higher data products, custom processing pipelines in a lightweight and user-friendly 2/2.5/3D environment. More advanced features, including community-driven features, are under development.
References:
[1] N. L. J. Cox et al. (2022), EXPLORE – Innovative Scientific Data Exploration and Exploitation Applications for Space Sciences – The lunar case, 6th Planetary Science Informatics and Data Analytics Conference 2022.
[2] A. Nass et al. (2021), GMAP: European Mapping efforts for Geologic Mapping of Planetary bodies, EPSC Abstracts Vol. 15, EPSC2021-383, 2021 European Planetary Science Congress 2021.
[3] Terria (2022), TerriaJS, https://terria.io
[4] A. Aime et al., (2022), Geoserver, 10.5281/zenodo.6456605
[5] S. Ramírez (2022), tiangolo/fastapi, https://fastapi.tiangolo.com/
[6] PDS Geosciences Nodes (2022), Lunar Orbiter Data Explorer, https://ode.rsl.wustl.edu/moon/index.aspx
Fundings: This project has received funding from the European Union’s Horizon 2020 research and innovation programme under grant agreement No 101004214.
How to cite: Nodjoumi, G., Valencia, J. E. S., Brandt, C., Cox, N. L. J., and Rossi, A. P.: EXPLORE Lunar Scientific Data Applications: L-Explo and L-Hex, Europlanet Science Congress 2022, Granada, Spain, 18–23 Sep 2022, EPSC2022-966, https://doi.org/10.5194/epsc2022-966, 2022.
The return to the Moon pushed forward by space agencies as well as private companies around the world, has rekindled interest in the Lunar dust environment, which was identified as a major factor in spacecraft safety and reliability considerations during the Apollo missions. Orbiting the Moon from 2013 to 2014, the Lunar Atmosphere and Dust Environment Explorer (LADEE) gathered conclusive evidence for the existence of a permanent, asymmetric dust cloud around the Moon [1]. Micron-sized ejecta particles generated at impact of interplanetary meteoroids on the Lunar surface act as the main source of this high-altitude dust exosphere, which shows a variable density in dependence of annual meteoroid showers.
Here we report on the development of a dynamic model for the lunar ejecta dust cloud. This model simulates cloud particles in a Monte-Carlo fashion, drawing on a combination of existing engineering models and results from hypervelocity impact experiments as model inputs: To emulate the influx of meteoroids we use the Interplanetary Meteoroid Environment Model 2 (IMEM2) [2], developed under ESA contract, as well as a comet stream model based on meteor shower zenith-hourly-rates [3, 4]. To determine angular, velocity, and size distributions of ejecta particles, we resort to three different methods: (1) We use the software Ansys Autodyn to numerically model ejecta particles generated at hypervelocity impacts. (2) Impact experiments with a light-gas gun have been conducted at the Harbin Institute of Technology, to derive ejecta distributions generated by bigger projectiles. (3) We intend to conduct hypervelocity impact experiments with lunar soil simulant at the electrostatic dust-accelerator facility at the University of Stuttgart. The novel experiment set-up, which uses a delay-line-detector to measure micron-sized ejecta particles has recently been verified [5]. Ultimately, the simulated dust ejecta cloud will be fitted to LADEE/LDEX data. This poster-presentation gives an overview of the project and its various modules.
References:
[1] Horányi, M., et al. "A permanent, asymmetric dust cloud around the Moon." Nature 522.7556 (2015): 324-326.
[2] Soja, R. H., et al. "IMEM2: a meteoroid environment model for the inner solar system." Astronomy & Astrophysics 628 (2019): A109.
[3] Jenniskens, Peter. "Meteor stream activity I. The annual streams." Astronomy and Astrophysics 287 (1994): 990-1013.
[4] McBride, Neil. "The importance of the annual meteoroid streams to spacecraft and their detectors." Advances in Space Research 20.8 (1997): 1513-1516.
[5] Li, Yanwei, et al. "Measurement of fragments generated by hypervelocity impacts of micron-sized iron particles at grazing incidents." Advances in Space Research 69.6 (2022): 2629-2635.
How to cite: Sommer, M., Li, Y., Srama, R., Strub, P., Yang, J., and Li, X.: A Dynamic Model for the Lunar Ejecta Dust Cloud, Europlanet Science Congress 2022, Granada, Spain, 18–23 Sep 2022, EPSC2022-985, https://doi.org/10.5194/epsc2022-985, 2022.
- Introduction
When solar wind hits the lunar surface, a fraction of it is reflected back from the Moon instead of being absorbed by its surface. Evidence of neutral hydrogen atoms [1] and solar wind protons [2] being reflected from the surface are provided by numerous studies; however, no measurements of negative ions have been done so far. It is unknown whether or not a significant negative ion population exists near the lunar surface. The Negative Ions at the Lunar Surface (NILS) instrument, the first-ever dedicated negative ion instrument flown beyond the Earth, will address this question. NILS is being developed at the Swedish Institute for Space Physics for the Chinese Chang’E-6 sample return mission. Chang’E-6 is expected to launch in 2024 and will soft-land on the lunar far-side at approximately 41°S and 180°E. NILS will operate at least 30 minutes after the landing to achieve its main science objective. NILS operations will end with the lift-off of the sample return module.
- Main science objective
Negative ions are a not yet observed plasma component at the Moon. NILS’s main objective is to detect negative ions emitted from the lunar surface as a result of the interaction with solar wind and establish the upper limits for their fluxes. That requires NILS to distinguish and resolve the energy distributions of scattered H- and sputtered lunar negative ions, as well as to coarsely resolve different mass groups. The overarching scientific question is to estimate the importance of negative ions for space-surface interactions and environments of planetary bodies with surface-bound exospheres.
- Instrument design
NILS is the 9th generation of the SWIM family [3], a series of compact, adaptive, and capable mass spectrometers analysing ions, electrons or energetic neutral atoms at the sub-keV energy range. NILS combines a compact electrostatic analyser and a time-of-flight cell to measure the energy per charge and the mass per charge of incident ions. An additional deflection system consisting of two cylindrical electrodes allows for a one-dimensional 160° scanning of the viewing direction. NILS instantaneously records negative ions and electrons from a single direction and requires electrostatic scanning to change the viewing direction. Negative ions and electrons can be separated by an electron suppression system placed between the deflection system and the first-order focusing 127° long cylindrical electrostatic analyser. The latter is equipped with micro serrations on the outer electrode to maximize suppression of UV photons and scattered particles.
Prior to entering the time-of-flight cell, ions are post-accelerated by a -400V potential improving the sensor detection efficiency. The time-of-flight start signal is generated by a channel electron multiplier, which detects the secondary electrons generated when that particle is interacting at grazing incidence with a tungsten single crystal start surface. After the reflection on the tungsten surface, the particle travels to a stop surface, where a second secondary electron is generated that then subsequently is detected by a second channel electron multiplier, providing the time-of-flight stop signal. The time difference between the start and stop signals combined with the energy setting of the electrostatic analyser allows determining the mass per charge of the particle.
- References
[1] M. Wieser, S. Barabash, Y. Futaana, M. Holmström, A. Bhardwaj, R. Sridharan, M. B. Dhanya, A. Schaufelberger, P. Wurz, and K. Asamura. First observation of a mini-magnetosphere above a lunar magnetic anomaly using energetic neutral atoms. Geophys. Res. Lett., 37(5), 03 2010.
[2] Y. Saito, S. Yokota, T. Tanaka, K. Asamura, M. N. Nishino, M. Fujimoto, H. Tsunakawa, H. Shibuya, M. Matsushima, H. Shimizu, F. Takahashi, T. Mukai, and T. Terasawa. Solar wind proton reflection at the lunar surface: Low energy ion measurement by map-pace onboard selene (kaguya). Geophys. Res. Lett., 35, 12 2008.
[3] M. Wieser and S. Barabash. A family for miniature, easily reconfigurable particle sensors for space plasma measurements. Journal of Geophysical Research: Space Physics, 2016
How to cite: Canu-Blot, R., Wieser, M., and Barabash, S.: The Negative Ions at the Lunar Surface (NILS): first dedicated negative ion instrument on the Chang’E-6 mission to the Moon., Europlanet Science Congress 2022, Granada, Spain, 18–23 Sep 2022, EPSC2022-992, https://doi.org/10.5194/epsc2022-992, 2022.
Introduction: Starting in 2019, the Apollo Next Generation Sample Analysis (ANGSA) Program has enabled consortium studies of specially curated Apollo samples that were previously unstudied (or under studied). This program was intended as a participating scientist program for these Apollo samples, as well as a preparation for upcoming lunar sample return missions (e.g., Artemis). The work began with studies of unsealed core tube 73002 [1,2] that is the upper ~35 cm of an Apollo 17 double drive tube (~70 cm total depth) collected on the landslide deposit near Lara Crater at Station 3 in the Taurus Littrow Valley. More recently the program extended to the study of a variety of frozen Apollo 17 samples [3], as well as the gas extraction [4] and dissection [5] of 73001, the lower half of the station 3 double drive tube. Sample 73001 was sealed under vacuum on the Moon in a Core Sample Vacuum Container (CSVC). In this abstract we will examine the role of X-ray Computed Tomography (XCT) during the preliminary examination process for sealed core 73001, including: (1) engineering scans to aid in understanding the gas extraction process, (2) whole-core scanning prior to opening to inform extrusion and dissection work, and (3) individual particle scanning to characterize rock fragment lithologies for follow on studies.
Methodology: Sample 73001 is a 33 cm long, 4 cm diameter regolith sample collected inside a lunar drive tube (~1 mm aluminum walls). That drive tube was sealed inside a 0.5 mm thick stainless steel (SS) CSVC. XCT scans for engineering purposes were done on the Nikon XTH 320 system at Johnson Space Center using the 225 kV multi-metal reflection source at 215 kV, 179 mA, and a 38.49 mm voxel size. Individual >4 mm particles separated from the core during processing (then triply sealed in Teflon bags) were also scanned at JSC using the 180 kV source at 90 kV, 33 mA, and a 2.98 – 10.65 mm voxel size. Whole-core scans were done at the University of Texas High-Resolution X-ray Computed Tomography Facility (UTCT) on the 225 kV reflection source on the North Star Imaging cabinet XCT system. These scans included: (1) a series of 9 overlapping super-resolution scans each covering a ~4 cm length of the tube at 190 kV, 180 µA, and a 12.9 µm voxel size and (2) a lower resolution continuous helical scan of the entire core at 190 kV, 180 µA, and a 51.8 µm voxel size.
Progress and Results: Before piercing and extracting the gas from sample 73001, an XCT scan of the bottom portion of the CSVC was used to confirm the location of the Teflon cap on the inner drive tube and whether there was an “air” gap between the Teflon cap and the CSVC. This was to ensure the Teflon cap (which immobilized the soil inside the drive tube) was not accidentally pierced during gas extraction. Similarly, after piercing, the bottom and top portions of the CSVC were scanned in order to capture engineering knowledge about the results of the piercing process, as well as the metal knife edge vacuum seal (SS into an In-Ag alloy). Both scans will provide constraints on future work of this type, both for the design of tools used on the lunar surface during Artemis, as well as how we open future samples of this type. An unexpected finding from these engineering scans was that the device in the drive tube that immobilizes the regolith (the keeper) was not seated in the tube properly. This meant that (1) the drive tube could not be removed from the CSVC for the trip to UTCT, and (2) the procedure for opening and extruding the drive tube had to be modified. Had either of these things not been known prior to opening the CSVC, it could have led to an inability to XCT scan the whole core at high resolution and/or potential disruption of the core stratigraphy during extrusion. At UTCT, the entire length of the core was scanned at high resolution (12.9 microns per voxel). This scan serves multiple purposes: (1) A lower resolution (and uncorrected) version of these scans stitched together was used to help inform the processors of potential pitfalls during extrusion and dissection (voids, angular fragments at the edges of the sample, etc.); and (2) the full resolution corrected data will serve as the permanent in situ record of the stratigraphy of the sample and will enable future researchers to perform a variety of analyses. All 121 >4 mm particles separated during dissection pass 1 of sample 73001 have been individually scanned. These scans clearly show the lithology of each particle while keeping the particles in pristine condition (they are individually triply bagged in Teflon within our N2 purged processing cabinets). Because of the dust adhering to particle exteriors, it would otherwise be impossible to determine lithologies in a non-contaminating way. Thus far the types of lithologies seen in sample 73001 (e.g., regolith breccias, impact-melt breccias, agglutinates, and basalts) are similar to those previously identified in sample 73002 [2]. By the time of the meeting, all particles from all 3 dissection passes will have been scanned and statistics on the different lithologies in 73001 compiled.
References: [1] Shearer et al. (2020) 51stLPSC, abstract 1181. [2] Zeigler et al. (2020) 51stLPSC, abstract 3023. [3] Kent et al. (2022) This Volume. [4] McDonald et al. (2022) European Lunar Symposium. [5] Gross et al (2022) This volume.
How to cite: Zeigler, R., Eckley, S., Edey, D., Ketcham, R., Hanna, R., Gross, J., McCubbin, F., Shearer, C., and ANGSA Science Team, T.: X-Ray Computed Tomography of Apollo Drive Tube 73001 as Part of the Apollo Next Generation Sample Analysis Program, Europlanet Science Congress 2022, Granada, Spain, 18–23 Sep 2022, EPSC2022-1189, https://doi.org/10.5194/epsc2022-1189, 2022.
Please decide on your access
Please use the buttons below to download the presentation materials or to visit the external website where the presentation is linked. Regarding the external link, please note that Copernicus Meetings cannot accept any liability for the content and the website you will visit.
Forward to presentation link
You are going to open an external link to the presentation as indicated by the authors. Copernicus Meetings cannot accept any liability for the content and the website you will visit.
We are sorry, but presentations are only available for users who registered for the conference. Thank you.
Please decide on your access
Please use the buttons below to download the presentation materials or to visit the external website where the presentation is linked. Regarding the external link, please note that Copernicus Meetings cannot accept any liability for the content and the website you will visit.
Forward to session asset
You are going to open an external link to the asset as indicated by the session. Copernicus Meetings cannot accept any liability for the content and the website you will visit.
We are sorry, but presentations are only available for users who registered for the conference. Thank you.