
The N2 Production Rate in C/2016 R2 (PanSTARRS)
 1,1,3,
- 1Institut UTINAM UMR 6213 / CNRS, Univ. Bourgogne Franche-Comté, Besançon, France (sarah.anderson@univ-fcomte.fr)
- 2Institute for Astronomy, Univ. of Edinburgh, Royal Observatory, Edinburgh EH9 3HJ, UK
- 3STAR Institute, University of Liège, Allée du 6 Août 19c, 4000 Liège, Belgium
Introduction: Radio observations of long-period comet C/2016 R2 (PanSTARRS) revealed that it was remarkably depleted in water (Biver et al. 2018). The spectrum was instead dominated by bands of CO+ and N2+, rarely seen in such abundance in comets before (Cochran & Mckay 2018). Understanding the nature of this comet would allow us to investigate key features in the timeline of planetesimal formation.
By measuring the observed emission fluxes of the observed N2+ in C/2016 R2's spectrum, ionic ratios of N2+/CO+ in the coma were estimated to be between 0.06 (Cochran & Mckay. 2018), Opitom et al. 2019) and 0.08 (Biver et al. 2018). This would be the same ratio for N2/CO since ionization efficiencies of N2 and CO are similar at 1 au for quiet Sun (Huebner et al. 1992).
C/2016 R2 provides a unique opportunity to set a baseline for identifying N2 in cometary spectra. By using the Ultraviolet-Visual Echelle Spectrograph (UVES) mounted on the 8.2 m UT2 telescope of the European Southern Observatory Very Large Telescope (ESO VLT) observations, we can constrain the properties of N2 in the cometary coma and establish new Haser scalelengths in order to determine the N2 production rate, which we present here.
Observations: The observations of C/2016 R2 used in our work were collected on 2018 February 11, 13, and 14 with UVES. All observations were made when the comet was near its perihelion distance of 2.6 au, at 2.76 and 2.75 au. A full description of the observations and data reduction can be found in Opitom et al. (2019).
Methods: We aim to fit the observed flux with a Haser profile (Haser (1957)), providing an analytical solution to the column density of parent- and daughter-species in the coma along the line of sight. N2+ being an ion, the Haser model will be restricted to an area near the coma. The UVES slit covers ~6500 km on either side of the nucleus, a narrow region in which ions should be undisturbed by the solar wind.
CN scalelengths and Production Rate: We first fit a Haser profile on the CN emissions to ensure scalelengths can properly be determined from our data. We created a synthetic CN model evaluated by interpolation from a spectrum calculated by Zucconi (1985). This model is then convolved by the response of our instrument, with an FWHM of 0.06 Å. For each night of 11, 13, and 14 Feb, the CN lines are identified and summed along the spectroscopic slit. The total flux measured for CN over the entire spectrograph and averaged over the three nights of observation was 2.1x10⁻¹⁵ erg/s/cm2. The flux intensities are then averaged again over their cometocentric distances so as to allow for a proper fit of the Haser model.
By using a X2 test, we estimate the best fit of the Haser model to the observed intensity profile and determine the scalelengths of both the parent- (HCN) and daughter- (CN) species in the coma of C/2016 R2. We found lp = 1.3 x 10⁴ km and ld = 2.8 x 10⁵ km (scaled to 1 au using an rh2 law) as shown on Fig. 1. With g = 3.52 x 10⁻² photons/s/molecule at 1 au (Schleicher et al. 2010), we estimate a production rate of Q(CN) = (9.8±0.5) x 1024 mol/s.
N2+ scalelengths and Production Rate: The production rate was estimated via relative ratios with g =7 x 10⁻² photons/ion/s from Lutz et al. (1993) by Wierzchos (2018) as Q(N2) = (2.8 ±0.4) x 1027 mol/s and by McKay (2019) as Q(N2) = (4.8 ± 1.1)x1027 mol/s. It can be inferred from Biver et al. (2018) to be ~8.5 x 1027 mol/s for a Q(CO) = 1.1 x 1029 mol/s. These results are first re-calculated with the most recent g factor from Rousselot et al. 2022. With g =4.90 x 10⁻³ photons/mol/s at 1 au, prior measurements of the N2+ production rates become Q(N2) = 4.6x1027 mol/s (Wierzchos & M. Womack 2018), =8.0x1027 mol/s (McKay et al. 2019), and 1.4x1028 mol/s (Biver et al. 2018).
We limit the identification process to the 3885.5 Å to 3915.0 Å interval to further avoid contamination by the CN emission lines. We explore this interval with the X2 test and find new scalelengths of lp = 2.8 x 10⁶ km and ld = 3.8 x 10⁶ km scaled to 1 au (see Fig. 1). These values are within the expected range estimated from the rate coefficients. However, at this scale, multiple pairs of scalelengths could be selected for N2+ with an equally good fit. We thus have a large uncertainty on the production rate.
Using g = 5.41 x 10⁻³ photons/mol/s (at rh) for the (0,0) band between 3885.5-3915.0 Å and FTOT = 1.0 x 10⁻¹⁴ erg/s/cm2, we find Q(N2)=(8 ±1) x 1027. With Q(CO) ~ 1.1 × 1029 molecules.s-1, N2/CO = 0.07, consistent with observed intensity ratios.
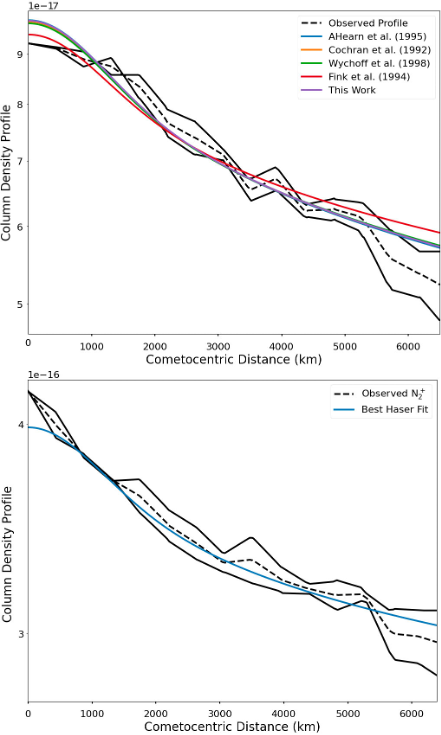
Figure 1: The best fit of the Haser model for CN (top, purple, compared to other fits using scalelengths from literature) and N2+ (bottom, blue).
References
A’Hearn et al., 1995) ICARUS 118, 223A
Biver N., et al., 2018, A&A 619, A127
Cochran A. L. & McKay, A. J. 2018a, ApJ, 856, L20
Cochran A. L. & McKay A. J., 2018b, ApJ, 854, L10
Haser L., 1957, BSRSL 43 740H
Huebner W.F., Keady J.J., & Lyon S.P., 1992, ApSS 195 1H
Lutz B. et al., 1993, ApJ 03 402-411
McKay A. J., et al., 2019, AJ, 158, 128
Opitom C., et al. 2019, A&A, 624, A64
Raghuram S. et al. 2020, MNRAS 501 3 4035-4052
Rousselot P., et al., 2022, A&A, in press
Schliecher D.G., 2010, AJ 140 973S,
Venkataramani K., et al., 2020, MNRAS, 495, 3559
Wierzchos K. & Womack M. 2018, AJ, 156, 134
Wyckoff S. & Wehinger P. A. 1976, ApJ 204 604W
Zucchoni J.M. & Festou M.C. 1985, AA 150 180Z
How to cite: Anderson, S., Rousselot, P., Noyelles, B., Opitom, C., Jehin, E., Hutsemékers, D., and Manfroid, J.: The N2 Production Rate in C/2016 R2 (PanSTARRS), Europlanet Science Congress 2022, Granada, Spain, 18–23 Sep 2022, EPSC2022-538, https://doi.org/10.5194/epsc2022-538, 2022.