SB2
Small bodies from the active Main Belt to the Oort cloud and beyond
Session assets
Discussion on Slack
Orals: Mon, 19 Sep, 10:00–18:30 | Room Manuel de Falla
Chairpersons: Thomas Müller, Michael Küppers
Session I: TNOs
10:00–10:05
Introduction
10:05–10:20
|
EPSC2022-1196
|
solicited
10:30–10:40
|
EPSC2022-677
|
ECP


11:00–11:10
|
EPSC2022-610
|
ECP
11:10–11:20
|
EPSC2022-406
|
ECP
11:20–11:30
|
EPSC2022-172
|
ECP
Coffee break
Chairperson: Jessica Agarwal
Session II: Comets
15:30–15:35
Introduction
15:35–15:50
|
EPSC2022-989
|
ECP
|
solicited
15:50–16:00
|
EPSC2022-360
|
ECP
16:10–16:20
|
EPSC2022-1160
|
ECP
High resolution optical spectroscopic comparison of a short period and long period comet
(withdrawn)
16:20–16:30
|
EPSC2022-685
|
ECP
16:30–16:40
|
EPSC2022-1106
|
ECP

Coffee break
Chairpersons: Yoonyoung Kim, Mario De Pra
Session III: Active Asteroids
17:50–18:00
|
EPSC2022-28
|
ECP


Orals: Tue, 20 Sep, 10:00–13:30 | Room Manuel de Falla
Chairpersons: Jean-Baptiste Vincent, Aurelie Guilbert-Lepoutre
Session IV: 67P/Rosetta
10:00–10:10
|
EPSC2022-482
10:10–10:20
|
EPSC2022-814
|
ECP

10:30–10:40
|
EPSC2022-281


11:00–11:10
|
EPSC2022-5
Coffee break
Chairpersons: Estela Fernández-Valenzuela, Jean-Baptiste Vincent
Session V: 67P and other comets (continued)
12:00–12:10
|
EPSC2022-591
|
ECP
12:20–12:30
|
EPSC2022-933
|
ECP
The convex shape of the nucleus of 162P/Siding-Spring
(withdrawn)
12:30–12:40
|
EPSC2022-878
|
ECP
12:50–13:00
|
EPSC2022-669
13:00–13:10
|
EPSC2022-401
|
ECP
|
MI
13:10–13:20
|
EPSC2022-18
|
ECP
|
MI
13:20–13:30
|
EPSC2022-231
|
ECP
|
MI


Posters: Mon, 19 Sep, 18:45–20:15 | Poster area Level 2
L2.25
|
EPSC2022-971
|
ECP
L2.27
|
EPSC2022-1229
Dealing with a changing surface: lessons learned from Comet 67P/Churyumov-Gerasimenko
(withdrawn)
L2.29
|
EPSC2022-1025
|
ECP
Long-term monitoring of comet 29P/Schwassmann-Wachmann 1 from Lulin observatory
(withdrawn)
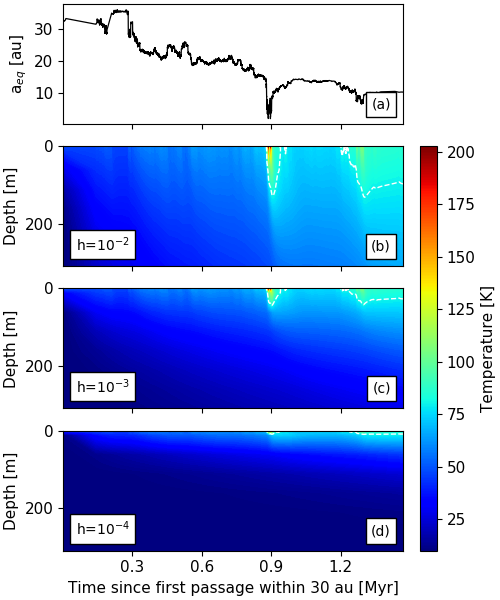
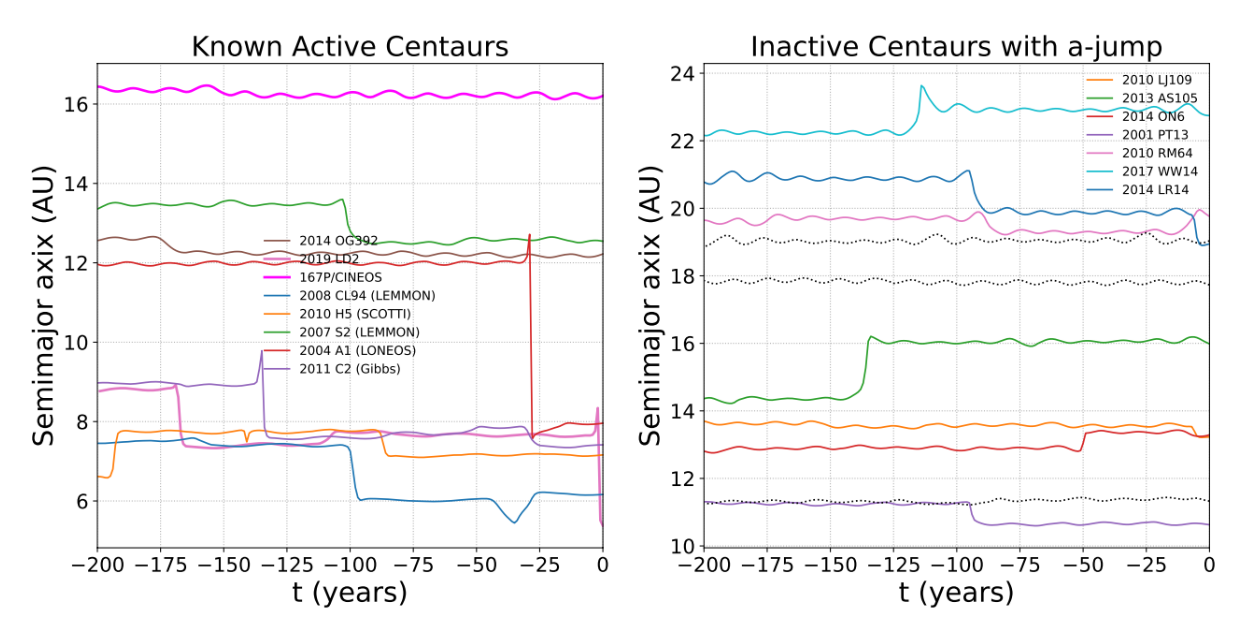 Figure 1: Comparison of the a-dips observed in orbital history of several known active Centaurs (left) compared to (right) a-dips of the identified inactive Centaurs – possible candidates for future outbursts. The dotted lines on the right panel show typical fluctuation of semi-major axis in the vast majority of inactive Centaurs.
L2.33
|
EPSC2022-161
Non-gravitational parameters of the comet 45P/Honda-Mrkos-Pajdusakova
(withdrawn)
L2.39
|
EPSC2022-727
Outgassing of cometary analogues
(withdrawn)
L2.40
|
EPSC2022-1038
L2.41
|
EPSC2022-1048
|
ECP
L2.44
|
EPSC2022-664
|
ECP