Long-term photometric analysis of the trans-Neptunian object 2008 OG19
- 1Rhea System for the European Space Agency, European Space and Astronomy Center, Camino Bajo del Castillo s/n, Villanueva de la Cañada, 28692, Spain (m.costa@rheagroup.com)
- 2Valencia International University, C. del Pintor Sorolla 21, València, Valencia, 46002. Spain
- 3Florida Space Institute, University of Central Florida, 12354 Research Parkway, Orlando, FL 32826, USA
- 4Instituto de Astrofísica de Andalucía, CSIC, Glorieta de la Astronomía s/n, Granada 18008, Spain
We have carried out a long term photometric analysis of time series images of the trans-Neptunian object (TNO) 2008 OG19 with which we have refined its physical properties from its long-term variability.
Photometric Analysis
The first detailed analysis of 2008 OG19 was carried out by [1] using rotational light-curves from 2014 and 2016 from which a volume-equivalent diameter, a rotation period (P), a triaxial ellispoidal shape model, and a density were estimated.
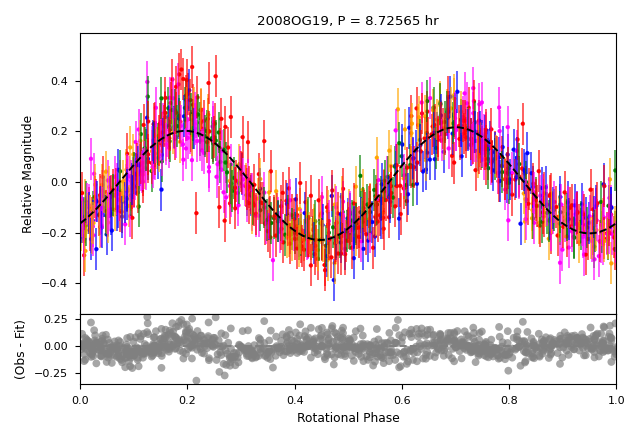
We have used 1,314 images covering a time-span of six years (2014-2021), obtained with the Sierra Nevada 1.5-m telescope and the Calar Alto 1.2-m telescope, both in Spain, in order to build yearly rotational light-curves for 2008 OG19. To refine the rotation period estimation of 2008 OG19, we have combined the whole set of data and applyed the lomb periodogram [2] and the Phase Dispersion Minimization techniques [3] resulting in P = 8.72565 +/- 0.0008 hr. The resulting rotational light-curve can be seen in Figure 1.
Long-term variability
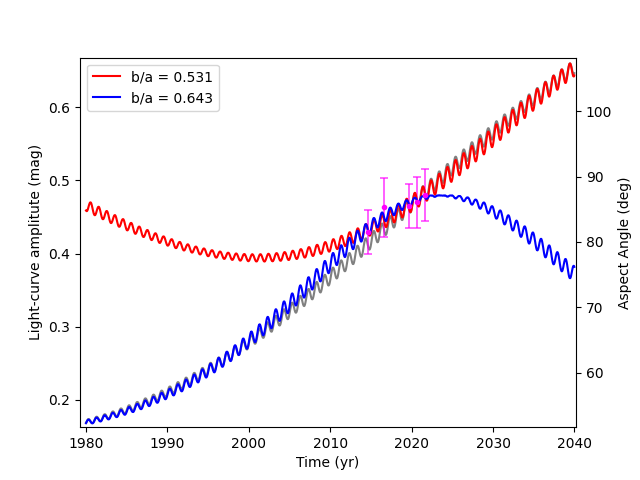
By folding the light-curves with the refined period, we have been able to see an increase of the amplitude of the rotational light-curve. This increase is due to a change in the aspect angle, that allows to estimate the orientation of 2008 OG19 rotational axis as seen in Figure 2. Using the largest rotational light-curve amplitude and assuming hydrostatic equilibrium we have updated its triaxial ellispoid model and its density.

Figure 1: 2008 OG19 rotational light-curves folded to P = 8.72565 h. Observational data are represented by color points with each color indicating a different observational night. The black dashed line represent the Fourier series fit.

Figure 2: Model of the amplitude given by the fit to the observational data using b/a = 0.643 in blue (best fit). Other pole solutions are possible with different values of the b/a such as the red model. The gray line represents 2008 OG19 aspect angle given by the best fit. The magenta points with error bars are the observational data from this work.
References
[1] E. d. M. Fernández-Valenzuela, Physical properties of transneptunian objects and centaurs; Ph.D. thesis, University of Granada, Spain, 2017.
[2] N. R. Lomb, Least-squares frequency analysis of unequally spaced data, Astrophysics and Space Science 39 (1976) 447–462. doi:10.1007/BF00648343.
[3] R. F. Stellingwerf, Period determination using phase dispersion minimization, ApJ 224 (1978) 953–960. doi:10.1086/156444.2
How to cite: Costa-Sitjà, M., Fernández-Valenzuela, E., Ortiz, J. L., Morales, N., Santos-Sanz, P., and Vara-Lubiano, M.: Long-term photometric analysis of the trans-Neptunian object 2008 OG19, Europlanet Science Congress 2022, Granada, Spain, 18–23 Sep 2022, EPSC2022-610, https://doi.org/10.5194/epsc2022-610, 2022.

