
One metre 3D mapping of the Moon using the automated MADNet 2.0 single image height estimation
 1,1,2
1,1,2- 1University College London, Mullard Space Science Laboratory, Space and Climate Physics, Holmbury St Mary, United Kingdom of Great Britain – England, Scotland, Wales (j.muller@ucl.ac.uk)
- 2CNRS, Laboratoire de Planétologie et Géodynamique, 2 rue de la Houssinière, Nantes, France
Introduction
High-resolution digital terrain models (DTMs) play an important role in studying the formation processes involved in generating a modern-day planetary surface such as the Moon. However, it has been a common understanding that DTMs derived from a particular imaging dataset can only achieve a lower, or at best, similar effective spatial resolution compared to the input images, due to the various approximations and/or filtering processes introduced by the photogrammetric and/or photoclinometric pipelines. With recent successes in deep learning techniques, it has now become feasible to generate pixel-scale topography using single-image DTM estimation (SDE) networks [1]. Although originally developed for Mars whose surface is very different due to the action of water and the distribution of dust through its perennially dusty thin atmosphere, the Moon has severe challenges due to the wide range of solar angles. Figure 1 shows an example of the 1 m/pixel LROC-NAC MADNet result produced using a 0.5 cm/pixel image compared with a 5m DTM generated using the standard Socet® photogrammetric process.
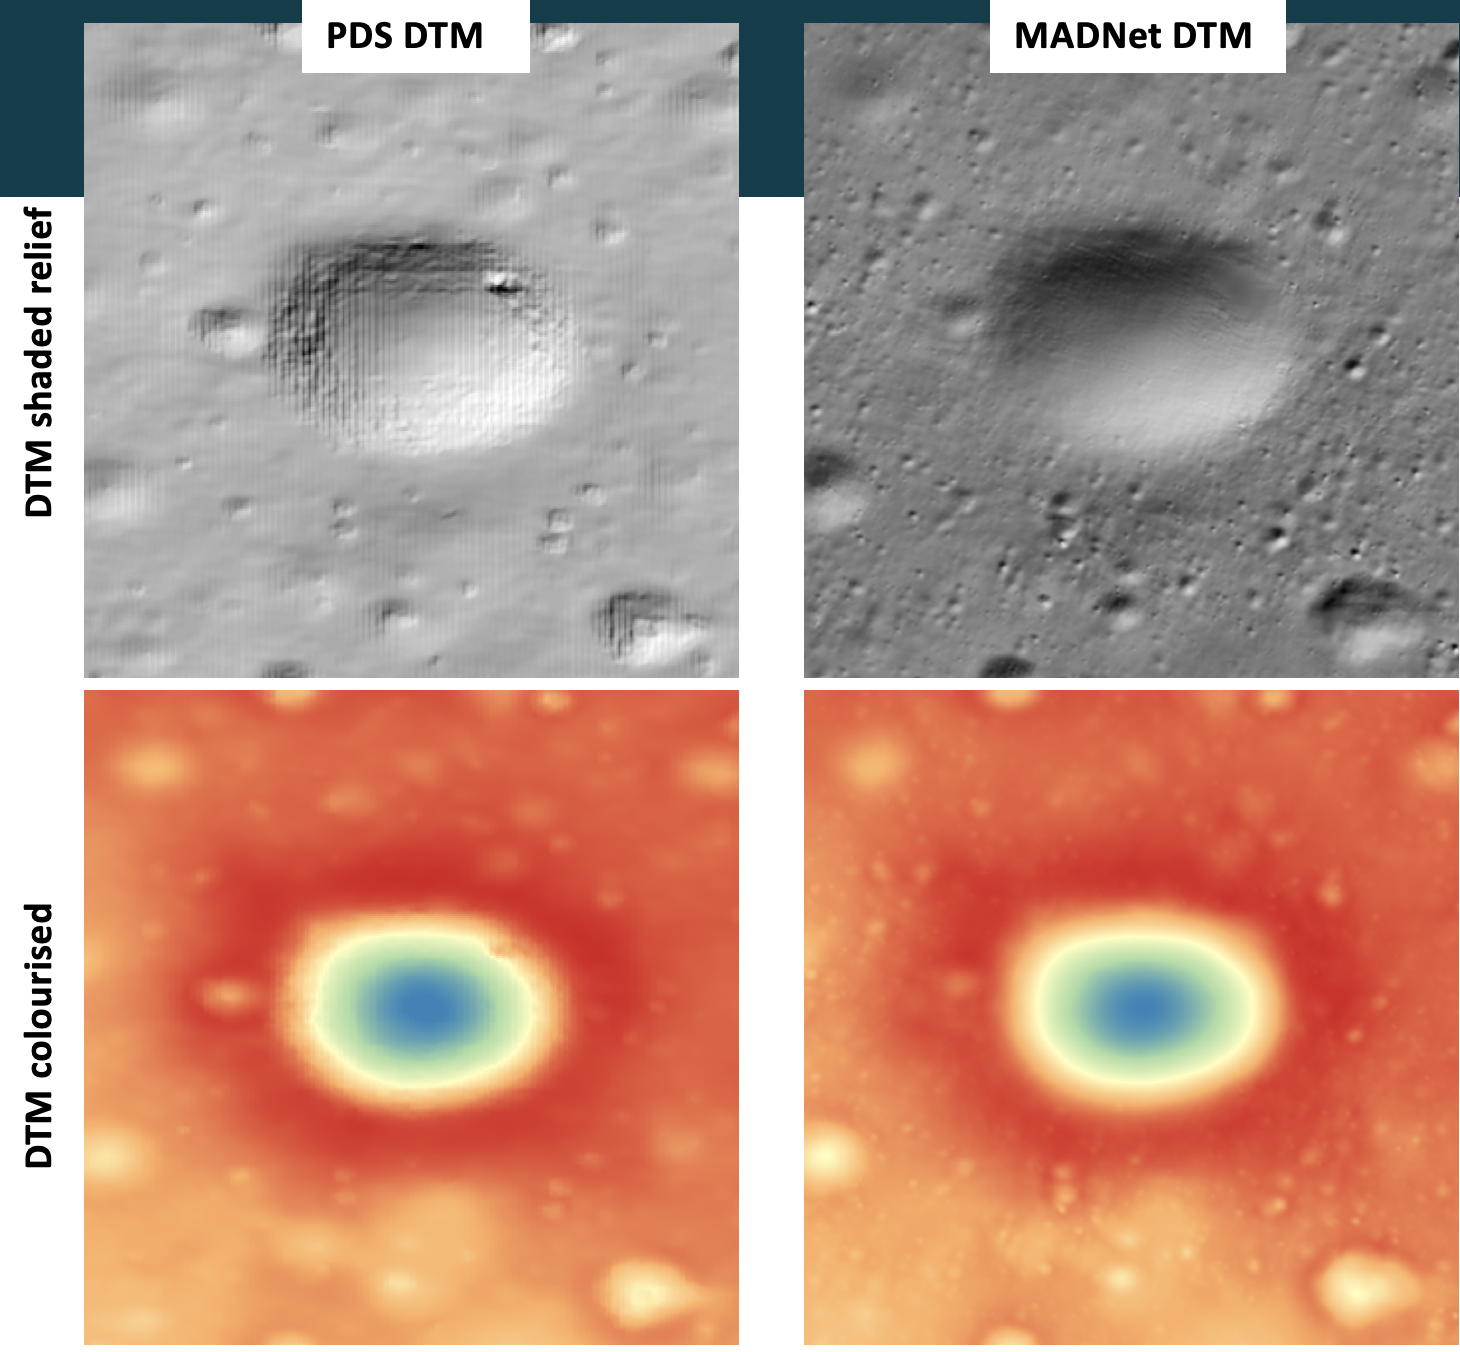
Figure 1. An example of 2 DTMs, the one of the left column generated at 5m using the SOCET® stereo photogrammetric processing chain at ASU whereas on the right column is the MADNet DTM generated at 1m.
Methods
Recent work on Mars on the MADNet 2.0 (multi-scale generative adversarial U-net based single-image DTM estimation) SDE system [ibid.] to produce single-input-image-based DTMs at twice the pixel-scale spatial resolution hads now been exploited to generate a 1m DTM of a large area on the lunar surface. Our study site is the von Karman crater located at 44.8°S 175.9°E on the lunar farside where the Chang’E-2 rover landed in November 2019 [2,3]. 370 LROC-NAC images were selected using ARCgis to minimise overlap and redundancy whilst trying to maintain the range of solar illumination angles. The coverage of these images is shown in Figure 2 superimposed on a coarse-scale (20m) DTM from Chang’E-2.
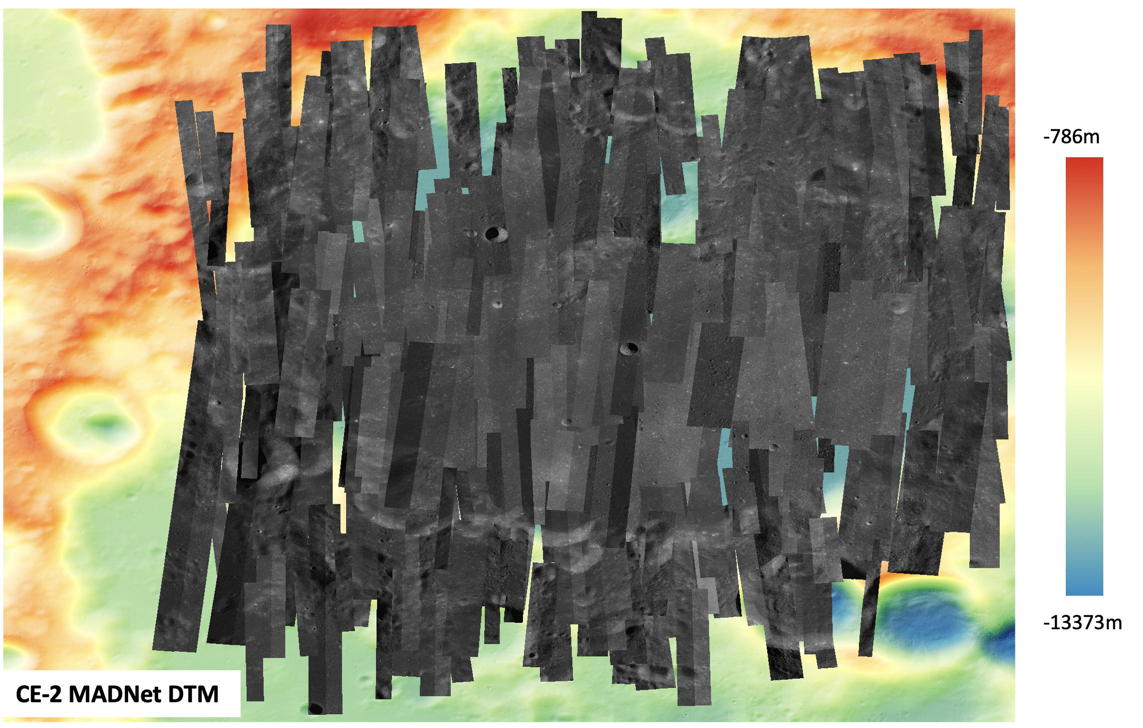
Figure 2. Coverage of 370 LROC-NAC ORI images in the resolution range of 0.5m-1.5m in their co-registered position to the Chang’E-2 14m MADNet DTM showing the dense coverage of the final DTM.
The different stages in the processing chain are shown schematically in Figure 3 emphasizing the different approaches between the photogrammetric stereo DTM pipeline and this new deep learning method, MADNet. With deep learning, we can simplify the complicated and time-consuming processes of the traditional stereo pre-processing, stereo matching, disparity refinement, interpolation and camera triangulation into one very fast image-to-height inference process, which only takes from a few seconds to a few minutes, given that the automated co-registration and multi-resolution height adjustment has been performed previously. Currently, this auto-coregistration process is the bottleneck although a COTS solution based on the Harris® ENVI® Modeler proved to be the most robust taking only a few minutes on a laptop. A specialist but low cost RTX3090 GPU is, however, required for the deep learning aspects.

Figure 3. Schematic flowchart of stereo photogrammetric process (upper panel) compared with this new deep learning based approach called MADNet.
Results
Co-registration and DTM height alignments were performed for the Chang’E-2 global 20m DTM using the SELENE+LOA global height reference map [4]. Training was performed using ≈400 pairs of ASU-PDS DTMs and images after careful screening to ensure only the highest possible quality were employed. Previous work on Mars indicates that a few bad training datasets would have catastrophic consequences on the MADNet prediction quality. In parallel 370 images were automatically co-registered to the 7m Chang’E-2 ORI mosaic using the proprietary ENVI® Modeler system. The results of the co-registration system are shown in Figure 2.
MADNet 2.0 is first applied to the 7m Chang’E-2 ORI image to produce a 14m DTM of the whole area. This is shown in Figure 4 using colour intensity height hill-shading for the CE2 mosaic and greyscale for the base reference of LOLA+SELENE over the base reference DTM.
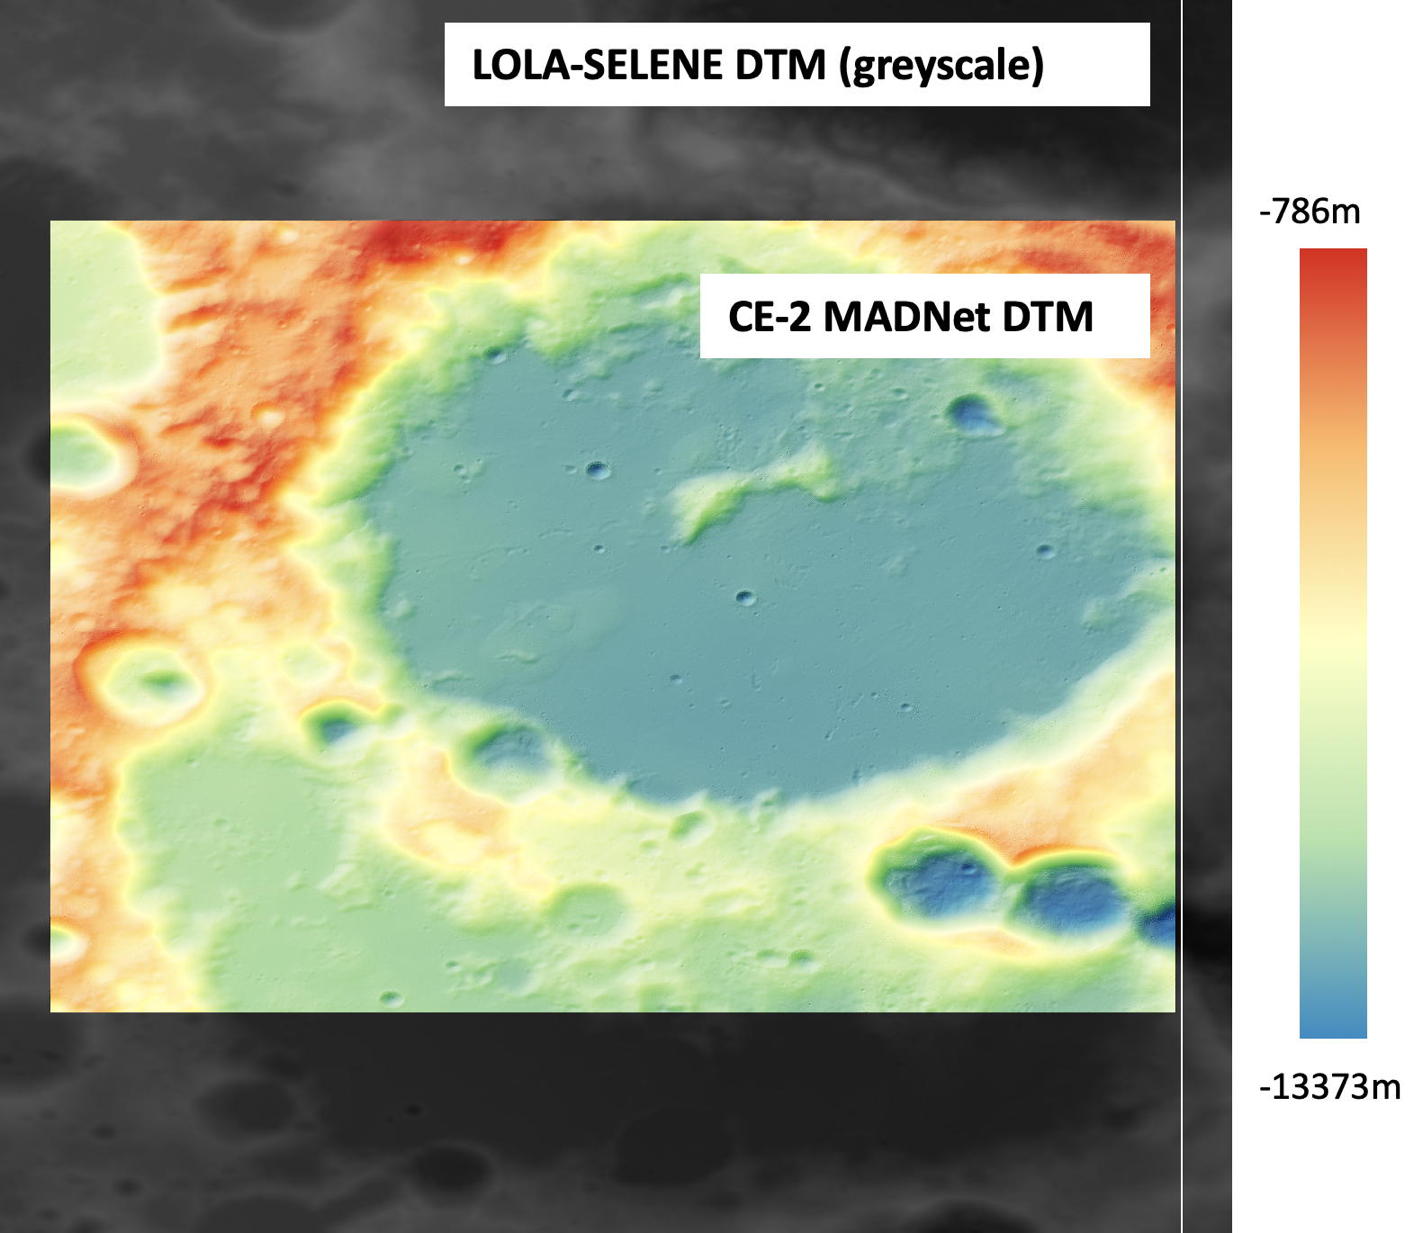
Figure 4. MADNet applied to CE-2 (Chang’E-2) DTM to generate a 14m DTM superimposed on a 69m base DTM from SELENE+LOLA.
A preliminary analysis of the quality of the MADNet 14m CE-2 and LROC-NAC 1m DTM compared with a 5m ASU-PDS DTM is shown in Figure 5 This demonstrates the close congruence between all the 3 datasets as well as the fine-scale detail in the MADNet DTM compared with the other two datasets.
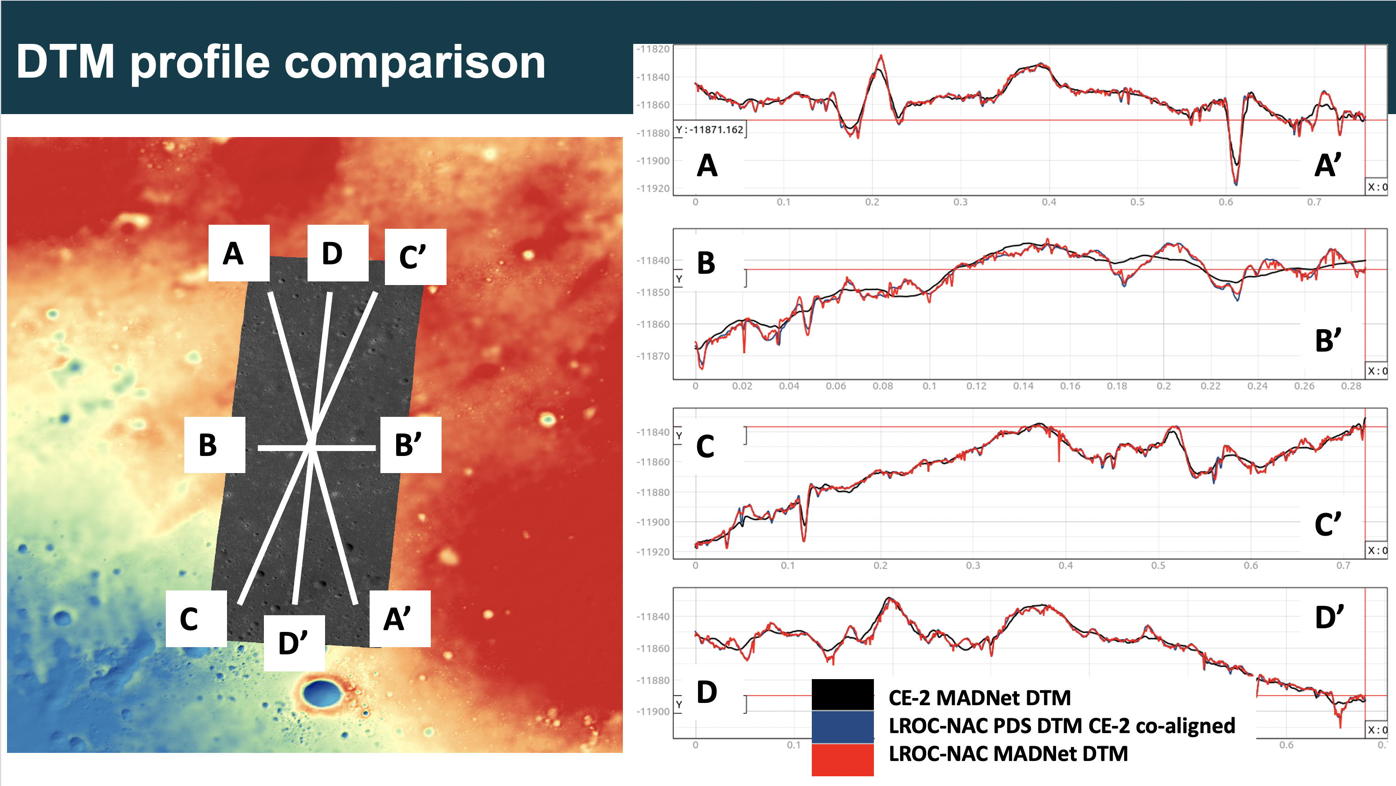
Figure 5. LROC-NAC 1m ORI superimposed on the 14m DTM where 4 profiles were extracted to show the high degree of agreement between the CE-2 (14m) , the 5m (PDS) and the 1m MADNet DTMs.
Conclusions
In this work, we have shown that we can apply MADNet SDE techniques to produce pixel-scale topography from Chang’E-2 mosaics and LROC-NAC images.
The final geotiff 1m DTM will be mosaiced and made available via the ESA Guest Storage Facility (GSF) at https://www.cosmos.esa.int/web/psa/ucl-mssl_meta-gsf as well as through the NASA Moontrek project (https://moontrek.jpl.nasa.gov). Given this capability large area maps using SDE could be produced for areas of interest to the NASA ARTEMIS project (which includes an ESA element) as well as ESA’s and China’s own lunar exploration plans.
Acknowledgements
The research leading to these results received initial funding from the UKSA Aurora programme (2018–2021) under grant ST/S001891/1, as well as partial funding from the STFC MSSL Consolidated Grant ST/K000977/1. The processing was supported by JPL contract no. 1668434. We thank Emily Law for all of her support for this work. S.C. is grateful to the French Space Agency CNES for supporting her GIS related work.
References
[1] Tao, Y.; Muller, J.-P.; Xiong, S.; Conway, S.J. MADNet 2.0. Remote Sens. 2021, 13, 4220.
[2] Ren, X. et al. IEEE Trans. Geosci. Remote Sens. 2019,57, 6832–6843.
[3] Liu Z et al., Sci China Inf Sci, 2020, 63(4): 140901
[4] Barker, M. K. et al.. Icarus 273, 346–355 (2016).
How to cite: Muller, J.-P., Tao, Y., and Conway, S.: One metre 3D mapping of the Moon using the automated MADNet 2.0 single image height estimation, Europlanet Science Congress 2022, Granada, Spain, 18–23 Sep 2022, EPSC2022-625, https://doi.org/10.5194/epsc2022-625, 2022.