Dissecting Jupiter’s Thunderstorms: Results from JIRAM, JunoCam, MWR and Earth-Based Observations
- 1Jet Propulsion Laboratory/California Institute of Technology, Pasadena, CA, USA
- 2California Institute of Technology, Pasadena, CA, USA
- 3Institute for Space Astrophysics and Planetology INAF-IAPS, Rome, Italy
- 4Citizen Scientist, Stuttgart, Germany
- 5Planetary Science Institute, Tucson, USA
- 6School of Physics and Astronomy, University of Leicester, Leicester, UK
- 7ALPO-Japan
- 8Southwest Research Institute, San Antonio, TX, USA
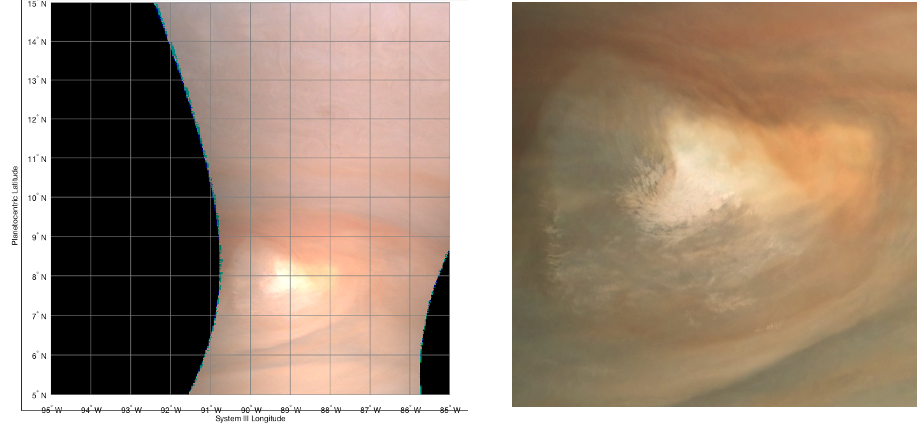
The Juno spacecraft’s polar orbit with periapses (perijove; PJ) within a few thousand kilometers of the 1-bar level has allowed for detailed observations of Jupiter’s thunderstorms from multiple instruments at unprecedented resolution. Here, we detail the observations of a 2,500-km wide thunderstorm feature located in the North Equatorial Belt (at planetocentric latitude 9°N; Fig. 1) from the six channels of the Microwave Radiometer Instrument (MWR), from JunoCam’s RGB filters, from the Jovian Infrared Auroral Mapper’s (JIRAM) 5-micron band, and from supporting Earth-Based images taken during near the time of the 38th perijove. Juno flew over one such thunderstorm complex at close range (~5,000 km) on 29 Nov. 2021 for the first time with a favorable alignment to observe such a feature at low emission angles. JunoCam and MWR observations were taken nearly simultaneously while JIRAM’s data was collected approximately 4.5 hours prior.
Moist convection is widely thought to play a large role in transporting heat from Jupiter’s interior through the weather layer (here defined as 10 to 0.7 bar) and then to space. In the process, heat transport allows for moist convection, which powers thunderstorms and generates small-scale turbulence that, through the inverse-cascade mechanism, generates large-scale vortices and zonal jets. Convective instability allows for strong updrafts that carry volatiles such as NH3 and H2O from the base of the water-cloud (and deeper) upwards to form cumulonimbus (CB) clouds. The tops of these CB towers diverge outwards and are shaped by local winds to form an icy anvil cloud much as they do on Earth.
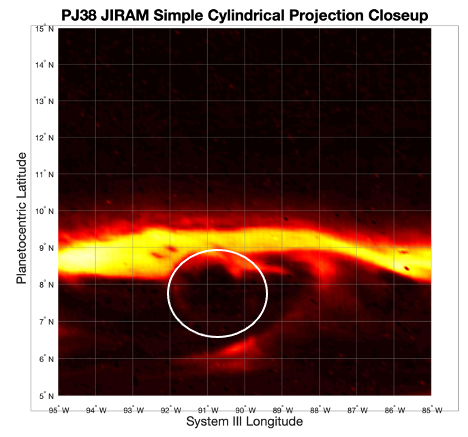
Lightning is a defining characteristic of CB clouds and the MWR instrument detected numerous flashes in and around the bright white feature with a storm-like morphology clearly observed by JunoCam. JIRAM’s M-band filter images clearly show the structure of the cloud tops, matching observations from JunoCam once the zonally-averaged motion over the 4.5-hour time separation is accounted for. Figure 2 is a JIRAM image with a noticeable dark ‘notch,’ which is where the optically thick storm clouds are located. Preliminary spectral analysis from JIRAM shows a slightly enhanced signal of H2O and PH3 near the anvil top but NH3 ice is undetectable in these night-time JIRAM observations.
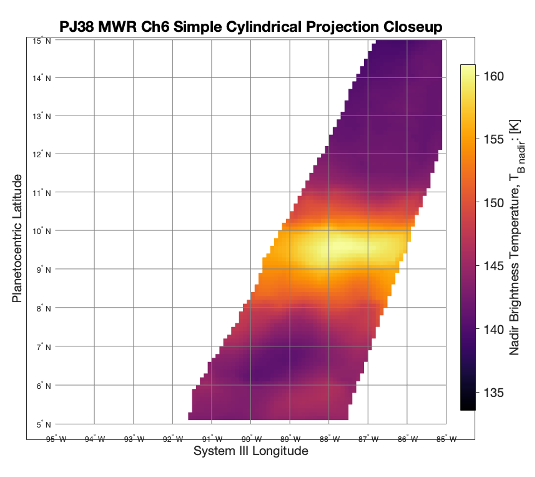
Gaseous NH3 and H2O are partially opaque to wavelengths sensed by the MWR instrument. Each of the six channels of MWR have a sensitivity that peaks at different altitudes in the atmosphere, which allows us to sound the brightness temperature and the vertical structure from the cloud tops down to many tens of bars. The brightness temperature is a combination of air temperature and humidity, and, at present, we are unable to deconvolve these two measurements. Nevertheless, sounding the brightness temperature provides information on the depth and structure of a tall atmospheric feature and we present brightness temperature maps for all six channels.
We observe that this particular thunderstorm complex is visible from the cloud tops (~0.7 bar) down to approximately the level of the water cloud. Below this level, the thunderstorm signal is no longer apparent, which indicates that any dry convective updraft carrying MWR opacity-inducing vapor is either not present, or its air temperature and humidity are combined in such a way to mask its presence perfectly. If this thunderstorm is a result of dry convection from below the base of the water cloud lifting moist air to the level of free convection (LFC) then the effect of the dry convection is to lift vapor already located around the base of the water-cloud level rather than bringing up significantly moist air from deep below the base of the water cloud, or otherwise a signal would be detected in the short wavelength channels of MWR (See Fig. 3 for a cloud-top MWR map).
The next several perijoves will feature an orientation for the MWR instrument that is conducive for low emission angle observations. Additionally, the latitude of perijove is slowly migrating northward and, if Juno does fly over new thunderstorms, we may have the opportunity to compare the vertical structure of multiple thunderstorms taken from different regions of the planet at high resolution from multiple instruments.

Figure 1: PJ38 Thunderstorm from JunoCam Image JNCE_2021333_38C00030_V01 (left) and close-up (right: Image Credit: NASA/JPL-Caltech/SwRI/MSSS/Kevin M. Gill)

Figure 2: Map-Projected Processed Close-Up Image of PJ38 Thunderstorm from JIRAM M-Band Image (Image Credit: NASA/JPL-Caltech/INAF-IAPS). Circle denotes location of optically thick storm clouds.

Figure 3: Map-Projected MWR Ch 6 Brightness Temperature
How to cite: Brueshaber, S., Orton, G., Zhang, Z., Oyafuso, F., Mura, A., Grassi, D., Eichstadt, G., Hansen, C., Fletcher, L., Mizumoto, S., Momary, T., Levin, S., and Bolton, S.: Dissecting Jupiter’s Thunderstorms: Results from JIRAM, JunoCam, MWR and Earth-Based Observations, Europlanet Science Congress 2022, Granada, Spain, 18–23 Sep 2022, EPSC2022-733, https://doi.org/10.5194/epsc2022-733, 2022.

