Europlanet Science Congress 2022
Palacio de Congresos de Granada, Spain
18 – 23 September 2022
Europlanet Science Congress 2022
Palacio de Congresos de Granada, Spain
18 September – 23 September 2022
OPS4
Jupiter and Giant Planet System Science: New Insights From Juno

OPS4

Jupiter and Giant Planet System Science: New Insights From Juno
Convener: Scott Bolton | Co-conveners: Yamila Miguel, Yasmina M Martos, Corentin Louis, Stavros Kotsiaros, Kimberly Moore
Orals
| Thu, 22 Sep, 12:00–13:30 (CEST), 15:30–18:30 (CEST)|Room Andalucia 2, Fri, 23 Sep, 10:00–11:30 (CEST)|Room Andalucia 3
Posters
| Attendance Thu, 22 Sep, 18:45–20:15 (CEST) | Display Wed, 21 Sep, 14:00–Fri, 23 Sep, 16:00|Poster area Level 1

Session assets

Discussion on Slack

Orals: Thu, 22 Sep | Room Andalucia 2

Chairperson: Corentin Louis
12:00–12:10
|
EPSC2022-95
Heidi Becker, Meghan Florence, Martin Brennan, Candice Hansen, Paul Schenk, Michael Ravine, John Arballo, Scott Bolton, Jonathan Lunine, Alexandre Guillaume, and James Alexander

Juno’s low-light sensitive Stellar Reference Unit (SRU) navigation camera has embarked on Juno’s Extended Mission as a full-fledged member of the science payload. SRU images from Juno’s Prime Mission led to multiple discoveries within the Jovian system, inspiring new objectives that the orbit’s evolution will soon put within reach. SRU images of Jupiter’s dark side revealed the presence of “shallow lightning” flashes with origins in high altitude ammonia-water clouds above the 2 bar level. These observations fortify theories in which ammonia-water hailstones (“mushballs”) transport ammonia into Jupiter’s deep atmosphere, accounting for the ammonia variability observed at depth by Juno’s Microwave Radiometer (MWR). Images of Jupiter’s faint dust ring have been acquired from unique vantage points while inside the ring looking out, and while observing the shadow line cast by Jupiter across the dust. In June 2021, the SRU imaged Ganymede’s dark side at >79 degrees illumination angle and <920 m/pixel resolution while the surface was illuminated only by Jupiter-shine. This novel use of a low-light star tracker resolved multiple craters, surface features (such as grooved terrain), and an unusual elongated ejecta deposit in Xibalba Sulcus. These features are not resolved in the Voyager and Galileo imagery used for the USGS global geologic map of Ganymede. Our discussion will focus on proposed updates to Ganymede’s geologic record and SRU ring science. A preview of upcoming SRU observations to investigate the influence of Jupiter’s shallow thunderstorms on Jupiter’s deep atmospheric dynamics (during the dark side perijoves starting in 2023) will also be included.

How to cite: Becker, H., Florence, M., Brennan, M., Hansen, C., Schenk, P., Ravine, M., Arballo, J., Bolton, S., Lunine, J., Guillaume, A., and Alexander, J.: Jovian Satellite and Ring Observations from the Juno Stellar Reference Unit, plus Plans for the Dark Side Perijoves, Europlanet Science Congress 2022, Granada, Spain, 18–23 Sep 2022, EPSC2022-95, https://doi.org/10.5194/epsc2022-95, 2022.

12:10–12:20
|
EPSC2022-145
|
ECP
Miriam Estefanía Cisneros González, Manuel López-Puertas, Justin Erwin, Ann Carine Vandaele, Clément Lauzin, François Poulet, and Séverine Robert

The study of Jupiter’s atmosphere, its composition, evolution, distribution, structure, and dynamics around the planet, is of interest to the scientific community. Several missions, space observatories, and ground-based telescopes (even if limited by the telluric bands of water vapor), have studied Jupiter’s atmosphere. Some of them, such as Juno, the Hubble Space Telescope (HST), and the Very Large Telescope (VLT), continue providing information about the vertical structure and distribution of the atmosphere around the planet [1-3]. Although the main chemical composition of Jupiter’s atmosphere has been unraveled, many questions remain open, such as the global abundance of water, or the responsible chemistry for the coloration of the clouds [4]. Besides, a remarkable potential of VIS-NIR spectrometry for characterizing the composition and dynamics of planetary atmospheres has been demonstrated in the last years [5].

The next mission to the Jovian system from the European Space Agency (ESA) is the Jupiter Icy Moons Explorer (JUICE), to be launched in April 2023 with an arrival date on July 2031 [6]. One of the key scientific instruments onboard is the Moons And Jupiter Imaging Spectrometer (MAJIS), which will provide hyperspectral capabilities through two channels: VIS-NIR (0.5μm-2.35μm), and IR (2.25μm-5.54μm) [7]. We would like to perform simulations of different test cases with respect to the viewing geometries of MAJIS and assess its capabilities [8-9] to characterize the vertical structure of the Jovian atmosphere. For this purpose, we upgraded ASIMUT-ALVL, a Radiative Transfer (RT) code developed at BIRA-IASB, that has been extensively used to characterize Mars and Venus atmospheres [10-11].

During the implementation phase of the new Jupiter case in ASIMUT-ALVL, we applied the current knowledge of the physical and chemical characteristics of Jupiter, including the Rayleigh scattering contribution due to dominant atmospheric species, the refractive index of Jupiter’s atmosphere, and the Collision-Induced Absorption (CIA) due to H2-H2 and H2-He molecular systems. The typical temperature profile and atmospheric composition of Jupiter were retrieved from [12], although in our next studies we might use the CH4 abundance from the Volume Mixing Ratio (VMR) profile from [13], which is similar to that from [14]. The required line-lists were implemented from the HITRAN online database with line parameters adequate for an H2 and He dominant atmosphere, following the 2020 version release [15]. The extinction coefficient due to Rayleigh Scattering is obtained based on the calculation of its cross-section from [16], by considering the refractive indexes of H2 and He, obtained from the refractivities measured by [17] and [18], respectively. The atmospheric King correction factor is obtained from an adapted version of the formula of [19], considering the depolarization ratio of H2 as measured by [20]. To model the aerosols and hazes present in the atmosphere, we used the microphysical parameters defined by [21].

We validated the updated performances of ASIMUT-ALVL by individually comparing the main spectroscopic features of Jupiter’s atmosphere in the VIS-NIR range against KOPRA, an RT code originally developed for studying Earth’s atmosphere but later adapted to the atmospheres of Titan, Mars, and Jupiter [22]. We used the same geometry of observation, assuming solar occultations with a tangential altitude between 50km and 360km, a resolution of 0.3cm-1, a Signal-to-Noise Ratio (SNR) of 100, and an orbit around the planet of 5000km high. The mean difference in transmittance obtained between both models is below 3%.

The next step was to validate our RT model against observational spectroscopic data, which was obtained from the Visible and Infrared Mapping Spectrometer (VIMS) observations during the Cassini flyby to Jupiter [23]. This imaging spectrometer consists of two channels: VIS (0.35µm-1.07µm) and IR (0.85µm-5.1µm). In this presentation, we will discuss the results we obtained from the complete validation of our RT model, and the perspectives for the future implementation of the performances and viewing geometries of MAJIS/JUICE.

Acknowledgements

We acknowledge the kind support of Gianrico Filacchione who provided the calibrated data of the VIMS/Cassini observations. This project also acknowledges the funding provided by the Scientific Research Fund (FNRS) through the Aspirant Grant: 34828772 MAJIS detectors and impact on science.

References

[1] Bolton, S.J., et al., Space Science Reviews, 2017. 213(1): p. 5-37.
[2] Nichols, J.D., et al., Geophysical Research Letters, 2017. 44(15): p. 7643-7652.
[3] Antuñano, A., et al., The Astronomical Journal, 2019. 158(3): p. 130 (28).
[4] MAJIS Team, JUICE Definition Study Report, 2014.
[5] Langevin, Y., et al., Lunar and Planetary Science Conference, 2014. No. 1777: p. 2493.
[6] Grasset, O., et al., Planetary and Space Science, Vol. 78, pp. 1-21, 2013.
[7] Piccioni, G. et al., International Workshop on Metrology for AeroSpace, IEEE, 2019. pp. 318-323.
[8] ESA, Consolidated Report on Mission Analysis (CReMA), Tech. Rep. 5.0b23.1. https://www.cosmos.esa.int/web/spice/spice-for-juice
[9] Cisneros-González, M. E. et al., Space Telescopes and Instrumentation in Proc. SPIE 2020, 11443, 114431L.
[10] Vandaele, A.C., et al., Planetary and Space Science, 2015. 119: p. 233-249.
[11] Vandaele, A.C., et al., Optics Express, 2013. 21(18): p. 21148-21161.
[12] Moses, J.I., et al., Journal of Geophysical Research: Planets, 2005. 110(E8).
[13] Sánchez-López, et al., Astronomy & Astrophysics, 2022. Forthcoming article (ArXiv:2203.10086).
[14] Seiff, A., et al., Journal of Geophysical Research: Planets, 1998. 103(E10): 22857-22889.
[15] Gordon, I.E., et al., Journal of Quantitative Spectroscopy and Radiative Transfer, 2022. 277: p. 107949.
[16] Sneep, M., et al., Journal of Quantitative Spectroscopy and Radiative Transfer, 2005. 92(3): p. 293-310.
[17] Peck, E.R. et al., Journal of the Optical Society of America, 1977. 67(11): p. 1550-1554.
[18] Mansfield, C.R., et al., Journal of the Optical Society of America, 1969. 59(2): p. 199-204.
[19] Tomasi, C., et al., Applied optics, 2005. 44(16): p. 3320-3341.
[20] Parthasarathy, S., Indian Journal of Physics, 1951. 25: p. 21-24.
[21] López-Puertas, M., et al., The Astronomical Journal, 2018. 156.4: 169.
[22] Stiller, G.P., et al., Optical Remote Sensing of the Atmosphere and Clouds, SPIE 2000, 3501.
[23] Brown, R.H., et al., Icarus, 2003. 164(2): p. 461-470.

How to cite: Cisneros González, M. E., López-Puertas, M., Erwin, J., Vandaele, A. C., Lauzin, C., Poulet, F., and Robert, S.: Validation of ASIMUT-ALVL against observational data of Jupiter’s atmosphere, Europlanet Science Congress 2022, Granada, Spain, 18–23 Sep 2022, EPSC2022-145, https://doi.org/10.5194/epsc2022-145, 2022.

12:20–12:30
|
EPSC2022-174
Scott Bolton and the Juno MWR Science Team

As observed for over 100 years, Jupiter's atmosphere has been characterized by a well-organized system of zones and belts disrupted by storms and vortices such as the Great Red Spot (GRS).  Jupiter’s meteorologically-active weather layer, where storms, vortices, and convective clouds are observed, was expected to be constrained to relatively shallow depths above the levels where water condensation and latent heat release might be an important driver of convection.  Early results from Juno extended the puzzle by discovering that both ammonia and water vary across most of the planet at much greater depths than their expected saturation levels.


The Microwave Radiometer (MWR) instrument on the Juno spacecraft provides a new and unique view into giant planetary atmospheres, using a set of radiometers operating at a range of frequencies that interrogate depths from the upper troposphere down to more than 600 km beneath the visible cloud tops.  As part of Juno, an unprecedented collaboration between ground- and space-based observations has been organized to help interpret the MWR and other Juno data.  Infrared images and spectroscopy from Juno’s Jovian Infrared Auroral Mapper (JIRAM) instrument, as well as from Earth-based observatories, provide compositional boundary conditions for the interpretation of the MWR data.  Spatial context comes from color imaging by JunoCam on Juno and from HST, together with ground-based imaging spanning the UV to the IR.  We present preliminary results of a study on the dynamics inside Jupiter’s atmosphere relating the cloud and storm features observed at shallow depths to the deeper atmospheric dynamics detected by the MWR.

How to cite: Bolton, S. and the Juno MWR Science Team: Exploring the depth of weather storms and vortices in Jupiter’s atmosphere, Europlanet Science Congress 2022, Granada, Spain, 18–23 Sep 2022, EPSC2022-174, https://doi.org/10.5194/epsc2022-174, 2022.

12:30–12:40
|
EPSC2022-220
|
MI
Ricardo Hueso, Marc Delcroix, Agustín Sánchez-Lavega, Mikel Sánchez-Arregui, Csaba Palotai, and Mark Boslough

Since 2010 several amateur astronomers have discovered flashes of light that result from the collision of objects of 5-20 m in diameter, impacting in Jupiter’s atmosphere at velocities higher than 60 km/s. These objects release energies of the order of 1015-1016 J, or 200-1000 kiloton [1] and become observable even with small-size telescopes. Up to 2019, 6 such impact flashes have been observed by amateur astronomers [2-3]. In one case, the quality of the light-curve allowed to investigate the physical composition of the impacting object through the effect of its density when comparing with models of impacts and with the likely conclusion of a stony composition [4]. An important step forward has been the availability of software tools that allow to check video files of Jupiter to automatically search for the faint trace of an impact. The software DeTeCt is a free-software designed for the task [5] and available at: http://www.astrosurf.com/planetessaf/doc/project_detect.php

Here we report the characteristics of 3 additional impacts detected in 2020-2021. These were a very bright flash discovered on 13 September, which was simultaneously observed by at least 9 observers from Brazil to Germany. A new impact was discovered by Kothji Arimatsu from Kyoto University on 15 October 2021, running a dedicated telescope with two CMOS cameras, and also observed by amateur astronomers in Japan and Singapore. After finding this impact, one of these observers used the DeTeCt software on past observations acquired one year earlier on 11 Aug. 2020 finding an additional impact that had passed unnoticed. These 3 impacts in 2020 and 2021 were observed by a variety of cameras with different sensitivities to color. This allows a good quantification of the effective brightness temperature of the impact and a more accurate measurement of the energy released, and thus, a better estimation of the mass of the impactor. The event observed on 13 September 2021 was the brightest flash observed in Jupiter. The 15 October 2021 event was also brighter than most previous flashes and it impacted Jupiter in an area observed by the Junocam instrument 28 hours later. However, Junocam did not observe a remnant even at a spatial resolution over the impact area of ~30 km/pix. We present light-curves of these three impacts and their brightness temperatures from multi-wavelength observations. Brightness temperatures compare well with the spectra of a smaller impact observed in 2018 by the Juno mission [8]. From the light-curves and brightness temperatures we deduce masses, sizes and how these 3 new objects,  and the combined data of the DeTeCt project set ups new constrains in the current impact rate in the Jupiter System [3, 7]. We also evaluate the quality of the structures observed in the simultaneous lightcurves and their capability to constrain models of bolides impacting Jupiter’s atmosphere [2,4].


Figure: Composite images of the three impacts discussed in this work together with multi-wavelength lightcurves of the central impact from one of the colour videos obtained. The rate between blue and red is indicative of a high brightness temperature.

Acknowledgments

We are very grateful to all the observers of these impacts supplying the observations and reports used in this analysis. These are: (1) Victor PS Ang (Singapore), who observed the 2020-08-11 impact and was one of the 3 amateur observers of the 2021-11-15 impact. (2) Jose Luis Pereira (Brazil), Harald Paleske (Germany), Jean-Paul Arnould (France), Didier Walliang (France), Michel Jacquesson (France), Cosmin Sabdu Val (Romania), Jean-Christophe Griveau (France), who all observed and recorded videos of the 2020-09-13 impact together with additional colleagues operating their telescopes. In addition Maciej Libert (Germany), Simone Galelli (Italy) both reported visual observations of the impact looking at the eyepiece of their telescopes. (3) “Yotsu” (Japan) and Yasunobu Higa (Japan) who were two of the observers of the 2021-11-15 impact. We are also grateful to Kothji Arimatsu and the PONCOTS team from Kyoto Observatory for comments on the October 2021 impact they originally discovered and announced making possible its detection in amateur videos acquired from Singapore and Japan. In addition, we are extremely grateful to the many amateur astronomers taking part in the DeTeCt project and committing a large amount of their time to look for impacts.

References

[1] Hueso, R., Wesley A. et al. (2010). First Earth-based detection of a superbolide on Jupiter, The Astrophysical Journal Letters (721), 2010.

[2] Hueso, R. et al. (2013). Impact flux on Jupiter: From superbolides to large-scale collisions. Astronomy & Astrophysics, 560, A55.

[3] Hueso, R., Delcroix, M. et al. (2018). Small impacts on the giant planet Jupiter, Astronomy & Astrophysics, A68.

[4] Sankar, R. et al. (2020). Fragmentation modelling of the August 2019 impact on Jupiter, Montly Notices of the Royal Astronomical Society, 493, 4622-4630.

[5] Hueso, R. Et al. (2018). Detectability of possible space weather effects on Mars upper atmosphere and meteor impacts in Jupiter and Saturn with small telescopes. Journal of Space Weather and Space Climate, 8, A57.

[6] Delcroix, M. et al. (2019). Jupiter impact detection project, Europlanet Science Conference, EPSC2019-970.

[7] Delcroix, M. et al. (2020). Impact detection on Jupiter through amateur’s processing of their own videos using DeTeCt, Europlanet Science Conference, EPSC2020-775.

[8] Giles, R. S. et al. (2021). Detection of a Bolide in Jupiter’s atmosphere with Juno UVS, Geophysical Research Letters, 48, e2020GL091797.

How to cite: Hueso, R., Delcroix, M., Sánchez-Lavega, A., Sánchez-Arregui, M., Palotai, C., and Boslough, M.: Bolide Impacts in Jupiter’s Atmosphere in 2020-2021, Europlanet Science Congress 2022, Granada, Spain, 18–23 Sep 2022, EPSC2022-220, https://doi.org/10.5194/epsc2022-220, 2022.

12:40–12:50
|
EPSC2022-221
|
ECP
José Eduardo Silva, Pedro Machado, Francisco Brasil, Ruben Gonçalves, and Miguel Silva

The thousands of exoplanets that have already been discovered launched an unprecedent drive towards the exploration of these new worlds, particularly their atmospheres. Many of these new planets fit the profile of a gas giant, although with a wide range of characteristics. To study these far away objects, we often use the Solar System as a starting point, thus a good knowledge of the atmospheres of these objects is paramount to understand these other worlds. In this regard, Jupiter often serves as model gas giant, due to its size and mass combination, among other parameters. However, despite numerous interplanetary and orbiting spacecraft combined with a long record of Earth-based observations, some fundamental questions regarding dynamical processes in Jupiter's atmosphere remain [Fletcher et al. (2020)]. The vertical structure of the colourful clouds we see with a small-sized telescope and their circulation mechanisms are still elusive [Sanchez-Lavega (2011)]. Also, to study the atmosphere dynamics of solar system planets, particularly its behaviour and evolution with time, continuous observations are required [Hueso et al. (2020)].

Multiple records of detailed observations span across more than 30 years, from first analysis of the zonal winds [Limaye et al. (1986), Vasavada et al. (1998)] using Pioneer and Galileo data, to more detailed views from the Cassini flyby [Porco et al. (2003), Salyk et al. (2006), Garcia-Melendo et al. (2011), Galperin et al. (2014)]. The most recent efforts in this regard are attributed to the Juno mission, which contributes with very high spatial resolution images [Hansen et al. (2017)], supported by observation campaigns from the Hubble Space Telescope [Garcia-Melendo et al. (2001), Tollefson et al. (2017), Hueso et al. (2017), Johnson et al. (2018)]. Although an impressive volume of data, winds at tropospheric levels have mostly been obtained with cloud-tracking techniques, which follow large patterns moving in the observable atmosphere of Jupiter. Recent efforts in studying the dynamics of the tropospheric region of Jupiter with other techniques such as high-resolution spectroscopy are gaining momentum, with the improvement of facilities which enable increased spectral resolution [Gaulme et al. (2018), Goncalves et al. (2019)].

Different techniques, such as high resolution spectroscopy applied to planetary atmospheres of the Solar System to study dynamics, can be complementary to the usually employed cloud-tracking method, by targeting slightly different levels of the atmosphere [Machado et al. (2021)], with the possibility therein to study the vertical wind shear. The technological capabilities of modern facilities that were designed to discover exoplanets can also be taken advantage of to observe Solar System atmospheres, achieving unprecedent levels of precision from the ground [Gonçalves et al. (2020)]. One such facility is ESPRESSO, assembled on the Very Large Telescope, at ESO. ESPRESSO is able to get two simultaneous spectra in a wavelength range between 378.2 and 788.7 nm with a resolving power that ranges from 70,000 in the Medium Resolution mode (MR) to more than 190,000 in the Ultra High Resolution mode (UHR) [Pepe et al. (2021)]. ESPRESSO was originally designed for exoplanet hunting and atmospheric characterisation, however, just as was demonstrated in [Gonçalves et al. (2020)] for HARPS-N, using these very high resolution spectrographs on solar system atmospheric characterisation can open new horizons on what is possible to achieve with ground-based instruments to study large objects in our cosmic vicinity.

We present an optimised Doppler velocimetry method, originally used to retrieve winds on Venus' cloud top region in the visible part of the spectrum [Widemann et al. (2008), Machado et al. (2012), Machado et al. (2014), Machado et al. (2017)]. With its successful application to Venus, this work presents an exploration of other targets within the solar system with our method. It is also an opportunity to investigate the effectiveness of ESPRESSO in the study of Solar System atmospheres, since it was used for this purpose for the first time. We show zonal wind speeds at equatorial latitudes using all the lines in the visible spectrum, from solar radiation backscattered on Jupiter’s atmosphere. These results are compared with the plethora of wind velocity data already retrieved in Jupiter’s troposphere for validation, finding consistency between both methods, despite our limited spatial and temporal coverage.

This work promotes another step in the exploration of other Solar System targets with ground-based observations, to fill the gap left by the limited availability of interplanetary space missions, ensuring continuous monitoring of the evolution of the atmospheric circulation on those planets at high spectral resolutions.

References

  • Fletcher, L.N., et al. (2020), PSJ, 216, article id. 30, DOI: 10.1007/s11214-019-0631-9;
  • Galperin, B., et al. (2014), Icarus, 229, pp. 295-320, DOI: 10.1016/j.icarus.2013.08.030;
  • Garcia-Melendo, E., Sanchez-Lavega, A., (2001), Icarus, 152, pp 316-330, DOI: 10.1006/icar.2001.6646;
  • Gaulme, P., et al. (2018), A&A, 617, article id. A41, DOI: 10.1051/0004-6361/201832868;
  • Gonçalves, I., et al. (2019), Icarus, 319, pp. 795-811, DOI: 10.1016/j.icarus.2018.10.019;
  • Gonçalves, R., et al. (2020), Icarus, 335, article id. 113418, DOI: 10.1016/j.icarus.2019.113418;
  • Hansen, C.J., et al., (2017), Spc. Sci. Rev., 243, pp. 475-506, DOI: 10.1007/s11214-014-0079-x;
  • Hueso, R., et al. (2017), Geophys. Res. Lett., 44, pp. 4669-4678, DOI: 10.1002/2017GL073444
  • Johnson, P.E., et al. (2018), Nat. Lett., 155, pp. 2-11, DOI: 10.1016/j.pss.2018.01.004;
  • Limaye, S.S., (1986), Icarus, 65, pp. 335-352, DOI: 10.1016/0019-1035(86)90142-9;
  • Machado, P., et al. (2012), Icarus, 221, pp. 248-261, DOI: 10.1016/j.icarus.2012.07.012;
  • Machado, P., et al. (2014), Icarus, 243, pp. 249-263, DOI: 10.1016/j.icarus.2014.08.030;
  • Machado, P., et al. (2017), Icarus, 285, pp. 8-26, DOI: 10.1016/j.icarus.2016.12.017;
  • Machado, P., et al. (2021), Atmosphere, 12, nº506, DOI: 10.3390/atmos12040506;
  • Pepe, F., et al. (2021), A&A, 645, A96, DOI: 10.1051/0004-6361/202038306;
  • Porco, C., et al. (2003), Science, 299, nº1541, DOI: 10.1126/science.1079462;
  • Salyk, C., et al. (2006), Icarus, 185, pp. 430-442, DOI: 10.1016/j.icarus.2006.08.007;
  • Sanchez-Lavega, A. (2011), CRC Press, 1st, Taylor & Francis Group;
  • Tollefson, J., et al. (2017), Icarus, 296, pp. 163-178, DOI: 10.1016/j.icarus.2017.06.007;
  • Vasavada, A.R., et al. (1998), Icarus, 135, pp. 265-275, DOI: 10.1006/icar.1998.5984;
  • Widemann, T., et al. (2008), Planet. Space Sci., 56, pp. 1320-1334, DOI: 10.1016/j.pss.2008.07.005.

How to cite: Silva, J. E., Machado, P., Brasil, F., Gonçalves, R., and Silva, M.: Jupiter's banded circulation through the eyes of VLT/ESPRESSO, Europlanet Science Congress 2022, Granada, Spain, 18–23 Sep 2022, EPSC2022-221, https://doi.org/10.5194/epsc2022-221, 2022.

12:50–13:00
|
EPSC2022-257
|
ECP
José Ribeiro, Pedro Machado, Santiago Pérez-Hoyos, João Dias, and Patrick Irwin

The study of the thermal spectrum of Jupiter gives us the possibility to study the elements that constitute the Jovian atmosphere, allowing us to infer the formation history and conditions of the giant planet (Taylor et al., 2004). Determining the abundance of chemical species and isotopic ratios is fundamental in this regard. For this, we reanalyse 1997 Jupiter data obtained by the ESA mission Infrared Space Observatory (ISO) (Kessler et al., 1996) in the 793.65-3125 cm-1 (3.2-12.6 µm) region using the Short-Wave Spectrometer (SWS) (de Graauw et al., 1996).  Despite the age of this data, we argue that it warrants a revisit and reanalysis since it was an important step in the study of Jupiter’s atmosphere and there have since been advancements in atmospheric models and line data.

In this work we used the NEMESIS radiative transfer suite (Irwin et al. 2008) to reproduce the observations from Encrenaz et al. (1999), which will also work as a validation of our method. Using the Cassini/CIRS model as a starting point, we adapted the template for the ISO/SWS data. We compiled correlated k-tables from the spectral line database from Fletcher et al. (2018) for a NH3, PH3, 12CH3D, 12CH4, 13CH4, C2H2, C2H6, C2H4, C4H2, He and H2 atmosphere.

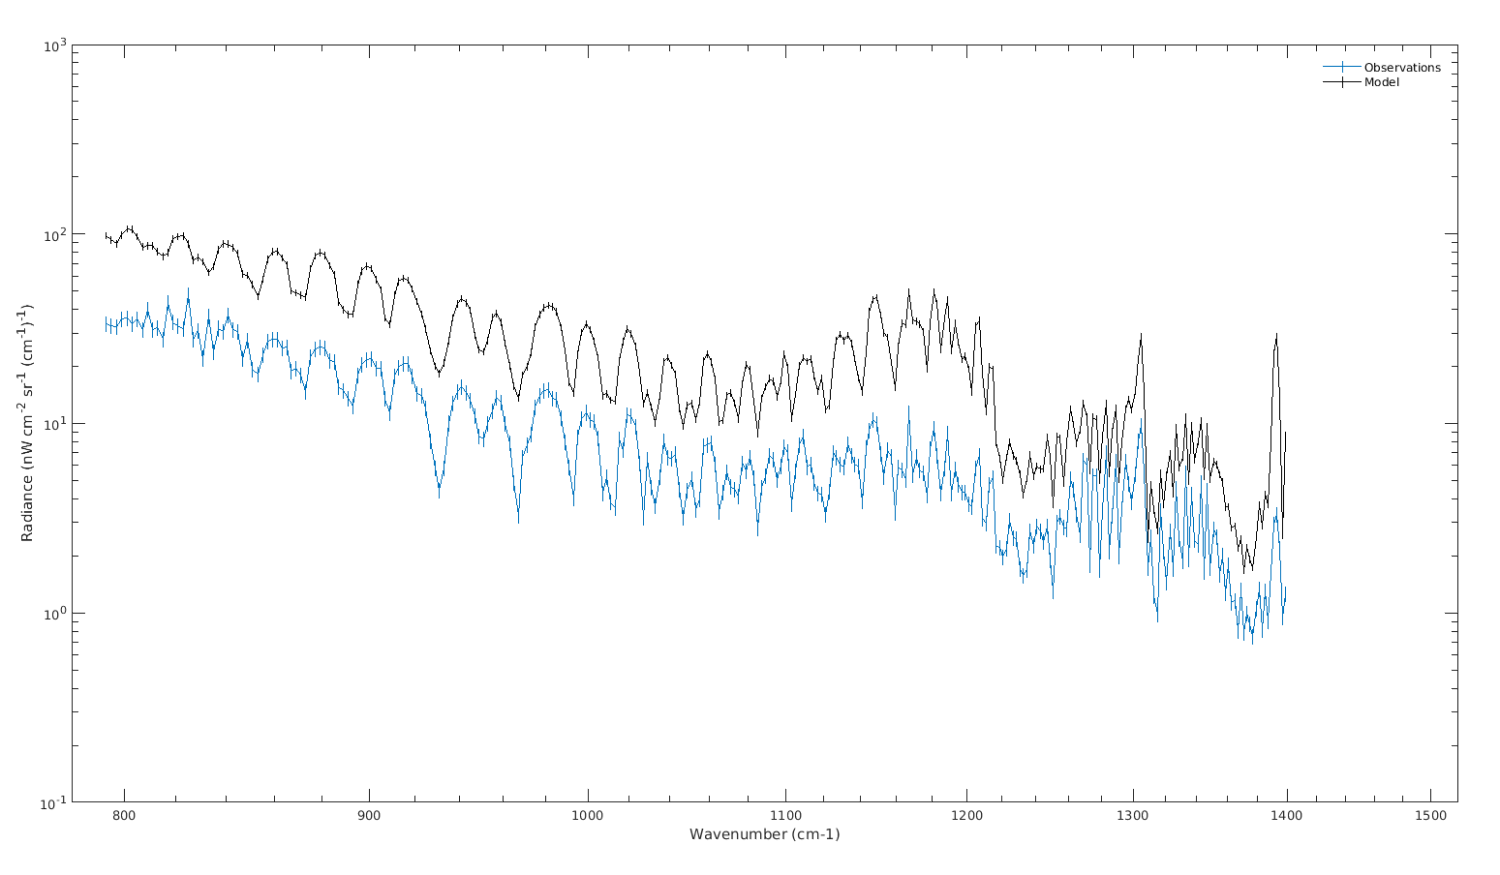
Figure 1: Plot of ISO/SWS and CIRS observations showing the discrepancy between both (no offset applied)

We first compare the spectrum obtained by ISO/SWS with the a priori model in order to find discrepancies between them as well as how each molecule individually impacts the forward model (Figure 1).

Our current work is focused on the 793.65-1500 cm-1 (6.7-12.6 µm) region of the spectrum, for comparison reasons between the CIRS and ISO-SWS data, with the 793.65-1200 cm-1 (8.3-12.6 µm) region showing the best fit.

We present here our preliminary results of the study of abundances of 12CH3D, 12CH4, 13CH4, C2H2 and C2H6 of Jupiter’s atmosphere as well as our study of the pressure-temperature profile of Jupiter obtained using NEMESIS retrievals. We also compare our results with the profiles and abundances from Neimann et al. (1998) and Fletcher et al. (2016) with the aim of constraining the number of possible best fit profiles.

As consequence of the former study, we also present our initial study of the H/D and 12C/13C isotopic ratio of the Jovian atmosphere from the abundances of 12CH3D, 13CH4 and 12CH4 following the methodology from Fouchet et al. (2000).

We hope with this work to advance the understanding of the atmosphere of Jupiter and the physical and chemical processes that occur, as well as better determining its vertical distribution of chemical species and thermal profile. As future work, we expect to extend our frequency domain to the full range of ISO/SWS observations, study the 15N/14N ratio and compare our finding with other relevant results.


References:

  • de Graauw et al., Observing with the ISO short-wavelength spectrometer, A&A 315, L49-L54, 1996
  • Encrenaz et al., The atmospheric composition and structure of Jupiter and Saturn form ISO observations: a preliminary review, Planetary and Space Science 47, 1225-1242, 1999
  • Fletcher et al., Mid-infrared mapping of Jupiter’s temperatures, aerosol opacity and chemical distributions with IRTF/TEXES, Icarus 278, 128–161, 2016
  • Fletcher et al., A hexagon in Saturn's northern stratosphere surrounding the emerging summertime polar vortex, Nature Communications, Volume 9, 2018.
  • Fouchet et al., ISO-SWS Observations of Jupiter: Measurement of the Ammonia Tropospheric Profile and of the 15N/14N Isotopic Ratio, Icarus 143, 223–243, 2000
  • Irwin et al., The NEMESIS planetary atmosphere radiative transfer and retrieval tool, Journal of Quantitative Spectroscopy & Radiative Transfer 109, 1136–1150, 2008
  • Kessler et al., The Infrared Space Observatory (ISO) mission, A&A 315, L27, 1996
  • Neimann et al., The composition of the Jovian atmosphere as determined by the Galileo probe mass spectrometer, Journal of Geophysical Research Atmospheres 103(E10):22831-45, 1998
  • Taylor et al., Jupiter, The Planet, Satellites and Magnetosphere, Ch.4, Cambridge Planetary Science, Eds. Bagenal, Dowling, McKinnon, 2004


Acknowledgements:

We thank Thérèse Encrenaz, from LESIA, Observatoire de Paris, for providing the data for this work, Patrick Irwin, from the University of Oxford (UK), for the help with the NEMESIS radiative transfer suite and Maarten Roos-Serote for guidance and help in analysing the data and retrieval results.

We acknowledge support from the Portuguese Fundação Para a Ciência e a Tecnologia (ref. PTDC/FIS-AST/29942/2017) through national funds and by FEDER through COMPETE 2020 (ref. POCI-01-0145 FEDER-007672) and through a grant of reference 2021.04584.BD. 

How to cite: Ribeiro, J., Machado, P., Pérez-Hoyos, S., Dias, J., and Irwin, P.: Preliminary atmospheric study of Jupiter using ISO/SWS data, Europlanet Science Congress 2022, Granada, Spain, 18–23 Sep 2022, EPSC2022-257, https://doi.org/10.5194/epsc2022-257, 2022.

13:00–13:10
|
EPSC2022-324
Asier Anguiano-Arteaga, Santiago Pérez-Hoyos, and Agustín Sánchez-Lavega

Introduction

The Great Red Spot of Jupiter (GRS) is the largest and longest-lived anticyclone in the Solar System. First observed probably in the XVII century, it is one of the most remarkable dynamical phenomena in any known atmosphere. The structure, coloration and dynamical behavior of the Jovian anticyclone are severely affected by the formation and evolution of the GRS upper hazes, making them a relevant field of study.

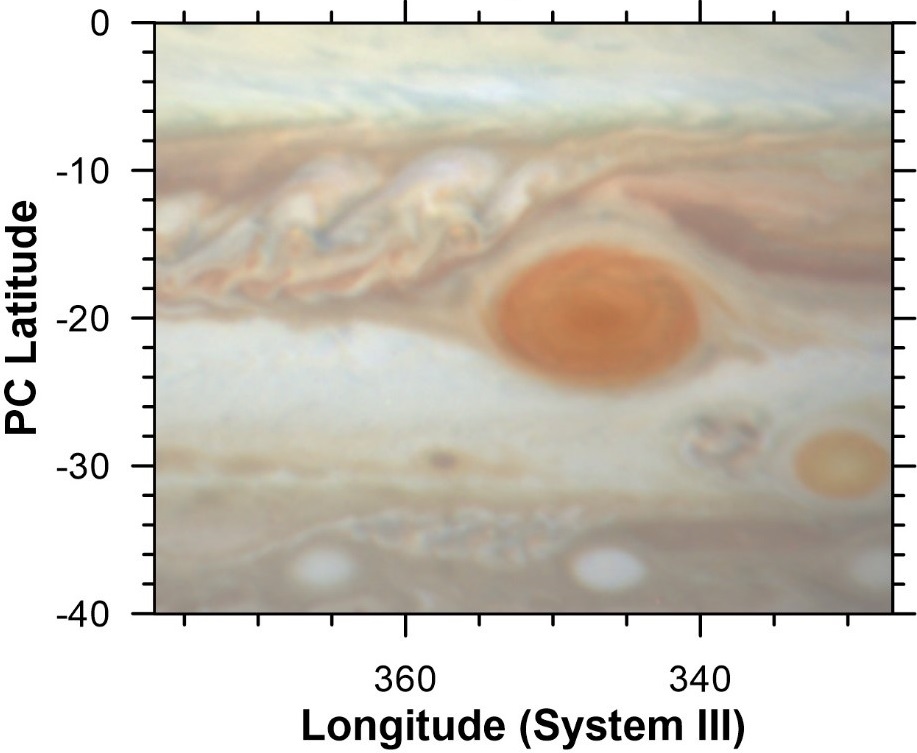
The distinctive reddish color of the GRS (see Figure 1) is due to the nature and vertical distribution of the hazes over it. Carlson et al. (2016) proposed a possible chromophore to explain the GRS coloration: the products from photolyzed ammonia reacting with acetylene. Sromovsky et al. (2017) showed that this species was able to explain the reddish colorations all over the planet, despite being of very different intensity. This chromophore must be located on top of the tropospheric haze, in the so called “crème brûlée” model. Anguiano-Arteaga et al. (2021) performed a radiative transfer analysis that showed the existence of a stratospheric haze that could be compatible with the chromophore agent proposed by Carlson et al. (2016), although their study also suggested another chromophore located below that, in the upper tropospheric levels. However, every single color in the region shown in Figure 1 was also explained with those two chromophores.  In a recent paper (Anguiano-Arteaga et al., 2022) we find that the results of Anguiano-Arteaga et al. (2021) remain valid at least from 2015 to 2021, and no major temporal variations are expected in years close to such time span.


Figure 1. Map showing Jupiter’s Great Red Spot in December 2016. The RGB images are constructed from HST/WFC3 images with R=F631N, G=F502N and B=F395N. Image taken from Anguiano-Arteaga et al. (2022).

Vertical structure of the GRS

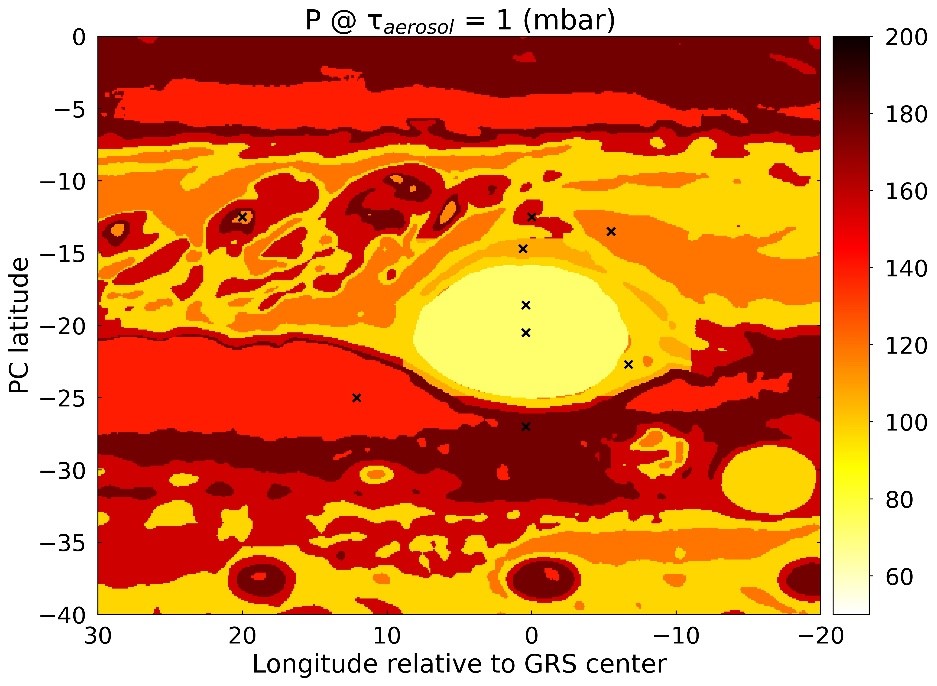
Images taken in filters sensitive to the altitude of the clouds and hazes show that the cloud top of the GRS is higher than its environment. The altitude of the hazes plays a major role in the coloration and dynamics. For example, in the scheme proposed by Carlson et al. (2016) material in the GRS raises to upper pressure levels and undergoes photochemical reactions that lead to the creation of the coloring agent. The amount of material high in the atmosphere would be then a fundamental factor to determine the production rate of chromophore species. Radiative transfer analyses give some insight on the altitude of the clouds and hazes. In Figure 2, we show maps of cloud top effective altitudes obtained from radiative transfer spectral modeling, as shown in Anguiano-Arteaga et al. (2021, 2022). However, radiative transfer analyses cannot provide some important information on the hazes, such as chromophore production rates or timescales of the undergoing atmospheric processes (e.g., coagulation, condensation and sedimentation). Because of this, microphysical considerations should be also taken into account in order to get a more complete description of the nature, structure and evolution of the hazes.


Figure 2. Map of the GRS area in December 2016 showing the pressure levels (in mbar) where the optical depth at 900 nm equals unity. This map is interpreted as the cloud top effective altitude.

Microphysical study

In this work, we perform microphysical simulations of the GRS hazes in the stratosphere and upper troposphere (P < 500 mbar). For this purpose, we develop a 1-D numerical code that takes into account the effects of particle sedimentation, coagulation, eddy diffusion and aerosol growth by molecular condensation. We report here results on the particle size distribution as a function of altitude, together with aerosol concentrations and timescale analysis regarding different microphysical processes. This constrains the mass production rates required to explain the chromophore model and hence serves as a test for any given proposed candidate. The results are interpreted according to prior findings following radiative transfer analysis on the GRS.

References

- Anguiano-Arteaga, A., Pérez-Hoyos, S., Sánchez-Lavega, A., Sanz-Requena, J. F., & Irwin, P. G. J. (2021). Vertical distribution of aerosols and hazes over Jupiter's Great Red Spot and its surroundings in 2016 from HST/WFC3 imaging. J. Geophys. Res. Planets., 126, e2021JE006996 https://doi.org/10.1029/2021JE006996

- Anguiano-Arteaga, A., Pérez-Hoyos, S., Sánchez-Lavega, A., Sanz-Requena, J. F., & Irwin, P. G. J. (2022). Temporal variations in vertical cloud structure of Jupiter’s Great Red Spot, its surroundings and oval BA from HST/WFC3 imaging. Submitted to J. Geophys. Res. Planets.

- Carlson, R.W., Baines, K.H., Anderson, M.S., Filacchione, G., & Simon, A.A. (2016). Chromophores from photolyzed ammonia reacting with acetylene: Application to Jupiter’s Great Red Spot. Icarus, 274, 106-115. https://doi.org/10.1016/j.icarus.2016.03.008

- Sromovsky, L.A., Baines, K.H., Fry, P.M., & Carlson, R.W. (2017). A possibly universal red chromophore for modeling color variations on Jupiter. Icarus, 291, 232-244. https://doi.org/10.1016/j.icarus.2016.12.014

How to cite: Anguiano-Arteaga, A., Pérez-Hoyos, S., and Sánchez-Lavega, A.: Formation and structure of hazes over Jupiter’s Great Red Spot, Europlanet Science Congress 2022, Granada, Spain, 18–23 Sep 2022, EPSC2022-324, https://doi.org/10.5194/epsc2022-324, 2022.

13:10–13:20
|
EPSC2022-355
Thibault Cavalié, Ladislav Rezac, Raphael Moreno, Emmanuel Lellouch, Thierry Fouchet, Bilal Benmahi, Thomas K. Greathouse, James A. Sinclair, Vincent Hue, Paul Hartogh, Michel Dobrijevic, Nathalie Carrasco, and Zoé Perrin

Jupiter's stratospheric chemistry and dynamics are poorly understood as a function of latitude. The Shoemaker-Levy 9 comet impacts in Jupiter's atmosphere in 1994 have offered us with a unique means to characterize Jupiter's stratospheric chemistry and dynamics. We can indeed use the delivery at 44°S of the long-lived species HCN, CO, H2O, and CS and the subsequent temporal evolution of their spatial distribution as constraints for vertical and meridional mixing, zonal winds and chemistry as a function of latitude. 
We mapped HCN and CO in Jupiter's stratosphere with ALMA in March 2017. These observations have already been used in Cavalié et al. (2021) and Benmahi et al. (2021) to derive the stratospheric zonal wind field. In this paper, we use the same observations to retrieve the vertical and meridional distributions of HCN and CO, almost 25 years after the comet impacts. We will present the spatial distributions of both species and discuss the implications on Jupiter's stratospheric chemistry, and vertical and horizontal mixing.

How to cite: Cavalié, T., Rezac, L., Moreno, R., Lellouch, E., Fouchet, T., Benmahi, B., Greathouse, T. K., Sinclair, J. A., Hue, V., Hartogh, P., Dobrijevic, M., Carrasco, N., and Perrin, Z.: ALMA observations of the spatial distribution of CO and HCN in the stratosphere of Jupiter, Europlanet Science Congress 2022, Granada, Spain, 18–23 Sep 2022, EPSC2022-355, https://doi.org/10.5194/epsc2022-355, 2022.

13:20–13:30
|
EPSC2022-427
|
ECP
Sho Shibata, Ravit Helled, and Hiroshi Kobayashi

Introduction

The detailed observations by the NASA Juno spacecraft has advanced Jupiter’s interior structure models which can be used to improve our understanding of Jupiter’s origin. In this study, we investigate the potential origin of Jupiter's enriched atmosphere. We revisit the planetesimal accretion during Jupiter’s formation: in previous studies, the planetesimal accretion rate is calculated using N-body simulations that model the swam of planetesimals around proto-Jupiter. It was concluded that the heavy-element enrichment in Jupiter's envelope can be explained by the planetesimal accretion if Jupiter formed in a planetesimal disk that is at least five times more massive than the minimum mass solar nebulae (MMSN). However, this conclusion was inferred under the assumption that the total mass of captured planetesimals linearly increases with the surface density of planetesimals. In reality, in such a massive disk the gravitational interactions between planetesimals and embryos becomes so strong that the initial eccentricity and inclination are excited to 〜0.1 at most. In this study, we investigate this scenario in detail accounting for the change of the eccentricity and inclination of the planetesimals and show its affect off Jupiter’s growth rate and final composition.


Model

Figure 1: The surface density of planetesimals used in this study. This surface density profile is obtained by Kobayashi & Tanaka (2021).


We adopt a planetesimal disk obtained by Kobayashi & Tanaka (2021) where the collisional evolution of dust grains in the protoplanetary disk results in a dense-compact planetesimal disk because of pebble drift from the outer disk. Figure 1 shows the surface density profile of planetesimals we use in this study. We start the N-body simulations with a swam of planetesimals around proto-Jupiter which enters the runaway gas accretion phase and increases its mass from 10 M to 318 M. During its formation, we assume that proto-Jupiter slightly migrates inward due to type II migration. If a planetesimal collides on the surface of proto-Jupiter or loses its escape energy from Jupiter's Hill sphere, we assume that the planetesimal is captured by proto-Jupiter.

We set the initial eccentricities and inclinations of planetesimals as input parameters. Since the choice of the planetesimal’s size can significantly affect the accretion rate we consider various planetesimal sizes.


Results

Figure 2: The cumulative mass of captured planetesimals as a function of time. Black, red, green and blue lines show correspond to different assumed initial eccentricities of ‹e01/2=10-3,10-2,10-1, and 0.4, respectively. The initial inclination is set as   ‹i01/2=0.5‹e01/2.


In a massive planetesimal disk, proto-Jupiter accretes tens Earth-masses of heavy elements by the end of runaway gas accretion. Figure 2 shows the cumulative mass of captured planetesimals vs. time. We find that the increase of the initial eccentricity and inclination:

  • weakens resonant trapping and leads to an enhancement of planetesimal accretion,
  • reduces the capture probability of planetesimals.

Due to the combination of these effects, the captured mass of planetesimals decreases with the increase of the initial eccentricity and inclination.


Discussion

Figure 3: Total mass of captured planetesimals as a function of planetesimal size and the initial eccentricity. The initial inclination is set as   ‹i01/2=0.5‹e01/2. The solid and dashed black line shows the equilibrium eccentricity of planetesimals with and without embryos, respectively.


The initial eccentricity and inclination of planetesimals are determined by the scattering from other planetesimals/embryos. In a massive planetesimal disk as assumed here, embryos other than proto-Jupiter would form and be in the “oligarchic regime”. Considering the eccentricity and inclination excitation from the embryos, we conclude that the total mass of captured planetesimals is about 5-10 M, and is larger for larger planetesimals.

The bulk metallicity of Jupiter is still a matter of debate (e.g., Stevenson 2020). Planetesimal accretion could explain structure models with ~10 M of heavy elements in Jupiter’s outer envelope. However, if Jupiter’s enrichment is found to be higher, as suggested by some structure models (e.g., Miguel et al. 2022), an additional enrichment mechanism would be required. Such an enrichment could be a result of giant impacts of embryos. Such impacts have been suggested by Liu et al. (2019) for the formation of Jupiter’s fuzzy core.

We also compare our results with those presented by Shibata & Helled (2022), where planetesimal accretion was considered for the case of a migrating Jupiter from 20 au to 5 au. We find that the timing of planetesimal accretion must occur earlier for the in-situ formation case, which enriches Jupiter's interior rather than the outer envelope or atmosphere. We suggest that a determination of the heavy-element distribution in Jupiter’s envelope could constrain Jupiter’s formation location and formation history.


References

Kobayashi, H., & Tanaka, H. 2021, ApJ, 922, 16, doi: 10.3847/1538-4357/ac289c

Liu, S.-F., Hori, Y., M ̈uller, S., et al. 2019, Nature, 572, 355, doi: 10.1038/s41586-019-1470-2

Miguel, Y., Bazot, M., Guillot, T., et al. 2022, arXiv e-prints, arXiv:2203.01866. https://arxiv.org/abs/2203.01866

Shibata, S., & Ikoma, M. 2019, MNRAS, 487, 4510, doi: 10.1093/mnras/stz1629

Shibata, S., & Helled, R. 2022, ApJL, 926, L37, doi: 10.3847/2041-8213/ac54b1

Stevenson, D. J. 2020, Annu. Rev. Earth Planet. Sci., 48, 465


How to cite: Shibata, S., Helled, R., and Kobayashi, H.: Revisiting Planetesimal Accretion onto Proto-Jupiter, Europlanet Science Congress 2022, Granada, Spain, 18–23 Sep 2022, EPSC2022-427, https://doi.org/10.5194/epsc2022-427, 2022.

Lunch break
Chairperson: Jack Connerney
15:30–15:40
|
EPSC2022-475
|
MI
Leigh Fletcher, Fabiano Oyafuso, Glenn Orton, Zhimeng Zhang, Shawn Brueshaber, Michael Wong, Cheng Li, Alessandro Mura, Davide Grassi, Henrik Melin, Steve Levin, Scott Bolton, John Rogers, and Shannon Brown

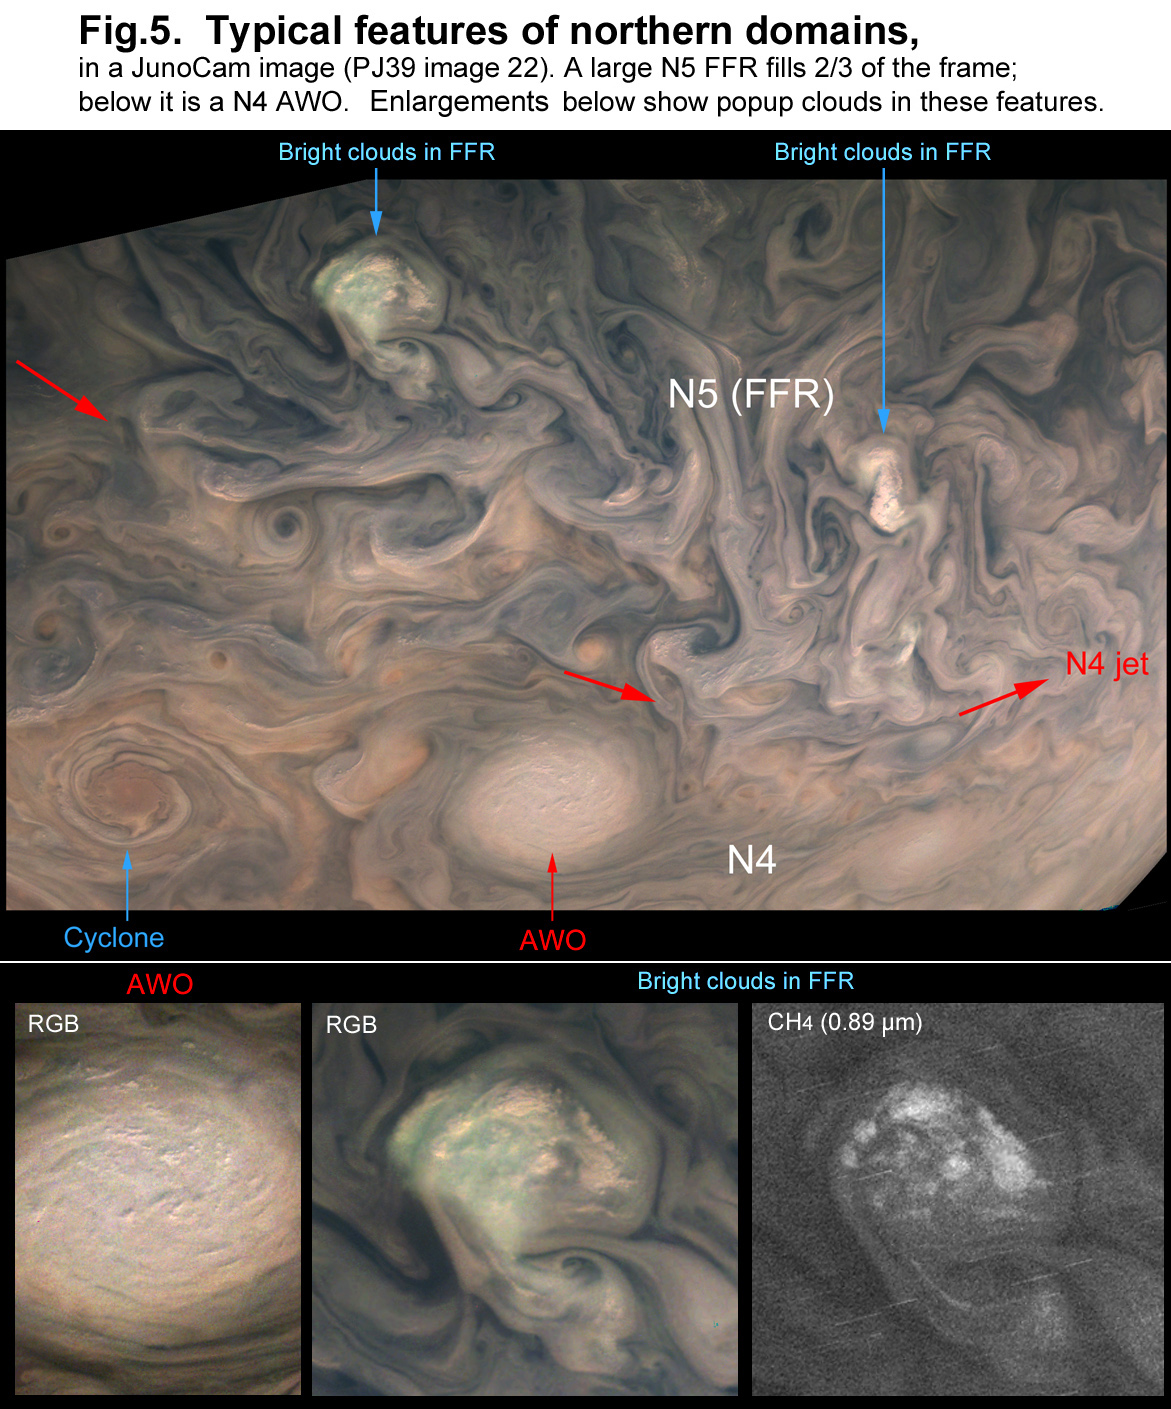
Jupiter’s cyclonic features are known to undergo transitions between quiescent states with smooth edges (often appearing as dark brown ‘barges’) to states with convective outbursts of billowing white clouds, chaotically churned into filamentary structures.  Cyclones in the latter state are known as ‘Folded Filamentary Regions’ (FFRs), and Voyager images (Ingersoll+1979, doi: 10.1038/280773a0) revealed them to be rapidly-varying turbulent regions, occurring in cyclonic domains on the poleward side of Jupiter’s prograde jets.  JunoCam visible-light observations (Orton+2017, doi:10.1002/2016GL072443, Rogers+2021, doi:10.1016/j.icarus.2021.114742), reveal the increasing prevalence of FFRs at mid-to-high latitudes.  They dominate the polar domain alongside smaller anticyclonic white ovals, drifting westward in latitude bands between the narrow prograde jets, and rapidly evolving over timescales of days. 

The present study makes use of Juno’s ever-improving microwave observations of the north polar domain, as the latitude of closest-approach (“perijove”) moves northward.  We therefore focus on FFRs in the northern hemisphere, where we find them to occur in zonally-organised latitude bands even at high latitudes.  Statistics of the FFRs suggest that they occur on the poleward sides of the N4 (43.3oN, centric), N5 (52.3oN), and N7 (66.1oN) prograde jets (N6 at 61.2oN coincides with a ‘bland zone’ lacking notable FFRs), and scattered in the polar domain up to the octagon of circumpolar cyclones at 85oN.  JIRAM 5-µm imaging of both poles reveal FFRs as generally dark structures with elevated aerosol opacity blocking thermal infrared emission from the 4-6 bar level, coinciding with the white stratiform clouds observed by JunoCam. Clusters of small cumulus-like clouds, as well as curvilinear cloud streaks, provide texture to the flat stratiform clouds to give the appearance of a network of filaments.  Visibly-dark lanes border the brighter filaments, creating an intricate network of narrow, aerosol-free, and 5-µm-bright striations within each FFR.  This is in contrast to cyclonic features such as barges at lower latitudes, where an absence of overlying aerosols generally renders them 5-µm bright. 

A survey of 1.4-50 cm observations acquired by Juno’s Microwave Radiometer (MWR) between PJ20 (May 2019) to PJ37 (October 2021) reveals that FFRs share a key characteristic with their low-latitude counterparts:  they are microwave-bright in channels sounding the 0.6-2.0 bar range (1.4-3.0 cm), become hard to distinguish from their surroundings near 5 bars (5.75 cm), but are then microwave-dark in the channel sounding 10-15 bar (11.5 cm). This suggests FFRs are depleted in ammonia gas and/or locally warmer at levels above the putative location of Jupiter’s water cloud, the latter implying a decay of cyclonic winds with altitude.  This shallow ammonia depletion is surprising, given the apparent convective nature of the FFRs - maybe NH3-rich plumes occupy a sufficiently small area of the cyclonic structure, so that they have negligible impact on the warm emission observed by MWR.  This shallow depletion is balanced by a local NH3 enrichment (or local cooling) at depth, below the water cloud, like a cyclonic lens.  However, the extension of FFR signatures to deeper levels (p>20 bars) is currently unclear due to insufficient spatial coverage and resolution at the longest-wave channels, and confusion arising from auroral contributions to the MWR dataset at 50 cm.  

An inversion in microwave brightness with depth was previously identified for Jupiter’s larger-scale belts and zones (Fletcher+2021, doi:10.1029/2021JE006858) and mid-latitude discrete features (Bolton+2021, doi:10.1126/science.abf1015), and now appears to be common at high latitudes as well.  Geostrophy implies that cyclonic circulations (low-pressure centers) cause a rise in potential-temperature surfaces in deeper layers, potentially triggering moist convection in the water cloud (e.g., Dowling & Gierasch, 1989 Bull. Amer. Astron. Soc 21, 946; Fletcher+2017, doi:10.1016/j.icarus.2017.01.001), producing the distinct convective cloud structure observed by visible and infrared imaging: juxtaposed tall convective towers, deep water clouds, and narrow clear lanes (Imai+2020, doi:10.1029/2020GL088397). Lightning sferics measured by MWR at 50 cm/600 MHz are more frequent in the N4, N5, and N7 domains where FFRs are common (Brown+2018, doi:10.1038/s41586-018-0156-5), and are further clustered in FFRs themselves (Wong+2020, doi:10.3847/1538-4365/ab775f).  Thus the evolution of the cyclonic FFRs, and their penetration to the moist depths below the water condensation level, may hold the key to understanding the distribution of lightning activity on Jupiter.

How to cite: Fletcher, L., Oyafuso, F., Orton, G., Zhang, Z., Brueshaber, S., Wong, M., Li, C., Mura, A., Grassi, D., Melin, H., Levin, S., Bolton, S., Rogers, J., and Brown, S.: Juno Characterisation of Cyclonic “Folded Filamentary Regions” within Jupiter’s Polar Domains, Europlanet Science Congress 2022, Granada, Spain, 18–23 Sep 2022, EPSC2022-475, https://doi.org/10.5194/epsc2022-475, 2022.

15:40–15:50
|
EPSC2022-534
|
ECP
Corentin Louis, Caitriona Jackman, Aoife O’Kane Hackett, Elliot Devon-Hurley, William Kurth, George Hospodarsky, Philippe Louarn, Frederic Allegrini, John Connerney, Dale Weigt, Sean McEntee, Alexandra Fogg, James Waters, and Scott Bolton

During its 53-day polar orbit around Jupiter, Juno often crosses the boundaries of the Jovian magnetosphere, namely the magnetopause and bow shock, as well as the plasma disc (located at the centrifugal equator). The positions of the magnetopause and bow shock allow us to determine the dynamic pressure of the solar wind (using both the updated model of Joy et al. 2002 by Ranquist et al., 2020 and/or in situ data) which allows us to infer magnetospheric compression or relaxation, while the observations of plasma disc perturbations allows us to infer magnetospheric reconfigurations.

The aim of this study is to examine Jovian radio emissions during magnetospheric perturbations. We then use our analysis to determine the relationship between the solar wind and Jovian radio emissions (observed and emitted from different regions of the magnetosphere, from different mechanisms, and at different wavelengths from kilometers to decameters).

In this presentation, we show case studies for each typical case (bow shock, magnetopause and plasma disk crossings) and show that the activation of new radio sources is related to magnetospheric disturbances. By performing a statistical study of these crossings, we hope to be able to show the relationship between the activation of new radio sources (emission intensity and extension, source positions) and the solar wind (dynamic pressure, magnetic intensity, ...), with the aim of being able to use observations of planetary radio emission as a proxy for the solar wind.

How to cite: Louis, C., Jackman, C., O’Kane Hackett, A., Devon-Hurley, E., Kurth, W., Hospodarsky, G., Louarn, P., Allegrini, F., Connerney, J., Weigt, D., McEntee, S., Fogg, A., Waters, J., and Bolton, S.: Effect of magnetospheric disturbances on Jovian radio emissions: an in situ case study from Juno data, Europlanet Science Congress 2022, Granada, Spain, 18–23 Sep 2022, EPSC2022-534, https://doi.org/10.5194/epsc2022-534, 2022.

15:50–16:00
|
EPSC2022-535
|
ECP
Deborah Bardet, Padraig Donnelly, Leigh N. Fletcher, Arrate Antuñano, Michael T. Roman, Glenn S. Orton, Sandrine Guerlet, Henrik Melin, and Jake Harkett


Ground- and space-based remote sensing, from Voyager, to Galileo, Cassini and Juno, has revealed the existence of circulation cells in the troposphere of Jupiter. These circulation cells, which may be similar to terrestrial Ferrel cells [1], show properties that vary significantly as a function of depth, showing circulations of opposing directions above and below the expected level of the water condensation cloud near 4-6 bar [2]. Moreover, the location of each vertical branch of the Ferrel-like cells are correlated to the Jupiter's temperature belt/zone contrast, suggesting a dynamical and thermal link between winds, temperatures, aerosols, and composition. 

To provide infrared support for Juno spacecraft observations, we have been observing Jupiter with the VISIR mid-infrared instrument on the Very Large Telescope (VLT) since 2016.  We analyse images at multiple wavelengths between 5 and 20 µm  to study the thermal, chemical and aerosol structure of Jupiter's belts, zones, and polar domains. In particular, an observing run in May 2018 (conciding with Juno's 13 perijove) provided global coverage of Jupiter in  thirteen narrow-band filters.  These data sense stratospheric temperature (7.9 µm), tropospheric temperature via the collision-induced hydrogen-helium continuum (13, 17.6, 18.6, 19.5 µm), aerosol opacity (8.6 and 8.9 µm), and the distribution of ammonia gas (10.5, 10.7 and 12.3 µm).  These wavelengths primarily sound the upper troposphere at p<0.7 bar, above the cloud tops, so are sensitive to the upper cell of the belt/zone Ferrel-like circulations.  By stacking the data in all 13 filters, we invert the data using the optimal-estimation retrieval algorithm NEMESIS [3] to derive temperature, aerosol and chemical structure over the whole planet. Meridional gradients of temperature, wind shear (derived from thermal balance equation) and chemical species will be examined to understand the upper-tropospheric circulation cells.  

We confirm that the pattern of cool anticyclonic zones and warm cyclonic belts persists throughout the mid-latitudes, up to the boundary of the polar domains.  This implies, via thermal wind balance, the decay of the zonal jets as a function of altitude throughout the upper troposphere. Aerosol opacity is often (but not always) highest in the anticyclonic zones, suggesting condensation of saturated vapours, but we caution that aerosol opacity is not a good proxy for atmospheric circulation on any giant planet.  The thermal and compositional gradients derived from the VISIR maps are consistent with those from Voyager and Cassini, but opposite to what would be inferred for the Ferrel-like circulations of the deeper cell of [1], which was suggested by [2] to exist only below the water-cloud layer based on Juno microwave observations.

Concerning the Jovian polar regions, the analysis of VISIR imaging shows a large region of mid-infrared cooling poleward ~67˚S, co-located with the reflective aerosols observed in methane-band imaging by JunoCam, suggesting that they play a key role in the radiative cooling at the poles, and that this cooling extends from the upper troposphere into the stratosphere.  These VISIR observations also reveal thermal contrasts across polar features, such as numerous cyclonic and anticyclonic vortices, as well as evidence of high-altitude heating by auroral precipitation. Comparison of zonal mean thermal properties and high-resolution visible imaging from Juno allows us to study the variability of atmospheric properties as a function of altitude and jet boundaries, particularly in the cold southern polar vortex.  To investigate the radiative processes and influence of auroral precipitation on the southern cold vortex, a radiative-convective model tailored for Jupiter's atmosphere [4], with an updated polar aerosol distribution from Juno mission results, will be used to determine the aerosol distribution needed to reproduce the thermal structure of the cold polar vortex of Jupiter.   


[1] Duer, K., Gavriel, N., Galanti, E., Kaspi, Y., Fletcher, L. N., Guillot, T., Bolton, S. J., Levin, S. M., Atreya, S. K., Grassi, D., Ingersoll, A. P., Li, C., Li, L., Lunine, J. I., Orton, G. S., Oyafuso, F. A., Waite, J. H.: Evidence for Multiple Ferrel-Like Cells on Jupiter, Geophysical Research Letters, 2021.


[2] Fletcher, L. N., Oyafuso, F. A., Allison, M., Ingersoll, A., Li, L., Kaspi, Y., Galanti, E., Wong, M. H., Orton, G. S., Duer, K., Zhang, Z., Li, C., Guillot, T., Levin, S. M., Bolton, S: Jupiter's Temperate Belt/Zone Contrasts Revealed at Depth by Juno Microwave Observations, Journal of Geophysical Research: Planets, 2021

[3] Irwin, P. G. J., Teanby, N. A., de Kok, R., Fletcher, L. N., Howett, C. J. A., Tsang, C. C. C., Wilson, C. F., Calcutt, S. B., Nixon, C. A., Parrish, P. D.: The NEMESIS planetary atmosphere radiative transfer and retrieval tool, Journal of Quantitative Spectroscopy & Radiative Transfer, 2008


[4] Guerlet, S., Spiga, A., Delattre, H., Fouchet, T.: Radiative-equilibrium model of Jupiter's atmosphere and application to estimating stratospheric circulations, Icarus, 2020

How to cite: Bardet, D., Donnelly, P., Fletcher, L. N., Antuñano, A., Roman, M. T., Orton, G. S., Guerlet, S., Melin, H., and Harkett, J.: Investigating Thermal Contrasts Between Jupiter's Belts, Zones, and Polar Vortices with VLT/VISIR, Europlanet Science Congress 2022, Granada, Spain, 18–23 Sep 2022, EPSC2022-535, https://doi.org/10.5194/epsc2022-535, 2022.

16:00–16:10
|
EPSC2022-855
Olivier Mousis, Antoine Schneeberger, Jonathan Lunine, Christopher Glein, Alexis Bouquet, Steven Vance, and Vassilissa Vinogradoff

A key feature among the Galilean satellites is their monotonic decrease in density, indicating an ice fraction that is zero in the innermost moon Io, and about half in the outer moons Ganymede and Callisto. So far, there is no formation scenario that explains this gradient while considering the moons grew in a water-depleted circumplanetary disk. Here, we investigate the possibility that the jovian circumplanetary disk was fueled with ice-free chondritic minerals, including phyllosilicates. To do so, we use a standard one-dimensional gas-starved accretion disk model derived from the literature [1, 2] coupled with gas and solids transport modules [3, 4] to investigate the evolution of vapors released by the dehydration of phyllosilicates. We show that the dehydration of such particles and the outward diffusion of the released water vapor allows condensation of significant amounts of ice in the formation region of Ganymede and Callisto in the Jovian circumplanetary disk. This mechanism naturally explains the presence of ice-rich moons around a water-depleted Jupiter.

[1] Canup, R.M., Ward, W.R. 2002. Formation of the Galilean Satellites: Conditions of Accretion. The Astronomical Journal 124, 3404–3423. doi:10.1086/344684

[2] Sasaki, T., Stewart, G.R., Ida, S. 2010. Origin of the Different Architectures of the Jovian and Saturnian Satellite Systems. The Astrophysical Journal 714, 1052–1064. doi:10.1088/0004-637X/714/2/1052

[3] Birnstiel, T., Klahr, H., Ercolano, B. 2012. A simple model for the evolution of the dust population in protoplanetary disks. Astronomy and Astrophysics 539. doi:10.1051/0004-6361/201118136

[4] Anderson, S.E., Mousis, O., Ronnet, T. 2021. Formation Conditions of Titan's and Enceladus's Building Blocks in Saturn's Circumplanetary Disk. The Planetary Science Journal 2. doi:10.3847/PSJ/abe0ba

How to cite: Mousis, O., Schneeberger, A., Lunine, J., Glein, C., Bouquet, A., Vance, S., and Vinogradoff, V.: The role of phyllosilicates in shaping the Galilean moons' density gradient, Europlanet Science Congress 2022, Granada, Spain, 18–23 Sep 2022, EPSC2022-855, https://doi.org/10.5194/epsc2022-855, 2022.

16:10–16:20
|
EPSC2022-267
J. Hunter Waite, Philip Valek, Thomas Greathouse, Frederic Allegrini, Robert Ebert, Randall Gladstone, and Scott Bolton

Measurements by Juno as the spacecraft flew by Ganymede on June 7th of 2021 from the JADE instrument when combined with images from UVS of the aurora can be used to significantly advance our knowledge of the atmosphere and ionosphere. JADE measures the ion outflow composition that results from downgoing plasma electrons in the polar cap region and also measures the downward electrons associated with the reconnection at the boundary of Ganymede’s magnetosphere with the Jupiter magnetosphere. Modeling can help to check the consistency between the electron energy influx in the polar cap and the resulting ionospheric outflow and can also be used to set constraints on how reconnected electrons form the auroral atmosphere and the auroral emissions measured by UVS.

How to cite: Waite, J. H., Valek, P., Greathouse, T., Allegrini, F., Ebert, R., Gladstone, R., and Bolton, S.: What the JADE electron and ionospheric measurements told us about the aurora and atmosphere of Ganymede, Europlanet Science Congress 2022, Granada, Spain, 18–23 Sep 2022, EPSC2022-267, https://doi.org/10.5194/epsc2022-267, 2022.

16:20–16:30
|
EPSC2022-719
|
ECP
Yasmina M Martos, Norberto Romanelli, Jared Espley, Jack Connerney, and Stavros Kotsiaros

On June 7, 2021 Juno performed a close flyby of Ganymede. Here we study the high-resolution magnetic field spectrum which indicates that Juno travelled within Ganymede’s closed magnetic field line region for around 3 minutes during the closest approach. This result is supported by two main facts. 1) The harmonic structure in the spectrum of the high-resolution magnetometer data agrees very well with the frequencies predicted for resonances of a dipole field. 2) The inferred plasma density near the equator at 1.7 RG (L-shell of the closest approach) is approximately 25 amu/cm3, which is much lower than the local density of the plasma sheet near Ganymede (~100 amu/cm3). We also discuss our results together with those obtained by other Juno instruments and theoretical models.

How to cite: Martos, Y. M., Romanelli, N., Espley, J., Connerney, J., and Kotsiaros, S.: Field line resonances in Ganymede’s magnetosphere observed by Juno, Europlanet Science Congress 2022, Granada, Spain, 18–23 Sep 2022, EPSC2022-719, https://doi.org/10.5194/epsc2022-719, 2022.

16:30–16:40
|
EPSC2022-691
Francesca Zambon, Alessandro Mura, Julie Rathbun, Rosaly Lopes, Federico Tosi, Roberto Sordini, Raffaella Noschese, Alberto Adriani, Mauro Ciarniello, Gianrico Filacchione, Davide Grassi, Giuseppe Piccioni, Christina Plainaki, Giuseppe Sindoni, Diego Turrini, Shawn Brooks, Candice Hansen-Koharcheck, and Scott Bolton

Io is the Solar System body showing the largest number of active volcanic centers, primarily generated by tidal heating [1]. Many ground based and remote sensing observations have revealed spatial and temporal variabilities, important to define the characteristics of tidal heating and the mechanisms by which heat escapes from the interior [2, 3, 4].

The Jovian Infrared Auroral Mapper (JIRAM), the imager/spectrometer onboard JUNO mission, mainly devoted to the study of Jupiter’s atmosphere, had the opportunity to acquire data of the Galilean satellites, including Io. JIRAM is composed of a slit spectrometer covering a range of wavelengths between 2 and 5 μm and an imager equipped with two filters, L and M, centered at 3.4 and 4.7 μm, respectively [1]. 

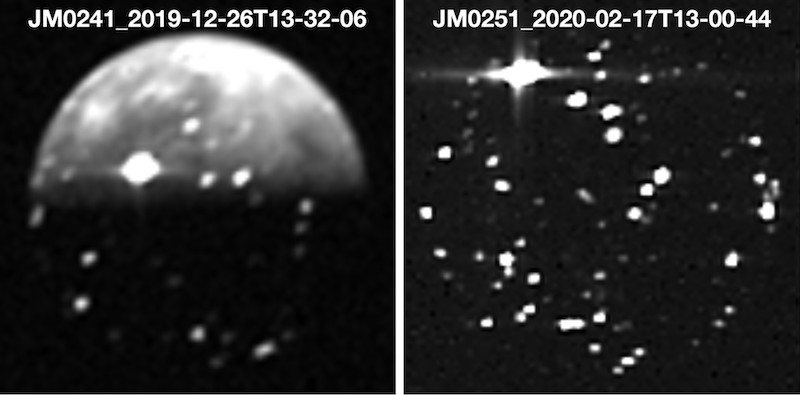
In this work, we mapped the Io hot spots by using JIRAM M filter images from orbits 7, 9, 10, 16, 17, 18, 20, 24, 25, 26, 27, 32, 33, with a spatial scale ranging from ∼ 48 up to ~150 km/pixel (Fig. 1), updating the work by [5]. For each orbit, we consider a set of images (referred to as “super images”) which contain the average radiance of several JIRAM contiguous observations. This approach minimizes the effects due to spurious pixels, reducing the detection of false hot spots [5].

JIRAM data cover almost the entire surface of Io, with a redundancy up to 43 super images per pixel in the northern and equatorial regions (Fig. 2), improving the observations of the polar areas. To identify Io hot spots, we first filtered each super image for emission angles > 75°. Then, since JIRAM data have been acquired at different incidence angles, including Io dayside, nightside, and eclipse (Fig. 1), to select the hot spots, we divided the images in three categories: day (i≤ 70°), dawn/dusk (70° < i < 90°) and night i≥ 90°. For each super image, we calculated the median value of the radiance for the dayside, nightside and dawn/dusk background. Hence, we considered as hot spots’ detection limit the radiance values larger than the median radiance for the night side, and median background radiance plus 0.003 for dawn/dusk and day side. 

We identified 242 hot spots, many of which had already been included in other databases (e. g. [6, 7, 8, 9]). Among the hot spots revealed by JIRAM, 24 have not been observed before, and half of these are located at the poles.  The comparison between our results and the last Io global heat flow power output map published by [8] suggests that the highest power heat flow hot spots are still active, indicating their activity lasts for decades or more, while a large part of the intermediate power heat flow hot spots are still present, as only 15 of them are not included in our map. We found the larger discrepancies in the lower heat flow hot spots, given that many of those listed as active by [8] have not been observed by JIRAM. 

The study of Io hot spots variation and distribution, is worthwhile in helping to constrain the interior models and the magma distribution in its subsurface. The Io hot spots map presented here is the most up-to-date one produced by remote sensing datasets. The future JIRAM higher spatial resolution observations will be fundamental to extend and confirm our results, better distinguish close hot spots and improve our overall knowledge of Io volcanic processes and evolution.

Figure 1: Example of Io JIRAM M filter images for the orbits JM 24 and 25.

Figure 2: JIRAM M filter data coverage of Io for JIRAM orbits 10, 11, 16, 17, 18, 20, 24, 25, 26, 27, 32, 33.

Acknowledgments

This work is supported by Agenzia Spaziale Italiana (ASI). JIRAM is funded by ASI contract 2016-353 23-H.0. 

References

[1] Peale, S. J.,  et al., 1979, Science, 203. [2] Davies et al., 2015, Icarus, 262. [3] de Kleer et al., 2019, The Astronomical Journal, 158. [4] Adriani et al., 2017, Space Science Review, 213. [5] Mura, A., et al., 2020, Icarus, 241. [6] Lopes and Spencer, Eds, 2007, Praxis-Springer. [7] Williams, D. A., et al., 2011, Icarus, 214. [8] Veeder, G. J., et al., 2015, Icarus, 245. [9] Cantrall, C., et al., 2018, Icarus, 312.

How to cite: Zambon, F., Mura, A., Rathbun, J., Lopes, R., Tosi, F., Sordini, R., Noschese, R., Adriani, A., Ciarniello, M., Filacchione, G., Grassi, D., Piccioni, G., Plainaki, C., Sindoni, G., Turrini, D., Brooks, S., Hansen-Koharcheck, C., and Bolton, S.: Io hot spots detection as revealed by JUNO/JIRAM data, Europlanet Science Congress 2022, Granada, Spain, 18–23 Sep 2022, EPSC2022-691, https://doi.org/10.5194/epsc2022-691, 2022.

16:40–16:50
|
EPSC2022-733
|
ECP
|
MI
Shawn Brueshaber, Glenn Orton, Zhimeng Zhang, Fabiano Oyafuso, Alessandro Mura, Davide Grassi, Gerald Eichstadt, Candice Hansen, Leigh Fletcher, Shinji Mizumoto, Thomas Momary, Steve Levin, and Scott Bolton

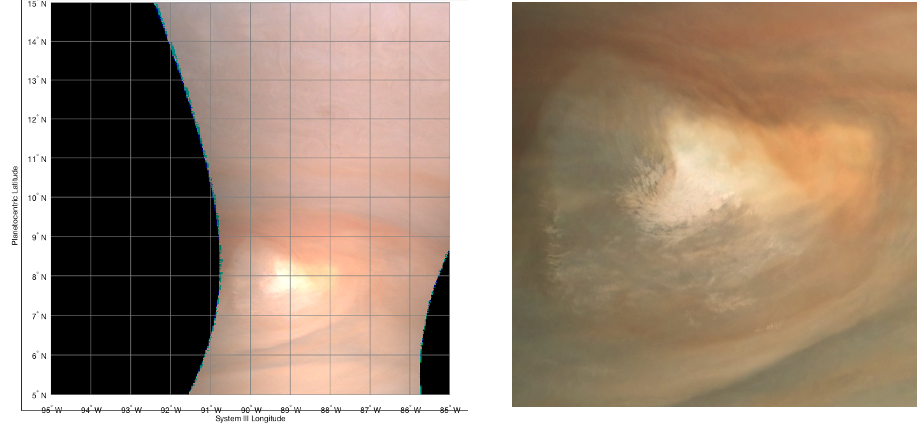
The Juno spacecraft’s polar orbit with periapses (perijove; PJ) within a few thousand kilometers of the 1-bar level has allowed for detailed observations of Jupiter’s thunderstorms from multiple instruments at unprecedented resolution.  Here, we detail the observations of a 2,500-km wide thunderstorm feature located in the North Equatorial Belt (at planetocentric latitude 9°N; Fig. 1) from the six channels of the Microwave Radiometer Instrument (MWR), from JunoCam’s RGB filters, from the Jovian Infrared Auroral Mapper’s (JIRAM) 5-micron band, and from supporting Earth-Based images taken during near the time of the 38th perijove. Juno flew over one such thunderstorm complex at close range (~5,000 km) on 29 Nov. 2021 for the first time with a favorable alignment to observe such a feature at low emission angles. JunoCam and MWR observations were taken nearly simultaneously while JIRAM’s data was collected approximately 4.5 hours prior. 

Moist convection is widely thought to play a large role in transporting heat from Jupiter’s interior through the weather layer (here defined as 10 to 0.7 bar) and then to space. In the process, heat transport allows for moist convection, which powers thunderstorms and generates small-scale turbulence that, through the inverse-cascade mechanism, generates large-scale vortices and zonal jets.  Convective instability allows for strong updrafts that carry volatiles such as NH3 and H2O from the base of the water-cloud (and deeper) upwards to form cumulonimbus (CB) clouds.  The tops of these CB towers diverge outwards and are shaped by local winds to form an icy anvil cloud much as they do on Earth.


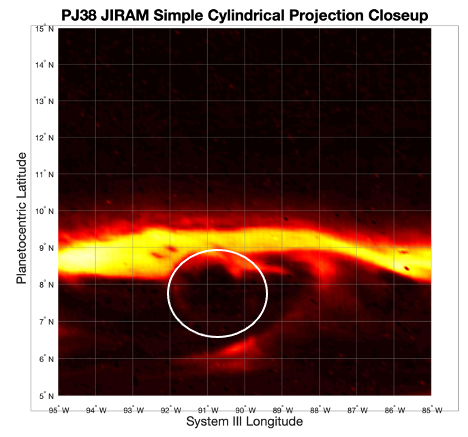
Lightning is a defining characteristic of CB clouds and the MWR instrument detected numerous flashes in and around the bright white feature with a storm-like morphology clearly observed by JunoCam. JIRAM’s M-band filter images clearly show the structure of the cloud tops, matching observations from JunoCam once the zonally-averaged motion over the 4.5-hour time separation is accounted for. Figure 2 is a JIRAM image with a noticeable dark ‘notch,’ which is where the optically thick storm clouds are located. Preliminary spectral analysis from JIRAM shows a slightly enhanced signal of H2O and PH3 near the anvil top but NH3 ice is undetectable in these night-time JIRAM observations.


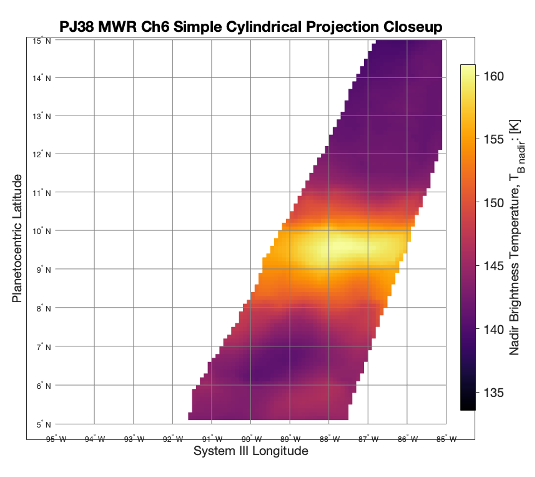
Gaseous NH3 and H2O are partially opaque to wavelengths sensed by the MWR instrument.  Each of the six channels of MWR have a sensitivity that peaks at different altitudes in the atmosphere, which allows us to sound the brightness temperature and the vertical structure from the cloud tops down to many tens of bars.  The brightness temperature is a combination of air temperature and humidity, and, at present, we are unable to deconvolve these two measurements. Nevertheless, sounding the brightness temperature provides information on the depth and structure of a tall atmospheric feature and we present brightness temperature maps for all six channels.

We observe that this particular thunderstorm complex is visible from the cloud tops (~0.7 bar) down to approximately the level of the water cloud. Below this level, the thunderstorm signal is no longer apparent, which indicates that any dry convective updraft carrying MWR opacity-inducing vapor is either not present, or its air temperature and humidity are combined in such a way to mask its presence perfectly. If this thunderstorm is a result of dry convection from below the base of the water cloud lifting moist air to the level of free convection (LFC) then the effect of the dry convection is to lift vapor already located around the base of the water-cloud level rather than bringing up significantly moist air from deep below the base of the water cloud, or otherwise a signal would be detected in the short wavelength channels of MWR (See Fig. 3 for a cloud-top MWR map).

The next several perijoves will feature an orientation for the MWR instrument that is conducive for low emission angle observations. Additionally, the latitude of perijove is slowly migrating northward and, if Juno does fly over new thunderstorms, we may have the opportunity to compare the vertical structure of multiple thunderstorms taken from different regions of the planet at high resolution from multiple instruments.

Figure 1: PJ38 Thunderstorm from JunoCam Image JNCE_2021333_38C00030_V01 (left) and close-up  (right: Image Credit: NASA/JPL-Caltech/SwRI/MSSS/Kevin M. Gill)

Figure 2: Map-Projected Processed Close-Up Image of PJ38 Thunderstorm from JIRAM M-Band Image (Image Credit: NASA/JPL-Caltech/INAF-IAPS). Circle denotes location of optically thick storm clouds.

Figure 3: Map-Projected MWR Ch 6 Brightness Temperature

How to cite: Brueshaber, S., Orton, G., Zhang, Z., Oyafuso, F., Mura, A., Grassi, D., Eichstadt, G., Hansen, C., Fletcher, L., Mizumoto, S., Momary, T., Levin, S., and Bolton, S.: Dissecting Jupiter’s Thunderstorms: Results from JIRAM, JunoCam, MWR and Earth-Based Observations, Europlanet Science Congress 2022, Granada, Spain, 18–23 Sep 2022, EPSC2022-733, https://doi.org/10.5194/epsc2022-733, 2022.

16:50–17:00
|
EPSC2022-741
|
ECP
Jamey Szalay, George Clark, George Livadiotis, David McComas, Don Mitchell, Jamie Rankin, Ali Sulaiman, Frederic Allegrini, Fran Bagenal, Rob Ebert, Randy Gladstone, Bill Kurth, Barry Mauk, Phil Valek, Rob Wilson, and Scott Bolton

We present a discrete observation of diverse plasma populations and evidence of closed magnetic topology at Jupiter’s polar cap. Two distinct populations of protons are observed over Jupiter’s southern polar cap: a ~1 keV core population and ~1-300 keV dispersive conic population at 6-7 Jovian radii planetocentric distance. We find the 1 keV core protons are likely the seed population for the higher-energy dispersive conics. Transient wave-particle heating in a “pressure-cooker” process is likely responsible for this proton acceleration. The plasma characteristics and composition during this period show Jupiter's polar-most field lines can be topologically closed, with conjugate magnetic footpoints connected to both hemispheres. Finally, these observations demonstrate energetic protons can be accelerated into Jupiter's magnetotail via wave-particle coupling.

How to cite: Szalay, J., Clark, G., Livadiotis, G., McComas, D., Mitchell, D., Rankin, J., Sulaiman, A., Allegrini, F., Bagenal, F., Ebert, R., Gladstone, R., Kurth, B., Mauk, B., Valek, P., Wilson, R., and Bolton, S.: Closed Fluxtubes and Proton Conics in Jupiter’s Polar Cap, Europlanet Science Congress 2022, Granada, Spain, 18–23 Sep 2022, EPSC2022-741, https://doi.org/10.5194/epsc2022-741, 2022.

Coffee break
Chairperson: Yasmina M Martos
17:30–17:40
|
EPSC2022-761
Glenn Orton, Leigh Fletcher, Fabiano Oyafuso, Cheng Li, Zhimeng Zhang, Shawn Brueshaber, Michael H. Wong, Thomas Momary, Steven Levin, Scott Bolton, Kevin Baines, Emma Dahl, and James Sinclair

The Juno Microwave Radiometer (MWR) has extended our knowledge of the structure and composition of Jupiter's atmosphere down to several hundred bars, revealing meridional variability at great depths (e.g. Li et al. 2017, Fletcher et al. 2021). It has revealed that some cyclonic and anticyclonic vortices may have roots at depths of hundreds of bars of pressure (Bolton et al. 2022), but 5-µm hot spots and associated plumes are restricted to shallow depths above the water cloud (Fletcher et al. 2021). We report ongoing work on evolution of axisymmetric bands, concentrating on two regions where large-scale changes have been observed in the visible and infrared.

One of these is the Equatorial Zone (EZ), for which Figure 1 illustrates a dramatic color change. The color change in the central component (EZc, ~3°S – 1°N, planetocentric latitude) is more prominent than the northern component (EZn, ~2° - 6°N).  This change began in 2018, and by 2019 was as prominent as shown in 2021. In near-infrared bands of strong gaseous absorption, the EZc reflectivity increased dramatically (Fig. 2), but only temporarily for the EZn.

Another region is the northern component of the North Equatorial Belt (NEBn, ~12°N to 15°N), whose change from a visibly dark to a bright region is also illustrated in Figure 1, with the southern component (NEBs, ~7°N to 11°N) remaining its typical dark color.  Figure 3 shows that this color is associated with a remarkable drop of its 5-µm brightness which dropped down to the faint emissions of the nearby cloudy and visually bright zones. This implies a major increase in the opacity of 0.7-5 bar clouds that are similar but more extreme than the quasi-periodic northward expansions of the NEB (Fletcher et al. 2017). This transformation took place in early 2021 when Jupiter was in solar conjunction.

The very preliminary results of our initial examination of MWR observations (Fig. 4) plot antenna temperatures derived using averages over all longitudes sensed in which the center of the field of view lay within specified latitude ranges. Observations were selected only if 99% or more of the field of view included the planet and the emission angle was limited to 65° or less, after which they were converted to a nadir-equivalent emission using limb-darkening models that were fit to every latitude and each channel. All observations were made at close approaches of the spacecraft to Jupiter, known as ‘perijoves’ or PJs. Many perijoves between 2019 and 2022 did not contain any measurements of these regions meeting those selection criteria, due to unfavorable spacecraft pointing. Exceptions included special spacecraft orientations.    

The EZc appears invariable in time, but the EZn underwent a ~7K drop in Channel-3 antenna temperatures - sensitive to conditions near ~9 bars - starting in early 2017, reaching a minimum in late 2017, then returning to its original values by early 2019.  Similar variability is evident in Channel 4, sensitive to the ~3-bar level, and a smaller one in Channel 5, which is sensitive to the ~1.5-bar level.  No change is detectable in Channel 6, sensitive to the ~0.7-bar level. The 2017 temperature drop has no obvious counterpart in reflected sunlight, although its “recovery” occurs during the reflectivity changes in 2019 (Figs. 1-2). To link the two, one must devise a causal relationship between a short-lived variation of absorber, likely gaseous ammonia, at 1.5-9 bars at 2016-2019 between 2°N and 6°N, and conditions at higher altitudes over a wider latitude range.

If the NEBn variability between 2020 and 2021 (Figs. 1, 3) implies an increase of ammonia absorption, we would expect a decrease in antenna temperatures between our last trustworthy observation in 2019 April and observations in late 2021. This is indeed the case at 0.7 bars, represented by the 6-7K drop in Channel-6 antenna temperatures for the NEBn. This is also present in Channel 5 as a ~5K drop, but it is not detectable above the noise in the deeper-sounding channels, so this is not substantially present at pressures higher than ~1.5 bars. A ~5K drop in antenna temperatures in late 2016 is followed by a slower rise to its previous range by the end of 2017 in both Channels 5 and 6. Other channels do not show this variability, so this is another “shallow” phenomenon with no obvious connection to changes in cloud reflectivity.

We will continue to examine variability in cloud reflectivity associated with these changes,  observe with increasingly favorable geometries for the next few perijoves, and examine other latitudes for variability.

References:

Bolton, et al. 2021. Science 374, 968-972.

Fletcher, et al. 2017. Geophys. Res. Lett. 44, 7140-7148

Fletcher, et al. 2020. J. Geophys. Res. 125, E06399.

Fletcher, et al. 2021. J. Geophys. Res. 126, E06858.

Li, et al. 2017. G. Res. Lett. 44, 5317-5325.

Simon, et al. 2015. Ap. J. 812, 55.


Figure 1. Color-composite cylindrical maps of Jupiter from the Hubble Space Telescope OPAL program (Simon et al. 2015). Note the darkening of the EZ central and northern components, which began in 2018. Note also that in 2021 the northern part of the North Equatorial Belt has become lighter in color compared with 2017, a process that took place in early 2021.


Figure 2. Reflectivity of the central and northern components of the Equatorial Zone vs time at 2.166 µm, a wavelength sensitive to reflected sunlight from ~80-mbar aerosols. This plot implies that the EZn contained a denser population of aerosols near this level, most likely from more vigorous lofting.


Figure 3. Images of Jupiter at 5.1 µm: these and data in Fig. 2 were taken using NASA’s Infrared Telescope Facility (IRTF) SpeX guide camera. Note the drop in radiance of the northern section of the North Equatorial Belt from 2020 to 2021.


Figure 4. Preliminary results on radiances measured by Juno’s Microwave Radiometer (MWR). Channels 3 and 6 sense radiances at 2.6 and 22 GHz, respectively. For clarity, other channels are not shown. Error bars represent the standard deviation of antenna temperatures included in the latitude bin.


How to cite: Orton, G., Fletcher, L., Oyafuso, F., Li, C., Zhang, Z., Brueshaber, S., Wong, M. H., Momary, T., Levin, S., Bolton, S., Baines, K., Dahl, E., and Sinclair, J.: Exploring the Depth of Planetary-Scale Changes in Jupiter from Juno Microwave Radiometer Observations, Europlanet Science Congress 2022, Granada, Spain, 18–23 Sep 2022, EPSC2022-761, https://doi.org/10.5194/epsc2022-761, 2022.

17:40–17:50
|
EPSC2022-817
Henrik Melin, Leigh Fletcher, Pat Irwin, Davide Grassi, and Alessandro Mura

Since 2016 the Juno spacecraft has been in orbit around Jupiter, gathering unprecedented data from its highly inclined 53-day orbit. The Jupiter Infrared Auroral Mapper (JIRAM) is an imager and spectrograph with spectral coverage between 2 and 5 µm. This region is dominated by reflected sunlight by aerosols and hazes, with distinct absorptions by ammonia, phosphine, germane and other minor species in Jupiter's troposphere, as well as ionospheric H3+ at high altitude. Here, we outline the process undertaken to model the full spectral coverage of JIRAM with NEMESIS, our radiative transfer and retrieval code (Irwin et al., 2008). This includes altering the NH3 aerosol and haze properties, updating the molecular line-list, and testing the sensitivity to the abundance of the molecular species that are within the 2-5 µm range offered by JIRAM. 

This study builds on previous models for JIRAM spectra in thermal emission (Grassi et al., 2020) and reflected sunlight (Grassi et al., 2021), by attempting to fit the entire 2-5 µm range simultaneously with a single consistent aerosol model.  The model includes two aerosol layers, a NH4SH type layer at 1.3 bars, and a NH3 type layer at 0.7 bars, as well as a tholin type haze layer that extends from the troposphere to the stratosphere. We demonstrate that JIRAM observations of both reflected sunlight and thermal emission cannot be reproduced simultaneously using standard refractive indices available in the literature.  We build a simple model of the refractive indices for the three aerosol layers, adapting the technique of Sromovsky et al. (2010), and demonstrating the improvement in the fits at each step.  As a proof of concept we present the analysis of meridionally averaged zonal profiles, investigating how aerosols, ammonia, and phosphine vary with latitude during the early perijoves of the mission.

How to cite: Melin, H., Fletcher, L., Irwin, P., Grassi, D., and Mura, A.: Modelling the full 2-5 µm Juno JIRAM spectral range with NEMESIS: Zonal Profiles of Jupiter’s Aerosols, Condensables, and Disequilibrium Species, Europlanet Science Congress 2022, Granada, Spain, 18–23 Sep 2022, EPSC2022-817, https://doi.org/10.5194/epsc2022-817, 2022.

17:50–18:00
|
EPSC2022-843
Eli Galanti, Maria Smirnova, Yohai Kaspi, and Tristan Guillot

The shape of gaseous planets, defined as an equipotential surface for a specific pressure, can be calculated given measurements of the zonal gravity harmonics, and the wind profile and polar radius at a given level. For both Jupiter and Saturn, the gravity harmonics have been measured to high accuracy by the Juno and Cassini missions, respectively. Measurements for the zonal winds are also available via cloud tracking, buth a significant uncertainty is associated with them, stemming from the clouds altitudes, as well as time variations in the strength and location of the winds. With that, the wind profiles can be also constrained by the gravity measurements. Further constraint on the calculated shape of the two gas giants can be obtained from occultation measurements, which give radial dependent profiles of pressure for specific spatial location.

Here we propose a new method for calculating the shape of the gas giants, based on an optimization of the wind latitudinal profile, decay structure, and the polar radius, given both gravity and occultation measurements. We use thermal wind balance to relate the wind to the gravity measurements, and a shape model to relate the wind and polar radius to the occultation measurements. We perform the analysis for both the 0.1 and 1 bar pressure levels. We examine the ability to explain both types of measurements in each planet, and discuss the implication for the possible wind profiles and how they might change with pressure. We also discuss the solutions for the polar radius with respect to the currently used mean values.

Only a few occultation measurements are currently available in each planet, but in the coming years the Juno mission is expected to perform dozens of occultations for Jupiter, covering a wide spatial range, and there are several Cassini occultations performed for Saturn that are still waiting for analysis. Using the method proposed here, we expect the new measurements to help resolve the shape of the gas giants to better accuracy, and to allow better understanding of the wind structures and their depth dependence.

How to cite: Galanti, E., Smirnova, M., Kaspi, Y., and Guillot, T.: The shape of Jupiter and Saturn based on winds, occultations and gravity measurements, Europlanet Science Congress 2022, Granada, Spain, 18–23 Sep 2022, EPSC2022-843, https://doi.org/10.5194/epsc2022-843, 2022.

18:00–18:10
|
EPSC2022-891
|
ECP
Artyom Aguichine, Olivier Mousis, and Jonathan Lunine

Two decades ago, the Galileo probe performed an in situ measurement of elemental abundances in Jupiter’s atmosphere, which resulted in a number of formation scenarios to explain observations [1-4]. These measurements indicated that volatile abundances of C, N, S, P, Ar, Kr and Xe were enhanced by a factor of 2 to 6 times their protosolar value, except for O that was found to be subsolar. The more recent measurements made by Juno confirmed the supersolar abundance of N, but found that a supersolar abundance of O is possible [5]. This result calls for an update of existing models and formation theories. Here, we investigate the possibility of reproducing the composition of Jupiter’s envelope in the protosolar nebula (PSN).

To do so, we compute the evolution of the PSN using a 1D viscous accretion disk model [6,7]. The disk is initially uniformly filled with trace species with protosolar abundances, present in the form of dust and ice grains, and their vapor. The radial transport of trace species is computed by solving an advection-diffusion equation, and phase transitions are accounted for by computing sublimation and condensation rates for each species. We then compare the composition of the PSN computed by our model with the updated measurements of elemental abundance in Jupiter.

The figure below represents profiles of the H2O abundance in the disk, normalized to its initial value, at different times of the disk evolution. Solid and dashed lines are used to indicate locations where the disk is dominated by solids (solid lines) or vapor (dashed lines). The blue box corresponds to the measurement of H2O to protosolar O abundance measured in Jupiter’s atmosphere by Juno [5]. Every trace species evolves in a similar fashion, but their icelines are at different heliocentric distances.

We find that the composition of Jupiter’s envelope can be explained only from its accretion from PSN gas or from a mixture of vapors and solids, depending on the turbulence level in the disk. Such compositions can be found at ~4 AU, namely between the icelines of H2O (3.5 AU) and CO2 (5.5 AU), and at times 100–300 kyr of the disk evolution. These results [7]  are compatible with both the core accretion model and the gravitational collapse model, but give a new possible scenario of Jupiter’s formation.


[1] Gautier, D., Hersant, F., Mousis, O., et al. 2001, ApJL, 550, L227.
[2] Mousis, O., Ronnet, T., and Lunine, J. I. 2019, ApJ, 875, 9.
[3] Öberg, K. I. and Wordsworth, R. 2019, AJ, 158, 194.
[4] Miguel, Y., Cridland, A., Ormel, C. W., et al. 2020, MNRAS, 491, 1998.
[5] Li, C., Ingersoll, A., Bolton, S., et al. 2020, Nature Astronomy, 4, 609.
[6] Aguichine, A., Mousis, O., Devouard, B., and Ronnet, T. 2020, ApJ, 901, 97.
[7] Aguichine, A., Mousis, O., and Lunine, J. I. 2022, accepted in PSJ.

How to cite: Aguichine, A., Mousis, O., and Lunine, J.: Reproducing the composition of Jupiter’s envelope from the gas phase of  the protosolar nebula, Europlanet Science Congress 2022, Granada, Spain, 18–23 Sep 2022, EPSC2022-891, https://doi.org/10.5194/epsc2022-891, 2022.

18:10–18:20
|
EPSC2022-943
|
ECP
Keren Duer, Eli Galanti, and Yohai Kaspi
Jupiter's atmosphere consists of a number of dynamical regimes: the equatorial superrotation and its adjacent retrograde jets, the midlatitude, eddy-driven, alternating jet streams, and the associated meridional circulation cells and the turbulent polar region. While intensive research has been conducted in the past decades on each of these regimes, they all remain only partially understood and somewhat mysteries. Different models give a variety of possible explanations for each of these regions, and only a handful of models can even capture two areas at once. This study presents new numerical simulations, using a 3D anelastic GCM, that can reproduce the midlatitudinal pattern of the mostly barotropic, alternating eddy-driven jets and the meridional circulation cells accompanying them. As expected for a gas giant, we find that the vertical eddy momentum fluxes are just as important as the meridional eddy momentum fluxes, which drive the midlatitudinal circulation on Earth. The number of the jets/cells, their extent, strength, and location are directly related to the boundary conditions, the Ekman number, and the depth of the atmosphere. Studies have shown that the rotation rate, the forcing scheme, and the Rayleigh number are also responsible for the emergence of jets in simulations of gas giants, but we keep these constant in our simulations. Our simulations also capture the tilted convection columns in the tangent cylinder region, leading to the superrotation at the equator and the adjacent, subrotating jets. We show that tilted columns can also generate equatorial subrotation, possibly explaining the zonal wind pattern on the ice giants. We find that the location and strength of the adjacent jet can indicate the depth of the atmosphere, as they are well correlated in all the simulations and on Jupiter and Saturn, according to gravity measurements by Juno and Cassini, respectively. Our analysis provides another step towards understanding the deep atmospheres of gas giants.

How to cite: Duer, K., Galanti, E., and Kaspi, Y.: Numerical simulations demonstrating Eddy-driven jets and meridional circulation cells on gas giants, Europlanet Science Congress 2022, Granada, Spain, 18–23 Sep 2022, EPSC2022-943, https://doi.org/10.5194/epsc2022-943, 2022.

18:20–18:30
|
EPSC2022-975
Manuel López-Puertas, Alejandro Sánchez-López, Maya García-Comas, Bernd Funke, Thierry Fouchet, and Ignas Snellen

Methane has a driving role in establishing the thermal structure of Jupiter's upper atmosphere. Hence, to know its spatial distribution, both in altitude and latitude, is essential for understanding that atmospheric region.
The abundance of CH4 in Jupiter's upper atmosphere has been (or will soon be) derived using a number of different methods, e.g., solar occultation, the measurements of He and Ly-alpha airglow, and from the observations of near-IR emission near 3.3 µm (ISO/SWS, JUNO/JIRAM so far and, in the near future, from JWST/NIRSpec). 
The retrieved values derived from these techniques show rather different values, particularly around the homopause. Even different studies of the same ISO/SWS spectral radiance yield very different CH4 volume mixing ratio profiles.
Here, we will discuss the important role and the adequate use of the collisional relaxation of the CH4 high-energy levels when deriving CH4 abundances near the mesopause from NIR emission radiances. Further, we will also show some results on the important role of spectrocopic data of the CH4 3.3 µm hot bands for those analyses. Those studies will be presented for the particular case of the ISO/SWS measurements, although they are equally applicable to other measurement sets such as those of JUNO/JIRAM and JWST/NIRSpec. 

How to cite: López-Puertas, M., Sánchez-López, A., García-Comas, M., Funke, B., Fouchet, T., and Snellen, I.: A revision of the CH4 concentration in Jupiter's upper atmosphere from near-IR measurements, Europlanet Science Congress 2022, Granada, Spain, 18–23 Sep 2022, EPSC2022-975, https://doi.org/10.5194/epsc2022-975, 2022.

Orals: Fri, 23 Sep | Room Andalucia 3

Chairperson: Yamila Miguel
10:00–10:10
|
EPSC2022-980
Nimrod Gavriel and Yohai Kaspi

The polar cyclone at Jupiter's south pole and the 5 cyclones surrounding it oscillate in position and interact. These cyclones, observed since 2016 by NASA's Juno mission, present a unique opportunity to study vortex dynamics and interactions on long time scales. The cyclones' position data, acquired by Juno's JIRAM, is analyzed, showing dominant oscillations with ~12-month periods and amplitudes of ~400 km. Here, the mechanism driving these oscillations is revealed by considering vorticity-gradient forces generated by mutual interactions between the cyclones and the latitudinal variation in planetary vorticity. Data-driven estimation of these forces exhibits a high correlation with the measured acceleration of the cyclones. To further test this mechanism, a model is constructed, simulating how cyclones subject to these forces exhibit similar oscillatory motion. 

How to cite: Gavriel, N. and Kaspi, Y.: The oscillatory motion of the polar cyclones of Jupiter results from vorticity dynamics, Europlanet Science Congress 2022, Granada, Spain, 18–23 Sep 2022, EPSC2022-980, https://doi.org/10.5194/epsc2022-980, 2022.

10:10–10:20
|
EPSC2022-1004
Yohai Kaspi, Eli Galanti, Ryan Park, Daniele Durante, Luciano Iess, Marzia Parisi, and Dustin Buccino
Since the first gravity measurements of Juno at Jupiter, the odd gravity harmonics J3 to J9 have been used to determine the depth of the zonal wind observed at the cloud level. Later on, combining solutions from internal models, the gravity harmonics J6, J8 and J10 were added to the analysis, which reinforced the conclusion that the observed zonal flows extend to a depth of around 3,000 km. The harmonics higher than J10 were not used in the analysis since their individual uncertainty was too large. In this study, we revisit the wind-gravity analysis, using new gravity data from Juno and a new analysis method, showing results for higher harmonic gravity measurements. This gives more detail about the structure of the deep zonal flows and allows better explaining the structure of the gravity spectrum. This confirms that indeed the observed flows are the ones which imprint the gravity spectrum. Moreover, this analysis allows to better determine which part of the wind field most contributes to the gravity signal, implying on the depth of individual jet streams. We also show how the new gravity measurement analysis allows to refine the surface gravity field, particularly in the latitudinal range of the closest approach of the spacecraft.

How to cite: Kaspi, Y., Galanti, E., Park, R., Durante, D., Iess, L., Parisi, M., and Buccino, D.: Revisiting the Jupiter wind-induced gravity field: high harmonics and surface gravity, Europlanet Science Congress 2022, Granada, Spain, 18–23 Sep 2022, EPSC2022-1004, https://doi.org/10.5194/epsc2022-1004, 2022.

10:20–10:30
|
EPSC2022-1006
|
ECP
Jake Harkett, Leigh Fletcher, Henrik Melin, Mike Roman, Oliver King, Heidi Hammel, Stefanie Milam, Pat Fry, and Tommy Greathouse

Jupiter's extended disc and infrared brightness create a challenging target for JWST's MIRI instrument to probe. Observations with the Medium Resolution Spectrometer (MRS) integral field units are expected to saturate beyond 11 microns, and the fields of view of the MRS are so small that we can sample only regional phenomena on the Jovian disc. Also, the rapid Jovian rotation will result in an observing geometry that will vary from exposure to exposure. However, the potential to probe mid-IR spectral ranges from 5-11 µm that are partially inaccessible to ground-based observatories will enable the determination of 3D temperatures, thermal winds, atmospheric stability, gaseous composition, dynamics and aerosol distribution in unprecedented detail. The target of guaranteed-time Jovian observations (cycle 1 – GTO 1246) will be the Great Red Spot (GRS) and its environs as a test of our ability to map Jovian meteorological phenomena. The giant anticyclone will be mapped using a three-tile mosaic, which targets 10 degrees longitude East of the GRS, the centre and 10 degrees West respectively.


The MIRI spectral maps will sample the top half of the anticyclone above the vortex midplane, enabling probing of the low temperatures, elevated aerosols, and elevated gaseous abundances that persist within the vortex (Fletcher et al., doi: 10.1016/j.icarus.2010.01.005).  We will derive the vertical aerosol and gaseous structure throughout the 1 mbar (using 7-8 µm spectra) to 5 bar range (using 5-6 µm spectra), complementing the Juno mission investigation of the depth of the GRS at higher pressures (Bolton et al., doi: 10.1126/science.abf1015) The newly inferred properties of the GRS will allow us to better understand the dynamics and longevity of this anticyclone, as well as its interactions with the surrounding Southern Equatorial Belt (SEB). Furthermore, moist convective activity in the surrounding SEB, particularly north-west of the vortex, will also be explored using ammonia as a cloud-forming volatile and phosphine as a tracer of vertical mixing. With sufficient refinement of the atmospheric retrieval process, it may also be possible to search the spectra for signatures of the currently-unidentified red chromophore in Jupiter's belts and GRS.


To prepare for these observations, spectral radiative forward models of the GRS were developed using the NEMESIS suite of radiative transfer and spectral inversion software (Irwin et al., doi: 10.1016/j.jqsrt.2007.11.006).  The tool has been adapted to simulate MIRI MRS 5-28 micron spectra using temperature, composition and aerosol data generated from NEMESIS inversions of ground-based Gemini TEXES spectral maps acquired in 2017 (Fletcher et al., doi:10.1029/2020JE006399). These data were used to generate idealised synthetic spectral cubes that were then passed through the MIRISim package to simulate the distortions, transformations, efficiencies, dispersions and noise expected from the MIRI instrument. Different exposure settings and dither patterns were also tested at this stage. The resultant detector images, with spectra dispersed for each slice of the image scene, were subsequently processed using the JWST calibration pipeline. This generated 12 MIRI cubes corresponding to all 12 bands required to cover the full spectral range of MIRI MRS (although the longer-wavelength cubes were typically saturated). 


The simulated data were then treated as real cubes from the observatory, allowing us to develop techniques for image navigation and mapping of the mosaics and dither points.  We also tested the possibility of splitting the data into shorter integration periods through alteration of the exposure settings, allowing us to access some of the longer-wavelength regions without saturation.  Spectral retrievals were then used to assess the MIRI capability for mapping the GRS.  These GRS observations are part of a wider programme of JWST giant planet atmosphere observations, including complementary NIRSPEC (1.6-5.3 µm) mapping of the vortex at shorter wavelengths (ERS 1373) as well as global spatial and temporal context mapping by both IRTF/TEXES and VLT/VISIR. In this presentation we will: (i) summarise the science goals of GTO 1246, (ii) discuss the simulation and mapping techniques used to prepare for these observations and (iii) describe the resulting mapping and atmospheric retrieval process to be applied to the real data.

How to cite: Harkett, J., Fletcher, L., Melin, H., Roman, M., King, O., Hammel, H., Milam, S., Fry, P., and Greathouse, T.: JWST MIRI Mapping of Jupiter's Great Red Spot: Preparatory Data Simulations, Europlanet Science Congress 2022, Granada, Spain, 18–23 Sep 2022, EPSC2022-1006, https://doi.org/10.5194/epsc2022-1006, 2022.

10:30–10:40
|
EPSC2022-1061
|
ECP
Padraig Donnelly, Aymeric Spiga, Sandrine Guerlet, Matt James, and Deborah Bardet

Abstract

The Saturn DYNAMICO Global Climate Model (GCM) is a high-resolution, multi-annual numerical simulation of Saturn's atmospheric dynamics [1], combining a radiative-convective equilibrium model [2] and a hydrodynamical solver on an icosahedral grid. The model reproduces well the observed behaviour of jets and eddy-momentum transfer to the mean flow. Vortices arise naturally in the model over time but until now they have not been given direct consideration. Here we investigate the long-term statistical distribution and organization of vortices using (1) a manual visual inspection method and (2) automated techniques that utilise machine learning and analytical calculations as a means of validating the first approach.

Manual Detection

This vortex detection method is similar to previous observational studies of Jupiter and Saturn [3, 4, 5, 6] and shows how the spatial and temporal distributions of the modelled vortices compares to those observed on Saturn [4, 5, 6], as well as studying the formation conditions and long-term temporal evolution of vortex distributions. With seven simulated model years at ½-degree spatial resolution, we constrain well the size and location of vortices, the horizontal wind field components and the magnitude and sign of horizontal vorticity, enabling direct comparison of the manual and automated methodologies.

Automated Detection

A convolutional neural network is used to reproduce the manual visual detection method across the entire timeseries using the same assumptions and using the results of the manual study as a training set. We also study the Angular Momentum Eddy Detection Algorithm (AMEDA, [7]) designed for the analysis of terrestrial oceanic eddies. The machine learning study is ongoing and the results of the AMEDA algorithm are largely consistent with the manual approach, meaning that this algorithm can be used in future studies of Jupiter and Saturn DYNAMICO GCM outputs.

Figure 1: Vortex count over the entire mature model timeline for the manual (black) and AMEDA (red) approaches. Manual technique measures at each seasonal peak, AMEDA measures at each timestep to create a seasonal average for comparison. AMEDA analysis to be extended to earlier years.

Figure 2: Vortex east-west size (left), north-south size (centre) and shape (right), in units of 103km, for the manual (top) and AMEDA (bottom) approaches.

Figure 3: Overall distribution of vortices for entire timeseries with the manual (left subplot) and AMEDA (right subplot) approaches. In each subplot: (Left) histogram of total vortex count. (Centre) instantaneous zonal wind speed at the vortex centre with the mean zonal wind profile. (Right) vortex average size and vorticity sign.


Figure 4: (Top) Maximum tangential velocity at vortex edge as a function of distance from the vortex centre (scatter), derived from the AMEDA approach, alongside the geostrophic balance condition (black straight line), all vortices are subgeostrophic. (Bottom) the ratio of vortex Vmax and the geostrophic condition as a measure of "vortex geostrophy", with respect to latitude, smaller and higher-latitude vortices tend to be clsoer to the geostrophic condition.

Acknowledgements

Donnelly and the France authors were supported by Agence Nationale de la Recherche (ANR) and the UK authors acknowledge the Science and Technology Facilities Council (STFC, James) and the European Research Council (ERC, Bardet).

References

[1] Spiga et al. (2020), Icarus, 335, http://dx.doi.org/10.1016/j.icarus.2019.07.011.

[2] Guerlet et al. (2014), Icarus, 238, https://doi.org/10.1016/j.icarus.2014.05.010.

[3] Li et al. (2004), Icarus, 172, https://doi.org/10.1016/j.icarus.2003.10.015.

[4] Vasavada et al. (2006), J. Geophys. Res. Planets, 111, https://doi.org/10.1029/2005JE002563.

[5] Trammell et al. (2014), Icarus, 242, https://doi.org/10.1016/j.icarus.2014.07.019.

[6] Trammell et al. (2016), J. Geophys. Res. Planets, 121, https://doi.org/10.1002/2016JE005122.

[7] Le Vu et al. (2018), J. Atmos. Ocean. Tech., 35, https://doi.org/10.1175/JTECH-D-17-0010.1

How to cite: Donnelly, P., Spiga, A., Guerlet, S., James, M., and Bardet, D.: Vortex Statistics in the Saturn DYNAMICO GCM: Manual and Automated Detection, Europlanet Science Congress 2022, Granada, Spain, 18–23 Sep 2022, EPSC2022-1061, https://doi.org/10.5194/epsc2022-1061, 2022.

10:40–10:50
|
EPSC2022-1103
|
ECP
Arrate Antunano, Leigh N Fletcher, Glenn S Orton, Henrik Melin, Padraig T Donnelly, Michael T Roman, James A Sinclair, Yasumasa Kasaba, Thomas Momary, and Takuya Fujiyoshi

Introduction

Continued monitoring of Jupiter during the past four decades from Earth-based observatories, the Hubble Space Telescope, and visiting spacecraft has provided essential insights on Jupiter's belt/zone structure from the upper stratosphere to the deeper levels (~100 bar), allowing us to further our knowledge of Jupiter’s climatology, chemistry, and the coupling between the observed atmospheric dynamics and the unseen deeper levels.

Jupiter’s equatorial atmosphere is particularly interesting when investigating the atmospheric dynamics and climatology in the giant planets, as its equatorial temperatures and aerosols display remarkable quasi-periodic oscillations from the stratosphere (~1 mbar, e.g. Leovy et al., 1991, Orton et al., 1991) to below the thick ammonia clouds (5-7 bar, Antuñano et al., 2018, 2020).


Ground-Based Observations

Our study uses almost four decades of ground-based mid-infrared observations (1983 to 2019) captured at NASA’s Infrared Telescope Facility, the Very Large Telescope and the Subaru Telescope at 8 different wavelengths ranging between 7.9 µm and 24.5 µm, to analyse the long-term variability of upper tropospheric and stratospheric equatorial temperatures and aerosol opacity.  Examples of Jupiter images over the three decades are shown in Figure 1.

Figure 1. Examples of Jupiter images captured at 8.6 µm, over the three decades.

In this study, zonal-mean radiance profiles at different wavelengths are stacked together to form 5-point (7.9 µm, 8.6 µm, 10.7 µm, 18.7 µm and 20.5 µm) and 8-point (same as above plus 13.0 µm, 17.6 µm and 24.5 µm) spectral image cubes between 1983-2019 and 1996-2019, respectively. These spectral image cubes are then inverted using the radiative-transfer and retrieval codes NEMESIS (Irwin et al., 2008) to retrieve stratospheric and tropospheric temperatures and tropospheric aerosol-opacity.


Troposphere-Stratosphere Coupling

Jupiter’s equatorial stratosphere displays a remarkable periodic oscillation, where a vertical alternating pattern in the zonally-averaged temperature and winds is observed between 3 and 20 mbar, both at the equator and off-equatorial latitudes (±12° latitude, Leovy et al., 1991, Cosentino et al., 2017). In our study, we perform a cross-correlation analysis between the retrieved upper-tropospheric and stratospheric temperatures, revealing the extend of Jupiter’s Equatorial Stratospheric Oscillation (JESO) and showing a potential anticorrelation equatorial stratospheric and upper-tropospheric temperature, hinting to a potential troposphere-stratosphere coupling at Jupiter´s equatorial region.


Temperature and Aerosol Variability

Jupiter´s Equatorial Zone (EZ) undergoes a rare 7-year cyclic disturbance, where the typically white, NH3 cloud-covered, and cold EZ shows a 5-µm bright, NH3 cloud-free region encircling the planet south of the equator, accompanied by a strong coloration event at visible wavelengths (Antuñano et al., 2018). By analysing the long-term temporal variation of the retrieved tropospheric temperatures and aerosol opacity at these latitudes, our study reveals that the equatorial tropospheric aerosol opacity is not only modulated by the Equatorial Zone disturbances, but also by a wave with half the period of the Equatorial Zone disturbances. Our study also presents a quantitative study of the temporal lag between temperature and aerosol opacity changes at these latitudes.


How to cite: Antunano, A., Fletcher, L. N., Orton, G. S., Melin, H., Donnelly, P. T., Roman, M. T., Sinclair, J. A., Kasaba, Y., Momary, T., and Fujiyoshi, T.: Jupiter’s Equatorial Atmosphere Observations, Europlanet Science Congress 2022, Granada, Spain, 18–23 Sep 2022, EPSC2022-1103, https://doi.org/10.5194/epsc2022-1103, 2022.

10:50–11:00
|
EPSC2022-1124
Gerald Eichstädt, Glenn Orton, and Candice Hansen-Koharcheck

Introduction

During almost all of Juno's past perijove flybys, JunoCam took images that allowed us to derive cloud velocity field data from cloud feature displacements.
During more recent Jupiter flybys, JunoCam observed distinct cloud top features with very different emission angles within less than ten minutes. These images also show relative cloud feature displacements. These newly observed displacements fields, however, appear to be parallel to vector fields that would be expected from parallaxes induced by long-baseline observations of the cloud top topography rather than primarily from cloud motion.
Based on this assumption, we show stereo images to make these observations intuitive. For this purpose, we project a pair of JunoCam images to the same trajectory position.
The pair of trajectory positions the JunoCam images have actually been taken from can be used to derive a quantitative displacement field in terms of pixels per km altitude offset. Stereo correspondence ís simplified to a one-dimensional search. Observed relative displacements can then be divided by the previously derived scaling in order to retrieve a digital elevation map of relative heights of the cloud tops.
Digital elevation maps can further be rendered in 3D.

Example image pair

This cross-eyed stereo pair is derived from JunoCam images JNCE_2022099_41C00024_V01 and JNCE_2022099_41C00026_V01. The time span between the two images is less than four minutes. For observers trained to cross-eyed vision, the three-dimensional effect of the distinct cloud-top features is well-visible. The image pair can also be transformed into a blink gif or into an anaglyph.

How to cite: Eichstädt, G., Orton, G., and Hansen-Koharcheck, C.: Long-Baseline Observations with JunoCam, Europlanet Science Congress 2022, Granada, Spain, 18–23 Sep 2022, EPSC2022-1124, https://doi.org/10.5194/epsc2022-1124, 2022.

11:00–11:10
|
EPSC2022-1156
Joe Kinrade, Sarah Badman, Chris Paranicas, Caitriona Jackman, Diego Moral Pombo, Elizabeth O'Dwyer, Corentin Louis, and Alexander Bader

Saturn’s kilometric radio (SKR) and energetic neutral atom (ENA) emissions are important remote diagnostics of the planet’s magnetospheric dynamics, intensifying during periods of global-scale plasma injection, and displaying characteristic planetary periodicity (e.g. Ye et al., 2011, Kinrade, Bader et al., 2021). Here we focus on the narrowband emissions between 5-40 kHz, thought to originate near density gradients at the edges of the plasma torus (e.g. Gurnett et al., 1981, Ye et al., 2009), and test the hypothesis that narrowband SKR production might be enhanced by inward-moving plasma following global injection events. Global scale ENA signatures have been associated with both 5 and 20 kHz nSKR emissions, particularly at dusk-evening local times (e.g. Wing et al., 2020, Wu et al., 2021) where plasma injections are expected to have moved inwards through the magnetosphere, possibly triggering interchange instabilities (e.g. Mitchell et al., 2015, Azari et al., 2018, Kinrade et al., 2020).

Figure A: A calibrated and re-binned Cassini INCA image of Saturn’s equatorial ENA emission (24-55 keV Hydrogen, X-Y plane). This dataset and the open-source repository location are detailed in Bader & Kinrade, et al. (2020).

We use a new set of calibrated equatorial ENA projections - captured by the Cassini INCA - to test the relationship between Saturn’s ENA and narrowband SKR emissions. The narrowband SKR emission intensity peak often coincides with the rotation of ENA enhancement through the dusk local time sector, complementing the findings of Wing et al. (2020). We test for radial distance dependence by constraining ENA keograms over a set of distances and local time sectors covering the edges of the plasma torus, and quantify the relative timing of nSKR enhancements through correlation of the ENA intensity with flux density in the 5 and 20-40 kHz emission bands. We also observe periods of strong 5 kHz SKR emission when the ENA emission is absent, even during times of favourable viewing, indicating that this relationship is complex (e.g. Wu et al., 2022). These results contribute towards our developing picture of how global plasma injection events can influence Saturn’s inner magnetosphere, linking together two valuable sources of remotely-sensed global emissions, the ENAs and SKR.

Figure B: A re-working of the Wang et al. (2010) narrowband SKR example from 2007 (left-hand SKR polarisation shown in top panel), plus a keogram of the median ENA intensity between 1-20 RS (bottom panel). Some viewing artefacts remain here in this pre-published version of the ENA keogram (DOY 073 and 078), but the persistence of the rotating ENA enhancement over several days is clear. INCA projection / SKR viewing geometry are best on DOY 076 when Cassini was high above the north hemisphere ( > 50º latitude) at a range of ~ 30 RS. The bursts of narrowband SKR coincide with the ENA enhancement rotating through the dusk local time sector. 

This work is timely given the expected arrival of the JUICE mission at Jupiter in 2031, which carries an advanced ENA camera. ENA emissions have already been detected from Jupiter and the Io and Europa plasma torii by instruments onboard Cassini and JUNO (e.g. Mauk et al., 2003; 2020), and the arrival of JUICE will provide an opportunity to replicate this analysis, comparing the much-different Jovian ENA and associated radio emissions with those of Saturn’s neutral-dominated magnetosphere.

References

  • Azari et al. (2018), Interchange Injections at Saturn: Statistical Survey of Energetic H+Sudden Flux Intensifications, JGR Space Physics, https://doi.org/10.1029/ 2018JA025391.
  • Bader, Kinrade et al. (2020), A complete dataset of equatorial projections of Saturn's energetic neutral atom emissions observed by Cassini-INCA, JGR Space Physics, https://doi.org/10.1029/2020JA028908.
  • Gurnett et al. (1981), Narrowband electromagnetic emissions from Saturn's magnetosphere, Nature, https://www.nature.com/articles/292733a0.
  • Kinrade et al. (2020), Tracking Counterpart Signatures in Saturn's Auroras and ENA Imagery During Large‐Scale Plasma Injection Events, JGR Space Physics, https://doi.org/10.1029/2019JA027542.
  • Kinrade, Bader et al. (2021), The Statistical Morphology of Saturn’s Equatorial Energetic Neutral Atom Emission, Geophysical Research Letters, https://doi.org/10.1029/2020GL091595.
  • Mauk et al. (2003), Energetic neutral atoms from a trans-Europa gas torus at Jupiter, Nature, https://www.nature.com/articles/nature01431.
  • Mauk et al. (2020), Juno Energetic Neutral Atom (ENA) Remote Measurements of Magnetospheric Injection Dynamics in Jupiter's Io Torus Regions, JGR Space Physics, https://doi.org/10.1029/2020JA027964.
  • Mitchell et al. (2015), ‘Injection, Interchange, and Reconnection: Energetic Particle Observations in Saturn’s Magnetosphere’ in Magnetotails in the Solar System, https://doi.org/10.1002/9781118842324.ch19.
  • Wang et al. (2010), Cassini observations of narrowband radio emissions in Saturn's magnetosphere, JGR Space Physics, https://doi.org/10.1029/2009JA014847.
  • Wing et al. (2020), Periodic Narrowband Radio Wave Emissions and Inward Plasma Transport at Saturn's Magnetosphere, The Astronomical Journal, https://doi.org/10.3847/1538-3881/ab818d.
  • Wu et al. (2021), Statistical Study on Spatial Distribution and Polarization of Saturn Narrowband Emissions, The Astrophysical Journal, https://doi.org/10.3847/1538-4357/ac0af1.
  • Wu et al., (2022), Reflection and Refraction of the L-O Mode 5 kHz Saturn Narrowband Emission by the Magnetosheath, Geophysical Research Letters, https://doi.org/10.1029/2021GL096990.
  • Ye et al., (2009), Source locations of narrowband radio emissions detected at Saturn, JGR Space Physics, https://doi.org/10.1029/2008JA013855.

How to cite: Kinrade, J., Badman, S., Paranicas, C., Jackman, C., Moral Pombo, D., O'Dwyer, E., Louis, C., and Bader, A.: Remote sensing Saturn’s global plasma dynamics: testing the relationship between Saturn’s ENA and narrowband SKR emissions., Europlanet Science Congress 2022, Granada, Spain, 18–23 Sep 2022, EPSC2022-1156, https://doi.org/10.5194/epsc2022-1156, 2022.

11:10–11:20
|
EPSC2022-1192
Juno magnetometer observations constrain Jupiter’s dynamo, interior state, deep zonal flow, and planetary rotation rate.
(withdrawn)
Jack Connerney, Sidey Timmins, John Jorgensen, Stavros Kotsiaros, Peter Jorgensen, Jose Merayo, Matija Herceg, Jeremy Bloxham, Kimberly Moore, Scott Bolton, and Steven Levin
11:20–11:30
|
EPSC2022-1215
|
ECP
Omakshi Agiwal, Luke Moore, Carlos Martinis, Ingo Mueller-Wodarg, and Joe Huba
The Cassini Grand Finale revealed that there is still much that we do not understand about Saturn’s upper atmosphere. In-situ observations reveal highly complex coupling between the planetary atmosphere and rings and inter-hemispheric electrodynamic coupling at latitudes that are magnetically connected to the intra D-ring region in the magnetosphere. Current Saturn models are ill-suited to treating electrodynamics and ring-planet interactions at Saturn. Thus, we adapt SAMI, a well-known terrestrial ionosphere model that is flux-tube based and already includes electrodynamics, to Saturn, with the aim of using it in conjunction with existing Saturn models such as the STIM-GCM (Saturn Thermosphere Ionosphere Model) to decipher the long-standing unexplained morphologies in Saturn’s ionosphere and investigate the ring-atmosphere coupling and electrodynamics revealed by the Cassini end-of-mission data. We will present initial results having adapted SAMI to Saturn, showing the full extent of the atmospheric chemistry and model capabilities at present. We will discuss future directions of development towards the construction of the new model capable of resolving the complex ring-atmosphere coupling and electrodynamics, and the possibility of adapting this model to other planets.

How to cite: Agiwal, O., Moore, L., Martinis, C., Mueller-Wodarg, I., and Huba, J.: First Steps Towards a New Saturn Ionosphere Model Including Ring-Planet Coupling and Electrodynamics, Europlanet Science Congress 2022, Granada, Spain, 18–23 Sep 2022, EPSC2022-1215, https://doi.org/10.5194/epsc2022-1215, 2022.

Display time: Wed, 21 Sep 14:00–Fri, 23 Sep 16:00

Posters: Thu, 22 Sep, 18:45–20:15 | Poster area Level 1

Chairperson: Stavros Kotsiaros
L1.91
|
EPSC2022-16
John Rogers, Gianluigi Adamoli, Candice Hansen, Gerald Eichstädt, Glenn Orton, Thomas Momary, Michel Jacquesson, Robert Bullen, and Hans-Jörg Mettig
  • Introduction and Summary

Jupiter’s troposphere is divided by eastward (prograding) jets into dynamical domains, which we number sequentially (Figure 1) so the highest-latitude northern domains are N4, N5 and N6 (Figure 2).  Here we describe characteristics of these domains with short- and long-term tracking of features that can be identified in JunoCam images.  Anticyclonic white ovals (AWOs) and cyclonic folded filamentary regions (FFRs) were tracked in 2021 and earlier years, using amateur images (analysed in the JUPOS project; e.g. Figure 3) and JunoCam maps (from the imager on NASA’s Juno orbiter; e.g. Figure 4) and several Hubble maps (from the OPAL project: ref.1).

The N6 domain is narrow and corresponds to a largely bland zone in JunoCam maps; all features in it are rapidly prograding. The N4 and N5 domains are broad and chaotic with numerous large FFRs and smaller vortices. Their zonal wind profiles (ZWPs) are dominated by the drifts of AWOs and FFRs, but faster retrograde winds exist in the FFRs.  Northerly AWOs have rapid prograde drifts, but these often change suddenly, sometimes due to interactions with FFRs or with other AWOs.  Most remarkably, in 2021-22 we have one or (very likely) two examples of AWOs moving south to cross prograde jets: one from the N4 domain and one from the N3 domain. 


  • Zonal drift profiles

Previous spacecraft ZWPs have revealed the overall pattern of the domains: in both N4 and N5, the ZWP is ‘blunt’ with a broad retrograde flow (Figure 1). The Cassini polar movie, and our long-term ground-based analysis [ref.2], suggested that this represents the bulk motion of the rapidly-changing FFRs, and this is confirmed by tracking features in 2021.  The mean speeds in L3 are: in N4, +14 deg/30d;  in N5, +20 deg/30d.  Faster retrograde winds exist in the FFRs.  Conversely, AWOs have fast prograding drifts when in the northern part of each domain, but steady retrograding drifts in the southern part, where they often wander in latitude (especially in N4).  The largest AWO, in N5, has probably been tracked for at least 3 years and often progrades with the N6 jet.  Some smaller AWOs are also long-lived, while others appear and disappear within months.


  • Influences on the zonal drifts

In both N4 and N5, AWOs often undergo sudden large changes in their latitude and drift rate  (Figure 3) – just as in the N2, S3 & S4 domains.  Decelerations are sometimes due to the AWO encountering a FFR, according to examples in the Cassini polar movie and long-term ground-based analysis combined with Hubble maps [ref.2].  Accelerations may sometimes be due to the AWO encountering a smaller white spot.  AWOs sometimes pass each other in different latitudes unperturbed, but sometimes their mutual interactions can lead to mergers, or cause one or both to change latitude and speed. In 2021, a pair in N5 rebounded exchang-ing tracks, and other interactions may have propelled a N4 and a N3 AWO southwards to cross the jet.


  • AWOs crossing prograde jets

Coherent circulations almost never cross prograde jets on Jupiter, but ground-based data has demonstrated two previous instances where a N4 AWO crossed the N4 jet into the N3 domain, and in 2021-22 there was probably a third such event, captured in JunoCam images.  N4-AWO-A swung rapidly southwards after it approached N4-AWO-B (Figures 3 & 4), and was last seen at PJ39, straddling the N4 jet and split into two lobes (Figure 4).

Likewise, a N3-AWO swung southwards and crossed the N3 jet into the NNTZ – the first time that a spot has been seen to cross a prograde jet other than the N4 jet.


  • Cloud textures

JunoCam provides unprecedented resolution on the cloud-tops in this region, revealing features such as ‘pop-up clouds’; these are small, very bright white clouds only ten(s) of km across, projecting above the main cloud deck [ref.3], seen in many locations including AWOs, FFRs, and linear white cloud bands outside the main circulations (Figure 5).  AWOs have thick white cloud cover with spiral streaking and scattered pop-up clouds. There are also much smaller vortices, both anticyclonic and cyclonic; the latter include well-formed orange-brown spiral cyclones, and ovals with quiescent dark brown cloud-covered interiors.  FFRs have a variety of white, grey and orange clouds and hazes that appear to be at different levels. Dense rows of pop-up clouds are commonly seen on the white strips in FFRs, possibly representing the uppermost layer of convection. These white strips are probably thunderstorms, as FFRs in N4 are the most frequent location on the planet for lightning strikes [ref.4].


Acknowledgements:   Some of this research was funded by NASA. A portion of this was distributed to the Jet Propulsion Laboratory, California Institute of Technology.


References:

1. Simon AA, Wong MH & Orton GS, NASA & ESA: OPAL project: https://archive.stsci.edu/prepds/opal/.  See this website for maps and credits.

2. Rogers J et al., (2017), ‘Jupiter’s high northern latitudes: patterns and dynamics of the N3 to N6 domains.’  https://britastro.org/node/11328

3. Hansen C et al. (2019), ‘JunoCam images of castellanus clouds on Jupiter.’ AGU abstract #P44A-05.

4. Brown S et al.(2018), ‘Prevalent lightning sferics at 600 MHz near Jupiter’s poles.’ Nature 558, 87-90.


How to cite: Rogers, J., Adamoli, G., Hansen, C., Eichstädt, G., Orton, G., Momary, T., Jacquesson, M., Bullen, R., and Mettig, H.-J.: Jupiter’s high-latitude northern domains: Dynamics from Earth-based and JunoCam imaging, Europlanet Science Congress 2022, Granada, Spain, 18–23 Sep 2022, EPSC2022-16, https://doi.org/10.5194/epsc2022-16, 2022.

L1.92
|
EPSC2022-240
|
ECP
Chiara Castagnoli, Bianca Maria Dinelli, Francesca Altieri, and Alessandra Migliorini and the JIRAM Team

Despite the multiple evidence of the diffuse presence of methane in Jupiter’s auroral regions, the mechanisms leading to the CH4 brightening observed both from ground- and space-based platforms are not yet fully understood. During the first NASA/Juno’s orbit (JM0003), the on-board imager/spectrometer JIRAM (Jovian Infrared Auroral Mapper) allowed the detection of methane near both Jupiter’s poles. A very first analysis of the data acquired by the spectrometer, extending from 2.0 mm to 5.0 mm, showed that the peak of 3mm-CH4 emission was mainly confined within the main auroral oval at the north pole. The same was supposed to occur in the southern aurora, although it could not be verified due to the lack of spectra above 80°S (Moriconi et al., 2017). According to previous studies (Kim et al., 2015; Altieri et al., 2016), 3μm-methane emissions are likely originated by auroral particle precipitation, albeit an auroral forcing of the atmosphere might be considered as an alternative explanation of the large abundances of methane measured over the Jovian poles. In order to address this controversy, a more detailed analysis of JIRAM data was performed. Taking advantage of the revised retrieval code developed to analyse the JIRAM spectra (Adriani et al., 2017; Dinelli et al. 2017; Moriconi et al. 2017), in this work we derived the effective temperature of methane in Jupiter’s auroral regions, being a key information to comprehend the origin of its fluorescence. A larger number of JIRAM spectra were explored, including data acquired during orbits JM0071 (11 July 2017) and JM0081 (2 September 2017) for investigating the spatial distribution of methane at Jupiter’s south poles, finally making it possible to observe the peak of methane emission well inside the southern main oval (Figure 1c,d). The new result allowed to identify the spectra showing larger CH4 concentrations both in the southern and northern auroral region: these constituted the best candidates for the retrieval of the retrieval of methane temperature, being the measured signal mostly attributable to methane only. An additional analysis was hence performed on the selected CH4 spectra properly adjusting the retrieval code. As a result of this study, we were able to estimate the effective temperature of methane at Jupiter’s poles, which represents a crucial parameter when constraining on the mechanisms acting in Jupiter’s polar regions.

Figure 1 Maps of the column density (mol/cm2) of CH4 at both Jupiter’s poles. (a) orbit JM0003 North Pole; (b) orbit JM0003 South Pole; (c) orbit JM0071 South Pole; (d) orbit JM0081 South Pole.


References

Adriani, A., et al. (2016), Juno’s Earth flyby: The Jovian infrared Auroral Mapper preliminary results, Astrophys. Space Sci., 361, 8, doi:10.1007/s10509-016-2842-9.

Altieri, F., B. M. Dinelli, A. Migliorini, M. L. Moriconi, G. Sindoni, A. Adriani, A. Mura, and F. Fabiano (2016), Mapping of hydrocarbons emissions at Jupiter’s north pole using Galileo/NIMS data, Geophys. Res. Lett., 43, 11,558–11,566, doi:10.1002/2016GL070787.

Dinelli, B. M., et al. (2017), Preliminary results from the JIRAM auroral observations taken during the first Juno orbit: 1—Methodology and analysis applied to the Jovian northern polar region, Geol. Res. Lett., doi:10.1002/2017GL072929.

Kim, S. J., C. K. Sim, J. Ho, T. R. Geballe, Y. L. Yung, S. Miller, and Y. H. Kim (2015), Hot CH4 in the polar regions of Jupiter, Icarus, 257, 217–220.

Moriconi, M. L., et al. (2017), Preliminary JIRAM results from Juno polar observations: 3. Evidence of diffuse methane presence in the Jupiter auroral regions, Geophys. Res. Lett., 44, 4641–4648, doi:10.1002/2017GL073592.


How to cite: Castagnoli, C., Dinelli, B. M., Altieri, F., and Migliorini, A. and the JIRAM Team: Retrieval of CH4 effective temperature in Jupiter’s auroral regions using Juno/JIRAM data, Europlanet Science Congress 2022, Granada, Spain, 18–23 Sep 2022, EPSC2022-240, https://doi.org/10.5194/epsc2022-240, 2022.

L1.93
|
EPSC2022-373
|
ECP
|
MI
James O'Donoghue, Luke Moore, Tanapat Bhakyapaibul, Rosie Johnson, Henrik Melin, and Tom Stallard

At Jupiter, magnetosphere-ionosphere coupling gives rise to intense auroral emissions and enormous energy deposition in the magnetic polar regions. Here we show ground-based maps of Jupiter's upper atmosphere temperatures obtained via the emissions of the major upper-atmospheric ion, H3+. The maps have a spatial resolution of 2o longitude and latitude from pole to equator and trace the global temperature gradient. We find that temperatures decrease steadily from the auroral polar regions to the equator, indicating that the aurora act as a planet-wide heating source. However, during a period of enhanced activity in the auroral region which models imply was due to a solar wind compression, a high-temperature planetary-scale-sized structure was also observed on top of this gradient. This presentation reports on the particulars of this feature, including how it appears to be propagating away from the main auroral oval (as determined by estimates of the features' velocity at several longitudes) and its subsequent implications for global energy circulation at Jupiter and other planets.

How to cite: O'Donoghue, J., Moore, L., Bhakyapaibul, T., Johnson, R., Melin, H., and Stallard, T.: A planetary-scale heat wave in Jupiter's mid-latitude upper atmosphere, Europlanet Science Congress 2022, Granada, Spain, 18–23 Sep 2022, EPSC2022-373, https://doi.org/10.5194/epsc2022-373, 2022.

L1.94
|
EPSC2022-505
|
ECP
Sariah Al Saati, Noé Clément, Corentin Louis, Michel Blanc, Yuxian Wang, Nicolas André, Laurent Lamy, Jean-Claude Gérard, Bertrand Bonfond, Barry Mauk, George Clark, Frédéric Allegrini, Scott Bolton, Randy Gladstone, John Connerney, Stavros Kotsiaros, and William Kurth

The dynamics of the Jovian magnetosphere is controlled by the complex interplay of the planet’s fast rotation, its solar-wind interaction and its main plasma source at the Io torus, mediated by coupling processes involving its magnetosphere, ionosphere, and thermosphere. At the ionospheric level, these processes can be characterized by a set of key parameters including conductances, field-aligned and horizontal currents, electric fields, transport of charged particles along field lines, including the fluxes of electrons precipitating into the upper atmosphere which trigger auroral emissions, as well as the particle and Joule heating power dissipation rates into the upper atmosphere. Determination of these keys parameters makes it possible to estimate the net transfer of momentum and energy between Jovian upper atmosphere and equatorial magnetosphere. A method based on a combined use of Juno multi-instrument data and three modeling tools was developed by Wang et al. (2021) and applied to an analysis of the first nine orbits to retrieve these key parameters along the Juno magnetic footprint. In this article, we extend this method to the first thirty Juno science orbits and to both north and south auroral crossings. Our results reveal a large variability of these parameters from orbit to orbit and between the two hemispheres, but they also show dominant trends. Southern current systems are consistent with the generation of a region of sub-corotating ionospheric plasma flows, while both super-corotating and sub-corotating plasma flows are found in the north. These results are discussed in the light of the previous space and ground-based observations and currently available models of plasma convection and current systems, and their implications on our understanding of MIT coupling at Jupiter are assessed.

How to cite: Al Saati, S., Clément, N., Louis, C., Blanc, M., Wang, Y., André, N., Lamy, L., Gérard, J.-C., Bonfond, B., Mauk, B., Clark, G., Allegrini, F., Bolton, S., Gladstone, R., Connerney, J., Kotsiaros, S., and Kurth, W.: Magnetosphere-Ionosphere-Thermosphere Coupling study at Jupiter Based on Juno First 30 Orbits and Modeling Tools, Europlanet Science Congress 2022, Granada, Spain, 18–23 Sep 2022, EPSC2022-505, https://doi.org/10.5194/epsc2022-505, 2022.

L1.95
|
EPSC2022-564
Luke Moore, Tom Stallard, James O'Donoghue, Henrik Melin, M. Nahid Chowdhury, Rosie Johnson, Marissa Vogt, Carl Schmidt, and Glenn Orton

In 2012, ground-based observations of the dominant molecular ion in gas giant ionospheres, H3+, found that Jupiter’s upper atmosphere was super-heated above its iconic Great Red Spot (GRS). Temperatures there reached 1600 K, hotter even than the auroral region. It was speculated that this GRS “hotspot” was the signature of coupling between Jupiter’s lower and upper atmosphere, perhaps associated with upward propagating acoustic or gravity waves originating from the Solar System’s most powerful storm system. Such an energy transfer could help explain why observed upper-atmospheric gas giant temperatures are all significantly warmer than simulations based solely on solar heating can explain, a discrepancy colloquially referred to as the “giant planet energy crisis”.

Here, based on ground-based observations from 2016-2019, we report on spatial and temporal variations of H3+ temperature surrounding the GRS. We find that, while upper-atmospheric temperatures are still elevated above the GRS, they vary in time and are significantly cooler than in 2012. In addition, there are consistent spatial variations, with H3+ temperature generally highest on the western and northern edges of the GRS. We place these results in context with recent work that implicates Jupiter’s aurorae as primary sources of upper-atmospheric heating, and comment on their implications for Jupiter’s energy crisis.

How to cite: Moore, L., Stallard, T., O'Donoghue, J., Melin, H., Chowdhury, M. N., Johnson, R., Vogt, M., Schmidt, C., and Orton, G.: Ionospheric temperature variability above Jupiter’s Great Red Spot, Europlanet Science Congress 2022, Granada, Spain, 18–23 Sep 2022, EPSC2022-564, https://doi.org/10.5194/epsc2022-564, 2022.

L1.96
|
EPSC2022-632
|
ECP
Charlotte Alexander and Patrick Irwin

The grand appearance of Jupiter’s banded atmosphere, coloured with many shades from white to red, whose cloud structure currently remains elusive with no clear single cloud model responsible for this varied appearance. With a general pattern of alternating bright cloudy zones and darker belts, as well as unique regions such as the Great Red Spot, finding a way to model all of these differing appearances with a single model has proven difficult. Jupiter’s atmosphere provides continual challenges when attempting to characterise its cloud structure due to its frequently varying appearance. This leads to differences between every observation meaning that models are constantly having to adapt to be explain these changes. Such changes can be seen in Figure 1, both of these spectra have been extracted for the same region of the Equatorial Zone (EZ) but are not identical due to the changes in appearance over the 3 years. 

Recent works [1,2,3,4] have all attempted to model Jupiter’s atmosphere using a universal chromophore (cloud colouring compound), combined with a deeper conservatively-scattering cloud and also a stratospheric haze layer. These works have all been able to model the atmosphere successfully but it has currently not been possible to determine between these differing solutions to find the most likely representation of the atmosphere. As all the different sets ups have several ways to vary cloud structure and chromophore properties among other parameters, they have been able to fit the changes in the observations. Therefore keeping each set up viable even as the atmosphere changes. The current inability to conclude on a favoured cloud structure highlights the highly degenerate nature of this problem.

Utilising new observations and techniques to analyse the data highlights the delicacy of these results as the previous set ups have to be altered in order to produce the desired fit to the new observations once the input have varied slightly. An unchanged fit is shown in Figure 1, where the ideal fit of the EZ in 2018 has been used for 2021 data and is unable to model the spectra as well as for the spectra which it was derived from. Furthermore introduction of a limb viewing technique, as used in [2], has been done for this data. Here we attempt to fit multiple viewing angles simultaneously, which also begins to question the robustness of these results, due to an inability of nadir derived set ups to reproduce the multiple observations as successfully. 

Therefore in this work we have begun to attempt to reduce the degeneracy of the problem before utilising the Non-linear optimal Estimator for Multi-variatE spectral analySIS (NEMESIS) radiative-transfer retrieval algorithm [5], to fit to our observations. From this we want to find a vertical cloud structure which is more reproducible using different observations and techniques. It is hoped that reducing one of the degenerate parameters before fitting will allow us to constrain the atmospheric structure more decisively. Furthermore combining this with the limb darkening technique will hopefully allow us to rule out some of the solutions to this highly degenerate problem to find more confidence in the proposed models. 

In this work we will present the preliminary results taken from the application of these methods to observations to derive a new atmospheric model which can be compared with past work. Additionally we will present the use of new techniques to determine the ability of previous models to adapt to new observations to see if they are still viable. 

Figure 1: Spectra of the Equatorial Zone in both 2018 and 2021 and the spectral fit using the model from [1] derived for the 2018 data. 

[1] Braude, A. S., Irwin, P. G., Orton, G. S., and Fletcher, L. N. (2020). Colour and tropospheric cloud structure of jupiter from muse/vlt: Retrieving a universal chromophore. Icarus, 338:113589. 

[2] Pérez-Hoyos, S., Sánchez-Lavega, A., Sanz-Requena, J., Barrado-Izagirre, N., Carrión-González, O., Anguiano-Arteaga, A., Irwin, P., and Braude, A. (2020). Color and aerosol changes in jupiter after a north temperate belt disturbance. Icarus, 352:114031.

[3] Dahl, E. K., Chanover, N. J., Orton, G. S., Baines, K. H., Sinclair, J. A., Voelz, D. G., Wijerathna, E. A., Strycker, P. D., and Irwin, P. G. J. (2021). Vertical structure and color of jovian latitudinal cloud bands during the juno era. The Planetary Science Journal, 2(1):16. 

[4] Baines, K., Sromovsky, L., Carlson, R., Momary, T., and Fry, P. (2019). The visual spectrum of jupiter’s great red spot accurately modeled with aerosols produced by photolyzed ammonia reacting with acetylene. Icarus, 330:217–229.

[5] Irwin, P. G. J., Teanby, N. A., de Kok, R., Fletcher, L. N., Howett, C. J. A., Tsang, C. C. C., Wilson, C. F., Calcutt, S. B., Nixon, C. A., and Parrish, P. D. (2008). The NEMESIS planetary atmosphere radiative transfer and retrieval tool. , 109:1136–1150 

How to cite: Alexander, C. and Irwin, P.: Comparing atmospheric models of Jupiter, can we reduce the degeneracy of this problem?, Europlanet Science Congress 2022, Granada, Spain, 18–23 Sep 2022, EPSC2022-632, https://doi.org/10.5194/epsc2022-632, 2022.

L1.97
|
EPSC2022-905
|
ECP
Antoine Schneeberger, Olivier Mousis, Thibault Cavalié, and Jonathan Lunine

At the very end of its growth, Jupiter became surrounded by a circumplanetary disk (CPD) in which the Galilean moons formed.  How these moons formed remains an outstanding question. We aim to model the chemical evolution of this CPD to establish a connection between the moons’ surface compositions measured by the Juice and Europa-Clipper spacecrafts to disentangle between the existing formation scenarios. To do, so we develop a 2D circum-planetary disk model, designed to form the backbone of the chemical model that will follow the gas phase evolution of all species of interest. Our disk structure is based on the work Heller et al (2015) [1], with some key improvements at the level of the description of the opacity. Our disk’s parameters have also been scaled to those observed recently in the CPD around the exoplanet PDS70c.  Here we present the CPD structure and display some preliminary results regarding the chemical evolution of C- and N- dominated species in the gas phase of the CPD.


[1] Heller, R. & Pudritz, R. 2015, ApJ, 806, 181.

How to cite: Schneeberger, A., Mousis, O., Cavalié, T., and Lunine, J.: A 2-dimensional model of the Jovian circumplanetary disk, Europlanet Science Congress 2022, Granada, Spain, 18–23 Sep 2022, EPSC2022-905, https://doi.org/10.5194/epsc2022-905, 2022.

L1.98
|
EPSC2022-1147
|
ECP
Xinmiao Hu, Peter Read, Vivien Parmentier, and Greg Colyer

Recent Juno microwave observations revealed some puzzling features of the ammonia distribution. In particular, an ammonia-poor layer extends down to levels of tens of bars in Jupiter outside the equatorial region to at least ±40° [Li et al. 2017]. Such a depletion has not yet emerged in general circulation models (GCMs). Guillot et al. [2020] showed that ammonia vapour can dissolve in water ice within violent storms, forming ammonia-rich hail, or "mushballs", that leads to an efficient transport of ammonia to the deeper atmosphere and hence its observed depletion. However, this mechanism has not been tested in numerical simulations in which convective events are self-consistently determined. 

We present a simple parameterization scheme for the mushball process. Our scheme determines the mushball concentration using the water-ammonia equilibrium phase diagram, and considers the transport of water and ammonia due to its associated downdraft. We implemented this scheme to a GCM based on the MITgcm [Young et al. 2019] that includes the following key parameterizations: a water moist convection scheme, a simple cloud microphysics model for water and ammonia, a dry convection scheme, and a two-stream radiative transfer scheme. We present our preliminary results using water and ammonia abundance according to Juno observations. Further, we discuss the ability of the "mushball" scheme to reproduce the Juno observations and explore which parameters are the most important to understand the ammonia distribution in the deep layers of Jupiter.

How to cite: Hu, X., Read, P., Parmentier, V., and Colyer, G.: Parameterization of Water-ammonia Hail in Jupiter’s Atmosphere, Europlanet Science Congress 2022, Granada, Spain, 18–23 Sep 2022, EPSC2022-1147, https://doi.org/10.5194/epsc2022-1147, 2022.

L1.99
|
EPSC2022-932
|
ECP
Maria Smirnova, Eli Galanti, and Yohai Kaspi
The shallow layers of the Jovian atmosphere, the only regions accessible to direct investigation through in situ sampling and remote sensing experiments, are the looking glass through which the unknowns of the dynamical structure are revealed. Radio occultation measurements have proved to be a key factor in the study of planetary atmospheres’ thermal structure, dynamics and composition.
During both the extended Juno mission and the upcoming JUICE mission to Jupiter, an unprecedented number of radio occultations are planned to be performed, reaching to a depth of up to 2 bar, with much broader spatial coverage than previously performed.
These experiments could be used to better understand the physical properties and dynamics of Jupiter’s atmosphere, not only at the upper cloud level region (~1 bar) but also much deeper (down to 1000s bars), by using these measurements as constraints to general circulation models (GCMs) that simulate the flow on the gaseous planet.
Here, we develop a 3D general circulation model for the dynamical region of Jupiterdriven by a Newtonian cooling scheme with temperature fields derived either from the observed winds (thermal wind balance) or by using in-situ temperature measurements from the Cassini mission’s CIRS or TEXES instruments. The model is used to reproduce the dynamics of Jupiter at the upper levels (mainly the zonal jets) while allowing the dynamics to evolve freely below the cloud level. When the radio occultation experiments will be available for analysis, they could replace or be added to the above thermal profiles used to force the GCM. Combining radio occultations with dynamical modeling of the Jovian atmosphere, will lead to a twofold improvement of the understanding of the structure of the atmosphere at the cloud level and the deep atmospheric dynamics.

How to cite: Smirnova, M., Galanti, E., and Kaspi, Y.: Studying the dynamics of Jupiter using a 3D general circulation model constrained by radio occultation measurements, Europlanet Science Congress 2022, Granada, Spain, 18–23 Sep 2022, EPSC2022-932, https://doi.org/10.5194/epsc2022-932, 2022.

L1.100
|
EPSC2022-1053
|
ECP
Joshua Dreyer and Erik Vigren

Helium ions, He+, react only slowly with molecular hydrogen. A consequence of this is that He+ ions produced by, for example, photoionization of He in H2-dominated ionospheres, such as those of Jupiter and Saturn, can have principal loss mechanisms other than through reactions with molecular hydrogen even if the other reactants prevail in rather small volume mixing ratios. The Ion and Neutral Mass Spectrometer (INMS) onboard the Cassini mission operated in open-source ion mode during a few of the passages through Saturn’s upper atmosphere throughout the proximal orbits in 2017. Due to the high spacecraft velocity, exceeding 30 km/s, the retrieval of ion number densities was limited to light ion species with masses (for singly charged species) of < 8 Da. The retrieval of number densities of volatiles like H2O, CH4, NH3, N2 and CO were in part complicated by adsorption effects.

We seek to make an independent estimate of the mixing ratios of volatiles other than H2 and He by making use of a simple model focusing on the production and loss balance of helium ions. We first consider two models to estimate the local production rate of He+ from the measured density profiles of He and H2 and show that these give estimates in reasonable agreement with each other. Then we show that the calculated concentration of He+ exceeds the observed values by up to two orders of magnitude if we only account for the loss of He+ ions through reactions with molecular hydrogen. We take this as a strong indicator that the principal loss mechanism of He+ in Saturn’s ionosphere is through reactions with other species than H2. We proceed with a brief survey of chemical reaction databases highlighting that it seems reasonable to consider an effective rate constant of k≈ (1.0 ± 0.5)*10-9 cm3 s-1 for reactions involving the neutralization of He+ in reactions with H2O, CH4, NH3, N2 and CO. This allows us to estimate the mixing ratio of these molecules across an altitude profile. Our results are compatible with the average values reported by Miller et al. (2020) and show indications of enhanced mixing ratios towards lower altitudes and/or near equatorial latitudes.

How to cite: Dreyer, J. and Vigren, E.: Deriving mixing ratios of heavier neutral species in Saturn's ionosphere from light ion measurements, Europlanet Science Congress 2022, Granada, Spain, 18–23 Sep 2022, EPSC2022-1053, https://doi.org/10.5194/epsc2022-1053, 2022.

L1.101
|
EPSC2022-321
|
ECP
Siyuan Wu, Shengyi Ye, Georg Fischer, Caitriona Jackman, Jian Wang, John Menietti, Baptiste Cecconi, and Minyi Long

The reflection-by-sheath mechanism of 5 kHz narrowband emissions (NB) at Saturn is confirmed by Cassini observations during several crossings of the magnetopause, which show that the 5 kHz NB can be prevented from escaping Saturn's magnetosphere. The L-O mode 5 kHz NB remained visible in areas of low plasma density but disappeared in regions of high plasma density. In three cases, NB disappeared immediately after the crossings of Saturn's magnetopause. A possible reflected NB event observed near the magnetosheath is discussed. This mechanism can help explain the 5 kHz NB observed at low latitudes outside the Enceladus plasma torus and their upper frequency limit variations. This mechanism significantly improves the current understanding of the 5 kHz NB.

How to cite: Wu, S., Ye, S., Fischer, G., Jackman, C., Wang, J., Menietti, J., Cecconi, B., and Long, M.: Reflection and Refraction of the L-O Mode 5 kHz Saturn Narrowband Emission by the Magnetosheath, Europlanet Science Congress 2022, Granada, Spain, 18–23 Sep 2022, EPSC2022-321, https://doi.org/10.5194/epsc2022-321, 2022.