
Martian free oscillations: Search in SEIS data and implications
 2,1,3,1,4,4
- 1Institut de Physique du Globe de Paris-CNRS, Equipe Planétologie et Sciences Spatiales, Paris, France (lognonne@ipgp.fr)
- 2CSIC-ICTJA, Barcelona, Spain
- 3ISAE-SUPAERO, Toulouse University, Toulouse, France
- 4Jet Propulsion Laboratory, California Institute of Technology, Pasadena, CA, USA
Introduction: For a single seismometer, the most effective techniques for studying deep structure use norma mode frequencies, which do not require knowledge of the source location. Past modeling (Lognonné et al., 1996, Lognonné, 2005) suggest that Normal mode spectral peaks from 5–20 mHz (sensitive to mantle structure) are expected to have amplitude larger than the SEIS requirement (10-9 m/s2/Hz1/2) for moment larger than 2 1017 Nm (equivalent magnitude ∼5.5).
Even for the event 1222 from May, 4, 2022, with an estimated magnitude of 5, the amplitude of normal modes is therefore low and their identification will be challenging in the data recorded by the SEIS VBB (Lognonné et al., 2019).
Signal preprocessing: A very careful cleaning of the SEIS data is therefore requested, especially in order to remove most of the thermal glitches. If not made, the spectra are dominated by these glitches. This pre-cleaning allow to converge to a corrected signal, which is robust with respect to deglitching parameters (Figure 1).
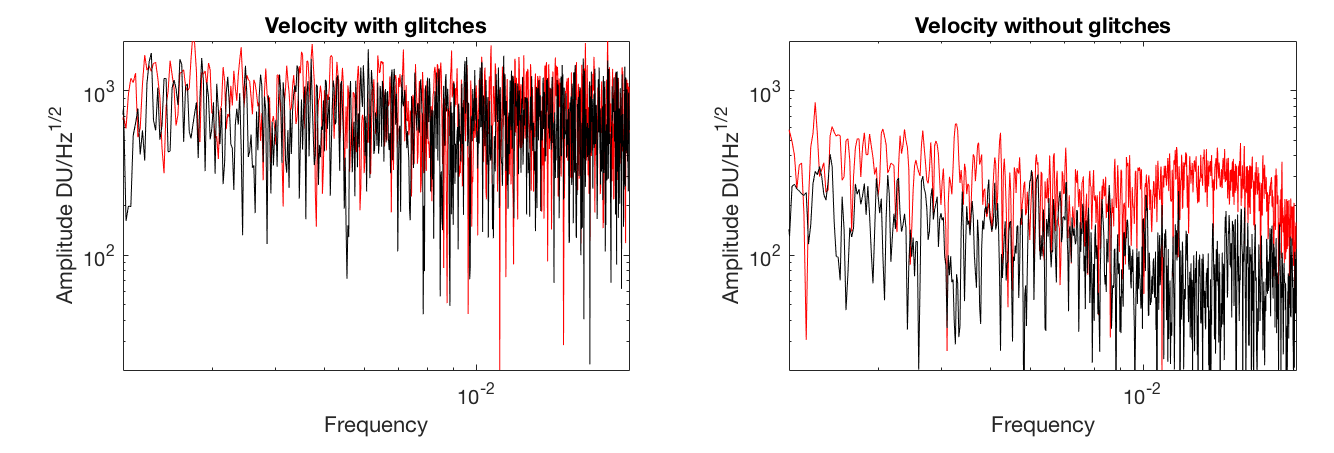
Figure 1: (left) raw VBBZ data and (right) deglitched VBB data. Spectra from the night following the 1222 event.
The further detection of modes relies on the identification of spectral peaks in the Fourier amplitude or power spectra. However, close to the background noise level these spectral peaks can be either due to small harmonic signals contaminated by noise or due to the fortuitous constructive interference of noise. Besides, harmonic signals may be perceptive only during a limited portion of the analyzed time series which together with other larger amplitude signals further complicate the detection. For these reasons, we employ phase autocorrelation spectra (Schimmel et al., 2018) and conduct also a Phasor-Walkout analysis (e.g., Zürn and Rydelek, 1994, Schimmel et al., 2002) to search for and evidence normal modes. In the following, we briefly summarize these strategies.
Phase autocorrelation spectra. The identification of modes and determination of their frequency are usually based on the computation of the power or energy spectral density (PSD or ESD) which can be obtained through the Fourier Transform of differently defined autocorrelations. ESD can be computed for transient waveforms and equals the squared amplitude spectrum of the seismic recording while PSD is employed when the time series cannot be directly Fourier transformed due to infinite signal energy. Although the underlying autocorrelations are differently defined, they measure the self-similarity of the time series to reveal the spectral contents. In Schimmel et al. (2018), the conventional autocorrelations have been replaced by the phase cross-correlation (PCC; Schimmel ,1999) to show that phase autocorrelations provide an approach which can further aid the detection of modes. PCC is amplitude unbiased as it is based on envelope normalized analytic signals. Inherent to this, PCC is much less affected by outlying signals and supplies robust and independent spectra.
Phasor-Walkout. The Phasor-Walkout approach (see Zürn and Rydelek, 1994 for a review and further references) is a graphical representation of the Fourier Transform at a given test-frequency. It pictures the construction of the amplitude spectrum as a vector summation in the complex number space. In this summation, each vector corresponds to a time sample where the sample amplitude and time provide the length of the vector and its angle or phase. The sum of all vectors equals the Fourier amplitude of the spectrum at that frequency. The “walk” of the vectors in the complex number space is called Phasor-Walkout and permits to assess how the spectral amplitude has been build up. If the vectors point into similar directions then the summation becomes constructive while random directions produce a destructive summation which depends on the individual vector amplitudes. For harmonic signals where the test-frequency matches the frequency of the oscillation the walk is straight while for pure random noise the Phasor-Walkout produces a random walk around its start point. Thus the qualitative inspection of Phasor-Walkout patterns may reveal the origin of spectral peaks.
Fig. 2 shows an example of phasor-walkouts at four different test frequencies. Amplitude scale
is arbitrary and each color marks a two hours segment of the data. The walk starts at (0,0) which corresponds to the MQS event origin time. The top right panel shows a random walk while the other three panels contain linear walkouts of more than 6 hours.
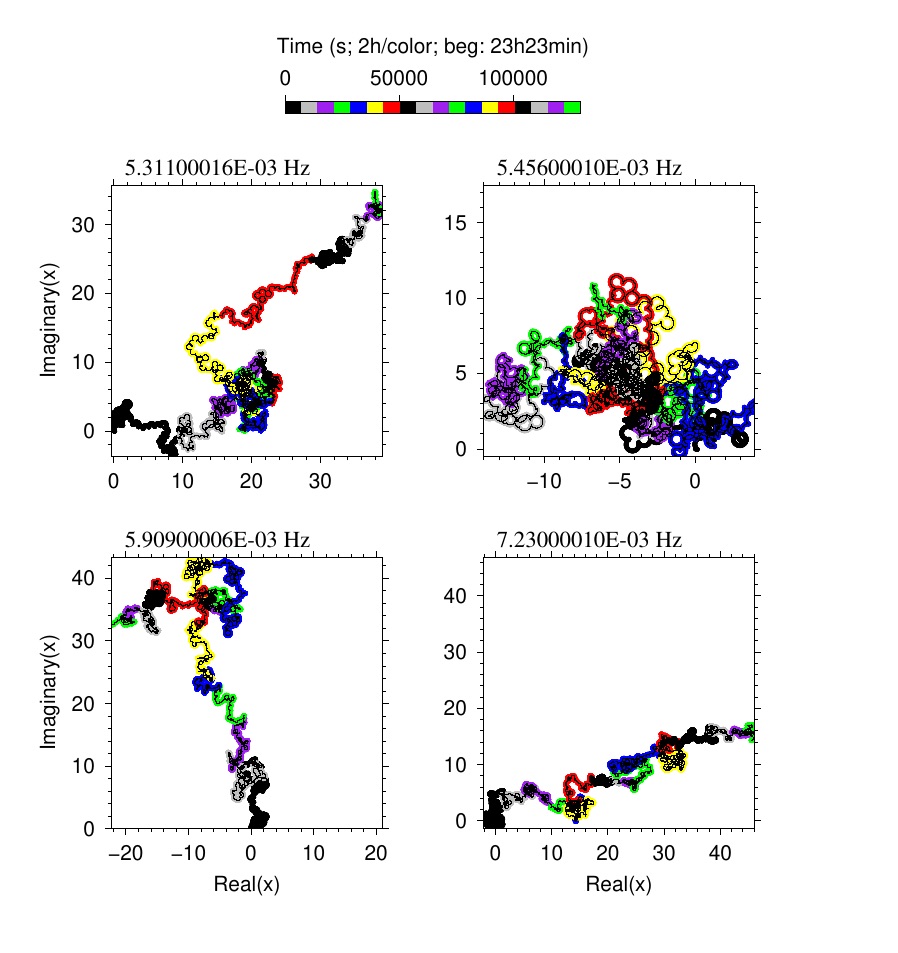
Figure 2: walkout for 4 test frequencies.
Further work is required to present clean walkouts validating normal modes in the signal of the largest marsquake recorded by SEIS. When achieved, these frequencies might be inverted and will provide new constraints on the interior structure of the planet (Panning et al., 2017)
References:
Lognonné, P., J. Gagnepain-Beyneix, W.B. Banerdt, S.Cacho, J.F. Karczewski, M. Morand, An Ultra-Broad Band Seismometer on InterMarsnet, Planetary Space Sciences, 44, 1237-1249, doi:10.1016/S0032-0633(96)00083-9, 1996.
Lognonné, P., Planetary seismology, Annual Review in Earth Planet. Sci., 33 :19.1-19.34, doi :10.1146/annurev.earth.33.092203.122605, 2005.
Lognonné, P., Banerdt, W.B., Giardini, D. et al., SEIS: Insight’s Seismic Experiment for Internal Structure of Mars, Space Sci Rev, 215, 12, doi : 1007/s11214-018-0574-6 , 2019.
Nishikawa, Y., Lognonné, P., Kawamura, T., Spiga, A., Stutzmann, E., Schimmel, M., Bertrand, T., Forget, F., K. Kurita, K., Mars’ Background Free Oscillations, Space Science Reviews 215:13, doi: 10.1007/s11214-019-0579-9, 2019.
Panning, M.P., P.Lognonné, W. B. Banerdt et al., Planned products of the Mars Structure Service for the InSight mission, Mars, Space Science review, 211, 611–650, doi: 10.1007/s11214-016-0317-5, 2017.
Schimmel M., Phase cross-correlations: design, comparisons and applications, Bull. Seismol. Soc. Am., 89, 1366-1378, 1999.
Schimmel M., J. Waterhouse, M.D. Marques, D. Weinert, Circadian and ultradian rhythmicities in very premature neonates maintained in incubators , Biol. Rhythm Res., 33, 83-111, doi:10.1076/brhm.33.1.83.1321 , 2002.
Schimmel, M., Stutzmann, E., Ventosa, S., Low-frequency ambient noise autocorrelations: Waveforms and normal modes, Seismological Research Letters, 89 (4), 1488-1496, doi: 10.1785/0220180027, 2018.
Zürn, W.; Rydelek, P., Revisiting the phasor-walkout method for detailed investigation of harmonic signals in time series, Surv. in geophys. 15, 409-431, 1994.
How to cite: Lognonné, P., Schimmel, M., Stutzmann, E., Drilleau, M., Samuel, H., Panning, M., and Banerdt, W. B.: Martian free oscillations: Search in SEIS data and implications, Europlanet Science Congress 2022, Granada, Spain, 18–23 Sep 2022, EPSC2022-738, https://doi.org/10.5194/epsc2022-738, 2022.