TP12
Session assets
Orals: Tue, 20 Sep, 15:30–17:00 | Room Machado
After an auspicious beginning, with the Ranger, Apollo and Viking missions carrying multiple seismometers into space, planetary seismology lay dormant for 40 years, save for a cruelly-extinguished hope on the Mars’96 mission. InSight put an end to this seismological drought with its landing on Mars in November, 2018, and subsequent deployment of the SEIS instrument two months later (Banerdt et al., 2020; Lognonné et al., 2019, 2020).
After a slow start (uncannily, no seismic events were detected for the first two months after deployment), the subsequent three-plus years have been an unqualified triumph for planetary seismology. Roughly 2700 seismic events have been detected and cataloged (Clinton et al., 2021; Ceylan et al., 2022), ranging from more than a thousand tiny SF events, thought to be locally-sourced thermal events, to a massive magnitude 5 marsquake more than 2000 km away, but still with a signal-to-noise ratio over 160,000. This catalog includes more than 30 Low Frequency and Broad-Band marsquake signals of quality A or B, meaning they have clear body-wave phase arrivals and, in the case of quality A, identifiable polarization. These have been clearly identified as teleseismic events, which taken together describe a set of ray paths that have probed the interior of the planet from the surface down to its core.
The analysis of this seismic data set has already transformed our knowledge of the interior structure of Mars. We have for the first time been able to directly measure the thickness of the crust beneath InSight (Knapmeyer-Endrun, et al., 2021; Kim et al., 2021; Durán et al., 2022; Drilleau et al., 2022) and the size of the martian core (Stähler et al., 2021). Analysis of the data has further allowed us to place tight constraints on the density of the core and crust, and the thermal profile of the mantle (Stähler et al., 2021; Khan et al., 2021, 2022; Wieczorek et al., 2022). In addition, SEIS’s observations have proved invaluable for studying the near-surface structure beneath InSight on scales from tens of centimeters to hundreds of meters (e.g., Lognonné et al., 2020; Banerdt et al., 2020; Kenda et al., 2020; Hobiger et al., 2021; Murdoch et al., 2021; Compaire et al., 2021, 2022).
InSight’s seismometer has also been able to study the current tectonics of Mars, providing a measure of the size distribution of seismic events (and thus a window into the rate of moment release) and a map of their geographic distribution (in particular, the strong concentration of Eastern hemisphere activity around Cerberus Fossae; Giardini et al., 2020; Stähler et al., 2022) and even revealing the source mechanisms responsible for some marsquakes, from which the orientation of stresses in the lithosphere can be inferred (Brinkman et al., 2021).
InSight and SEIS have proven conclusively the value of planetary seismology in general, and a single high-quality seismometer in particular, in understanding the solid planets of our solar system. The results described in this talk are only a subset of the work that has been done, and was derived from just the first round of analysis of SEIS data. As the seismic community becomes more familiar with the data set and it becomes more widely used, we can expect new insights into the geophysics of Mars for decades to come.
References:
Banerdt, W. B., and Smrekar, S. E., et al., 2020. Initial results from the InSight mission on Mars. Nat. Geosci. 13, 183–189. https://doi.org/10.1038/s41561-020-0544-y
Brinkman, N., et al., 2021. First focal mechanisms of marsquakes, J. Geophys. Res. Planets, e2020JE006546. https://doi.org/10.1029/2020JE006546
Ceylan, S., et al., 2022. The marsquake catalogue from InSight, sols 0-1011, Phys. Earth Planet. Int., in press.
Clinton, J., et al., 2021. The Marsquake Catalogue from InSight, Sols 0-478, Phys. Earth Planet. Int. 310, 106597. https://doi.org/10.1016/j.pepi.2020.106597
Compaire, N., et al., 2021. Autocorrelation of the ground vibrations recorded by the SEIS-InSight seismometer on Mars, J. Geophys. Res. Planets 126, e2020JE006498. https://doi.org/10.1029/2020JE006498
Compaire, N., et al., 2022. Seasonal variations of subsurface seismic velocities monitored by the SEIS-InSight seismometer on Mars, Geophys. J. Int. 229:2, 776–799. https://doi.org/10.1093/gji/ggab499
Drilleau, M., et al., 2022. Marsquake location and 1-D seismic models for Mars from InSight data, J. Geophys. Res. Planets, in press.
Durán, C., et al., 2022. Seismology on Mars: An analysis of direct, reflected, and converted seismic body waves with implications for interior structure, Phys. Earth Planet. Int., in press.
Hobiger, M., et al., 2021. The shallow structure of Mars from inversion of high-frequency ambient seismic vibrations Rayleigh wave ellipticity at the InSight landing site, Nat. Comm. 12, 6756,. https://doi.org/10.1038/s41467-021-26957-7
Kenda, B., et al., 2020. Subsurface structure at the InSight landing site from compliance measurements by seismic and meteorological experiments, J. Geophys. Res. Planets 125, 6, e2020JE006387. https://doi.org/10.1029/2020JE006387
Khan, A., et al., 2021. Upper mantle structure of Mars from InSight seismic data, Science, 373, 434-438. https://doi.org/10.1126/science.abf2966
Khan, A., et al., 2022. Geophysical and cosmochemical constraints on the bulk composition of Mars , Earth Planet. Sci. Lett. 578. https://doi.org/10.1016/j.epsl.2021.117330
Kim, D., et al., 2021. Improving constraints on planetary interiors with PPs receiver functions, J. Geophys. Res. Planets 126, e2021JE006983. https://doi.org/10.1029/2021JE006983
Knapmeyer-Endrun, B., et al., 2021. Thickness and structure of the martian crust from InSight seismic data, Science, 373, 438-443. https://doi.org/10.1126/science.abf8966
Lognonné, P., et al., 2020. Constraints on the shallow elastic and anelastic structure of Mars from InSight seismic data. Nat. Geosci. 13, 213–220. https://doi.org/10.1038/s41561-020-0536-y
Murdoch, N., et al., 2021. Constraining Martian regolith and vortex parameters from combined seismic and meteorological measurements, J. Geophys. Res. Planets 126, e2020JE006410. https://doi.org/10.1029/2020JE006410
Stähler, S. C., et al., 2021. Seismic detection of the martian core, Science, 373, 443-448. https://doi.org/10.1126/science.abi7730
Stähler, S., et al., 2022. Marsquakes indicate dike-induced tectonics in Cerberus Fossae, Mars, Nature Geoscience, in press.
Wieczorek, M., et al., 2022. InSight constraints on the global character of the Martian crust, J. Geophys. Res. Planets, e2022JE007298. https://doi.org/10.1029/2022JE007298
How to cite: Banerdt, B. and the InSight Science Team: InSight’s Contributions to Planetary Seismology and Geophysics, Europlanet Science Congress 2022, Granada, Spain, 18–23 Sep 2022, EPSC2022-773, https://doi.org/10.5194/epsc2022-773, 2022.
We report the results of more than 2 years of monitoring the rotation of Mars with the RISE instrument on InSight. Small periodic variations of the spin axis orientation, called nutations, can be extracted from the Doppler data with enough precision to identify the influence of the Martian fluid core. For the first time for a planetary body other than the Earth, we can measure the period of the Free Core Nutation (FCN), which is a rotational normal mode arising from the misalignment of the rotation axes of the core and mantle. In this way, we confirm the liquid state of the core and estimate its moment of inertia as well as its size.
The FCN period depends on the dynamical flattening of the core and on its ability to deform. Since the shape and gravity field of Mars deviate significantly from those of a uniformly rotating fluid body, deviations from that state can also be expected for the core. Models accounting for the dynamical shape of Mars can thus be tested by comparing core shape predictions to nutation constraints. The observed FCN period can be accounted for by interior models having a very thick lithosphere loaded by degree-two mass anomalies at the bottom.
The combination of nutation data and interior structure modeling allows us to deduce the radius of the core and to constrain its density, and thus, to address the nature and abundance of light elements alloyed to iron. The inferred core radius agrees with previous estimates based on geodesy and seismic data. The large fraction of light elements required to match the core density implies that its liquidus is significantly lower than the expected core temperature, making the presence of an inner core highly unlikely. Besides, the existence of an inner core would lead to an additional rotational normal mode the signature of which has not been detected in the RISE data.
How to cite: Rivoldini, A., Le Maistre, S., Caldiero, A., Yseboodt, M., Baland, R.-M., Beuthe, M., Van Hoolst, T., Dehant, V., Folkner, W., Buccino, D., Kahan, D., Marty, J.-C., Antonangeli, D., Badro, J., Drilleau, M., Konopliv, A., Peters, M.-J., Plesa, A.-C., Samuel, H., and Tosi, N. and the InSight/RISE team: A view into the deep interior of Mars from nutation measured by InSight RISE, Europlanet Science Congress 2022, Granada, Spain, 18–23 Sep 2022, EPSC2022-1101, https://doi.org/10.5194/epsc2022-1101, 2022.
Introduction: NASA’s InSight lander has been operating on the surface of Mars for over 1200 Martian solar days (sols). Despite decreasing power, the lander has acquired near continuous seismic data throughout the mission to date. The Marsquake Service (MQS) performs daily analysis of the data and catalogues the seismicity. The catalogue currently contains over 1300 local, regional and teleseismic marsquakes and more than 1300 events that are likely associated with thermal cracking close to the lander (Table 1). Here we will present the latest update on the marsquake catalogue.
Martian Seismic Data: The Martian seismic dataset is often heavily contaminated by atmospheric effects, especially during the daytime and in the Northern hemisphere autumn and winter (Figure 1)[1,2]. This environmental noise can obscure the seismicity which is often at low amplitudes. During spring and summer, the atmospheric conditions are much more favourable from shortly before sunset until approximately sunrise and much of the MQS catalogue is detected during these hours. Other transient effects on the data that can interfere with event detection are discussed in [3]. One notable feature of the seismic noise on Mars is a resonance at 2.4 Hz which is observed during quiet periods and is also excited by seismic events that contain energy at that frequency. This resonance is likely caused by sub-surface structure [4] and greatly enhances the detection rate of higher frequency events.
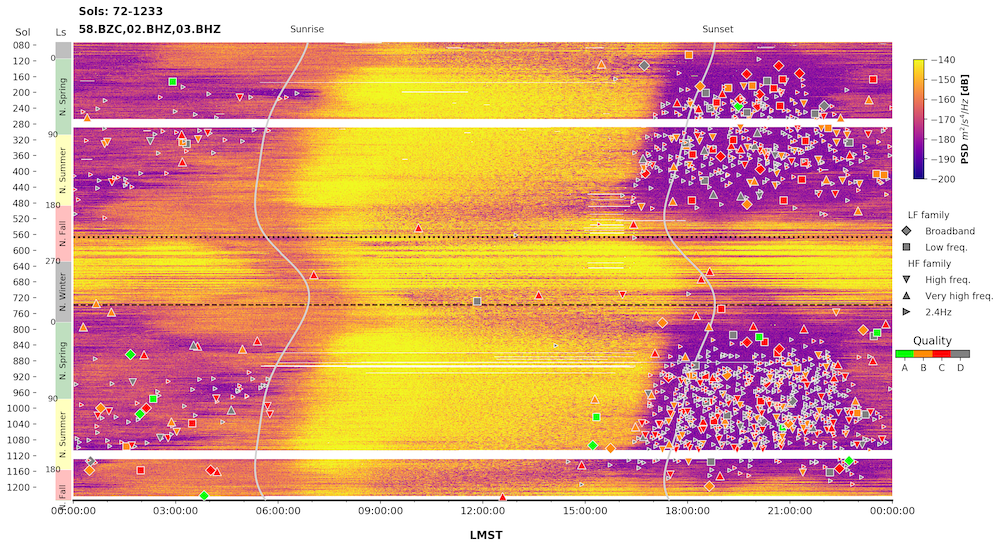
Figure 1: Daily spectrograms of VBB vertical component stacked from sol 72 to sol 1233 with catalogued marsquakes overlain. White lines are where data were not recorded. The black dotted line represents the equivalent sol in mission year 1 to sol 1233. The black dashed line marks 1 year since SEIS was fully deployed.
Marsquake Types and Qualities: MQS categorises marsquakes based on their frequency content and their location quality [2,5]. A full description of the categories and qualities can be found in [2], here we list the general characteristics:
Low Frequency (LF): All energy is below 2.4 Hz and most of the time below 1 Hz.
Broadband (BB): Energy is predominantly at low frequencies but can include energy at and above 2.4 Hz.
2.4 Hz: Energy is contained in a narrow frequency band around 2.4 Hz, reaching a maximum of 4 Hz. These events are thought to be low amplitude versions of High Frequency events.
High Frequency (HF): Energy is predominantly at 2.4 Hz but also extends above 4 Hz. There may also be energy at low frequencies but the dominant energy is at higher frequencies (as opposed to BB events).
Very High Frequency (VF): Energy is at high frequencies, sometimes reaching up to 30 Hz. Energy is strongest on the horizontal components, especially at higher frequencies.
Super High Frequency (SF): very short duration (~10s of seconds) events with mainly horizontal energy between 5-10 Hz. These events are highly temperature dependent and are likely due to thermal cracks observed in the near surface close to the lander [6].
For all except SF events a location quality is assigned based on the ability to identify phase picks and locate the event as follows:
Quality A: Multiple clear phases are identified, and clear polarisation can be defined. The source is well located with distance and backazimuth.
Quality B: Either the distance or the backazimuth is clear but not both. A full location cannot be provided. When clear phases are identified distance is calculated.
Quality C: Clear seismic signal is observed but phases are not readily assigned, nor polarisation identified. A distance may be assigned but will be uncertain.
Quality D: The signal has low signal to noise either due to a low amplitude signal or high contamination from environmental noise. No location is given and there is a small risk that the event may not be tectonic in origin.
The Marsquake Catalogue: The marsquake catalogue is released every three months with a three-month delay. The latest release is V10 [7]. The catalogue includes not only the type and quality of the events but also general information such as location, origin, magnitude and any secondary phases that have been picked. Table 1 shows the total seismicity catalogued up to sol 1233.
Table 1
|
Event Type |
Total |
A |
B |
C |
D |
|
LF |
56 |
6 |
11 |
21 |
18 |
|
BB |
37 |
6 |
10 |
16 |
5 |
|
2.4 Hz |
988 |
0 |
49 |
353 |
586 |
|
HF |
164 |
0 |
76 |
79 |
9 |
|
VF |
69 |
0 |
25 |
33 |
11 |
|
SF |
1383 |
0 |
0 |
323 |
1060 |
Noteworthy New Events: The V10 catalogue [7] and data release [8] contain some significant new events including 6 new Quality A events. Most notable is S1094b, BB, QA. This event, with MwMa=4.0 is one of the largest BB events ever detected and originates in a region where no previous seismicity had been seen with a distance of ~60° and a backazimuth of 40°.
We will also introduce the largest event ever recorded on Mars, S1222a.
Summary: The InSight lander has provided an incredible seismic dataset and the MQS has meticulously catalogued the seismicity. Now well into its extended mission the seismicity from the second Martian year of operations has been exceptional and MQS will continue to add to the catalogue.
References: [1] Lognonné et al., 2020, Nature Geo., 13(3), 213-220. DOI: 10.1038/s41561-020-0536-y, [2] Clinton et al., 2021, Physics of the Earth and Planetary Interiors, 310, 106595, DOI: 10.1016/j.pepi.2020.106595, [3] Ceylan et al., 2021, Physics of the Earth and Planetary Interiors, 310, 106597, DOI: 10.1016/j.pepi.2020.106597, [4] Hobiger et al., 2021, Nature Comms, 12(1), 1-13, DOI: 10.1038/s41467-021-26957-7, [5] Giardini et al., 2020, Nature Geo., 13(3) 205-212, DOI: 10.1038/s41561-020-0539-8, [6] Dahmen et al., 2020, J. Geophys. Res., 126, p.e.2020JE006599, DOI: 10.1029/2020JE006599, [7] InSight Marsquake Service (2022), Mars Seismic Catalogue, InSight Mission; V10 2022-04-01, ETHZ, IPGP, JPL, ICL, Univ. Bristol,
https://doi.org/10.12686/a16, [8] InSight Mars SEIS Data Service, 2022, SEIS raw data, InSight Mission, IPGP, JPL, CNES, ETHZ, ICL, MPS, ISAE-Supaero, LPG, MFSC, DOI: 10.18715/SEIS.INSIGHT.XB_2016
How to cite: Horleston, A., Clinton, J., Ceylan, S., Kawamura, T., Stähler, S. C., Charalambous, C., Dahmen, N. L., Duran, C., Kim, D., Plasman, M., Zenhäusern, G., Euchner, F., Knapmeyer, M., Giardini, D., Lognonné, P., Pike, W. T., Panning, M., Smrekar, S., and Banerdt, W. B.: The Seismicity of Mars as Recorded by InSight's Marsquake Service, Europlanet Science Congress 2022, Granada, Spain, 18–23 Sep 2022, EPSC2022-880, https://doi.org/10.5194/epsc2022-880, 2022.
Abstract
The seismic data collected by the SEIS (seismic experiment for the interior structure of Mars) [1] package on the NASA InSight mission provide a way to obtain the structure and properties of Mars [2,3]. As the seismometer is installed on the surface, it is also sensitive to atmospherically generated signals from the pressure and wind [4]. These can constrain the ability to observe seismic events. To that end, in Stott et al. 2022 [5], we recently proposed machine learning models to predict the seismic energy from the pressure, wind and temperature data recorded by the dedicated sensors in the APSS (auxiliary payload sensor suite) and TWINS (temperature and wind for InSight) sensor packages. This yields a tool to analyse and discover marsquakes.
A machine learning model for predicting seismic noise
The inputs used for the machine learning model are:
- The pressure and the envelope of the pressure
- The wind speed and direction from two sensor booms
- The air temperature from each sensor boom
These inputs are fed into the machine learning models to predict the seismic velocity energy for the vertical (Z) and horizontal (North and East) axes in the low frequency (0.4-1Hz) and high frequency (2.2-2.6Hz) regions, as these cover the predominant excitations in both categories of marsquakes in the catalogue [6].
Two methods were proposed, the first using gaussian process regression [7] and the second using a neural network [8]. The neural network was found to have superior prediction performance. However, the gaussian process regression model could be used to better dig into the physical relationships between wind, pressure and the ground motion owing to the form and the probabilistic nature of the method.
Marsquake analysis
Figure 1 shows the prediction and observed data for a period containing a marsquake. Before and after the marsquake the observed and predicted data match well, but during the marsquake they diverge indicating the event not to be generated by atmospheric effects. This event is classified as a 2.4Hz event. This class of event typically only exhibits excitation around the 2.4Hz resonance [6,9,10]. However, the prediction in the 0.4-1Hz bandwidth indicates there is some separate energy. Examining the machine learning prediction across the marsquake catalogue shows low frequency energy occurs consistently in the higher frequency classes of events for greater event magnitudes.
Detecting new events and seismic detectivity
The proposed machine learning models identify marsquakes as separate from the background atmospherically generated noise. This can be used to discover new marsquakes as outliers. An algorithm based on this concept was proposed and is demonstrated in Figure 2. Using this approach, a further 32 good candidate events are found along with another 34 suggestions.
Conclusion
Machine learning is a nascent technology in planetary science, whereby it provides a powerful tool to fit datasets using mathematical complexity. Here, we present a model to fit the atmospheric data to the seismic data from the NASA InSight mission. In doing so we
- Provide insights on the relationship between ground motion and the wind, pressure and temperature
- Provide a tool to analyse marsquakes
- Enable the detection of new marsquakes
In this way the machine learning models offer new information about marsquakes and also enable the study of their detectivity to help place constraints on the seismicity of Mars.
References
[1] Lognonné et al. SSR 2019
[2] Giardini et al. Nat. Geosci 2020
[3] Stähler et al. Science 2022
[4] Charalambous et al. JGR: Planets 2021
[5] Stott et al. Submitted 2022
[6] Clinton et al. PEPI 2021
[7] Williams and Rasmussen, MIT Press, 2006
[8] Goodfellow et al. MIT Press 2016
[9] Compaire et al. JGR: Planets 2021
[10] Dahmen et al. BSSA 2021
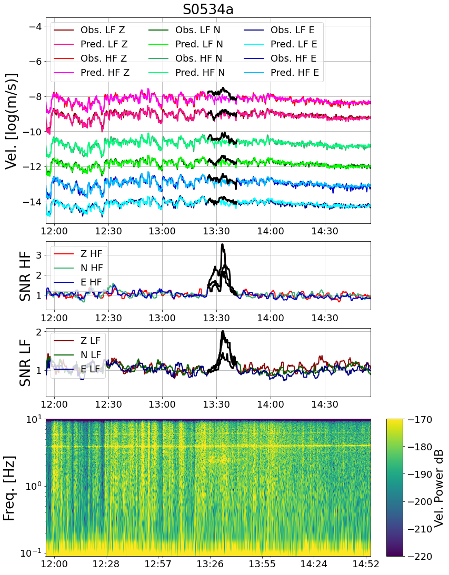
Figure 1: The S0534a 2.4Hz event with the machine learning model prediction. The top panel shows the observed seismic energy compared to the prediction where the energy during the event is seen to diverge. The second and third panels show the SNR (signal to noise ratio) calculated between the observed and predicted signal for the HF (2.2-2.6Hz) and LF (0.4-1Hz) bandwidths respectively. The bottom panel shows the velocity spectrogram during the event.
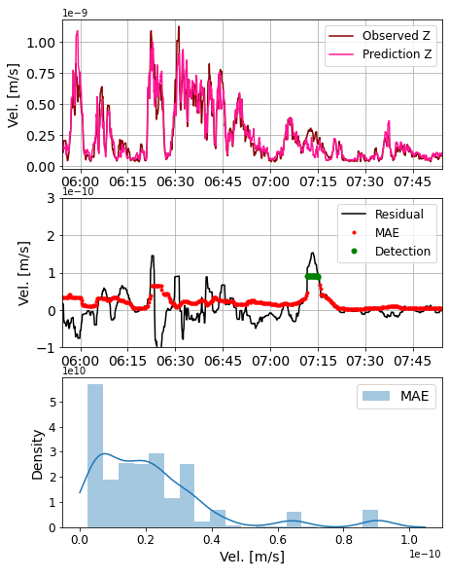
Figure 2: Figure showing the detection of a new event with the algorithm in [5]. The top panel shows the prediction from the machine learning model and the observed data. The middle panel shows the detrended residual and the smoothed MAE (mean absolute error) highlighting the outlying points indicating an event. The bottom panel shows the histogram (over a 2 hour window) of the MAE where the points belonging to the event are seen to be outliers in the distribution.
How to cite: Stott, A., Garcia, R., Chédozeau, A., Spiga, A., Murdoch, N., Pinot, B., Mimoun, D., Charalambous, C., Horleston, A., King, S., Kawamura, T., Dahmen, N., Barkaoui, S., Lognonné, P., and Banerdt, W.: Using machine learning to separate atmospherically generated noise from marsquakes, Europlanet Science Congress 2022, Granada, Spain, 18–23 Sep 2022, EPSC2022-833, https://doi.org/10.5194/epsc2022-833, 2022.
The InSight (Interior Exploration using Seismic Investigations, Geodesy and Heat Transport) lander is providing an unprecedented set of high frequency records of ground deformations, pressure and wind at the surface of Mars. Seismic and acoustic waves from impacts have been observed by SEIS seismometer through the ground movements that they generate, and their sources as impacts have been confirmed with orbital images of newly appearing craters. Three impacts have been identified and located, and one additional seismic event is consistent with a date-constrained new impact. Several other events are currently being investigated as well. Arrival times and polarization of seismic and acoustic waves were used to estimate impact locations. These estimated locations were subsequently confirmed by orbital imaging of associated craters and temporal matches to the events times, with previous orbital images showing no craters. Crater dimensions and estimates of meteoroid trajectories from images allow us to understand and model the recorded seismograms. The precise source locations provided by impacts as compared to tectonic sources provide direct constraints on the structure of the martian interior. First arrival seismic waves confirm the previously determined crustal models, and the dispersion of trapped acoustic waves confirms the current models of sound speed and wind in the atmosphere. In addition, these observations provide the first ground-truth for distance-amplitude scaling relationships between impacts and the mechanical waves for Mars. They confirm the relationship between the seismic moment of impacts and the vertical impactor momentum, and demonstrate the capability of planetary seismology to constrain impact rates and internal structure of terrestrial planetary objects throughout the solar system.
How to cite: Garcia, R. F. and the InSight and CTX science teams: First seismo-acoustic location and orbital imaging of recent impacts on Mars: constraints on atmosphere and interior structure and impact processes, Europlanet Science Congress 2022, Granada, Spain, 18–23 Sep 2022, EPSC2022-10, https://doi.org/10.5194/epsc2022-10, 2022.
The InSight (Interior Exploration using Seismic Investigations, Geodesy and Heat Transport) mission has been collecting high-quality seismic data on Mars for over 1200 Martian solar days (sols), providing the first direct observations of its interior structure. In this study, we report on a complete analysis of low-frequency (LF) seismic evens (main energy below 1 Hz), that have proven essential for understanding the deep interior of Mars [1], [3]-[5]. As Martian seismograms are generally characterized by a low signal-to-noise ratio and strong scattering, data selection and processing is central for the identification and consistent picking of body-wave arrivals. To this end, we employ complementary approaches, including: 1) narrow-band-filtered time-domain envelopes; 2) polarised waveforms and their time-domain envelopes; 3) polarisation analysis; and 4) waveform matching. An example of the application of the first two approaches to identify body-wave arrivals is shown in Fig 1. The careful application of this 4-step processing scheme to each LF event has resulted in a significant increase in body wave phase picks, encompassing direct, reflected, and converted body waves, relative to earlier analyses [1]. With our method, all phases are obtained through iterative refinement, which relies on inverting an initial set of phase picks for models of interior structure, event distance, and depth, while predicting travel times for additional seismic phases. Based on the predictions, we re-pick (every pick is subject to our 4-step processing scheme), thereby enlarging our differential travel-time data set (all picks are relative to the main P- or PP-wave arrival), and subsequently re-invert for an updated set of interior structure models, event distances, and depths. Through application of iterative refinement to new seismic data, we continuously update information on radial velocity models of the crust, mantle, and core, as well as source parameters, and phase picks. The recent identification of the most distant marsquakes recorded by the InSight mission and the first core-diffracted P-wave [2] allows constraints on the P-wave velocity structure of the lower mantle (see distant event in Fig 2) that hitherto could not be constrained because of lack of lower-mantle-traversing P-waves. In addition, on sol 1222, InSight detected the largest event ever recorded on Mars, providing a unique opportunity to understand the interior of Mars through the identification of waves that could not be identified in earlier events because of their low signal-to-noise ratio. Our iterative refinement procedure demonstrates that through continued analysis of new events, our knowledge and understanding of the interior of Mars will steadily improve.
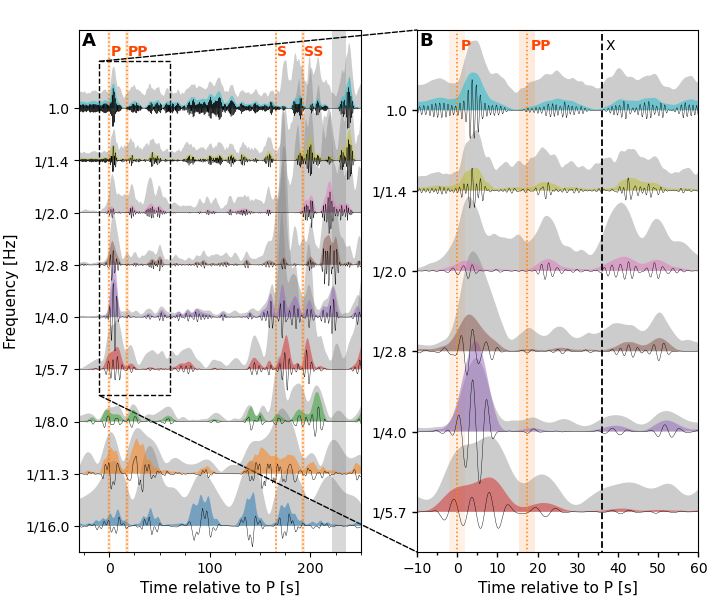
Figure 1: Vertical-component time-domain envelopes and polarised traces for event S0235b across different frequency bands (filter banks). Grey envelopes depict unpolarised time-domain envelopes. Polarised traces and their envelopes are shown in black (lines) and colored envelopes, respectively. Initial seismic phase picks for S0235b and their uncertainties are shown as vertical dotted lines and orange bars, respectively. . The vertical grey bar in panel (A) represents a glitch. Panel (B) shows a zoomed-in version of the P-wave phases in (A). The vertical dashed line in (B) denoted by X, indicates another possible seismic wave arrival. Amplitudes of traces and envelopes are normalized by their maxima and scaled for better visualisation.
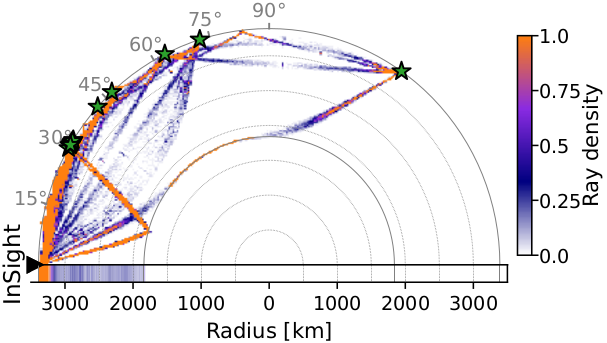
Figure 2: Body-wave (P, S, PP, SS, PPP, SSS, ScS and Pdiff) ray path geometry for 15 low-frequency events. Events are indicated by green stars and InSight is represented by a black triangle. The colorbar indicates ray path density in the form of the number of rays that pass through a certain area based on inverted models [1], which accounts for the diffuseness of ray paths. The radial sensitivity computed as the integrated ray path density with epicentral distance is shown at the bottom.
References:
[1] C. Durán, A. Khan, S. Ceylan, et al., “Seismology on Mars: An analysis of direct, reflected, and converted seismic body waves with implications for interior structure,” Physics of the Earth and Planetary Interiors, vol. 325, p. 106 851, 2022, issn: 0031-9201. doi: 10.1016/j.pepi.2022.106851.
[2] A. C. Horleston, J. F. Clinton, S. Ceylan, et al., “The Far Side of Mars: Two Distant Marsquakes Detected by InSight,” The Seismic Record, vol. 2, no. 2, pp. 88–99, Apr. 2022, issn: 2694-4006. doi: 10.1785/0320220007.
[3] A. Khan, S. Ceylan, M. van Driel, et al., “Upper mantle structure of Mars from InSight seismic data,” Science, vol. 373, no. 6553, pp. 434–438, 2021, issn: 0036-8075. doi: 10.1126/science.abf2966.
[4] A. Khan, P. Sossi, C. Liebske, A. Rivoldini, and D. Giardini, “Geophysical and cosmochemical evidence for a volatile-rich Mars,” Earth and Planetary Science Letters, vol. 578, p. 117 330, 2022, issn: 0012-821X. doi: 10.1016/ j.epsl.2021.117330.
[5] S. C. Stähler, A. Khan, W. B. Banerdt, et al., “Seismic detection of the martian core,” Science, vol. 373, no. 6553, pp. 443–448, 2021, issn: 0036-8075. doi: 10.1126/science.abi7730.
How to cite: Durán, C., Khan, A., Ceylan, S., and Giardini, D.: Seismology on Mars: Analysis and identification of body-waves with implications for Martian structure, Europlanet Science Congress 2022, Granada, Spain, 18–23 Sep 2022, EPSC2022-969, https://doi.org/10.5194/epsc2022-969, 2022.
Introduction: The identification of deep reflected phases in the InSight mission seismic recording as core reflected phases have led to the first seismic detection of the Martian core [1]. These results indicated that the core size of Mars spans the higher end of InSight pre-mission estimates, implying a large fraction of Sulfur in the core together with smaller fractions of O, C, and H.
The presence of well-separated silicate and metallic envelopes indicates that Mars experienced an early global magma ocean stage whose crystallisation likely led to the formation of a compositionally distinct layer at the bottom of the mantle [2]. Such a layer is expected to be heavily enriched in heat-producing elements and in iron, leading to long-term stability with little mixing between the layer and the overlying mantle. The presence of this enriched basal layer often yields the development of a molten silicate layer above the core that could act as a deep seismic reflector [3].
Objectives and approach: To test the compatibility of Martian mantle layering with seismic data, we conducted Monte Carlo Markov chain inversions in which the long-term thermo-chemical history of Mars’ main envelopes is embedded into the forward problem (Fig. 1). Contrary to more classical approaches that directly invert for seismic velocities and density along a radial planetary profile, we explore a different and smaller model space that consists in parameters that govern the thermo-chemical evolution of Mars: the planetary initial thermal state, the core size, the mantle rheology, or the crustal enrichment in heat-producing element with respect to the mantle. For each model we evolve the system for 4.5 Gyr.
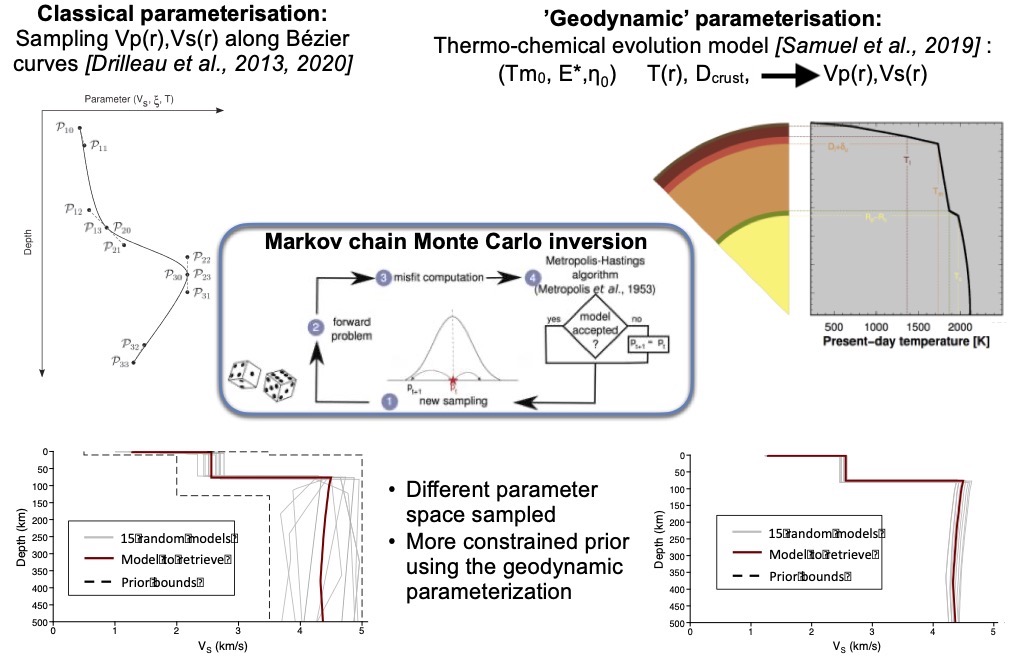
Figure 1: Schematic representation of a classical [5] (left) and a geodynamic parameterization [4] (used here) to infer Mars’ seismic structure via Monte Carlo Markov chain inversion of seismic data.
This results in thermal structures at present-day that are converted into seismic structures [4]. This approach allows for a more coherent and more constrained profile than in classical inversions (Fig. 1), due to the more informative prior considered, and allows reconstructing the long-term history of the planet. Our inversion approach also considers an enriched silicate layer above the core-mantle boundary and we therefore invert for the layer thickness and for its thermal conductivity. We used the most recent travel time dataset that contains considerably more shallow and deep phases compared to previous studies.
Altogether, this allows us to test the hypothesis of the presence of a molten layer at the top of Mars' core, along with the associated consequences on the interpretation of seismic, geodetic, and geochemical data.
Results: Our inversion results indicate that the presence of a basal mantle layer is at least as compatible with seismic data than a homogeneous Martian structure (Fig. 2).
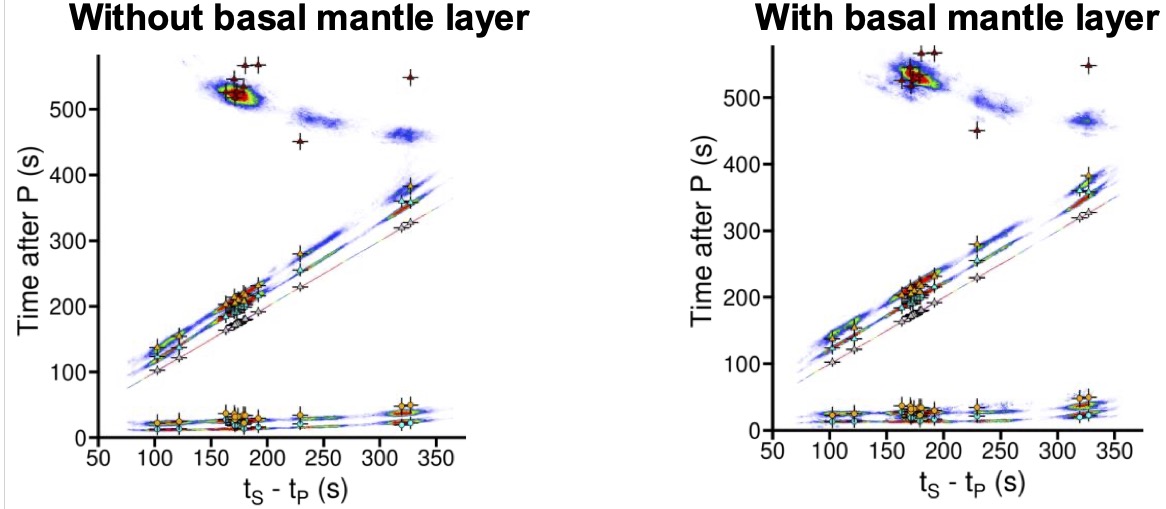
Figure 2: Data fit for the inversion output considering a basal mantle layer (left) or a homogeneous mantle (right). Warm and cold colors indicate respectively high and small probability densities.
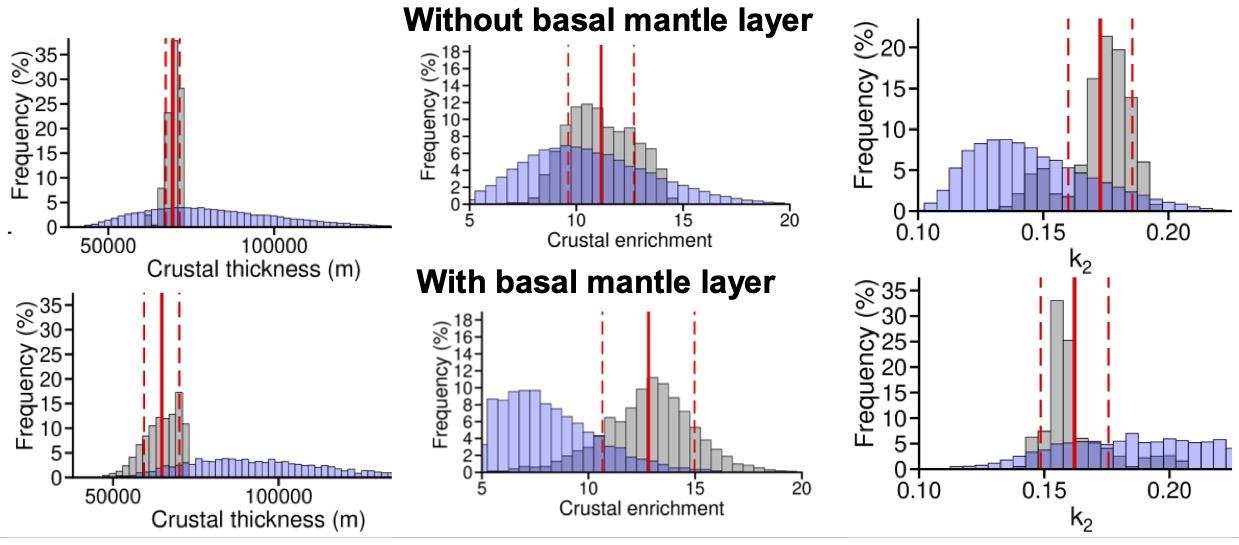
Figure 3: Inversion results without (top) and with (bottom) a mantle stratification. Prior (grey) and posterior (blue) distribution for several inverted parameters. The plain and dashed red lines indicate the posterior mean value and 1-sigma range.
Fig. 3 shows that the basal mantle layer yields a thinner, crust less enriched in heat-producing element than in the case of a homogeneous mantle. It also shows that a basal mantle layer is also compatible with geodetic constraints on k2 values: 0.174±0.008 [7], in good agreement with theoretical predictions [3].
Conclusions: Our new inversion results indicate that the presence of a basal mantle layer is compatible with seismic data. The basal mantle layer stores a significant fraction of heat-producing elements and depletes the rest of the mantle. This reduces shallow mantle heating and melting leading to thinner crusts that are more compatible with receiver functions and gravity data constraints [8]. Finally, the presence of the enriched basal mantle layer is also compatible with the Love number values for Mars [7]. We will present more advanced inversion results using an augmented database that will contain additional phases, including phases that are most sensitive to the deep mantle structure (e.g., Pdiff).
References:
[1] Stähler, S., et al., Science 373, 443–448 (2021)
[2] Elkins-Tanton, L. et al., JGR., doi:10.1029/2005JE002480 (2003)
[3] Samuel, H. et al., JGR, doi:10.1029/2020JE006613 (2021).
[4] Drilleau, M. et al., G. J. Int., 226, 1615-1644 (2021)
[5] Drilleau M., et al., G. J. Int., 195, 1165-1183 (2013)
[6] Khan, A., et al., Science, 373, 434-438 (2021)
[7] Konopliv, A. et al., JGR, 47, doi: 10.1029/2020GL090568 (2020)
[8] Knapmeyer-Endrun, B. et al., Science, 373 (2021)
How to cite: Samuel, H., Drilleau, M., Garcia, R., Huang, Q., Rivoldini, A., Lognonné, P., and Banerdt, B.: Testing the Presence Deep Martian Mantle Layering in the light of InSight Seismic Data, Europlanet Science Congress 2022, Granada, Spain, 18–23 Sep 2022, EPSC2022-297, https://doi.org/10.5194/epsc2022-297, 2022.
Orals: Wed, 21 Sep, 10:00–11:30 | Room Machado
On the 1222nd sol of the InSight mission (or May the Fourth of 2022), a seismic event was detected that turned out to be the largest marsquake recorded so far. At a moment magnitude of 4.7, event S1222a released as much seismic moment as all seismic events previously catalogued by InSight together, and greatly surpasses the second largest event, S0976a.
The frequency of occurrence of earthquakes follows a power law with an exponent (the b value) close to 1 over a wide range of magnitudes. The class of Low Frequency marsquakes, to which S1222a belongs, shows a similar behaviour. At low magnitudes, the slope of the cumulative distribution suggests that the InSight marsquake catalog for Low Frequency events is representative for events with moment magnitude exceeding 3 (Figure 1). Up to and including the occurrence of event S0976a one could however guess that events larger than magnitude approx. 3.6 might be less frequent than predicted by this power law. Event S1222a mends this apparent decrease, and the b value derived from all events is 1 within the formal uncertainty. Hence the resulting distribution follows a power law for events exceeding magnitude 3.
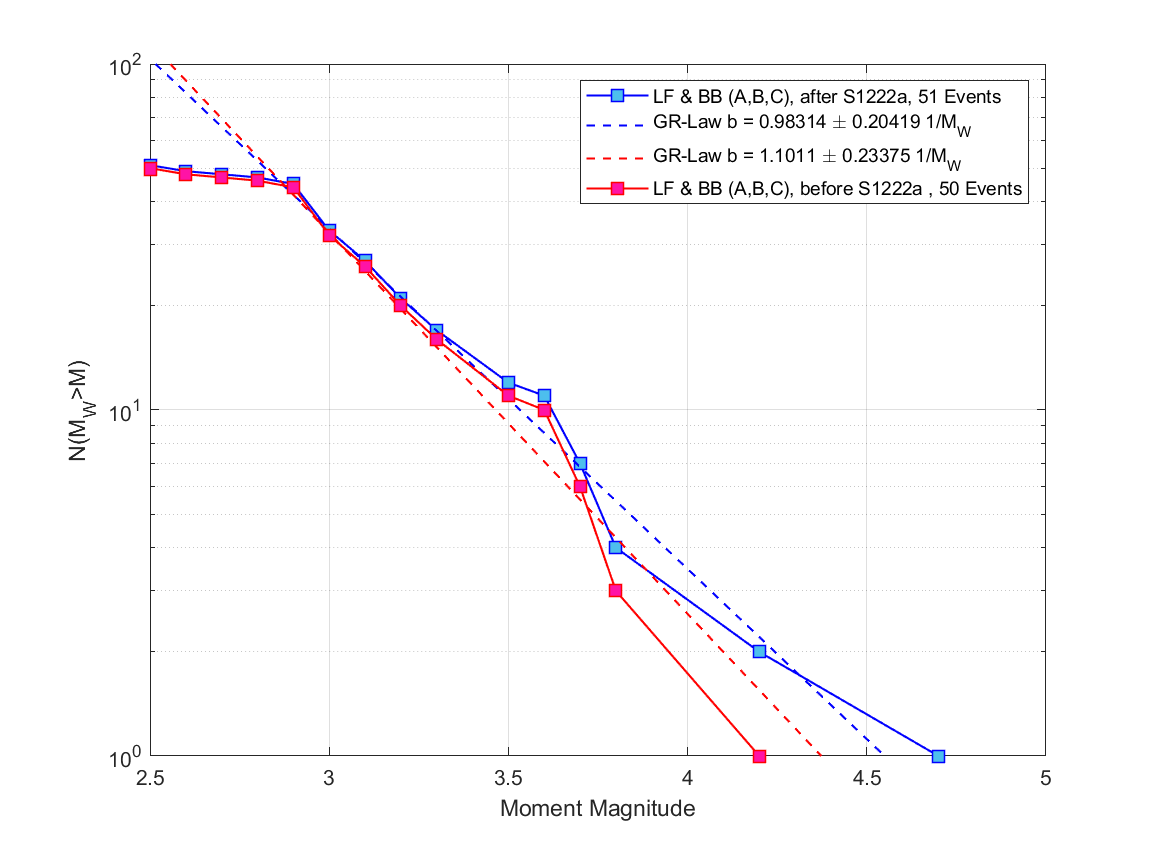
Figure 1 Size frequency distribution of Low Frequency and Broadband events. Red: status before occurrence of S1222a, blue: afterwards. The dashed lines represent the Maximum Likelihood solutions for fitting a Power Law distribution, with b-values as indicated in the legend.
Since S0976a occurred at an epicentral distance of about 140° (Horleston et al., 2022) at night time(02:26 LMST), but was recorded with amplitudes high enough to be visible during typical day time noise, we can infer that the catalog is complete for events the size of S0976a or larger. Since the slope of the distribution appears to be stable over the entire magnitude range from 3 up to that of S1222a, we conclude that the catalogue of Low Frequency events is not only representative, but complete for events larger than 3.
The magnitude of S1222a is slightly to the right of the value predicted by the power law, but, compared to other deviations, not excessively so. Also, the distribution does not show an indication of increasing slope any more. With about 30 events of magnitude 3 during the 3.3 years of InSight observations so far, this suggests that events larger than S1222a can be expected with respective recurrence rates: A magnitude 5 event appears likely about once in 11 years, i.e. on a decadal scale.
We use the approach of Knapmeyer et al. (2018) to estimate the seismic moment rate of Mars, and also the corner magnitude above which the size-frequency distribution becomes much steeper and events larger than the corner magnitude extremely unlikely (our analysis uses the Tapered Gutenberg-Richter distribution with an exponential roll-off above the corner frequency). The simple idea of Knapmeyer et al. (2018) was that, since a few large events release most of the seismic moment, the moment of the largest event ever observed, scaled with the duration covered by the catalog and a factor depending on b value and corner moment, provides a good estimation of the moment rate. Including not only the one largest, but the n largest events (with n between 1 and 10 or so) provides an even better estimation. In the 2018 study we have shown that the approach yields a surprisingly good estimation of the Earth's moment rate after a few months of registration, rather than after the many decades necessary to witness a magnitude 9 event.
We employ here an estimation based on the 5 largest events in the catalog. Knapmeyer et al. (2018) have shown that this low number may already provide a reasonable rate estimate. At the same time we attempt to avoid using events too small to be globally detectable. Future analyses will show if the use of 5 events is actually the best choice. The inclusion of event S1222a shifts the estimated moment rate slightly upwards, as well as the estimated corner moment. Figure 2 shows that both parameters are slightly below those of the WeakMany model of Knapmeyer et al., (2006). Compared to the catalog from before its occurrence, the parameter modifications due to S1222a are hardly significant (and not shown here). At least as important is the reduction of the uncertainty region in the moment-rate / corner-moment parameter space. We cannot yet exclude that the moment rate of Mars is as low as that of the Moon, but if it were, it would be rather unlikely to observe the event sequence that InSight observed.
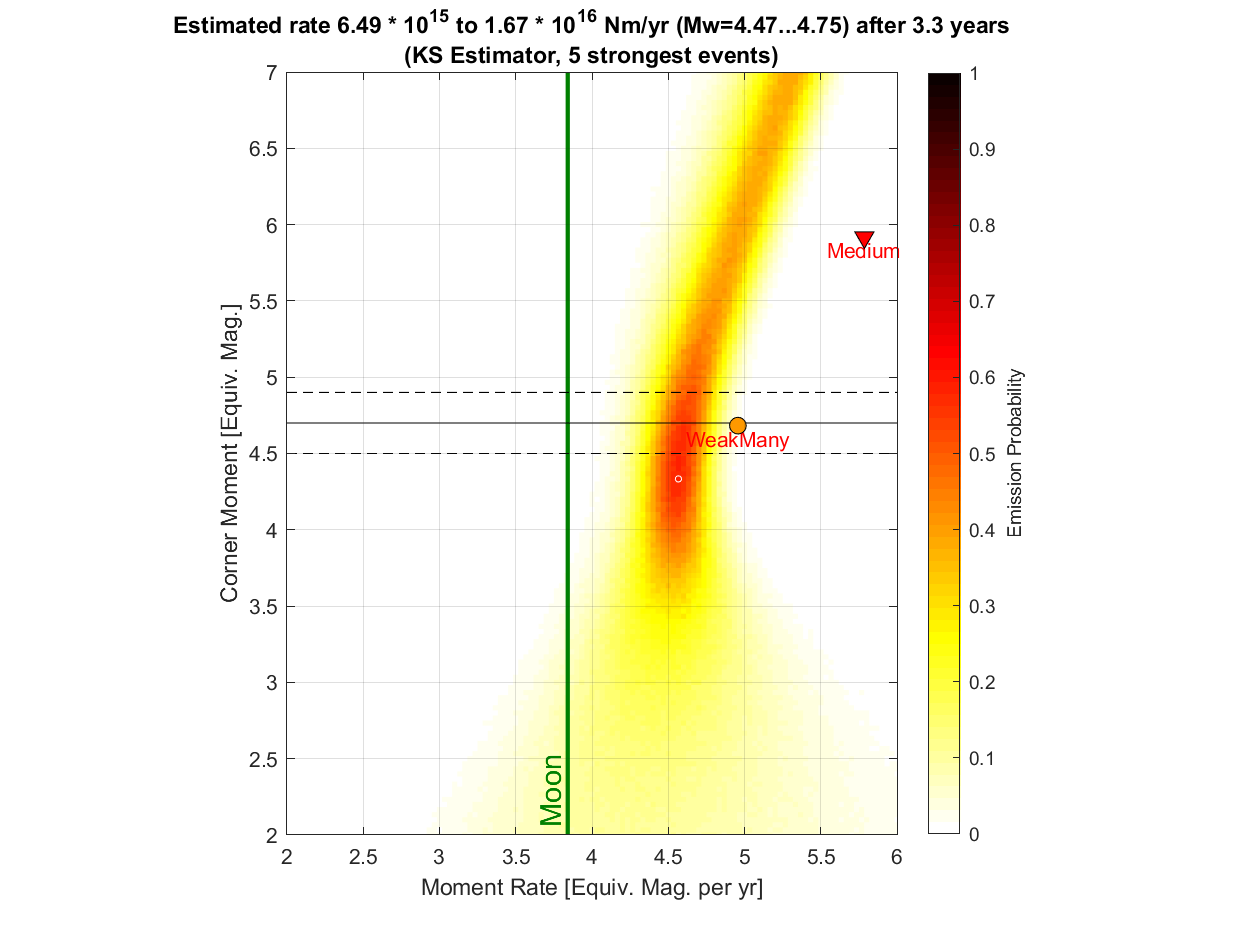
Figure 2 Estimation of Moment Rate and Corner Moment. For each Pixel, 10000 synthetic catalogs were evaluated to compare their parameters with the five largest events from the InSight catalog (KS5 estimation). Colour indicates the probability that the five largest events drawn from a tapered Gutenberg Richter distribution in 3.3 years reproduce the KS5 estimation obtained from the observed events, to within an 80 % interdecile around the median. The vertical line indicates the moment rate for the Moon (observed, from Shallow Moonquakes), markers indicate the WeakMany and Medium models of Knapmeyer et al. (2006). The moment rate of the Earth corresponds to an equivalent magnitude of about 8.5 (Knapmeyer et al., 2018). Horizontal lines indicate the magnitude of the largest event and its uncertainty. The maximum of the distribution is marked by a small white circle.
References
Horleston, A. C., et al. (2022). The Far Side of Mars: Two Distant Marsquakes Detected by InSight, The Seismic Record. 2(2), 88–99, doi: 10.1785/0320220007
Knapmeyer, M., Oberst, J., Hauber, E., Wählisch, M., Deuchler, C., Wagner, R. (2006). Working models for spatial distribution and level of Mars' seismicity. Journal of Geophysical Research, vol. 111, E11006, doi:10.1029/2006JE002708
Knapmeyer, M., et al. (2018). Estimation of the Seismic Moment Rate from an Incomplete Seismicity Catalog, in the Context of the InSight Mission to Mars, Bull. Seis. Soc. Am., vol. 109, No. 3, 1125-1147, doi: 10.1785/0120180258
Taylor et al., (2013). Estimates of seismic activity on the Cerberus Fossae region of Mars, Journal of Geophysical Research, vol. 118, 2570-2581, doi:10.1002/2013JE004469
How to cite: Knapmeyer, M., Ceylan, S., Charalambous, C., Clinton, J., Dahmen, N., Duran, C., Horleston, A., Kawamura, T., Kim, D., Plasman, M., Stähler, S., Zenhäusern, G., Weber, R. C., Giardini, D., Panning, M., Lognonné, P., and Banerdt, B.: Seismic Moment Rate of Mars after Event S1222a, Europlanet Science Congress 2022, Granada, Spain, 18–23 Sep 2022, EPSC2022-845, https://doi.org/10.5194/epsc2022-845, 2022.
Since its deployment at the surface of Mars in 2019, the SEIS seismometer (Seismic Experiment for Interior Structure) of the NASA-InSight mission (Interior exploration using Seismic Investigations, Geodesy and Heat Transport) has detected hundreds of small magnitude seismic events. But recently, the seismic event S1222a of magnitude 4.9 which primarily contains energy above 0.1 Hz was reported by the Mars Quake Service. It is characterized by two temporally separated arrivals with a gradual beginning, a broad maximum and a very long decay lasting up to 1 hour. In this work, we propose to use seismic coda analysis on this specific event to explore the attenuation properties of Martian crust and to provide an Earth-Mars-Moon comparison.
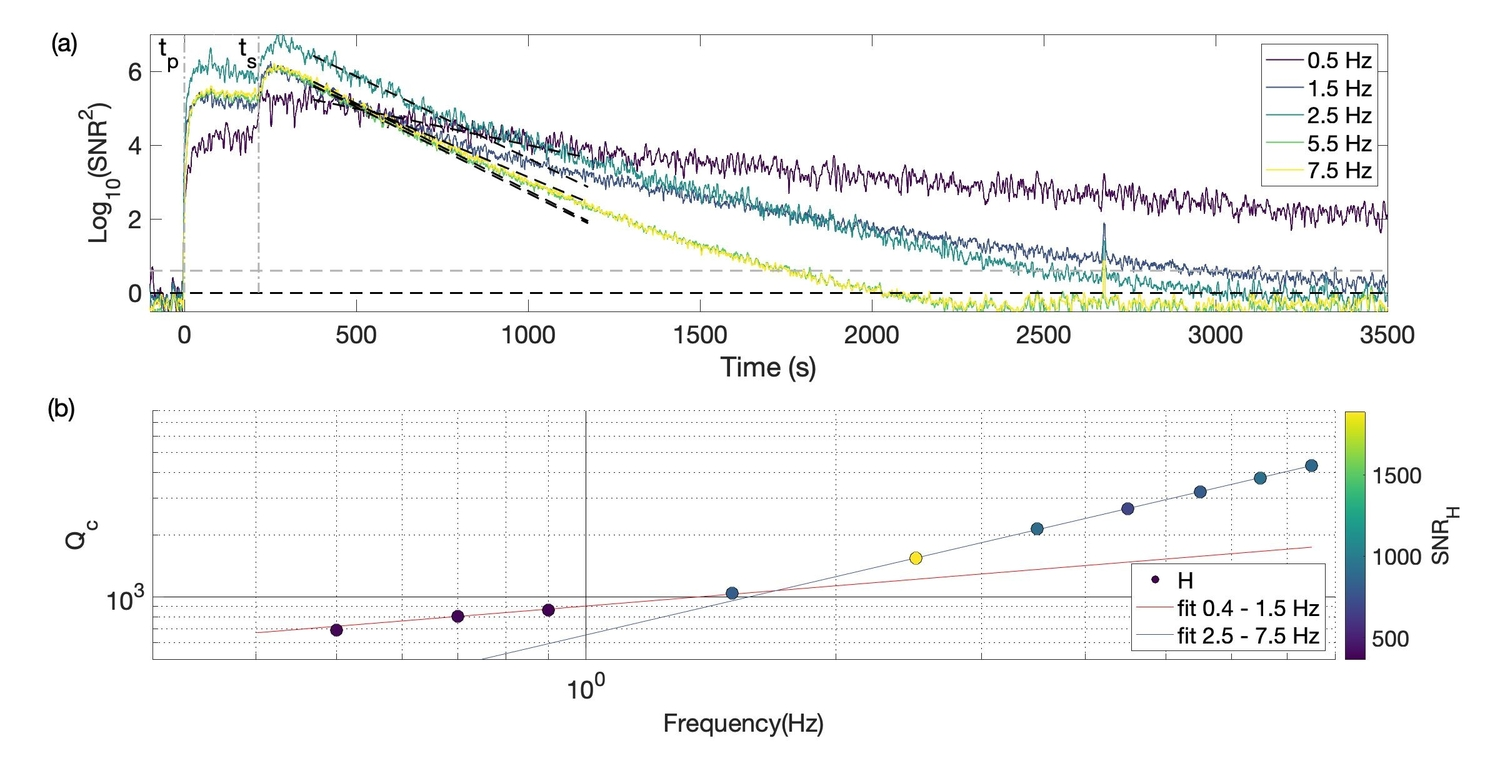
Fig 1: Envelope characteristics of the S1222a Broadband event. The data were collected on the VBB sensors with sampling rates of 20 samples per second. (a) Base 10 logarithm of energy envelopes normalized by the noise level as a function of time and fit of the coda decay (black dashed lines). The gray dashed line indicates signal-to-noise ratio (SNR) = 2. The different colors correspond to different frequency bands indicated in inset. The time t = 0 s corresponds to the first arrival. tP and tS refer to the arrival times of the first and second wave packets (red dashed lines). (b) Frequency dependence of Qc in the 0.4 –7.5 Hz frequency band. The color bar indicates the SNR measured on the horizontal components. The red and black dashed line shows the power-law fit Qc = 900f0.36and Qc = 655f0.94 respectively (f is the frequency.).
We employ basic multiple-scattering concepts to examine and to compare the energetic characteristics of the Earth, Martian and Lunar crust. We measured the coda quality factor Qc, that characterizes the rate of decay of the seismogram envelope, to have a first view of the attenuation characteristics [1] (see fig 1.a). We performed a fit of the frequency dependence of Qc using a parameterization of the form Qc = Q0 fn. Based on linear least-squares applied to the logarithm of Qc (see fig.1.b), we obtain two very distinct regimes of Qc as a function of the frequency f. In the [0.4 Hz - 1.5 Hz] range Q0 = 900 and n 0.36, when at higher frequency, Q0 = 655 and n 0.94 This result is specific to Mars and could be related to the stratification of the attenuation properties in the Martian crust. The quasi-linear frequency increase of Qc seen in [2.5 Hz – 7.5 Hz] range suggests that the coda decay is governed by a frequency independent attenuation time. Similar values of Q0 and n, in this frequency range, were reported by using a Very High Frequency group events [2] (see Fig 2 in orange and red).
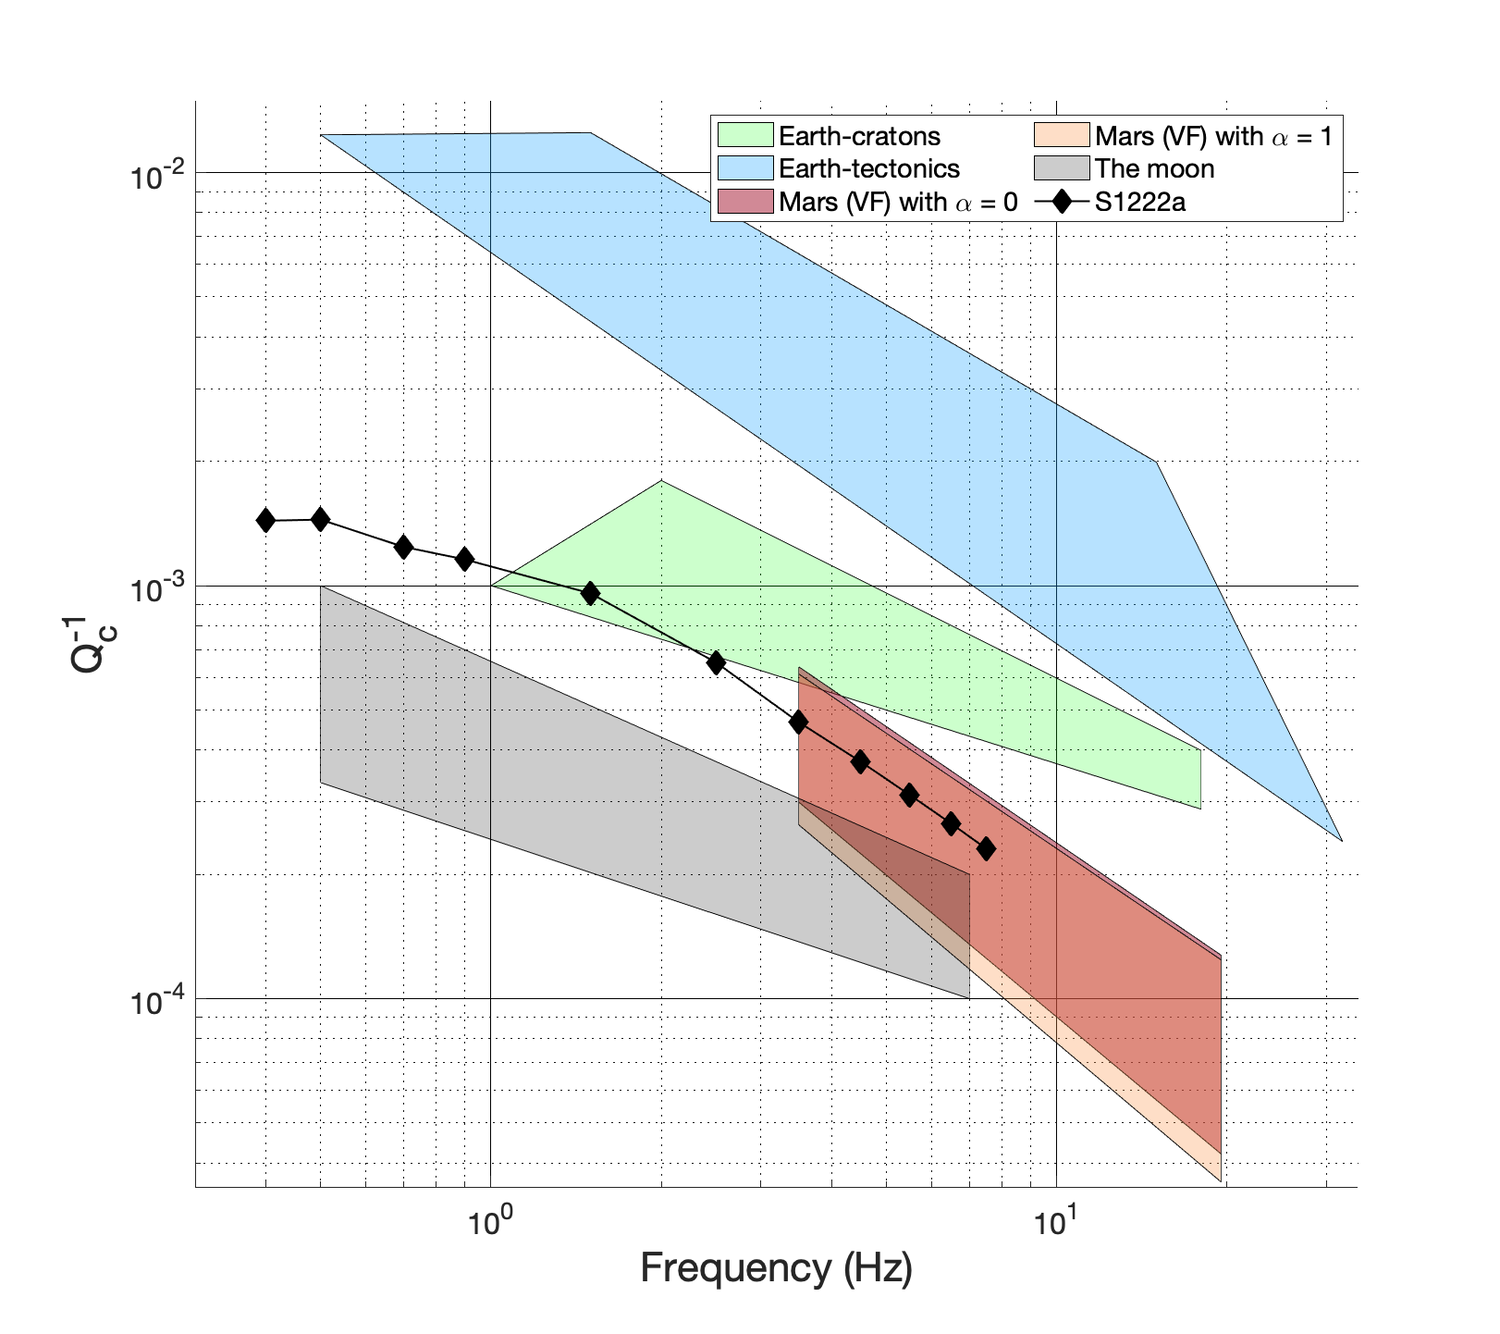
Fig 2: Coda attenuation as a function of the frequency for the Earth-cratons regions (green), the Earth-tectonics regions (bleu), the Moon (gray), Mars ( α= 0 in red and α= 1 in orange) and the S1222a BB event (black).
In the case of the regional earthquakes on Earth, the frequency dependence of Qc is radically different between tectonic areas and shields. Q0varies from 100 to 400 in tectonic areas (blue) [e.g. 3] and from 600 to 1000 in shields areas (green) [e.g. 4], where the frequency exponent n is equal to 1 and 0.1-0.5 respectively. [5] report coda Qc values of 2400 at 0.5 Hz and possibly as large as 10000 at 7 Hz on the Moon (gray). This result suggests that Q0 is a factor of 2 to 4 larger than on Mars when the frequency exponent n is more likely in the range of 0.4 – 0.6. To summarize, our Qc measurements exhibit two different regimes of frequency dependence. At higher frequency, the Q0 and n valuesare very close to the one found on Very High Frequency group events. The unique combination of high Q0 with a frequency exponent n =1 also distinguishes very clearly Mars from the Earth. By the time of the meeting, we hope to present the first results of envelope modeling based on elastic radiative transport in a stratified medium to quantify the contribution of the scattering and the absorption to the total attenuation.
References:
[1] Aki, K. (1969). Analysis of the seismic coda of local earthquakes as scattered waves. Journal of geophysical research, 74(2), 615-631.
[2] Menina et al. (2021), Energy Envelope and Attenuation Characteristics of High‐Frequency (HF) and Very‐High‐Frequency (VF) Martian Events, Bulletin of the Seismological Society of America (2021) 111 (6): 3016–3034.
[3] Mayeda, K., Koyanagi, S., Hoshiba, M., Aki, K., & Zeng, Y. (1992). A comparative study of scattering, intrinsic, and coda Q− 1 for Hawaii, Long Valley, and central California between 1.5 and 15.0 Hz. Journal of Geophysical Research: Solid Earth, 97(B5), 6643-6659.
[4] Mitchell, B, J et al. (2008). A continent-wide map of 1-Hz Lg coda Q variation across Eurasia and its relation to lithospheric evolution. Journal of Geophysical Research: Solid Earth, 113(B4).
[5] Gillet, K., et al (2017). Scattering attenuation profile of the Moon: Implications for shallow moonquakes and the structure of the megaregolith. Physics of the Earth and Planetary Interiors, 262, 28-40.
How to cite: menina, S., Margerin, L., kawamura, T., Lognonné, P., Xu, Z., Onodera, K., Calvet, M., and Garcia, R.: Scattering and attenuation properties of the Martian crust through the S1222a seismic event, Europlanet Science Congress 2022, Granada, Spain, 18–23 Sep 2022, EPSC2022-805, https://doi.org/10.5194/epsc2022-805, 2022.
The InSight (Interior exploration using Seismic Investigations, Geodesy and Heat Transport) lander provides the unique opportunity to explore the seismicity and the present-day seismic structure of Mars (Banerdt et al., 2020; Lognone et al., 2020; Giardini et al. 2020). Since the deployment of the seismometer SEIS, hundreds of seismic events have been recorded, and information about these events is available in the seismic catalogs produced by the Mars Quake Service (MQS) (Clinton et al., 2021; MQS Catalog V9).
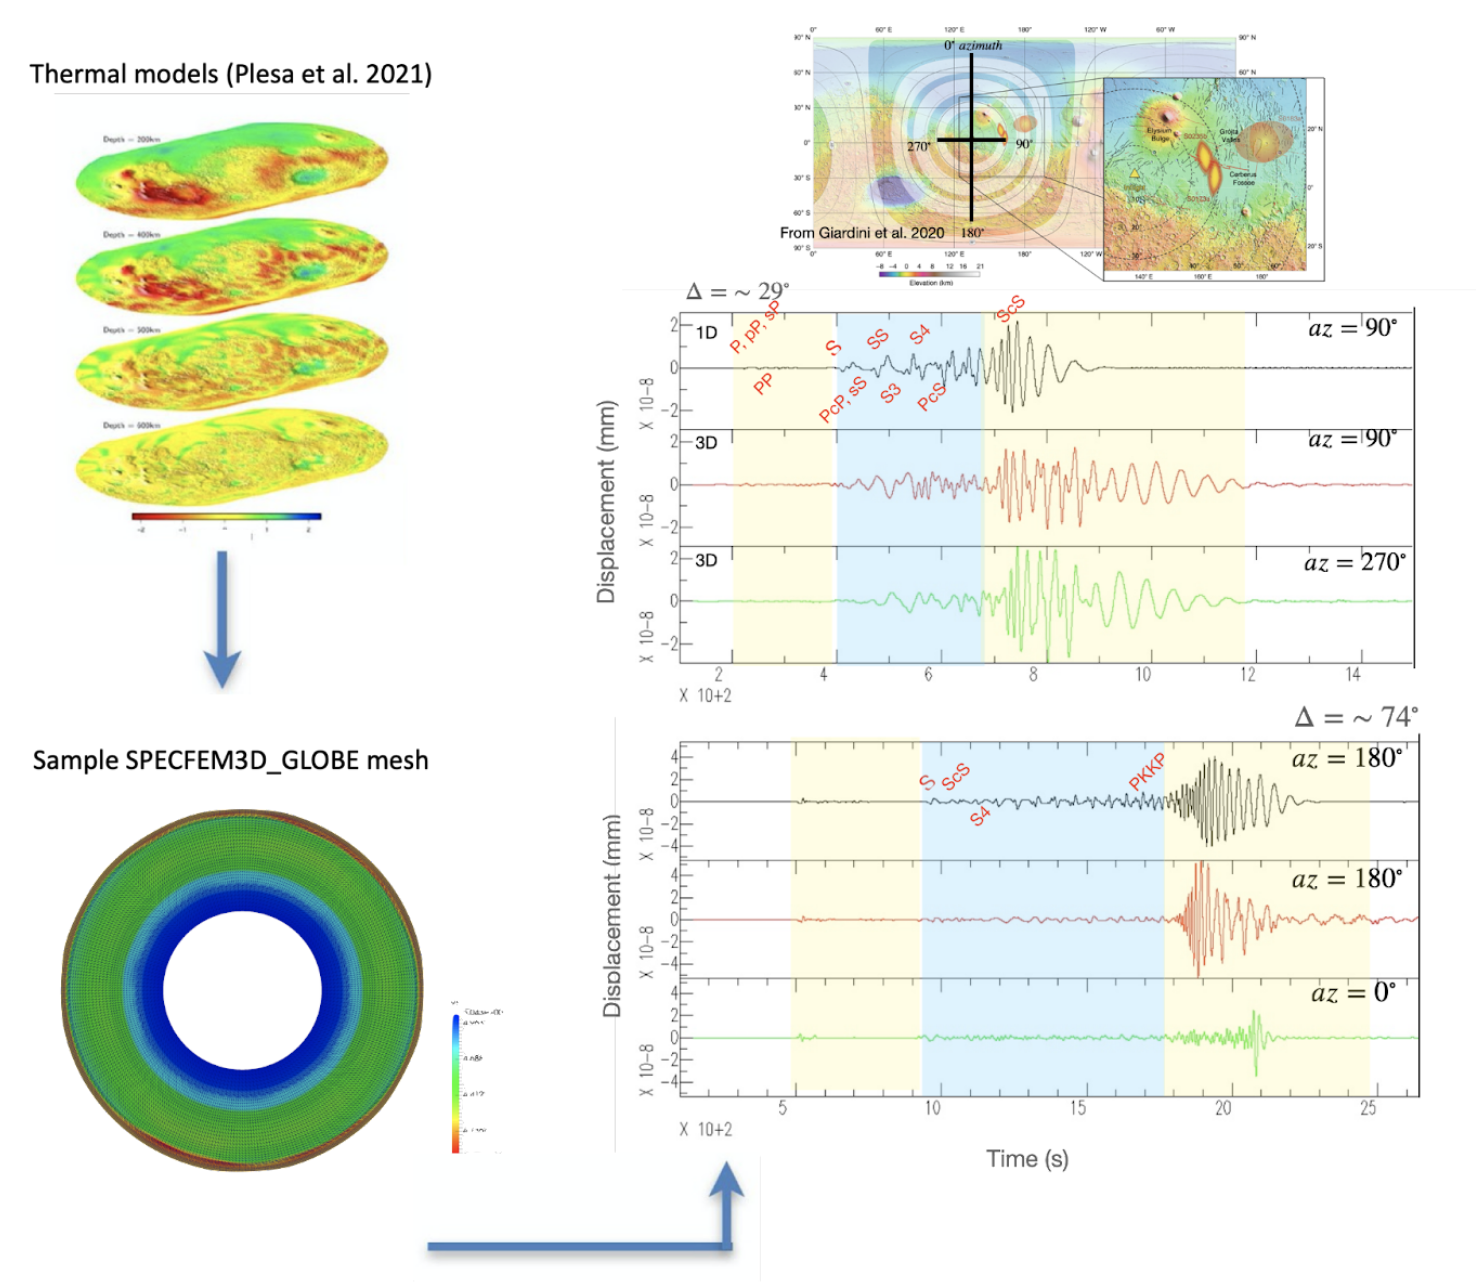
Fig. 1: Computational framework used in this study to incorporate thermal models in numerical wave simulations: Spherical harmonic Vp, Vs, and density models based on thermal simulations (e.g., Plesa et al., 2021, top-left) are expanded on a spectral-element mesh (Ciardelli et al. 2022, bottom-left) at desired resolutions. Sample synthetic 3D and 1D seismograms at 0, 90, 180, and 270-degree azimuths and 29 and 74-degree epicentral distances computed for the thermal model Case65-TAY (Plesa et al. 2021) with crustal thickness model 3200_1_DWTh2Ref1 (Wieczorek & Zuber 2004) and its average, respectively, shown on the right. Topography, rotation, ellipticity, gravity, and PREM attenuation are all taken into account during simulations with the SPECFEM3D_GLOBE package (Komatitsch & Tromp 2002). The source is the moment tensor solution of event S0235b located at the InSight lander with a higher scalar moment. The seismograms are bandpass filtered between 10-100 s.
InSight’s seismic recordings have been used to constrain the thickness of the crust (Knapmeyer-Endrun et al., 2021), the upper mantle structure (Khan et al., 2021) and the size of the martian core (Stähler et al., 2021), which has recently been updated by Duran et al. (2022). The latest largest moment magnitude ~5 event provides an unprecedented opportunity to investigate the interior of Mars, and to constrain its seismic structure using both body and surface waves. Seismic wavespeeds can present substantial variations in particular in the lithosphere where they follow the same pattern as the crustal thickness (Plesa et al., 2021). These variations can extend to 400 km or deeper for models with a thick thermal lithosphere as suggested by the analysis of seismic events.
In this study, we investigate the 3D structural effects on the seismic body and surface waveforms, such as surface topography, crustal thickness variations, etc., and combine them with thermal evolution models using 3D seismic wave simulations (Fig. 1). We quantify the difference between 1D radially symmetric seismic models, radially symmetric models with 3D crustal thickness variations and topography, and full 3D seismic wavespeeds caused by the variations of crust-mantle interface and mantle thermal anomalies (i.e., mantle plumes) derived from thermal simulations. In our simulations, we include the latest crustal thickness models of Mars (Wieczorek et al., 2022) derived from gravity and topography data and constrained by seismic measurements from InSight.
In a first step, we use the radially symmetric structure constrained by the InSight data and similar to the study of Bozdag et al. (2017), and investigate the effect of surface topography, 3D crustal thickness variations, attenuation, and moment tensor solutions constrained by Insight data on body and surface waves. As expected, surface waveforms are most affected by the crustal dichotomy, which also highlights the importance of anelasticity in explaining multi-orbit Rayleigh and Love waves.
In a second step, we explore the effect of a 3D mantle derived from thermal evolution models on body and surface waves. We use seismic models that are representative of various thermal conditions obtained by 3D geodynamical models. Similar to Plesa et al. (2021), we use the present-day thermal state and associated temperature variations to calculate P and S wavespeeds that are then used to simulate the seismic wave propagation. We use the 3D global wave propagation solver SPECFEM3D_GLOBE package (Komatitsch & Tromp 2002) for numerical simulations, freely available from CIG (Computational Infrastructure for Geodynamics), and compare synthetics to the prominent marsquakes, including the latest largest moment magnitude ~5 event.
References
Banerdt et al., 2020. Initial results from the InSight mission on Mars. Nature Geoscience, 13, 183– 189.
Bozdağ et al., 2017. Simulations of seismic wave propagation on Mars, Space Science Reviews, doi: 10.1007/s11214-017-0350-z.
Ciardelli et al., 2022. SphGLLTools: A toolbox for visualization of large seismic model files based on 3D spectral-element meshes, Computers & Geosciences, 159, 105007, https://doi.org/10.1016/j.cageo.2021.105007.
Clinton et al. (2021). The Marsquake catalogue from InSight, sols 0-478. Physics of the Earth and Planetary Interiors, 310, 106595. https://doi.org/10.1016/j.pepi.2020.106595
Durán et al., “Seismology on Mars: An analysis of direct, reflected, and converted seismic body waves with implications for interior structure,” Physics of the Earth and Planetary Interiors, vol. 325, p. 106 851, 2022, issn: 0031-9201. doi: 10.1016/j.pepi.2022.106851.
Giardini et al. (2020). The seismicity of Mars. Nature Geoscience, 13(3), 205– 212.
Khan et al., “Upper mantle structure of Mars from InSight seismic data,” Science, vol. 373, no. 6553, pp. 434–438, 2021, issn: 0036-8075. doi: 10.1126/science.abf2966.
Knapmeyer-Endrun et al., 2021. Thickness and structure of the Martian crust from InSight seismic data, Science, 6553(373), 438-443, DOI: 10.1126/science.abf8966.
Komatitsch & Tromp, 2002. Spectral-element simulations of global seismic wave propagation – I. Validation, Geophysical Journal International, 149(2), 390–412.
Lognonné et al., 2019. SEIS: Insight's seismic experiment for internal structure of Mars. Space Science Reviews, 215(1), 12.
Plesa et al., 2021. Seismic Velocities Distribution in a 3D Mantle: Implications for InSight Measurements, Journal of Geophysical Research-Planets, https://doi.org/10.1029/2020JE006755.
Stähler et al., 2021 “Seismic detection of the martian core,” Science, vol. 373, no. 6553, pp. 443–448, 2021, issn: 0036- 8075. doi: 10.1126/science.abi7730.
Wieczorek & Zuber, 2004. Thickness of the martian crust: Improved constraints from geoid-to-topography ratios. J. Geophys. Res., Planets 109(E1), E01009. doi:10.1029/2003JE002153
Wieczorek et al., 2022. InSight constraints on the global character of the Martian crust. Journal of Geophysical Research: Planets, e2022JE007298.
How to cite: Bozdag, E., Plesa, A.-C., Huang, Q., Peter, D., Ciardelli, C., Brinkman, N., Knapmeyer, M., Ceylan, S., Wieczorek, M., Knapmeyer-Endrun, B., Rivoldini, A., Khan, A., Fernando, B., Nissen-Meyer, T., and Lognonné, P.: Effects of 3D structure on Martian seismic waves, Europlanet Science Congress 2022, Granada, Spain, 18–23 Sep 2022, EPSC2022-1221, https://doi.org/10.5194/epsc2022-1221, 2022.
NASA’s mission, InSight (Interior Exploration using Seismic Investigations, Geodesy and Heat Transport), has been conducting seismic observation since January 2019 (Banerdt et al. 2020; Lognonné et al. 2020; Giardini et al. 2020). Recently InSight has recorded a magnitude-5 event, S1222a, and in the seismic recording, Mars Quake Service identifies both Rayleigh and Love waves. Based on the two surface waves, we study the Martian subsurface radial anisotropy. We measure the group and phase velocities of the two surface waves (Figure 1), and then apply Markov chain Monte Carlo inversion to the measurement. Inversion of the Rayleigh- and Love-wave velocities provides the 1D Sv- and Sh-wave velocity models (Vsv and Vsh), respectively. The difference between Vsv and Vsh indicates the radial anisotropy distribution in depth and aids us in investigating the geological structure and/or mineralogy of the Martian subsurface.
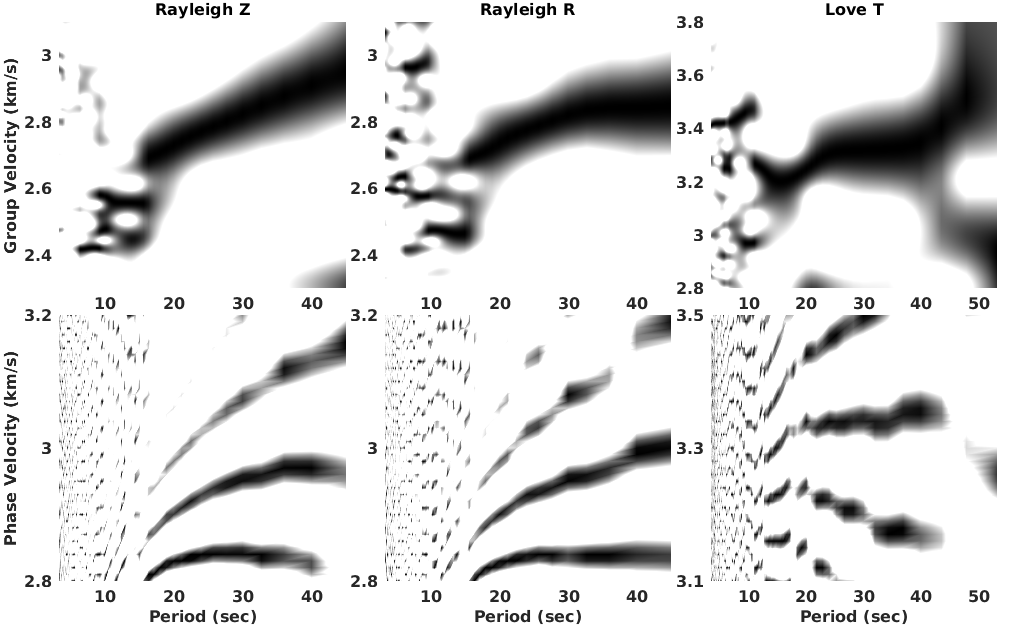
Figure 1. The Rayleigh- and Love-wave group and phase velocity measurement (black trends) of S1222a. The Rayleigh-wave measurement is from the vertical (Z) and radial (R) component data; the Love-wave measurement is from the transverse component (T). Our group and phase velocity measurement algorithms are from Bensen et al. (2007) and Yao et al. (2006), respectively. The multiple trends in the phase-velocity subplots are due to the cycle skipping in the phase-velocity measurement.
References:
Bensen, G. D., et al. "Processing seismic ambient noise data to obtain reliable broad-band surface wave dispersion measurements." Geophysical journal international 169.3 (2007): 1239-1260.
Banerdt, W. Bruce, et al. "Initial results from the InSight mission on Mars." Nature Geoscience 13.3 (2020): 183-189.
Giardini, Domenico, et al. "The seismicity of Mars." Nature Geoscience 13.3 (2020): 205-212.
Lognonné, Philippe, et al. "Constraints on the shallow elastic and anelastic structure of Mars from InSight seismic data." Nature Geoscience 13.3 (2020): 213-220.
Yao, Huajian, Robert D. van Der Hilst, and Maarten V. De Hoop. "Surface-wave array tomography in SE Tibet from ambient seismic noise and two-station analysis—I. Phase velocity maps." Geophysical Journal International 166.2 (2006): 732-744.
How to cite: Xu, Z., Stutzmann, E., Lognonné, P., Schimmel, M., Montagner, J.-P., and Kawamura, T.: Radial anisotropy from surface-wave observation in Mars, Europlanet Science Congress 2022, Granada, Spain, 18–23 Sep 2022, EPSC2022-863, https://doi.org/10.5194/epsc2022-863, 2022.
For over three Earth years, NASA’s InSight mission has returned data from the Seismic Experiment for Interior Structure (SEIS) on Mars with over 1300 recorded marsquakes (Horleston et al., this issue), leading to numerous breakthroughs in determining the planet's structure (Khan et al., 2021; Stähler et al., 2021; Knapmeyer-Endrun et al., 2021). However, a large number of detected marsquakes are contaminated by SEIS’s complex interaction with the Martian atmosphere which injects noise and couples into the seismic signal. Identification of surface waves, polarisation analysis and clear body-wave arrivals is therefore often inhibited by this strong atmospheric noise. Despite numerous identifications, only 12 events have so far been fully located. Detection and analysis of the seismic component thus requires separation from such aseismic signal sources.
Here we present a novel denoising model which exploits the strong correlation between the ground motion and the atmospheric conditions recorded at InSight. The approach exploits linearities in the noise injected by the atmosphere by using weather data measured by the lander, or in the absence of such data due to power constraints, the excitation of wind-sensitive lander modes that have been proven an effective atmospheric proxy in estimating this injection on Mars (Charalambous et al., 2021; Clinton et al., 2021; Dahmen et al., 2021). The output results in “demodulation”, i.e., the cancellation of any environmental noise and the effective isolation of the seismic signal power in time-frequency space. Our denoising approach is thus able to remove and decouple the environmental noise from the seismic signal to reveal features in the seismic event waveform that were previously hidden in the noise.
Using the proposed denoising technique, we investigate all marsquake events above magnitude 3 to search for surface waves not identifiable with pre-existing methods. To correctly identify and associate these dispersive wave packets as Rayleigh and Love waves, we examine the characteristics of each through frequency-dependent polarisation analysis. The residual power from the denoised signal allows an accurate examination of the partitioning of energy between the horizontal and vertical components (H/V ratio) of the event. This energy isolation in turn informs an H/V-weighted polarisation analysis which enhances the characteristics of body and surface waves. This approach effectively cancels out the contribution of other polarised signals from the environment, enhancing the characteristics in the signal of interest. The residuals thus not only allow us to correctly identify surface waves, but also locate events which could not previously be located by refining back-azimuths and distances through clear P- and S-wave arrivals.
Using these results, we investigate the lateral variation in the crustal properties with events that are located close to an equatorial transect of Mars, including both major- and minor-arc detections. Events not on the transect further allow us to populate a map of lateral variations in thickness of the crust revealing geographical differences in the crustal structure, but also constraining the average thickness of the crust and the range of allowable crustal densities. This places additional constraints on the seismic velocities of the crust and lithosphere. Finally, with demodulation we further explore the identification and validation of multi-orbit Rayleigh waves and second-arriving Love wave packets from InSight’s largest marsquake recorded so far at a moment magnitude of 4.7 (S1222a), providing further constraints to the model.
References
Charalambous, C., Stott, A. E., Pike, W. T., ... & Banerdt, W. B. (2021). A Comodulation Analysis of Atmospheric Energy Injection Into the Ground Motion at InSight, Mars. Journal of Geophysical Research: Planets, 126(4).
Clinton, J. F., Ceylan, S., van Driel, ... & Stott, A. E. (2021). The Marsquake catalogue from InSight, sols 0–478. Physics of the Earth and Planetary Interiors, 310, 106595.
Dahmen, N. L., Zenhäusern, G., Clinton, ... & Banerdt, W. B. (2021). Resonances and lander modes observed by insight on Mars (1–9 Hz). Bulletin of the Seismological Society of America, 111(6), 2924-2950.
Horleston, A., Clinton, J., Ceylan, S., … Banerdt, W. B. The seismicity of Mars as recorded by InSight’s Marsquake Service, this issue
Khan, A., Ceylan, S., van Driel, M., ... & Banerdt, W. B. (2021). Upper mantle structure of Mars from InSight seismic data. Science, 373(6553), 434-438.
Stähler, S., Khan, A., Banerdt, W. B., ... & Smrekar, S. (2021). Seismic detection of the martian core. Science, 373(6553), 443-448.
Knapmeyer-Endrun, B., Panning, M. P., Bissig, F., ... & Banerdt, W. B. (2021). Thickness and structure of the martian crust from InSight seismic data. Science, 373(6553), 438-443.
How to cite: Charalambous, C., Pike, T., Fernando, B., Stott, A., Nissen-Meyer, T., and Lognonné, P.: Denoising InSight: Determination of Mars’ lateral crustal variations through surface-wave identification, Europlanet Science Congress 2022, Granada, Spain, 18–23 Sep 2022, EPSC2022-1078, https://doi.org/10.5194/epsc2022-1078, 2022.
Introduction: For a single seismometer, the most effective techniques for studying deep structure use norma mode frequencies, which do not require knowledge of the source location. Past modeling (Lognonné et al., 1996, Lognonné, 2005) suggest that Normal mode spectral peaks from 5–20 mHz (sensitive to mantle structure) are expected to have amplitude larger than the SEIS requirement (10-9 m/s2/Hz1/2) for moment larger than 2 1017 Nm (equivalent magnitude ∼5.5).
Even for the event 1222 from May, 4, 2022, with an estimated magnitude of 5, the amplitude of normal modes is therefore low and their identification will be challenging in the data recorded by the SEIS VBB (Lognonné et al., 2019).
Signal preprocessing: A very careful cleaning of the SEIS data is therefore requested, especially in order to remove most of the thermal glitches. If not made, the spectra are dominated by these glitches. This pre-cleaning allow to converge to a corrected signal, which is robust with respect to deglitching parameters (Figure 1).
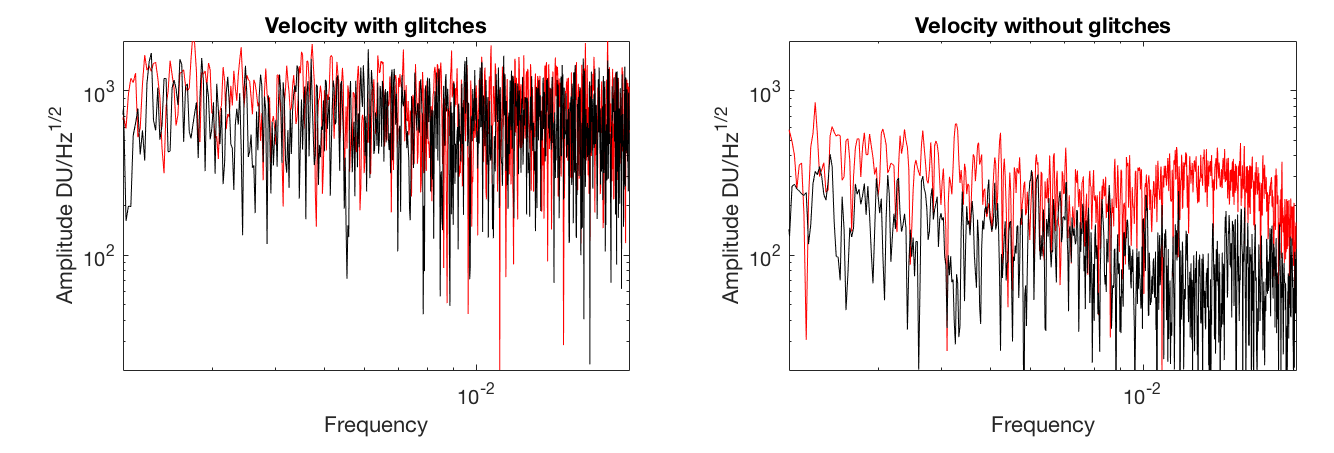
Figure 1: (left) raw VBBZ data and (right) deglitched VBB data. Spectra from the night following the 1222 event.
The further detection of modes relies on the identification of spectral peaks in the Fourier amplitude or power spectra. However, close to the background noise level these spectral peaks can be either due to small harmonic signals contaminated by noise or due to the fortuitous constructive interference of noise. Besides, harmonic signals may be perceptive only during a limited portion of the analyzed time series which together with other larger amplitude signals further complicate the detection. For these reasons, we employ phase autocorrelation spectra (Schimmel et al., 2018) and conduct also a Phasor-Walkout analysis (e.g., Zürn and Rydelek, 1994, Schimmel et al., 2002) to search for and evidence normal modes. In the following, we briefly summarize these strategies.
Phase autocorrelation spectra. The identification of modes and determination of their frequency are usually based on the computation of the power or energy spectral density (PSD or ESD) which can be obtained through the Fourier Transform of differently defined autocorrelations. ESD can be computed for transient waveforms and equals the squared amplitude spectrum of the seismic recording while PSD is employed when the time series cannot be directly Fourier transformed due to infinite signal energy. Although the underlying autocorrelations are differently defined, they measure the self-similarity of the time series to reveal the spectral contents. In Schimmel et al. (2018), the conventional autocorrelations have been replaced by the phase cross-correlation (PCC; Schimmel ,1999) to show that phase autocorrelations provide an approach which can further aid the detection of modes. PCC is amplitude unbiased as it is based on envelope normalized analytic signals. Inherent to this, PCC is much less affected by outlying signals and supplies robust and independent spectra.
Phasor-Walkout. The Phasor-Walkout approach (see Zürn and Rydelek, 1994 for a review and further references) is a graphical representation of the Fourier Transform at a given test-frequency. It pictures the construction of the amplitude spectrum as a vector summation in the complex number space. In this summation, each vector corresponds to a time sample where the sample amplitude and time provide the length of the vector and its angle or phase. The sum of all vectors equals the Fourier amplitude of the spectrum at that frequency. The “walk” of the vectors in the complex number space is called Phasor-Walkout and permits to assess how the spectral amplitude has been build up. If the vectors point into similar directions then the summation becomes constructive while random directions produce a destructive summation which depends on the individual vector amplitudes. For harmonic signals where the test-frequency matches the frequency of the oscillation the walk is straight while for pure random noise the Phasor-Walkout produces a random walk around its start point. Thus the qualitative inspection of Phasor-Walkout patterns may reveal the origin of spectral peaks.
Fig. 2 shows an example of phasor-walkouts at four different test frequencies. Amplitude scale
is arbitrary and each color marks a two hours segment of the data. The walk starts at (0,0) which corresponds to the MQS event origin time. The top right panel shows a random walk while the other three panels contain linear walkouts of more than 6 hours.
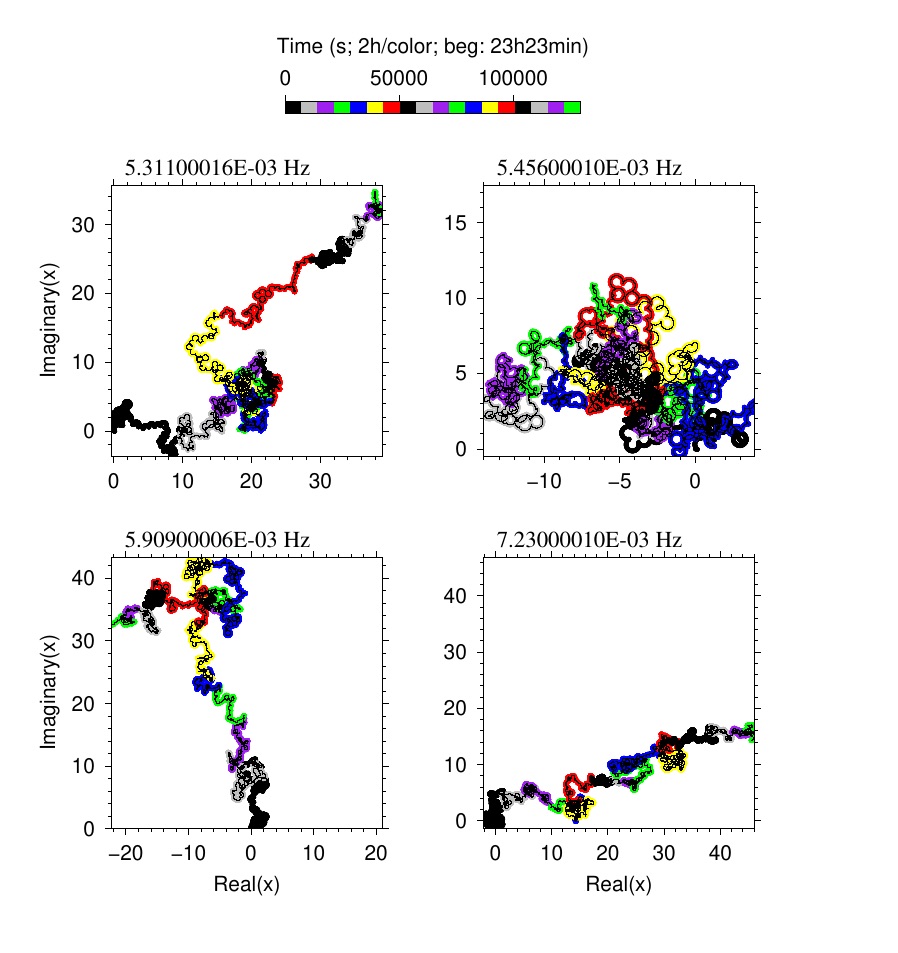
Figure 2: walkout for 4 test frequencies.
Further work is required to present clean walkouts validating normal modes in the signal of the largest marsquake recorded by SEIS. When achieved, these frequencies might be inverted and will provide new constraints on the interior structure of the planet (Panning et al., 2017)
References:
Lognonné, P., J. Gagnepain-Beyneix, W.B. Banerdt, S.Cacho, J.F. Karczewski, M. Morand, An Ultra-Broad Band Seismometer on InterMarsnet, Planetary Space Sciences, 44, 1237-1249, doi:10.1016/S0032-0633(96)00083-9, 1996.
Lognonné, P., Planetary seismology, Annual Review in Earth Planet. Sci., 33 :19.1-19.34, doi :10.1146/annurev.earth.33.092203.122605, 2005.
Lognonné, P., Banerdt, W.B., Giardini, D. et al., SEIS: Insight’s Seismic Experiment for Internal Structure of Mars, Space Sci Rev, 215, 12, doi : 1007/s11214-018-0574-6 , 2019.
Nishikawa, Y., Lognonné, P., Kawamura, T., Spiga, A., Stutzmann, E., Schimmel, M., Bertrand, T., Forget, F., K. Kurita, K., Mars’ Background Free Oscillations, Space Science Reviews 215:13, doi: 10.1007/s11214-019-0579-9, 2019.
Panning, M.P., P.Lognonné, W. B. Banerdt et al., Planned products of the Mars Structure Service for the InSight mission, Mars, Space Science review, 211, 611–650, doi: 10.1007/s11214-016-0317-5, 2017.
Schimmel M., Phase cross-correlations: design, comparisons and applications, Bull. Seismol. Soc. Am., 89, 1366-1378, 1999.
Schimmel M., J. Waterhouse, M.D. Marques, D. Weinert, Circadian and ultradian rhythmicities in very premature neonates maintained in incubators , Biol. Rhythm Res., 33, 83-111, doi:10.1076/brhm.33.1.83.1321 , 2002.
Schimmel, M., Stutzmann, E., Ventosa, S., Low-frequency ambient noise autocorrelations: Waveforms and normal modes, Seismological Research Letters, 89 (4), 1488-1496, doi: 10.1785/0220180027, 2018.
Zürn, W.; Rydelek, P., Revisiting the phasor-walkout method for detailed investigation of harmonic signals in time series, Surv. in geophys. 15, 409-431, 1994.
How to cite: Lognonné, P., Schimmel, M., Stutzmann, E., Drilleau, M., Samuel, H., Panning, M., and Banerdt, W. B.: Martian free oscillations: Search in SEIS data and implications, Europlanet Science Congress 2022, Granada, Spain, 18–23 Sep 2022, EPSC2022-738, https://doi.org/10.5194/epsc2022-738, 2022.
The Farside Seismic Suite (FSS), recently selected for flight as part of the NASA PRISM (Payloads and Research Investigations on the Surface of the Moon) program and planned for flight in 2024 or 2025, would deliver two seismometers (both flight-proven through the InSight mission to Mars [Banerdt et al., 2020]) to Schrödinger Basin. The vertical Very BroadBand (VBB) seismometer is the most sensitive flight-ready seismometer ever built [Lognonné et al., 2019], while the Short Period (SP) sensor is the most sensitive and mature compact triaxial sensor available for space application [Lognonné et al., 2019]. Packaged as a self-sufficient payload, with independent power, communications and thermal control allowing survival and operation over the long lunar night, the FSS will outlive the commercial delivery lander, and provide a long-lived seismic experiment capable of answering key scientific questions (figure 1).
FSS will address three science objectives with this project:
- Investigate deep lunar structure and the difference between near and farside activity. Understanding the absence of farside seismicity recorded on Apollo seismometers [e.g. Nakamura et al., 1981] is fundamental to our understanding of the lunar deep interior. Does it reflect a nearside-farside difference in activity rate, or does seismic attenuation from partial melting in the mantle prevent observation of distant events [e.g. Weber et al., 2011]? Direct recording of farside activity, as well as possible recording of known repeating nearside moonquakes or events determined from impact flash observations will illuminate these questions.
- Understand how the lunar crust is affected by the development of an impact melt basin. Dynamic models of impact processes [e.g. Kring et al., 2016] predict deep structure beneath a well-preserved peak ring impact basin like Schrödinger Basin that can only be revealed through geophysical techniques based on receiver functions [e.g. Vinnik et al., 2011; Knapmeyer-Endrun et al., 2021] and autocorrelation of ambient noise and/or event codas [e.g. Larose et al., 2005; Compaire et al., 2020; Schimmel et al., 2021].
- Evaluate the current micrometeorite impact rate and local tectonic activity. Directly constraining micrometeorite impact rates has important implications for future lunar occupation. The lunar background seismic noise is modeled to be driven by micrometeorite impacts [Lognonné et al., 2009]. FSS will record at least 4 months of lunar background hum created by micrometeorite impacts.
In order to meet these science objectives, a series of planned measurements were defined and, based on observed Apollo-era seismicity, instrument sensitivity requirements were define. For example, in order to make an estimate of farside seismicity to address objective 1, we require recording at least 50 seismic events, and we assessed that a VBB sensitivity of 2 x 10⁻¹⁰ m/s2/rtHz across the frequency band of 0.1-1Hz would be sufficient to make the measurement during the mission. This is a target, but we assess that we have ample scientific margin if the instrument is unable to reach this noise floor due to either instrument self-noise or other environmental sources of noise (figure 2). To better assess this margin, we are working to quantify the noise sources from the FSS and lander system and the lunar environment (figures 3 and 4). In current modeling, the most important noise sources for the single-component vertical VBB appear to be the instrument self-noise, the noise induced by magnetic field variations as the Moon crosses over the bowshocks surrounding the Earth’s magnetotail, and thermal tilt noise from the regolith which can couple into the VBB signal if the lander is tilted relative to the Moon’s gravitational vector. At typical levels, this noise is close to the proposed instrument requirements (figure 3), while in the stacked worst case (maximum allowed lander tilt and during a bowshock crossing), the noise may exceed the requirement by a factor of 2-3, which still should leave margin for achieving science objectives.
FSS is designed to answer several key lunar science questions from a single station on the farside of the Moon. The FSS will also allow for key technical advancement and risk reduction for future missions, such as the Lunar Geophysical Network, a candidate New Frontiers 5 mission [Neal et al., 2020]. Because deployment increases cost and complexity, assessing the need for deployment and characterizing the lander seismic noise environment will be key. In addition, measuring the lunar seismic noise floor beyond what was possible with the Apollo data will permit better requirements definition for future lunar seismic missions and future astrophysics observatories sensitive to lunar ground stability.
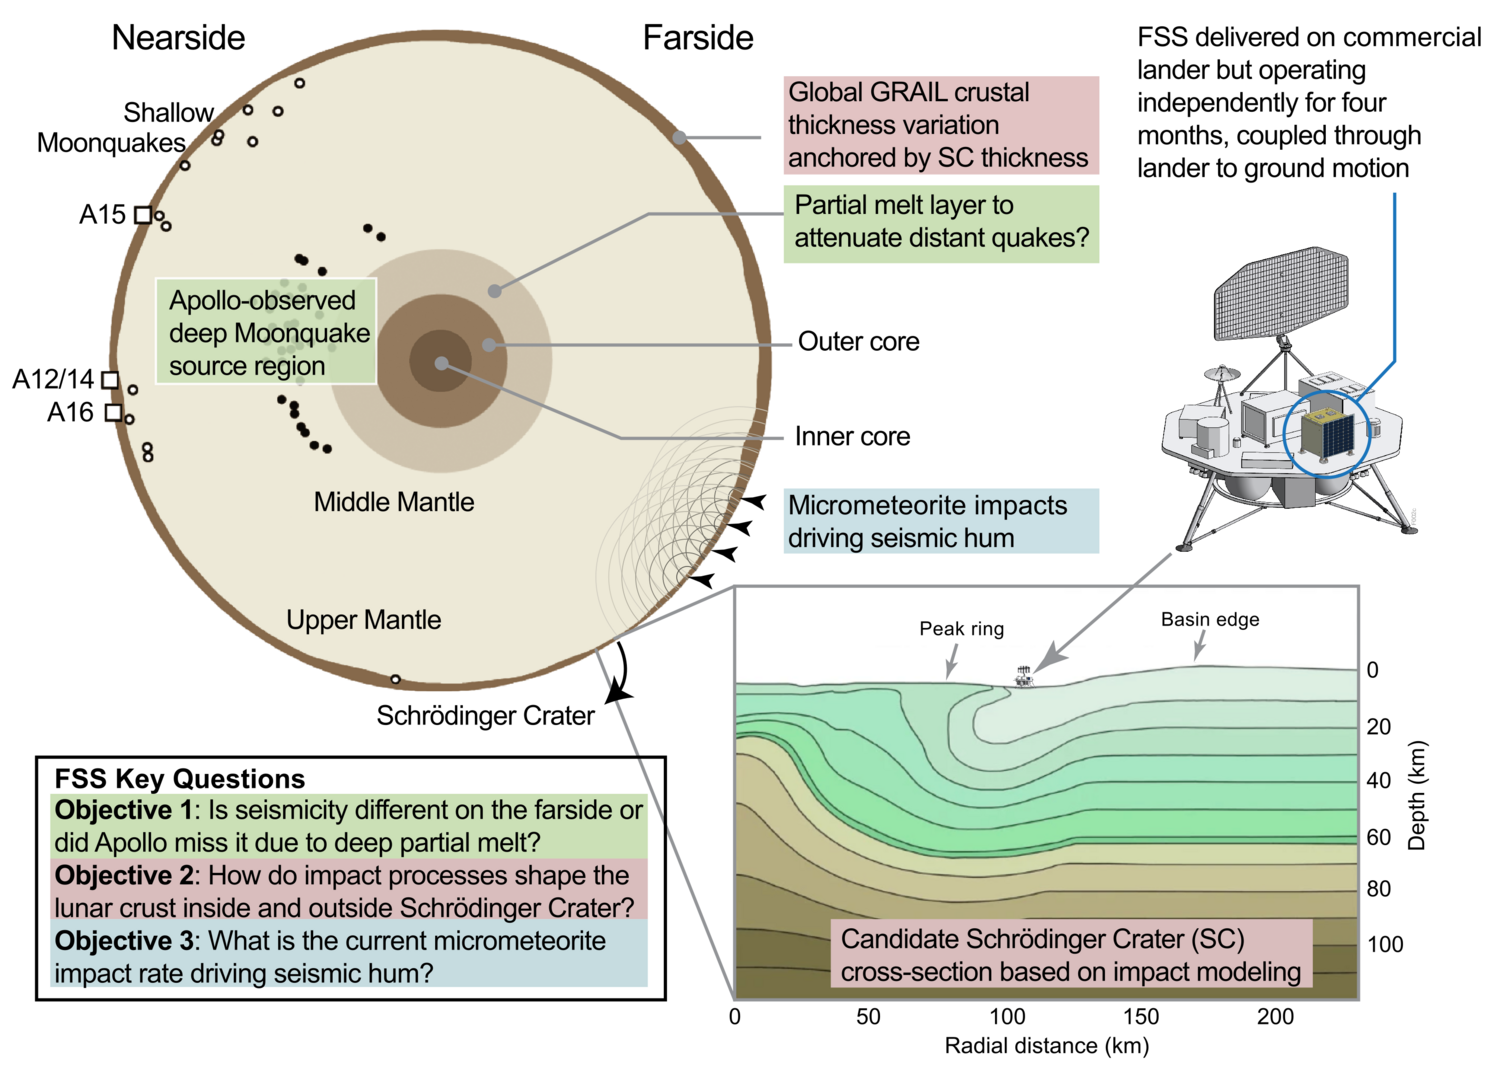
Figure 1: FSS will return data with unprecedented sensitivity from Schrödinger Crater over multiple lunar diurnal cycles after outliving the delivery lander. Figure adapted from Wieczorek (2009) and Kring et al. (2016).
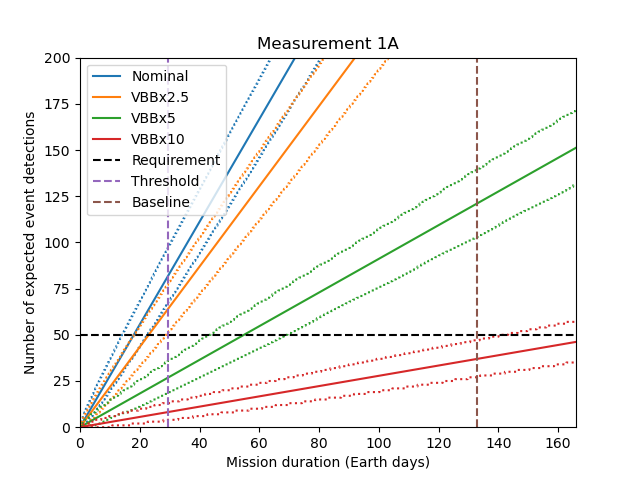
Figure 2: Expected number of events recorded through the mission at various VBB sensitivity levels based on Apollo observation rates, with 95% confidence bounds based on Poisson statistics. Requirements are easily met if VBB performance is within a factor of 5 of the requirement.
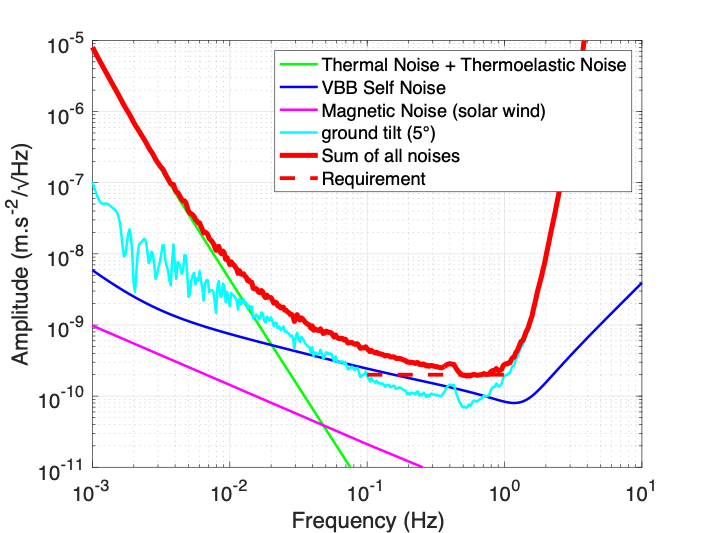
Figure 3: Expected summed noise sources for a “typical” environment with magnetic noise away from the bowshock crossing and a lander tilt of 5 degrees (half the allowed maximum tilt).
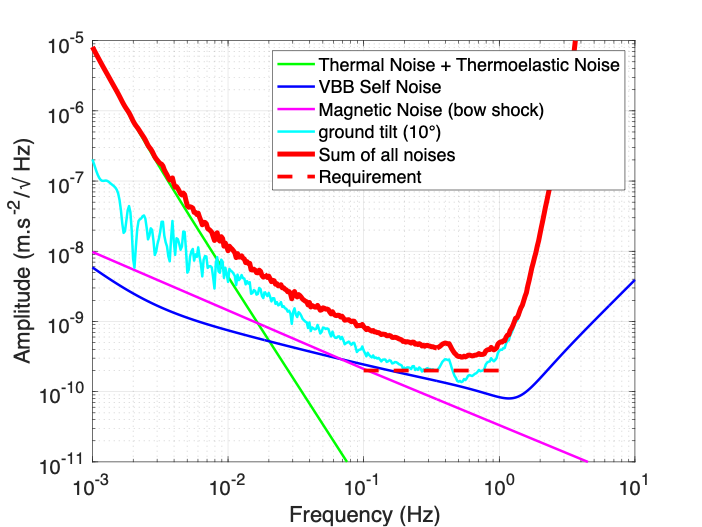
Figure 4: Expected worst case instrument noise with magnetic noise at the bowshock crossing and lander tilt at the maximum allowed (10 degrees).
How to cite: Panning, M., Kedar, S., Bowles, N., Calcutt, S., Drilleau, M., Garcia, R., Kawamura, T., Lognonné, P., Mimoun, D., Nunn, C., Pike, W. T., Portela-Moreira, D., de Raucourt, S., Weber, R., and Wilhelm, A.: Farside Seismic Suite (FSS): First-ever seismology on the farside of the Moon and a model for long-lived lunar science, Europlanet Science Congress 2022, Granada, Spain, 18–23 Sep 2022, EPSC2022-672, https://doi.org/10.5194/epsc2022-672, 2022.
Please decide on your access
Please use the buttons below to download the presentation materials or to visit the external website where the presentation is linked. Regarding the external link, please note that Copernicus Meetings cannot accept any liability for the content and the website you will visit.
Forward to presentation link
You are going to open an external link to the presentation as indicated by the authors. Copernicus Meetings cannot accept any liability for the content and the website you will visit.
We are sorry, but presentations are only available for users who registered for the conference. Thank you.
Posters: Mon, 19 Sep, 18:45–20:15 | Poster area Level 1
he Lunar Gravitational-wave Antenna (LGWA) is a mission conceived as an array of stations to measure the vibrations of the Moon caused by gravitational waves (GWs). LGWA will lead to the first observation of GW signals in the decihertz band greatly expanding our understanding of the universe and laying out a path to eventually probe the moment of its creation. The collaboration is working to build-up the science and technology underlying a successful mission. The final objective is to deploy an array of high-end cryogenic seismometers in one of the Permanently shadowed regions (PSRs) of the Moon. The LGWA seismic stations will also be unique contributions to a lunar geophysical network shedding light on the history of lunar formation.
In this framework, Working Group 2 (Lunar Science and Exploration) is integrating researchers with different background as seismology, geophysics, planetology and astrophysics to build-up the collaborative group whose ambitious targets are: to define the landing site, its geology and its site response, to model the expected background noise and the noise correlation and to predict the lunar response to GWs. Ongoing activities include synthetic modelling of the lunar regolith and the study of the surface geology.
How to cite: Frigeri, A., Olivieri, M., and Harms, J. and the WG2 (Lunar Science and Exploration) of the Lunar Gravitational-Wave Antenna (LGWA) collaboration: Lunar Science and Exploration activities in the framework of the Lunar Gravitation-Wave Antenna (LGWA) collaboration, Europlanet Science Congress 2022, Granada, Spain, 18–23 Sep 2022, EPSC2022-1039, https://doi.org/10.5194/epsc2022-1039, 2022.
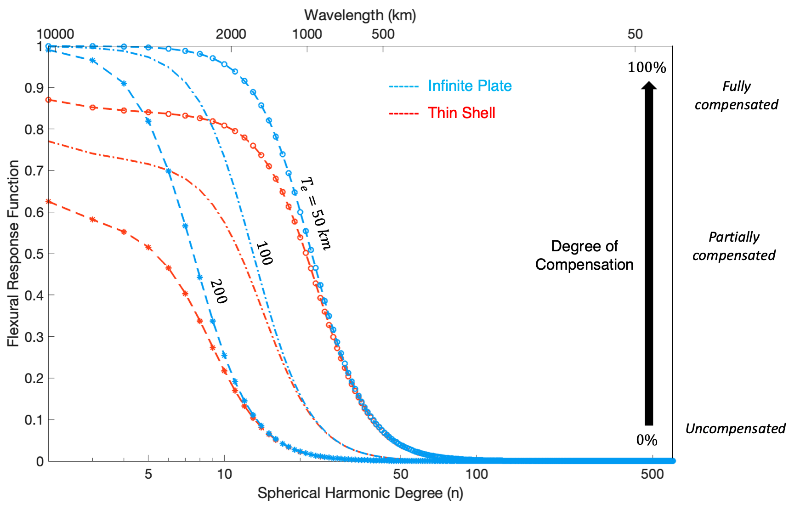
Mars hosts the largest volcano in our solar system, Mons Olympus. This volcano is part of a huge volcanic complex, named Tharsis Rise, which is situated several kilometers higher than the average surface. Flexural isostasy is commonly used to understand the relationship between observed topography, crustal structure, and gravity, revealing structures that support the volcanic complex.
After NASA’s Insight mission, new information about the Martian lithosphere has been discovered, which deserves a re-analysis of the lithosphere flexure models. Our study of Mars suggests that the red planet has a rigid lithosphere. Mars is smaller than the Earth, resulting in a stronger curvature. Therefore, the lithosphere is best modeled with the thin shell method taking into account this curvature effect responsible for supporting its surface loads. We see that the need for local compensation (based on buoyancy) is even lower at long wavelength than that of the classic infinite plate model. This has consequences for the interpretation of density structure underneath the volcanic regions.
After conducting spectral analysis on the topographic and gravity results from the flexural models, we found that the gravitational signal of Martian topography with thin shell compensation fits well with the observed free-air anomaly for degrees, n ≥ 2. The best-fit elastic thickness (Te) is found to be 158 km, which is larger than 34 km for the Earth. Despite the use of the thin shell flexure model, we notice a mismatch between modeled and observed gravity field between n = 2-4 degrees, which suggests active large-scale dynamic support of the Tharsis Rise. This could explain relatively young geologic evidence for surface volcanism on Mars.
How to cite: Root, B. and Qin, W.: A re-analysis of the lithospheric flexure on Mars, Europlanet Science Congress 2022, Granada, Spain, 18–23 Sep 2022, EPSC2022-375, https://doi.org/10.5194/epsc2022-375, 2022.
Motivation
Granular avalanches such as slope streaks, have been observed on Mars since the beginning of the high resolution era with MOC on MGS. Such mass wasting processes are active and their dynamics has a few implications in terms of climatic conditions. However, understanding the slope streaks dynamics is still undergoing. Many authors have proposed dry spreading of fine dust or wet processes (e.g., Schorghofer et al., 2002; 2007). For instance, Head et al., (2007) have proposed spring discharge involving salty ground-water. Many of those studies have been performed from interpretations of geomorphic features by comparing knowing processes occurring on Earth and/or a few comparisons with experimental works. Consequently, a key parameter is the triggering conditions, along with the dynamical behavior of these avalanches. We hence propose a combined approach involving numerical simulations, seismology and orbital imagery in order to provide new insights.
Orbital image constraints
We investigate the orbital images from CTX and HiRISE cameras, both onboard MRO spacecraft. They provide a complete coverage of the two regions of interest being the InSight landing site (135.61ºE 4.49ºN) and the vicinity of the large quake (170.85ºE, 7.05ºS, being at 37º from the SEIS instrument) named 1222 which occurred on 5 May 2020. In both areas, we identified many past avalanche events (Figure 1-A). More specifically, we investigate the complete set of orbital data (imagery, topography, and thermo-physical properties) to estimate in particular the rate of formation of these avalanches in the vicinity of the 1222 event location (Fig. 1-B,C). This has led to request new orbital observations targeted to the most favorable areas for avalanches and hence try to link the ground acceleration resulting from the 1222 event with the triggering of new avalanches by using detection techniques (Fig. 1-D). This work, essentially observational, is combined with the following part on the detectability of this type of source by the SEIS sensor.
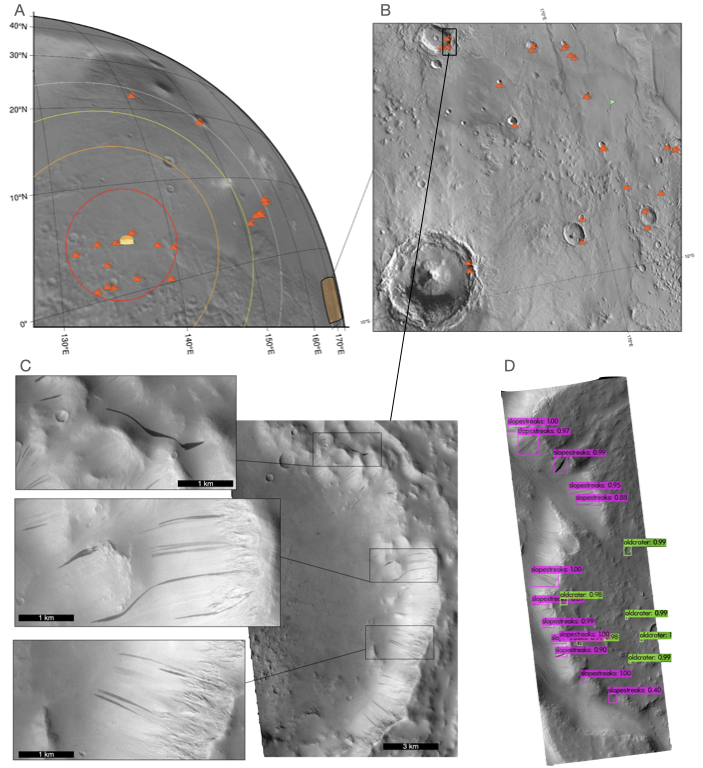
Figure 1 - (A) Location of identifiable landslides and avalanches (rockfall sign) around the InSight landing site (symbolized with the SEIS/WTS sign). The circles show epicentral distance from the receiver at 5º (red), 10º (orange), 15º (yellow) and 20º (light gray), which correspond to ∼300, ∼600, ∼900 and ∼1200 km respectively. Active avalanches (slope streaks) are detected at 150°E. (B) Location of active avalanches (rockfall sign) around the 1222 event location (green flag). (C) Examples of avalanches in the vicinity of the 1222 event location as seen by the CTX camera. This image was taken in May 2011 and reflects the high occurrence of such processes in the area. (D) Detection of slope streaks (and old craters) from neural networks (i.e., using darknet algorithm).
Dynamics and source function of avalanches from numerical simulations
In order to generate synthetic seismic sources due to gravity-driven sediment transport we based our simulations on a depth-averaged Saint-Venant equations model, named SHATLOP, which accounts for the curvature of the topography and on various frictional behavior for the source term following (Lucas & Mangeney, 2007; Lucas et al., 2011;2014). Volumes involved are around 8,000-40,000 m3 with a total drop height up to 1 km. The typical duration of the event is of a few minutes up to 20 minutes for a +2 km runout slope streaks, depending on the frictional law considered and small fluctuation on the bottom topography, which generates surges as shown on Fig. 2-A. The source is considered as a point force applied at the surface from the spatial integration of the avalanche resultant force, where the velocity, the resistance force, the density of the flow and the acceleration due to gravity accounting for the bottom topography curvature are all taken into account (Fig. 2-B). The velocity models are obtained after geological considerations after Pan et al., (2019), where active mass wasting processes have been identified (Fig. 2-C). Examples of resulting seismograms are shown in Fig. 2-D. The velocity model, still under investigation for Mars, is also an important open issue that has a strong impact on the resulting seismic signal. Finally, depending on source functions, velocity models, such an event may be detectable, in particular when occurring during the night at local time of the sensors, when the noise level is low and when spectral content is above SEIS sensitivity (Fig. 2-E).
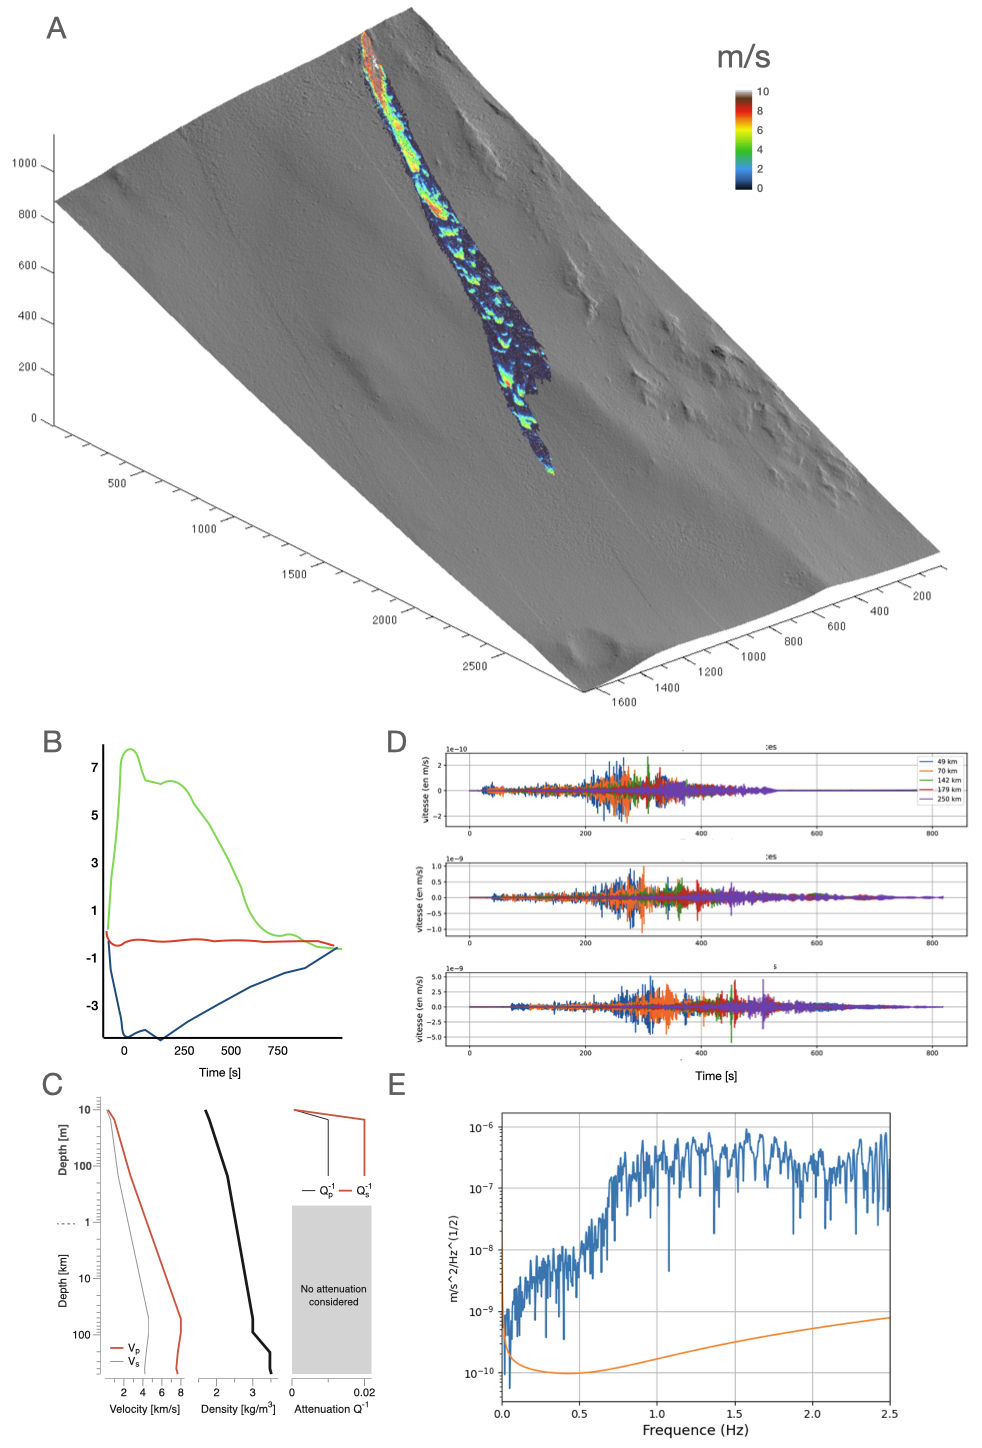
Figure 2 - (A) Example numerical simulation of a martian dust avalanche over a DTM generated from HiRISE stereo pair (Color scales with the velocity). (B) Resulting source force history. (C) Example of a velocity and attenuation model for Mars. (D) Synthetic seismograms accounting source distance for various velocity models and epicentral distances. (E) ADS example for a small event at 140 km.
References
Head, J., Marchant, D., Dickson, J.,Levy, J., Morgan, G. Slope streaks in the Antarctic Dry Valleys: Characteristics, candidate formation mechanisms, and implications for slope streak formation in the Martian environment. 7 th International Conf. (2007)
Lucas A., and A. Mangeney. “Mobility and topographic effects for large Valles Marineris landslides on Mars”. In: Geophys. Res. Lett., 34, L10201 (2007)
Lucas A., et al. “Influence of the scar geometry on landslide dy-namics and deposits: Application to Martian landslides”. In: J. Geophys. Res. - Planets, 116, E10001 (2011)
Lucas, A., A. Mangeney, and J-P. Ampuero. “Frictional velocity-weakening in landslides on Earth and on other planetary bodies”. In: Nature Comm.,5:3417 (2014)
Pan L., et al. “Crust stratigraphy and heterogeneities of the first kilometers at the dichotomy boundary in western Elysium Planitia and implications for InSight lander”. In: Icarus (2019)
Schorghofer N., Aharonson O., and Khatiwala S. “Slope streaks on Mars: Correlations with surface properties and the potential role of water”. In: Geophys. Res. Lett.,29(23) (2002)
Schorghofer, N., Aharonson, O., Gerstell, M. & Tatsumi, L. Three decades of slope streak activity on Mars. Icarus. 191. 132-140 (2007)
How to cite: Lucas, A., Bourdon, L., Mangeney, A., Sainton, G., Bah, M. A., Tawamura, T., Lognonné, P., Rodriguez, S., Posiolova, L., Daubar, I., and malin, M.: InSight for seismically detectability and seismically triggered avalanches on Mars, Europlanet Science Congress 2022, Granada, Spain, 18–23 Sep 2022, EPSC2022-366, https://doi.org/10.5194/epsc2022-366, 2022.
By using arrival times of body waves recorded by the very broadband seismometer SEIS from the InSight mission, 1D average models of the crust, mantle, and core of Mars have been inferred [1, 2, 3]. However, possible causes of seismic wavefield disturbances such as 3D structure, undeniably complexify the interpretation as a 1D radial model. Because the InSight lander and the origin of marsquakes are located close to the crustal dichotomy between the Southern and Northern hemispheres, significant lateral variations of the relief along the crust-mantle interface and the surface topography can potentially affect the seismic wave arrival times, especially for the multiples (PP, PPP, SS, SSS).
In contrast to investigations based on InSight seismic data, gravity and topography data allow one to address the question of lateral variations at global scale. However, the inversion of gravity and topography data is non-unique, in the sense that the latter generally assume constant values for the crust and mantle densities, and consider an average crustal thickness instead of lateral variations. We propose to use the crustal thickness range estimated below the InSight seismometer by [1] as an anchoring point.
To characterize the Martian crustal thickness, we use a Bayesian approach. The marsquake locations (back azimuth, epicentral distance, and depth) and the average radial seismic velocity model of Mars are randomly sampled. Vp, Vs, and density are parameterized in terms of quantities that govern the thermo-chemical evolution of Mars, which accounts for 4.5 Gyr of planetary evolution [5, 6]. In addition to improving the model self-consistency compared to varying independently seismological parameters along the inversion process (Moho depth, seismic velocities, etc.), this geodynamical approach can also constrain the value of physical quantities that are not accessible to direct measurements, such as the rheology of the Martian mantle, and provides the entire history of the planet associated. For each model, a 3D crust is generated, following the approach developed in [4], using the observed gravity field and topography as constraints, enabling to apply body wave arrival time correction for each seismic phase. The models that do not match the crustal thickness range estimated below the InSight lander [1] are rejected.
In addition to revealing the variability of the Martian global thickness maps, our approach shows that further insight into the value of the geodynamic quantities is gained by considering both seismic and gravity constraints on the present-day crustal thicknesses.
References:
[1] Knapmeyer-Endrun, B., et al., Science 373, 438-443 (2021)
[2] Khan, A., et al., Science, 373, 434-438 (2021)
[3] Stähler, S., et al., Science, 373, 443-448 (2021)
[4] Wieczorek, M., et al., JGR Planets, 124, 1410-1432 (2019)
[5] Drilleau, M., et al., JGR Planets, 226, 1615–1644 (2019)
[6] Samuel, H., et al., Nature, 569, 523–527 (2019)
How to cite: Drilleau, M., Samuel, H., Garcia, R. F., Wieczorek, M., Rivoldini, A., Perrin, C., Michaut, C., Lognonné, P., and Banerdt, W. B.: Lateral variations of the Martian crustal thickness from the InSight data set, Europlanet Science Congress 2022, Granada, Spain, 18–23 Sep 2022, EPSC2022-859, https://doi.org/10.5194/epsc2022-859, 2022.
Planetary regolith is important to understand the environmental evolution of planets, which is always one of main topics in planetary landers, like Apollo Program, Tianwen mission, Perseverance Rover, and InSight mission (Zhang et al., 2021). Being familiar with planetary regolith in advance is probably benefit for the migration of human beings, from Earth to other planets, for example whether there is a potential water layer in the regolith or not (Yoldi et al., 2015). Many ways can be used to investigate regolith, including ground-penetrating radar, visible/near-infrared spectrometer, and seismometer, and so on, among which seismic detection can discern the deepest regolith structure.
In this work, we employed broadband-frequency seismic event 1222 detected by InSight mission (InSight Mars SEIS Data Service., 2019) to study the Martian regolith. And we used the receiver function (RF) method to explore the seismic structure of Martian regolith; this method is highly sensitive to velocity discontinuities beneath seismic stations (Lognonné et al., 2020). We calculated P-wave and PP-wave RF of this events in high frequency band, which contains information of regolith.
In our results, we find that in addition to the three major seismic phases that had been detected by previous low-frequency events (Knapmeyer-Endrun et al., 2021), there is an obvious converted wave at around 1 seconds in both P-wave and PP-wave receiver functions.
References
InSight Mars SEIS Data Service. (2019). Seis raw data, insight mission. Seis Raw Data, Insight Mission. IPGP, JPL, CNES, ETHZ, ICL, MPS, ISAE-Supaero, LPG, MFSC. https://doi.org/10.18715/SEIS.INSIGHT.XB_2016
Knapmeyer-Endrun, B., Panning, M. P., Bissig, F., Joshi, R., Khan, A., Kim, D., et al. (2021). Thickness and structure of the martian crust from InSight seismic data. Science, 373(6553), 438–443. https://doi.org/10.1126/science.abf8966
Lognonné, P., Banerdt, W. B., Pike, W. T., Giardini, D., Christensen, U., Garcia, R. F., et al. (2020). Constraints on the shallow elastic and anelastic structure of Mars from InSight seismic data. Nature Geoscience, 13(3), 213–220. https://doi.org/10.1038/s41561-020-0536-y
Yoldi, Z., Pommerol, A., Jost, B., Poch, O., Gouman, J., & Thomas, N. (2015). VIS-NIR reflectance of water ice/regolith analogue mixtures and implications for the detectability of ice mixed within planetary regoliths: VIS-NIR REFLECTANCE OF ICY MIXTURES. Geophysical Research Letters, 42(15), 6205–6212. https://doi.org/10.1002/2015GL064780
Zhang, T., Wang, B., Wei, H., Zhang, Y., Chao, C., Xu, K., et al. (2021). Review on planetary regolith-sampling technology. Progress in Aerospace Sciences, 127, 100760. https://doi.org/10.1016/j.paerosci.2021.100760
How to cite: Shi, J., Lognonné, P., Taichi, K., Matthieu, P., and Xu, Z.: Martian regolith structures revealed by broadband-frequency events, Europlanet Science Congress 2022, Granada, Spain, 18–23 Sep 2022, EPSC2022-831, https://doi.org/10.5194/epsc2022-831, 2022.
The Interior Exploration using Seismic Investigations, Geodesy and Heat Transport (InSight) mission has discovered over thirteen hundreds seismic events since landing on Mars in 2018, shedding the light on the internal structure of Mars (InSight Marsquake Service, 2022). These events have been applied in various Martian seismology studies such as interiors determination and scattering estimation (Lognonné et al., 2020). Site effect study, which is commonly conducted on Earth to estimate the seismic hazard and invert the surficial subsurface structure, has been implemented to Martian ambient noise and event records (Carrasco et al., 2022; Xiao et al., 2022). Nevertheless, a recently detected big event S1222a that reach the magnitude of about 5.0 would further aid to the site effect study beneath the landing site. The amplification of ground accelerations is thought to be related to the subsurface layers and mostly event-independent. Therefore, site effects from different events are expected to share similar features and help to obtain a better result with lower uncertainty compared to result from single event.
The main focus of this study is to investigate the subsurface resonances excited by seismic events in high frequencies above 1.0 Hz. We adopted the classical horizontal to vertical spectral ratio (HVSR) method (Nakamura, 1989) and coherency analyses and explored the optimal parameters for these time-frequency analyses in order to balance both time and frequency resolutions. We used the ambient noise to serve as a baseline in order to distinguish the effects of seismic events and environmental contaminations. Results from ambient noise show that the HVSR spectrogram and coherogram are consistent to each other and both show diurnal variation controlled by the local meteorological conditions. Several H/V peaks are found in the averaged H/V curve, most likely originating from the wind-induced lander vibrations. In contract, we calculated the H/V curves within the P-wave and S-wave windows provided by InSight Marsquake Service (2022) to compare with the results from ambient noise. S1222a stands out to exhibit abundant high frequency content well above the noise level, while other events present energy close to noise level for frequencies above 5.0 Hz. Besides, we identified the excitation of lander modes by seismic events, which is most obvious for the magnitude ~5 S1222a event perhaps due to its very high signal-to-noise ratio. All the analyses above indicate the existence of site effects and both subsurface and lander mechanical resonances could be excited. It is thus important to study how to separate the subsurface resonances and further use them for sublayer inversion.
Previous studies from InSight hammering experiments and jointly seismic-geodetic inversion obtained the physical properties of surficial regolith (Lognonné et al., 2020). Together with these results, it is possible to better constrain the very shallow layers beneath the landing site. Since the site effects would basically have influence on all observation of InSight seismic data, this study also has implication to environmental contamination removal, sublayer velocity inversion, and any other seismic studies that could be affected by strong site effects.
References
[1] Carrasco, S., et al. (2022). Empirical H/V spectral ratios at the InSight landing site and implications for the martian subsurface structure. Geophysical Journal International, submitted.
[2] Lognonné, P., et al. (2020). Constraints on the shallow elastic and anelastic structure of Mars from InSight seismic data. Nature Geoscience, 13(3), 213-220. https://doi.org/10.1038/s41561-020-0536-y
[3] InSight Marsquake Service (2022). Mars Seismic Catalogue, InSight Mission; V10 2022-04-01. ETHZ, IPGP, JPL, ICL, Univ. Bristol. https://doi.org/10.12686/a16
[4] Nakamura, Y. (1989). A method for dynamic characteristics estimation of subsurface using microtremor on the ground surface. Railway Technical Research Institute Quarterly Report, 30(1), 25–33.
[5] Xiao, W., et al. (2022). Characteristics of Horizontal to Vertical Spectral Ratio of InSight Seismic Data from Mars. Journal of Geophysical Research, under review.
How to cite: Xiao, W., Lognonné, P., Kawamura, T., Xu, Z., Carrasco, S., and Knapmeyer-Endrun, B.: Site Effect Study based on Magnitude 4~5 InSight Marsquakes, Europlanet Science Congress 2022, Granada, Spain, 18–23 Sep 2022, EPSC2022-816, https://doi.org/10.5194/epsc2022-816, 2022.
Introduction
The detection of transient waveforms generated by earthquakes began with the deployment of seismometers on the Earth's surface in the early 20th century. With the development of digital seismographs, various seismic detectors have been proposed: IBM, ``Z'', Deflection, Allen, Walsh (among many others, see [3] for a detailed review). Among them we can cite the studies focusing on statistical methods to detect for instance weak features in the continuous signal (e.g. [2]), but also new event detectors based on statistical approaches, template matching or machine learning (e.g [7-6-9]). Due to the primary interest of seismic event detection, developed methods are dedicated to locating rapid impulsive signals in a background signal that is supposed to be gaussian at least for periods larger than 10~seconds [4] and very few of them are used to quantify the gaussianity or non-gaussianity of the continuous seismic signal. We developed a new method to quantify local Gaussianity for a given time window. Using various window lengths that are sliding with time, this approach can be used to investigate the gaussianity. Based only on a statistic criterion, a direct consequence of this new method is the detection of any deviation to the normal law distribution that is governing the whole background seismic signal. The applications presented in this study focuses on the martian signal recorded by the SEIS instrument from the InSight mission [10], [8]. By comparing the seismic signal with reference time series, we propose here a statistical threshold detecting the Gaussian deviations exceeding 3 times the standard deviation defined when the signal is perfectly Gaussian. This statistical frame enables us to extract many perturbations in any seismic signal and the statistical threshold is an efficient way to avoid ad hoc thresholds.
Results
The detection of the different perturbations recorded by the SEIS instrument allows a statistical analysis on the number of perturbations per martian day and their location in time. By analysing the continuous martian signal recorded during the InSight mission, our new approach highlights its non-Gaussian parts, which leads to the localization of differents perturbations. The result of this sliding window method is an α curve whose values are 0 when the local signal is Gaussian and 1 otherwise, which indicates the presence of a perturbation as shown in figure 1.
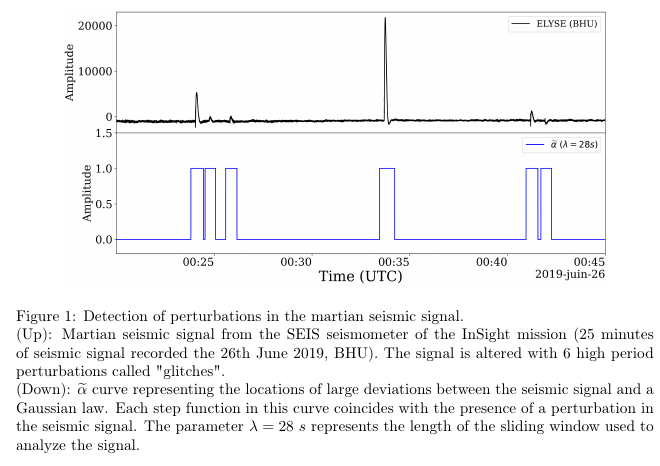
This original approach meets various applications with the martian data from the SEIS station [10], because of the rough environnement (harsh winds, temperature variations of 60°C in one martian day, ...) leading to many alterations in the seismic signal, like pressure drops or glitches presented in figure 1 (see [5] and [1]).
This work aims to focus on the statistical analysis of these non-Gaussian perturbations. A thorough study of their time location during a full martian day is completed in order to estimate the quality of the SEIS signal hour per hour. On the other hand, a comparison of the amount of the daily perturbations over several months is completed in order to highlight the seasonnal influence on the quality of the recorded data. Additionnaly, an analysis of these perturbations using clustering methods is also performed.
Conclusion
We show in this work that quantifying the deviation of the signal to a Gaussian law seems to be an efficient tool to locate the damaged parts of the signal, and therefore the different perturbations altering a seismic signal. Although this method may be applied to terrestrial seismic signal, the present study focused here on the martian seismic signal from the InSight mission. This approach have made it possible to extract the different perturbations recorded by the SEIS instrument. Applying this method over a large period of time, we obtain an inventory of the perturbations altering the martian seismic signal. Finally, analyzing the statistics of the perturbations altering the signal leads to a better comprehension of the behaviour of the first seismic signal ever recorded on Mars and the SEIS instrument itself.
How to cite: Cuvier, A., Beucler, É., Bonnin, M., and Garcia, R.: Non Gaussian transient waveform detections in the martian continuous signal, Europlanet Science Congress 2022, Granada, Spain, 18–23 Sep 2022, EPSC2022-797, https://doi.org/10.5194/epsc2022-797, 2022.
The Apollo Passive Seismic Experiments recorded more than 13000 events on the Moon during 1969-1977 [1]. However, not all of these events were used in our previous studies on the Moon due to the degradation of the quality of the recorded data (Figure 1A). To make better use of Apollo seismic data, we propose several new methods to reprocess it. First, since Apollo seismic records sometimes contain invalid data in every station and component (including the short period component), we removed these invalid data from raw Apollo records using time and ground station number. Then we removed several special spikes with the help of amplitude histogram. This enables us to compute the envelopes for a larger number of moonquake events. Acceleration and displacement step responses are used to fit glitches using the Lagrange multiplier method. The ‘glitches’ we term here are artifact one-sided pulses in the raw data. We find that the instrument response parameters vary with time. So, we determined the instrument response parameters with the calibration signal and removed it near the event. Finally, we used the smoothed envelope to detect the single spike (spike with only one point) and removed it when exceeds the envelope. These new processing steps lead to considerably cleaner Apollo data (Figure 1B), yield a more accurate arrival time reading, and result in an envelope that reflects more realistic waveform characteristics. We expect that additional moonquake records will become available with these methods for future research. Further study of the instrument response variations of the Apollo seismometer will also provide a reference for the new lunar seismometers to be deployed in upcoming space missions.
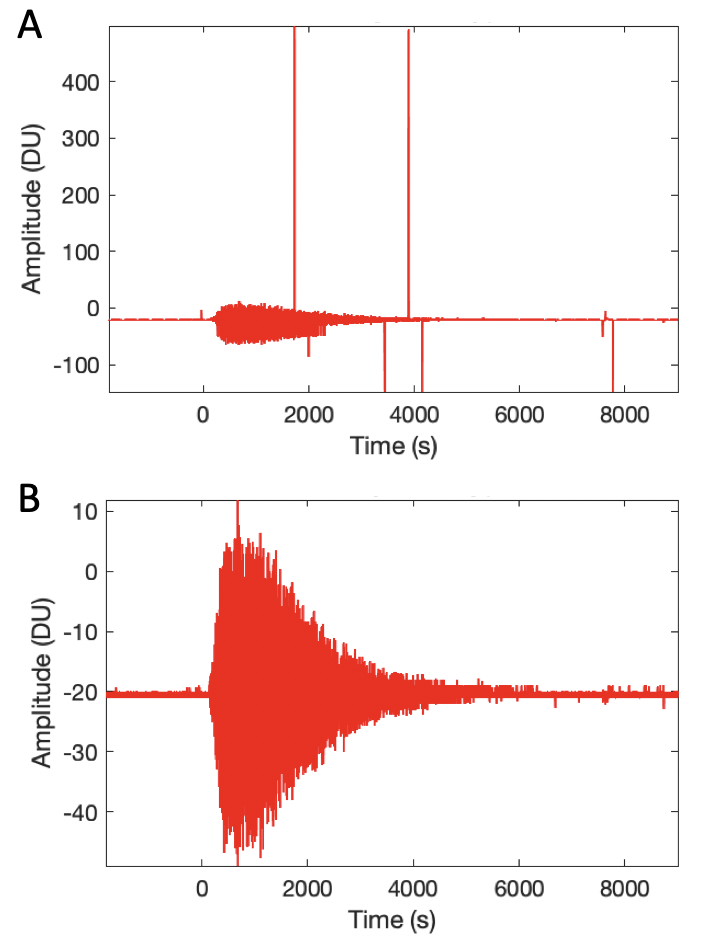
Figure 1. An example of a comparison plot before (A) and after (B) Apollo moonquake data processing.
Reference:
[1] Nunn, C., Garcia, R. F., Nakamura, Y., Marusiak, A. G., Kawamura, T., Sun, D., et al. (2020), Lunar seismology: A data and instrumentation review. Space Science Reviews, 216(5), 89. doi:10.1007/s11214-020-00709-3
How to cite: Zhang, X., Lognonné, P., Kawamura, T., Samuel, H., Xu, Z., Sainton, G., Froment, M., and Onodera, K.: Reprocessing Apollo seismic data, Europlanet Science Congress 2022, Granada, Spain, 18–23 Sep 2022, EPSC2022-846, https://doi.org/10.5194/epsc2022-846, 2022.
Please decide on your access
Please use the buttons below to download the presentation materials or to visit the external website where the presentation is linked. Regarding the external link, please note that Copernicus Meetings cannot accept any liability for the content and the website you will visit.
Forward to presentation link
You are going to open an external link to the presentation as indicated by the authors. Copernicus Meetings cannot accept any liability for the content and the website you will visit.
We are sorry, but presentations are only available for users who registered for the conference. Thank you.
Please decide on your access
Please use the buttons below to download the presentation materials or to visit the external website where the presentation is linked. Regarding the external link, please note that Copernicus Meetings cannot accept any liability for the content and the website you will visit.
Forward to session asset
You are going to open an external link to the asset as indicated by the session. Copernicus Meetings cannot accept any liability for the content and the website you will visit.
We are sorry, but presentations are only available for users who registered for the conference. Thank you.