
 1,1,3,
- 1Jet Propulsion Laboratory/California Institute of Technology, Pasadena, United States of America (mark.hofstadter@jpl.nasa.gov)
- 2National Radio Astronomy Observatory
- 3Center for Astrophysics | Harvard & Smithsonian
Introduction
Our team has collected a 40+ year record of ground-based radio observations of Uranus, which constrain atmospheric circulation and chemistry in the 1 to 100 bar pressure region as a function of latitude, altitude, and season.
The Data Set
Our primary data set is 25 images of Uranus made at the Very Large Array (VLA) and Submillimeter Array (SMA) radio observatories between 1981 and 2022 (Fig. 1). Observations were made at wavelengths between 0.1 and 21 cm. They are augmented by unresolved measurements at wavelengths from 350 µm to 1.3 mm from the James Clerk Maxell Telescope (JCMT) and the Caltech Submillimeter Observatory (CSO).

Figure 1: VLA image of Uranus at a wavelength of 1 cm, observed in 2012. The North Pole is on the right. Bright regions have a lower abundance of absorbing species.
Retrievals of Atmospheric Properties
The data set is primarily sensitive to the vertical profiles of H2S, NH3, and H2O between about 0.7 and 100 bars (Fig. 2). We considered three models to constrain their vertical profiles.
Chemical Equilibrium Model: The abundance of species deep in the troposphere is allowed to vary with latitude, but vertically they are assumed to condense out according to their saturation vapor pressures. The saturation vapor pressure is allowed to be modified by a relative humidity anywhere from 0 to 10.
Hadley-Type Model: Low latitudes are in chemical equilibrium and represent regions of upwelling (Fig. 3). High latitudes represent areas of subsidence where condensable species are depleted down to a depth which is varied to fit the data.
Juno-Type Model: Inspired by results from the Juno spacecraft at Jupiter [1], all opacity is represented by NH3 with three free parameters: upper and lower atmospheric mixing ratios, and the pressure at which the transition between ratios occurs.
For all models that fit the data, we find:
- Regions poleward of ±50˚ are depleted in condensables relative to lower latitudes by a factor of ~50, down to a depth of ~20 to ~50 bars.
- Regions between the equator and ±30˚ are richer in condensables. Equilibrium models require more H2S in these regions than NH3.
- Regions between 30˚ and 50˚ North and South are intermediate in their abundance of condensables.
- In the 1 to 5 bar region, relative humidities at low latitudes are ~1.4 and they are ~0 over the poles, and/or the meridional temperature variations of ~ 2 K observed near 800 mbar [2] extend to these depths.
- The abundance of condensables over a large altitude range varies by ~30% near latitudes of 0˚, ±20˚ and ±75˚.
- During mid-summer the pole to equator contrast decreases.
Many of the features reported above have been seen previously [e.g., 3, 4], though our analysis is unique in spanning a large altitude and time range.
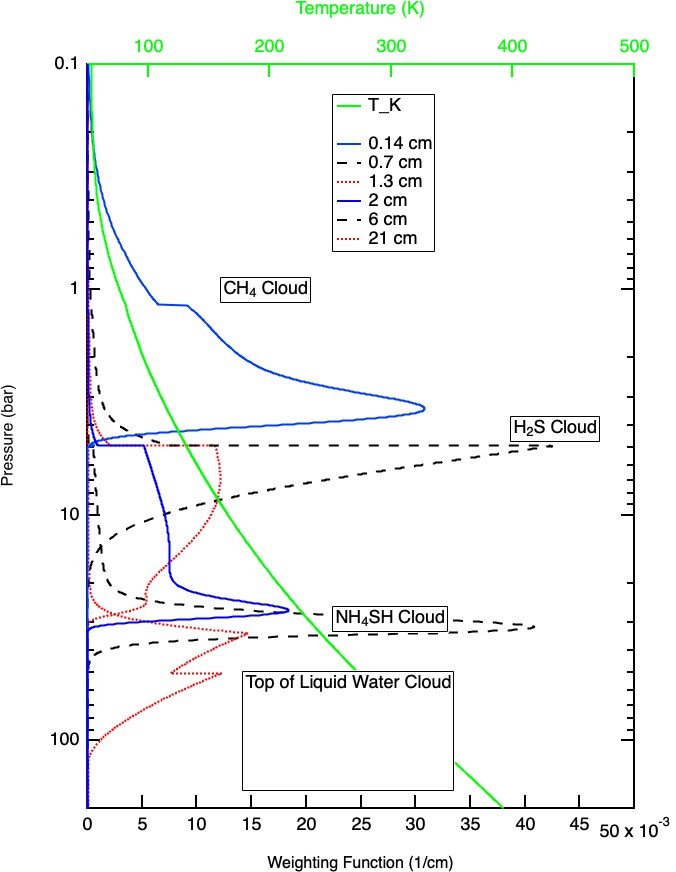
Figure 2: Weighting functions for the primary wavelengths used in this study, and the assumed atmospheric temperature profile. The location of various cloud layers is indicated.
Discussion
A large-scale circulation pattern is one possible cause of the observed spatial variations (Fig. 3). We refer to this as our Hadley-type model. (Uranus' poles receive more sunlight than the equator on an annual average, however, making this circulation opposite in a thermal sense to a classic Hadley cell.) At the time of the conference we expect to have completed dynamical modeling to test the plausibility of this scenario. In this model, smaller circulation patterns would explain the fainter banding seen in images (Fig. 1).
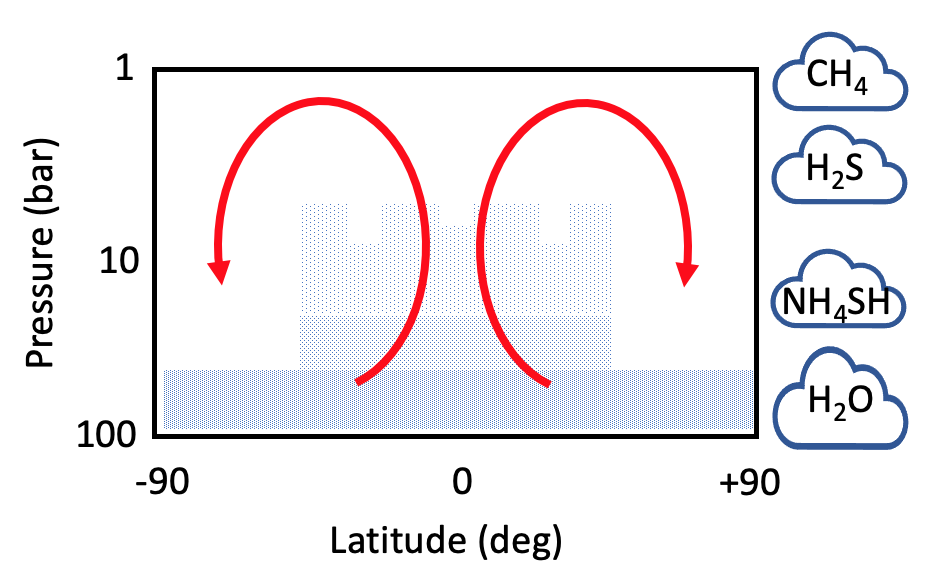
Figure 3: The density of blue dots is indicative of the observed absorber abundance. The altitude of expected clouds is shown along the right. A possible circulation pattern is indicated in red, with upwelling near the equator carrying absorber-rich air parcels upward. The rising air cools and clouds form, depleting air parcels in absorbers. Depleted air parcels then move poleward and descend at high latitudes.
An alternative explanation is what we refer to as a Juno-type model. The depletion of condensables in the ~5 to ~50 bar region of the Uranus atmosphere relative to deeper down and the meridional gradients are reminiscent of what the Juno spacecraft discovered at Jupiter [1]. Mechanisms proposed for Jupiter [e.g., 5] rely on vigorous convection. Since the variations at Uranus are more than 10x larger than those seen at Jupiter, but the uranian atmosphere near 1 bar seems less convectively active than Jupiter's, this interpretation would suggest that the deep Uranus troposphere is much more active than the upper troposphere. If such a process strongly depletes Uranus' 1 to 50 bar region of NH3 but depletes H2S to a lessor (but still significant) extent, that would explain why the observed absolute abundances of NH3 and H2S at Uranus are so much smaller than expected from planetary formation models, while the observed S/N ratio is much larger than expected [6].
The large-scale pole-to-equator brightness gradient and smaller-scale banding are always present in the spring, summer, and fall (the winter hemisphere cannot be seen from the Earth). For roughly ±5 years around the previous summer solstice (which occurred in 1985), however, the contrast between pole and equator was less than it was at other times, indicative of a weakening in circulation patterns. The next summer solstice is in 2028, so if we have indeed observed a seasonal effect, it should arise again in the next few years.
Acknowledgements
We thank the staff and funding agencies of the VLA, SMA, JCMT, and CSO observatories. We also thank Dr. Göran Sandell for providing the JCMT and CSO data used, and Dr.'s I. de Pater and E. Molter for useful discussions. Parts of this work were carried out at JPL/Caltech, under a contract with NASA.
References
[1] Bolton, S.J. et al. (2017) Science, 356, 6340/821. [2] Hanel, R.B. et al. (1986) Science, 233, 70–74. [3] Hofstadter, M.D. and Butler, B.J. (2003) Icarus, 165, 168–180. [4] Molter, E.M, et al. (2021) Plan. Sci Journ. 2:3. [5] Guillot, T. et al. (2020) JGR Planets, 125, e2020JE006403. [6] Atreya, S.K. et al. (2020) Space Sci Rev, 216:18.
How to cite: Hofstadter, M., Butler, B., Akins, A., Gurwell, M., and Friedson, J.: Radio Observations of Uranus: Implications for the Structure and Dynamics of the Deep Troposphere, Europlanet Science Congress 2022, Granada, Spain, 18–23 Sep 2022, EPSC2022-771, https://doi.org/10.5194/epsc2022-771, 2022.