Europlanet Science Congress 2022
Palacio de Congresos de Granada, Spain
18 – 23 September 2022
Europlanet Science Congress 2022
Palacio de Congresos de Granada, Spain
18 September – 23 September 2022
OPS1
Ice Giant System Science and Exploration

OPS1

This session will cover all aspects of ice giant (IG) systems including (but not limited to) the atmospheric structure and composition, magnetospheres, interiors, satellites, and rings of the IGs. Interdisciplinary, crosscutting themes of ice giant planet exploration, such as the relationship to exoplanetary science and connections to heliophysics will also be considered in the session. The session will comprise a combination of solicited and contributed oral and poster presentations on new, continuing, and future studies of the ice giant systems and the importance of the ice giants to models of the formation and evolution of the giant planets and solar systems. We welcome abstracts that
• Address the current understanding of ice giant systems, including atmospheres, interiors, magnetospheres, rings, and satellites including Triton.
• Advance our understanding of the ice giant systems in preparation for future exploration, both by remote sensing and in situ.
• Discuss what the ice giants can tell us about solar system formation and evolution leading to a better understanding of the current structure of the solar system and its habitable zone as well as extrasolar systems.
• Address outstanding science questions requiring future investigations including from spacecraft, remote sensing, theoretical, and laboratory work necessary to improve our knowledge of the ice giants and their relationship to the gas giants and the solar system.
• Present concepts of missions, instruments and investigations relevant to future exploration of the ice giant planetary systems.

Co-organized by MITM
Convener: Thibault Cavalié | Co-conveners: David H. Atkinson, Olivier Mousis, Alena Probst, Sushil K. Atreya, Mark Hofstadter, Leigh Fletcher, Nadine Nettelmann
Orals
| Mon, 19 Sep, 10:00–11:30 (CEST), 15:30–17:00 (CEST)|Room Andalucia 2
Posters
| Attendance Mon, 19 Sep, 18:45–20:15 (CEST) | Display Mon, 19 Sep, 08:30–Wed, 21 Sep, 11:00|Poster area Level 1

Session assets

Discussion on Slack

Orals: Mon, 19 Sep | Room Andalucia 2

Chairperson: Thibault Cavalié
10:00–10:15
|
EPSC2022-1237
|
solicited
Adam Masters

Since the Voyager 2 flyby in 1986 the radiation belts of Uranus have presented a problem for magnetospheric physicists. The proton radiation belt was measured to be far less intense than the electron radiation belt, below theoretical predictions. Here we propose this could be a persistent characteristic of the environment that is due to the relatively strong non-dipolar structure of the planetary magnetic field. We model the trajectories of test particles in Uranus’ dipole-plus-quadrupole magnetic field and find that the quadrupole component causes their gradient-curvature drift to take them across dipole “L-shells” as they bounce between hemispheres. This finite-gyroradius effect is greatest for 100-keV protons, promoting the drift of these particles into regions where they are lost through impact with the rings, impact with the atmosphere, or to the more distant magnetosphere and solar wind. We suggest this could explain the relatively weak proton radiation belt observed by Voyager 2.

How to cite: Masters, A.: Does the non-dipolar structure of Uranus’ magnetic field produce a relatively weak proton radiation belt?, Europlanet Science Congress 2022, Granada, Spain, 18–23 Sep 2022, EPSC2022-1237, https://doi.org/10.5194/epsc2022-1237, 2022.

10:15–10:30
|
EPSC2022-881
|
ECP
Antoine Schneeberger, Olivier Mousis, Artyom Aguichine, and Jonathan Lunine

How volatiles were incorporated in the building blocks of planets and small bodies in the protosolar nebula (PSN) remains an outstanding question. Some scenarios consider that planetesimals formed from a mixture of refractory material and volatiles trapped in amorphous ice in the outer nebula, while others hypothesize that volatiles have been incorporated in clathrates or formed pure condensates [1,2]. Here, we study the evolution of volatiles species in the PSN (H2O, CO, CO2, CH4, H2S, N2, NH3, Ar, Kr, Xe and PH3) considering two possible volatiles reservoir in the initial state: amorphous ice (see Figure 1) or pure condensates (see Figure 2).  To do so, we use a 1D disk accretion model [3]  with radial transport of trace species to compute the radial distribution of volatiles in the PSN. This model includes condensation/sublimation rates of pure condensates, as well as clathration/release rates when enough crystalline water is available. Figure 1 represents the case where volatiles are initially delivered to the PSN in the form of pure condensates. Figure 2 represents the case where volatiles are delivered to the PSN by amorphous ice. Species are released when amorphous grains cross the ACTZ region. Once delivered to the disk, the phase (solid or gaseous) of each species is ruled by the positions of its corresponding condensation and clathration lines. Clathration lines of the considered volatiles are closer to the Sun than their respective condensation lines, except for CO wich have its clathration line further from the sun than its condensation line. Gaseous volatiles condense or become entrapped (depending on the availability of water ice) when diffusing outward the locations of their lines. Conversely, volatiles condensed/entrapped in grains or pebbles are released in gaseous forms when drifting inward their lines. Peaks of abundances form close to each line.  Our simulations show that a significant fraction of volatiles can be trapped in clathrates, only if they have initially been delivered in pure condensate forms to the disk. We also show that several regions in the protosolar nebula share a metallicity that is consistent with those measured in the atmospheres of the ice giants [3,4]. These findings have important implications for the formation history of the outer planets

Figure 1 : Scheme showing the disk at initialization and at a given time. The volatiles are initially delivered under pure condensates and vapor. The vapor will condensate into clathrate hydrate, if there is enough crystalline water available. Grains drift inward while vapor undergo diffusion inward and outward. Leading to an accumulation of species at the place of condensation lines.


Figure 2 Scheme showing the disk at initialization and at a given time. The volatiles are initially delivered trapped into amorphous ice and vapor released from amorphous ice at the Amorphous to Crystalline Transition Zone (ACTZ). The clathration line is further than the ACTZ, since there no crystalline water after the ACTZ, clathration cannot happen, or is marginal if the clathration line is close to the ACTZ.

[1] : Gautier, D., Hersant, F., Mousis, O., et al. 2001, ApJL, 550, L227  

[2] : Mousis, O., Ronnet, T., & Lunine, J. I. 2019, ApJ, 875, 9.

[3] : Aguichine, A., Mousis, O., Devouard, B., et al. 2020, ApJ, 901, 97.

[4] : Asplund, M., Grevesse, N., Sauval, A. J., et al. 2009, ARA&A, 47, 481.

[5] : Irwin, P. G. J., Toledo, D., Garland, R., et al. 2018, Nature Astronomy, 2, 420.

How to cite: Schneeberger, A., Mousis, O., Aguichine, A., and Lunine, J.: Evolution of the reservoir of volatiles in the protosolar nebula, Europlanet Science Congress 2022, Granada, Spain, 18–23 Sep 2022, EPSC2022-881, https://doi.org/10.5194/epsc2022-881, 2022.

10:30–10:45
|
EPSC2022-166
Nicholas Teanby, Patrick Irwin, Lucy Wright, and Robert Myhill

Introduction

To understand solar system formation it is critical to know how Uranus and Neptune formed. This requires knowledge of internal composition. Uranus and Neptune are generally referred to as ”ice-giants” in recent literature, as it has been inferred that their interiors are ice-dominated. Physical measurements from the Voyager 2 flybys include mass, radius, oblateness, low order gravity coefficients, moments of inertia, and magnetic field snapshots. One fundamental issue is that high temperature and pressure ice mixtures have similar densities to silicates mixed with hydrogen and helium. Therefore, existing physical constraints cannot by themselves distinguish between ice or rock-dominated interiors and almost any interior model fits the observations [5,10]. Measurements of atmospheric composition and temperature provide a possible complementary window into these planets’ interiors and may provide a way to break the degeneracy [12]. Here we consider the case for ice and rock-dominated interiors and attempt to propose a consistent explanation.

The case for Ice Giants

Internally-generated magnetic fields are observed at Uranus and Neptune [11]. Fields are highly non-dipolar, suggesting a shallow origin. Magnetic field generation requires conducting fluid and the conventional explanation is super-ionic water at high temperature and pressure, implying ice-dominated interiors.

Spectroscopic atmospheric CO observations provide further evidence favouring the ice giant model. CO has higher abundance in Uranus’ and Neptune’s stratospheres than in their tropospheres, indicating an external source [7]. Uranus has ~8 ppb stratospheric CO and <2 ppb tropospheric CO, which can mostly be accounted for with background interplanetary dust particle flux. Conversely, Neptune’s stratospheric CO abundance is the largest of any giant planet at ~1000 ppb. The only way to feasibly explain this is with a kilometre-scale ancient comet impact and shock chemistry, where cometary water reacts with methane in Neptune’s atmosphere to form CO [7,9].

More relevant to the interior is that Neptune appears to have ~100 ppb tropospheric CO. Conventionally, this is explained by quenching CO dredged up from the deep interior by Neptune’s vigorous tropospheric mixing. Thermochemical models predict ~400 x O/H enrichment over solar abundance is required to reproduce this CO amount [2,8]. This extreme enrichment requires ~90% water ice in Neptune’s interior, again implying an ice-dominated interior. It is usually extrapolated that Uranus is also an ice giant with a similarly extreme oxygen and ice abundance, where the lack of CO in Uranus’ troposphere is conveniently explained by more sluggish tropospheric mixing.

Issues with the Ice Giant model

Although ice-dominated interiors can explain many observational aspects of Uranus and Neptune, there are also some worrying discrepancies.

1) Most icy bodies in the outer solar system have rock fractions of ~70%. If Uranus and Neptune formed from similar objects, then we require some explanation of where the missing rock fraction has gone or why the planetesimals that formed Uranus and Neptune are different to anything we observe today.

2) Measurements of atmospheric methane on Uranus and Neptune suggest deep abundances of a few percent [6]. This implies a C/H enrichment of ~50–100 x solar [1], which is much lower than that inferred for O/H from tropospheric CO.

3) D/H is ~4x10⁻⁵ on both Uranus and Neptune [3]. This is much lower than D/H observed in modern solar system icy objects such as comets, which typically have D/H ∼15–60x10-5. If interiors of Uranus and Neptune are well mixed and equilibrated, this implies only ~15% of the interiors can be ice, suggesting ~50–100 x solar enrichment [12]. Again, much lower than inferred from CO. A way around this is for interiors to only be partially mixed and equilibrated, with more D hiding in the unobservable deep atmosphere. Alternatively, some form of extinct exotic ices with lower D/H could be the source material.

In summary, exotic ices, incomplete interior mixing, and unusually ice-rich planetesimals have all been invoked to make atmospheric observation consistent with the ice giant model. Not impossible, but also not entirely convincing as an explanation.

Rock Giant interiors as a potential solution

The alternative is that Uranus and Neptune’s interiors are rock-dominated. In this case we need to explain magnetic field generation and Neptune’s tropospheric CO.

Recent work shows mixtures of silicates, hydrogen, and helium may be conductive at relevant pressures and temperatures, so super-ionic water is not necessarily required to generate magnetic fields [4]. Alternatively, there is no-doubt some ice in Uranus and Neptune’s interiors, which may form thin shell dynamos and explain non-dipolar field structures.

Recent work also shows tropospheric CO may not actually be present throughout the troposphere and may be limited to the upper troposphere [12,13]. In this case, CO could be entirely sourced externally from comets.

Profiles with CO limited to pressures <1 bar can fit spectroscopic observations very well, but require reduced upper troposphere eddy mixing to allow CO to survive long enough post-comet-impact to still be observable today. This seems plausible, as inspection of the Voyager 2 temperature profile and lapse rate suggest the upper troposphere is relatively stable [12]. Furthermore, Far-IR brightness temperatures suggest the boundary between radiative and convective zones may be ~1 bar.

Conclusion

Recent advances in our understanding of CO profiles on Neptune and high-pressure conductivity of silicate/hydrogen/helium mixtures suggests that rock-dominated interiors for Uranus and Neptune are becoming more plausible than conventional ice giant scenarios. Such a rock giant could be formed from planetesimals with similar rock:ice ratios and D/H ratios to modern-day outer solar system comets, Kuiper belt objects, and icy moons. Interiors could also be well mixed and equilibrated. This opens the possibility of simpler formation mechanisms for Uranus and Neptune, with both planets forming in similar ways, and avoiding any requirements for dubious ice compositions.

References

[1] Atreya+ 2020. https://ui.adsabs.harvard.edu/abs/2020SSRv..216...18A/abstract

[2] Cavalié+ 2017. https://ui.adsabs.harvard.edu/abs/2017Icar..291....1C/abstract

[3] Feuchtgruber+ 2013. https://ui.adsabs.harvard.edu/abs/2013A%26A...551A.126F/abstract

[4] Gao+ 2022. https://ui.adsabs.harvard.edu/abs/2022PhRvL.128c5702G/abstract

[5] Helled+ 2020. https://ui.adsabs.harvard.edu/abs/2020RSPTA.37890474H/abstract

[6] Irwin+ 2019. https://ui.adsabs.harvard.edu/abs/2019Icar..331...69I/abstract

[7] Lellouch+ 2005. https://ui.adsabs.harvard.edu/abs/2005A%26A...430L..37L/abstract

[8] Luszcz-Cook+de Pater 2013. https://ui.adsabs.harvard.edu/abs/2013Icar..222..379L/abstract

[9] Moreno+ 2017. https://ui.adsabs.harvard.edu/abs/2017A%26A...608L...5M/abstract

[10] Neuenschwander+Helled 2022. https://ui.adsabs.harvard.edu/abs/2022MNRAS.512.3124N/abstract

[11] Soderlund+Stanley 2020. https://ui.adsabs.harvard.edu/abs/2020RSPTA.37890479S/abstract

[12] Teanby+ 2020. https://ui.adsabs.harvard.edu/abs/2020RSPTA.37890489T/abstract

[13] Teanby+ 2019. https://ui.adsabs.harvard.edu/abs/2019Icar..319...86T/abstract


How to cite: Teanby, N., Irwin, P., Wright, L., and Myhill, R.: Monsters of rock: are Uranus and Neptune rock giants?, Europlanet Science Congress 2022, Granada, Spain, 18–23 Sep 2022, EPSC2022-166, https://doi.org/10.5194/epsc2022-166, 2022.

10:45–11:00
|
EPSC2022-430
Kathleen Mandt, Olivier Mousis, Jonathan Lunine, Amy Simon, Mark Hofstadter, Erin May, and Laura Mayorga

The 2023 Planetary Science Decadal Survey recommended a Uranus Orbiter and Probe as the top priority flagship for NASA and encourages collaboration with ESA in this mission. One of the primary science objectives of this mission would be to determine how this class of planets formed. The current composition, particularly the abundances and isotopes of noble gases, in the atmosphere of Uranus will provide information on how the planet formed, and on the origin of the solid building blocks that contributed to its formation.

Noble gas abundances and their isotope ratios are among the most valuable pieces of evidence for tracing the origin of the materials from which the giant planets formed. We will outline the current state of knowledge for heavy element abundances in the giant planets and explain what is currently understood about the reservoirs of icy building blocks that could have contributed to the formation of the Uranus. We then outline how noble gas isotope ratios have provided details on the original sources of noble gases in various materials throughout the solar system. We follow this with a discussion on how noble gases are trapped in ice and rock that later became the building blocks for the giant planets and how the heavy element abundances could have been locally enriched in the protosolar nebula. We then provide a review of the current state of knowledge of noble gas abundances and isotope ratios in various solar system reservoirs, and discuss measurements needed to understand the origin of Uranus. Finally, we outline how formation and interior evolution will influence the noble gas abundances and isotope ratios observed in Uranus today. The measurements required to understand the origin of Uranus can only be made by an atmospheric probe, and include (1) the 3He/4He isotope ratio to help constrain the protosolar D/H and 3He/4He; (2) the 20Ne/22Ne and 21Ne/22Ne to separate primordial noble gas reservoirs similar to the approach used in studying meteorites; (3) the Kr/Ar and Xe/Ar to determine if the building blocks were Jupiter-like or similar to 67P/C-G and Chondrites; (4) the krypton isotope ratios for the first giant planet observations of these isotopes; and (5) the xenon isotopes for comparison with the wide range of values represented by solar system reservoirs.


Mandt, K. E., Mousis, O., Lunine, J., Marty, B., Smith, T., Luspay-Kuti, A., & Aguichine, A. (2020). Tracing the origins of the ice giants through noble gas isotopic composition. Space Science Reviews, 216(5), 1-37.


How to cite: Mandt, K., Mousis, O., Lunine, J., Simon, A., Hofstadter, M., May, E., and Mayorga, L.: The Importance of Noble Gas Isotopic Composition for Understanding the Origins of the Ice Giants, Europlanet Science Congress 2022, Granada, Spain, 18–23 Sep 2022, EPSC2022-430, https://doi.org/10.5194/epsc2022-430, 2022.

11:00–11:15
|
EPSC2022-56
|
ECP
Benno Neuenschwander and Ravit Helled

Uranus and Neptune are still poorly understood. Their gravitational fields, rotation periods, atmosphere dynamics, and internal structures are not well determined. In this paper, we present empirical structure models of Uranus and Neptune where the density profiles are represented by polytropes. By using these models that are set to fit the planetary gravity field, we predict the higher order gravitational coefficients J6 and J8 for various assumed rotation periods, wind depths, and uncertainty of the low-order harmonics. We show that faster rotation and/or deep winds favour centrally concentrated density distributions. We demonstrate that an accurate determination of J6 or J8 with a relative uncertainty no larger than 10% could constrain wind depths of Uranus and Neptune. We also confirm that the Voyager II rotation periods are inconsistent with the measured shapes of Uranus and Neptune. We next demonstrate that more accurate determination of the gravity field can significantly reduce the possible range of internal structures. Finally, we suggest that an accurate measurement of the moment of inertia of Uranus and Neptune with a relative uncertainty of ∼1% and ∼0.1%, could constrain their rotation periods and depths of the winds, respectively.

How to cite: Neuenschwander, B. and Helled, R.: Empirical Structure Models of Uranus and Neptune, Europlanet Science Congress 2022, Granada, Spain, 18–23 Sep 2022, EPSC2022-56, https://doi.org/10.5194/epsc2022-56, 2022.

11:15–11:30
|
EPSC2022-1205
|
ECP
Deniz Soyuer and Ravit Helled

Recent studies show that planetary “ices” such as water and ammonia become ionically conducting under conditions present in Uranus and Neptune. Moreover, within the ionic liquid regime of water present in the outer layers of the planets, dissociation of hydrogen in H2-H2O mixtures has a significant ionic contribution to electrical conductivity. At the same time, the interiors of Uranus and Neptune are poorly constrained, and can be fitted with varying amount of ice-to-rock ratios, challenging the view of Uranus and Neptune being “ice giants”. Understanding the behaviour of electrical conductivity within Uranus and Neptune has a direct implication on understanding their observed multipolar and non-axisymmetric magnetic fields, the extents of their dynamo generation region, their composition, and the complex secondary fields due to the background magnetic field—zonal flow coupling.


We present a method for calculating electrical conductivity profiles of ionically conducting H2-He-H2O mixtures using results from ab initio simulations. We then apply this prescription on several published interior structure models of Uranus and Neptune. We find that the conductivity increases rapidly with depth in the outer 20% for both planets. With rapidly increasing electrical conductivity, fast zonal winds on Uranus and Neptune inevitably couple to the background magnetic field, inducing electrical currents and magnetic field perturbations spatially correlated with zonal flows. Induced currents generate Ohmic dissipation, which can be used to constrain the depth of the zonal winds when considering the energy/entropy flux budget throughout the planetary interior. Constraining the zonal wind decay is not only important for understanding the atmosphere dynamics on Uranus and Neptune, but can also be used to estimate the strength of magnetic field perturbations. We find that the poloidal component of these perturbations can reach 𝒪(0.1) of the background magnetic field in strength, depending on the temperature profile of the planets. We suggest that these effects could be detectable by the future flagship mission to Uranus.


How to cite: Soyuer, D. and Helled, R.: The Implications of Electrical Conductivity Models of Uranus and Neptune, Europlanet Science Congress 2022, Granada, Spain, 18–23 Sep 2022, EPSC2022-1205, https://doi.org/10.5194/epsc2022-1205, 2022.

Coffee break
15:30–15:45
|
EPSC2022-477
|
ECP
Noe Clement, Jeremy Leconte, Aymeric Spiga, Gwenael Milcareck, Sandrine Guerlet, and Franck Selsis

Despite the little insolation received by the ice giant planets, the stormy activity of their atmospheres is intense. Indeed Neptune has the strongest winds in the solar system, reaching 400 m/s in addition to being retrograde. What is the phenomenum responsible for this activity ?

Interestingly, unlike the Earth, the species able to condense in the atmospheres of Uranus and Neptune, methane in particular, are heavier than the ambient air, essentially hydrogen. This property makes convection difficult to start [1,2]. Convection in these atmospheres should therefore be a regime of strong intermittence where convective energy can be stored for a long time before being released in short episodes. Our hypothesis is that this regime is at the origin of intense storms. Then, these storms could drive the intense winds observed on a global scale.

To study this hypothesis, we use a "cloud-resolving" model. This model is built from a dynamical core (The Weather Research and Forecasting model), that has been initially developed for terrestrial applications and already adapted for simulations on Mars and Venus [3,4], coupled to independent physical parameterizations such as a radiative transfer. The high resolution of the model grid can allow us to highlight dry but also moist atmospheric convection, by resolving cloud formation and dissipation.

We will present our implementation of methane cycle in this model and first moist simulations, and compare them with simple dry simulations, in order to reveal the impact of Methane cycle in tropospheric convection on Neptune.


(1) Leconte J., Selsis F., Hersant F., Guillot T. (2017) Condensation-inhibited convection in hydrogen-rich atmospheres. stability against double-diffusive processes and thermal profiles for Jupiter, Saturn, Uranus, and Neptune Astron. Astrophys., 598 (2017), p. A98, 10.1051/0004- 361/201629140

(2) Hueso R, Guillot T, and Sánchez-Lavega A. (2020) Convective storms and atmospheric vertical structure in Uranus and Neptune. Phil. Trans. R. Soc. A 378: 20190476. http://dx.doi.org/10.1098/rsta.2019.0476

(3) Spiga, A., and F. Forget (2009), A new model to simulate the Martian mesoscale and microscale atmospheric circulation: Validation and first results, J. Geophys. Res., 114, E02009, doi:10.1029/2008JE003242.

(4) Lefèvre, M., A. Spiga, and S. Lebonnois (2017), Three-dimensional turbulence-resolving modeling of the Venusian cloud layer and induced gravity waves, J. Geophys. Res. Planets, 122, 134–149, doi:10.1002/2016JE005146.


How to cite: Clement, N., Leconte, J., Spiga, A., Milcareck, G., Guerlet, S., and Selsis, F.: Impact of the methane cycle in tropospheric convection on Neptune revealed by a cloud resolving model, Europlanet Science Congress 2022, Granada, Spain, 18–23 Sep 2022, EPSC2022-477, https://doi.org/10.5194/epsc2022-477, 2022.

15:45–16:00
|
EPSC2022-205
Patrick Irwin, Nicholas Teanby, Leigh Fletcher, Daniel Toledo, Glenn Orton, Michael Wong, Michael Roman, Santiago Pérez-Hoyos, Arjuna James, and Jack Dobinson

Previous studies of the reflectance spectra of Uranus and Neptune concentrated on individual, narrow wavelength regions, inferring solutions for the vertical structure of gases and aerosols that work well for the wavelength range fitted, but not elsewhere. This has made it difficult to interpret these works with respect to the underlying physical structures. Here we searched for a model of the vertical distribution of haze and methane abundance that fits the whole 0.3 – 2.5 µm range simultaneously, determining more robust solutions.

We reanalysed a set of observations from: HST/STIS (0.3-1.0 µm), IRTF/SpeX (0.8-2.5 µm), and Gemini/NIFS (1.4-1.8 µm).  Using a Minnaert limb-darkening model, we were able to partially disentangle cloud opacity and cloud absorbing effects, resulting in a model of the vertical distribution of aerosols and methane that is consistent with the observed reflectivity spectra of both planets and fits all wavelengths simultaneously. This model consists of three main components:  Aerosol-1) a deep aerosol layer with a base pressure > 5-7 bar, assumed to be a mixture of H2S ice and photochemical haze; Aerosol-2) a layer of photochemical haze/ice, coincident with a layer of high static stability at the methane condensation level at 1-2 bar; and Aerosol-3) an extended layer of photochemical haze, likely mostly of the same composition as the 1-2-bar layer, extending from this level up through to the stratosphere, the likely origin of the photochemical haze particles. For Neptune, we also need to add a thin layer of micron-sized methane ice particles (Aerosol-4) at ~0.2 bar to explain the enhanced reflection at longer methane-absorbing wavelengths. We suggest that methane condenses onto the haze particles at the base of the 1-2-bar Aerosol-2 layer and forms ice/haze particles that grow very quickly to large size and immediately ‘snow out’, as predicted by Carlson et al. (1988). We suggest that these particles re-evaporate at deeper, warmer levels to release their core haze particles to act as condensation nuclei for H2S ice formation in the Aerosol-1 layer (Fig. 1).

Figure 1. Summary of retrieved aerosol distributions for Uranus (left) and Neptune (right), compared with their assumed temperature/pressure profiles. On each plot are also shown the condensation lines for CH4 (green) and H2S (pink), assuming 10-bar mole fractions of 4% for CH4 and 0.001 for H2S, to move the condensation levels to the approximate levels of the Aerosol-1 and Aerosol-2 layers.

We find that the particles in the 1-2 bar Aerosol-2 layer have the greatest impact on the overall colour of Uranus and Neptune. These particles would appear mostly white in the visible, but become increasingly absorbing at blue/UV and near-IR wavelengths. The Aerosol-2 layer on Uranus has approximately twice the opacity as the same layer on Neptune, giving Uranus a paler blue-green colour than the deeper blue of Neptune, and also explains why Uranus is darker than Neptune at UV wavelengths as can be seen in Figs. 2 and 3.

Figure 2. HST/STIS I/F spectra of Uranus and Neptune averaged along the central meridian of these planets. Also overplotted, for reference are the red, green, blue sensitivities of the human eye.

Figure 3. Modelled appearances of Uranus and Neptune. The right-hand column shows the simulated ‘observed’ appearance of Uranus and Neptune, reconstructed using the fitted Minnaert limb-darkening coefficients extracted from HST/STIS data. The spectra across the discs were convolved with the Commission Internationale de l’Éclairage (CIE)-standard red, green, and blue human cone spectral sensitivities to yield these apparent colours. The preceding columns show how our modelled appearance of these planets changes as we add different components to our radiative-transfer model.

For the deeper Aerosol-1 layer, a darkening of this layer (or possibly, but less likely, a clearing of the aerosols) provides a good match to the observed spectral properties of dark spots on Neptune, such as the Great Dark Spot observed on Neptune in 1989 by Voyager-2 (Fig. 4), and the more recent NDS-2018 spot, first observed by HST/WFC3 in 2018 (Fig. 5). Such spots are seen to have maximum visibility at ~500 nm, but are invisible at UV wavelengths and also at wavelengths longer than 700 nm. We will discuss the dynamical implications these conclusions have on the possible structure of such dark spots.

Figure 4. Representative Voyager-2 ISS images of Neptune, observed in August 1989 in the Clear, UV, Violet, Blue, Green and Orange filters, respectively, of the Narrow Angle Camera (NAC). The Great Dark Spot and Dark Spot 2 are visible, except in the UV channel. Also visible, except in the UV, is the darker belt at 45-55°S.

Figure 5. Observed and reconstructed HST/WFC3 images of Neptune made in 2018. Top: observations with the NDS-2018 feature at upper left and a dark lane at 60°S at lower right. Middle: images reconstructed from our fits to the HST/STIS data, but also including a hole in the deep Aerosol-1 layer (p>5-7 bar) near the central meridian at 15°N, and a clearing at 60°S. Bottom: a second set of images reconstructed from our fits, but where the Aerosol-1 layer is instead darkened near the central meridian at 15°N and at all longitudes at 60°S.

Finally, the homogenous haze layer near the 1-2 bar methane condensation level can be explained by a layer of high static stability caused by the release of latent heat and by the significant decrease with height of the mean atmospheric molecular weight caused by methane condensation, which has a large deep abundance (~4%) and is much heavier than the surrounding H2-He air. Methane condensation would quickly form very large ice particles at the base of this haze layer that immediately ‘snow out’, explaining why a layer of methane ice is not found at its condensation level. Limited mixing from the potential static stability barrier at 1-2 bar could permit external CO entering Neptune’s atmosphere to be trapped in the upper troposphere, removing the need for extreme internal oxygen enrichment in order to explain the wide wings in Neptune’s sub-mm CO lines.

How to cite: Irwin, P., Teanby, N., Fletcher, L., Toledo, D., Orton, G., Wong, M., Roman, M., Pérez-Hoyos, S., James, A., and Dobinson, J.: A holistic aerosol model for Uranus and Neptune, including Dark Spots, Europlanet Science Congress 2022, Granada, Spain, 18–23 Sep 2022, EPSC2022-205, https://doi.org/10.5194/epsc2022-205, 2022.

16:00–16:15
|
EPSC2022-1034
|
ECP
Gwenaël Milcareck, Sandrine Guerlet, Franck Montmessin, Aymeric Spiga, Jérémy Leconte, Leigh N. Fletcher, Jan Vatant d'Ollone, Michael T. Roman, and Emmanuel Lellouch

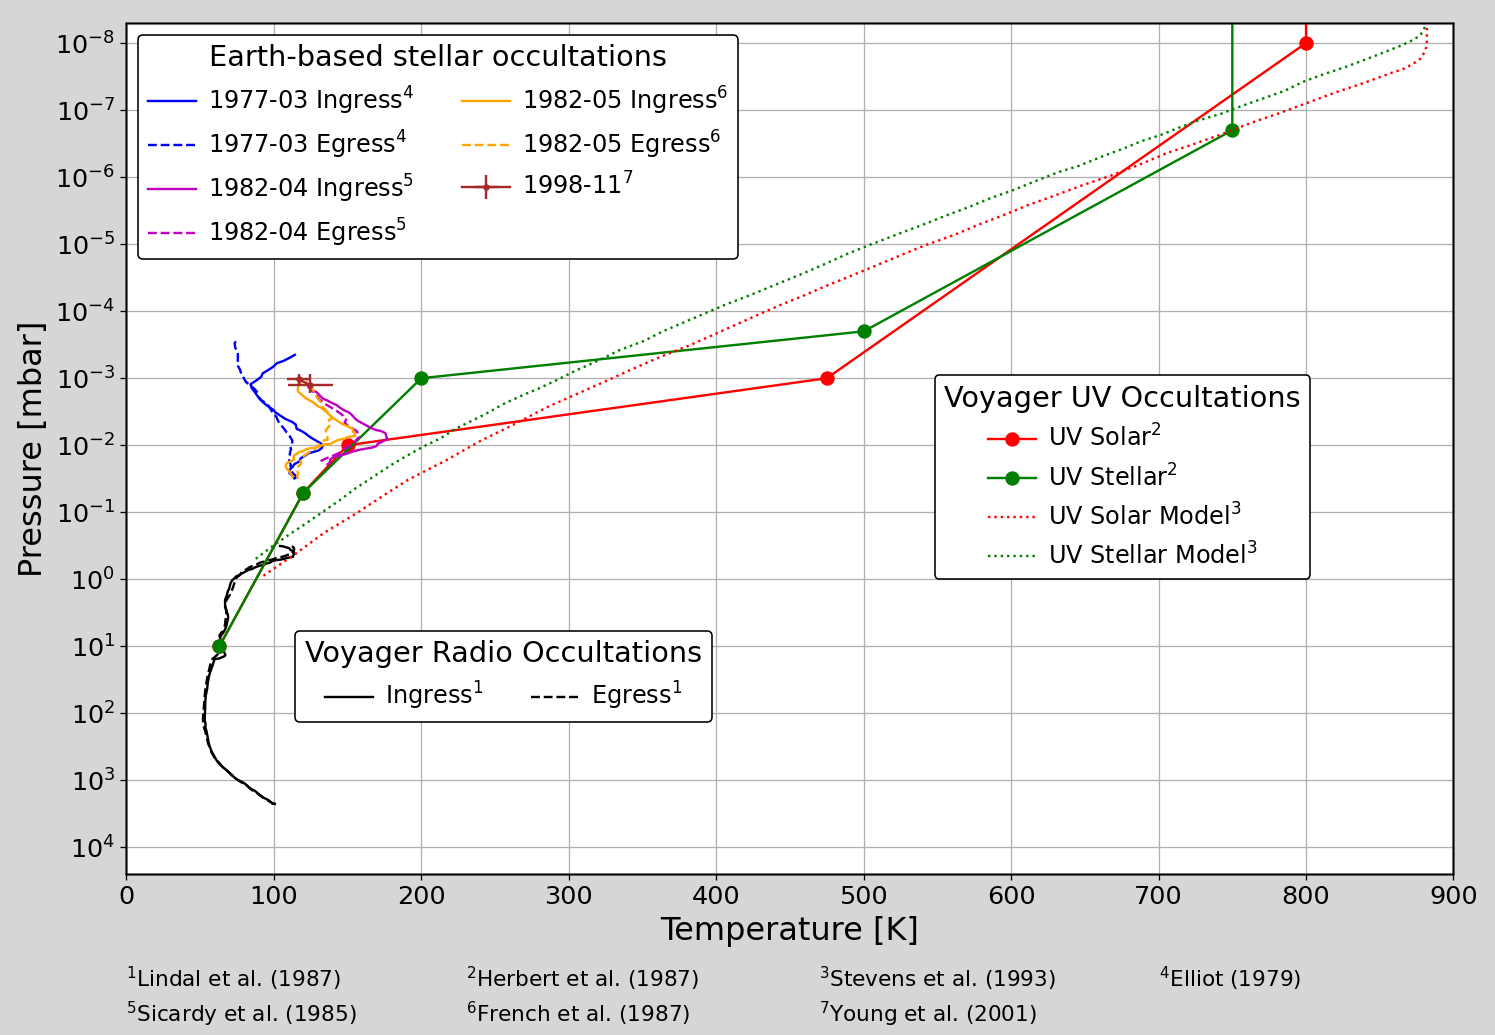
Uranus and Neptune have a tropopause, stratosphere and a thermosphere inexplicably too hot. This problem is called "Energy Crisis" [1,2]. Radio occultation measurements [3,4] and UV stellar and solar measurements [5,6] by Voyager 2 revealed that their stratosphere reach values of 150 K and their thermosphere reach values of 800 K. Globally-averaged temperature observations [7,8] have also shown a warmer stratosphere than expected. Current radiative equilibrium models can’t explain the observed temperatures [9,10], one or several unknown heat sources are necessarily responsible of this warm atmosphere. Thus, the nature of this or these heat sources is still an open question.

To evaluate the role of several heat sources, we use the radiative-convective model developed by the Laboratoire de Météorologie Dynamique (LMD), previously used for the atmospheres of gas giant planets [11,12]. The model employs the correlated-k formalism to compute gaseous opacities from CH4, C2H2 and C2H6, opacities from collision-induced absorption (H2-H2, H2-He, H2-CH4, He-CH4 and CH4-CH4) assuming a H2 ortho/para fraction at equilibrium. Our model accounts for the internal heat flux, for multiple scattering and Rayleigh scattering. Cloud and aerosols physical properties (exctinction coefficient, single scattering albedo and asymmetry factor) are computed offline assuming Mie scattering, given a particle size distribution and optical constants. In the radiative-convective model, their optical depth is computed for each layer from several entry parameters: the total optical depth (at a reference wavelength), the boundary pressures (bottom and top of the layer), and an aerosol scale height [13].

Three hypotheses were explored separately to induce sufficient heating to warm the atmosphere. We varied the methane mole fraction profile, added an ad hoc aerosol layer, and imposed thermal conduction from the thermosphere.

Values of observed methane molar fraction in the uranian stratosphere being scattered [14], a sensitivity study was carried out by varying the methane homopause altitude and the stratospheric molar fraction. As expected, a high molar fraction makes it possible to heat the stratosphere and to obtain a tropopause altitude similar to observations. Nevertheless, all tests failed to fully heat the tropopause. This is also expected, as much less solar photons in the near infrared reach these levels.

Concerning thermal conduction from the thermosphere, the heating allows to obtain a temperature gradient in upper stratosphere similar to nominal temperature profile from [7]. However, simulated temperature profile is still colder (see figure 1).

Simulations showed that temperature profile of Uranus was very sensitive to the addition of an optically thin aerosols layer confined to a few levels in the stratosphere. To obtain a sufficiently important stratospheric heating, this layer requires that the absorption spectrum is relatively intense in ultraviolet and thermal infrared. This type of spectrum is similar to tholins, black carbon or a carbon-NH3 mixture [15]. The relatively dark spectrum of this layer also induces greenhouse effect in the tropopause.

In the case of Neptune, all hypothesis tested couldn’t warm stratosphere. Therefore, other heat sources are needed to explain observations, such as a dynamical forcing in stratosphere (...) and/or a coupling with thermospheric dynamics and/or auroral heating.

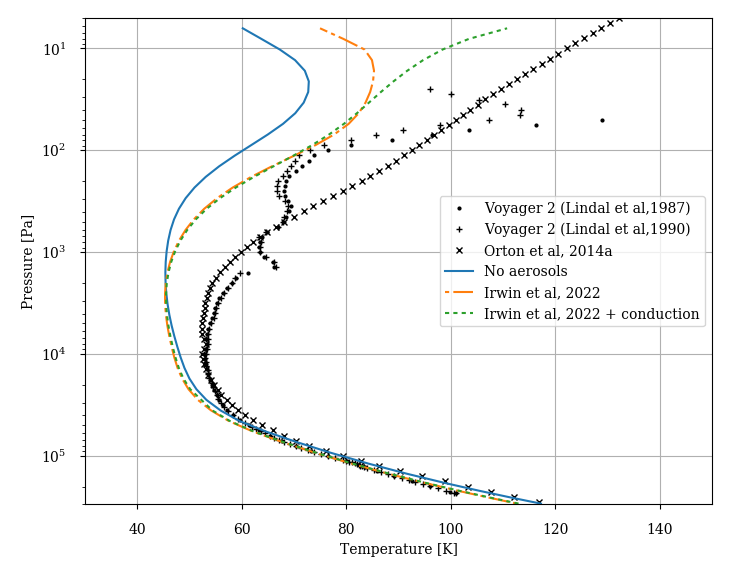
Figure 1: Temperature profiles from our simulations and from observations [3,4,16] at the same latitude and solar longitude of Voyager 2 measurements. Blue curve corresponds to a simulation without aerosols, orange curve aerosolsmodel from [17] is added, and for green curve, we add a conduction from thermosphere with aerosols. Methane molar fraction profile from [14] is used on our simulations.

Acknowledgements

G. Milcareck, S. Guerlet and A. Spiga acknowledge funding from Agence Nationale de la Recherche (ANR) project SOUND, ANR-20-CE49-00009-01.

References

[1] Marley, M. S. and McKay, C. P. (1999). Icarus, 138.
[2] Fletcher, L. N., de Pater, I., Orton, G. S., Hofstadter, M. D., Irwin, P. G. J., Roman, M. T., and Toledo, D. (2020). Space Science Reviews, 216.
[3] Lindal, G. F., Lyons, J. R., Sweetnam, D. N., Eshleman, V. R., Hinson, D. P., and Tyler, G. L. (1987). Journal of Geophysics Research, 92.
[4] Lindal, G. F. (1992). Astronomical Journal, 103.
[5] Herbert, F., Sandel, B. R., Yelle, R. V., Holberg, J. B., Broadfoot, A. L., Shemansky, D. E., Atreya, S. K., and Romani, P. N. (1987). Journal of Geophysical Research, 92.
[6] Broadfoot, A. L., Atreya, S. K., Bertaux, J. L., Blamont, J. E., Dessler, A. J., Donahue, T. M., Forrester, W. T., Hall, D. T., Herbert, F., Holberg, J. B., Hunten, D. M., Krasnopolsky, V. A., Linick, S., Lunine, J. I., Mcconnell, J. C., Moos, H. W., Sandel, B. R., Schneider, N. M., Shemansky, D. E., Smith, G. R., Strobel, D. F., and Yelle, R. V. (1989). Science, 246.
[7] Orton, G. S., Fletcher, L. N., Moses, J. I., Mainzer, A. K., Hines, D., Hammel, H. B., Martin- Torres, F. J., Burgdorf, M., Merlet, C., and Line, M. R. (2014). Icarus, 243.
[8] Fletcher, L. N., de Pater, I., Orton, G. S., Hammel, H. B., Sitko, M. L., and Irwin, P. G. J. (2014). Icarus, 231.
[9] Greathouse, T. K., Richter, M., Lacy, J., Moses, J., Orton, G., Encrenaz, T., Hammel, H. B., and Jaffe, D. (2011). Icarus, 214.
[10] Li, C., Le, T., Zhang, X., and Yung, Y. L. (2018). Journal of Quantitative Spectroscopy and Radiative Transfer, 217.
[11] Guerlet, S., Spiga, A., Sylvestre, M., Indurain, M., Fouchet, T., Leconte, J., Millour, E., Wordsworth, R., Capderou, M., Bézard, B., and Forget, F. (2014). Icarus, 238.
[12] Guerlet, S., Spiga, A., Delattre, H., and Fouchet, T. (2020). Icarus, 351.
[13] Madeleine, J. B., Forget, F., Millour, E., Navarro, T., and Spiga, A. (2012). Geophysical Research Letters, 39.
[14] Lellouch, E., Moreno, R., Orton, G. S., Feuchtgruber, H., Cavalié, T., Moses, J. I., Hartogh, P., Jarchow, C., and Sagawa, H. (2015). Astronomy and Astrophysics, 579.
[15] Rizk, B. and Hunten, D. M. (1990). Icarus, 88.
[16] Lindal, G. F., Lyons, J. R., Sweetnam, D. N., Eshleman, V. R., Hinson, D. P., and Tyler, G. L. (1990). Geophysical Research Letters, 17.
[17] Irwin, P. G. J., Teanby, N. A., Fletcher, L. N., Toledo, D., Orton, G. S., Wong, M. H., Roman, M. T., Perez-Hoyos, S., James, A., and Dobinson, J. (2022). arXiv e-prints.

How to cite: Milcareck, G., Guerlet, S., Montmessin, F., Spiga, A., Leconte, J., Fletcher, L. N., Vatant d'Ollone, J., Roman, M. T., and Lellouch, E.: Radiative heat sources in the stratosphere of Uranus and Neptune, Europlanet Science Congress 2022, Granada, Spain, 18–23 Sep 2022, EPSC2022-1034, https://doi.org/10.5194/epsc2022-1034, 2022.

16:15–16:30
|
EPSC2022-142
Gregorio J. Molina-Cuberos, Olivier Witasse, Daniel Toledo, and Sachchida Tripathi

Some of the atmospheric processes occurring in the Ice Giant planets Uranus and Neptune critically depend on the electrical properties of their respective atmospheres. Therefore, the modelling of the electromagnetic properties of the atmosphere provides valuable information to characterize several aspects of the atmosphere. For example, lightning phenomena is an indicator of strong convective movements, and the number densities of electrons and ions affect the growth of aerosols and cloud formation. In the pressure range where such process take place the solar radiation has been mainly absorbed and the main ionization source is galactic cosmic rays. Furthermore, the long distance to the Sun decreases the role of solar radiation on the atmospheric electrical properties, while the cosmic ray flux is similar or even larger compared to that at the inner solar system. This implies a proportionally greater role of the galactic cosmic rays induced ionosphere for the ice giant planets than for the rest of solar system planets.

Protons and alpha particles, which mainly compound the cosmic rays, can reach the Uranus and Neptune lower stratosphere to ionize the atmospheric constituents and thus produce a low altitude ionospheric layer. The flux and composition of cosmic ray incident on a planetary atmosphere depend on the distance to the Sun and varies over the 11-year solar activity cycle. Furthermore, the planetary magnetic field deflects the incoming cosmic rays depending on their rigidity and angle of incidence. Therefore, both factors solar cycle and magnetic latitude must be considered to calculate the ionization rate by cosmic rays.

The presence of aerosols also affects the ion-neutral chemistry by capturing electrons and positive ions depending on the aerosol size and concentration. Here we present the first results obtained with a numerical model, which is based on previous studies for  Mars and Titan [1-2], capable to calculate the number density of electrons and positive ions, as well the aerosol charging between 0.1 and 15 bars in the atmosphere of Neptune and Uranus. We have found that, for the particle density and size vertical profiles obtained in previous works [3-4], aerosols are negatively charged, and the number density of electrons is lower than that of positive ions for pressures lower than around 1 bar.

References

[1] Cardnell, S., et al. (2016), A photochemical model of the dust-loaded ionosphere of Mars, J. Geophys. Res. Planets, 121, doi:10.1002/2016JE005077.

[2] Molina-Cuberos, G.J., et al. (2018) Aerosols: The key to understanding Titan's lower ionosphere, Planet. Space Sci, 153, 157 – 162, doi: 10.1016/j.pss.2018.02.007.

[3] Toledo et al. (2019), Constraints on Uranus's haze structure, formation and transport, Icarus 0019-1035, doi: 10.1016/j.icarus.2019.05.018

[4] Toledo et al. (2020) Constraints on Neptune’s haze structure and formation from VLT observations in the H-band, Icarus, doi: 10.1016/j.icarus.2020.113808

How to cite: Molina-Cuberos, G. J., Witasse, O., Toledo, D., and Tripathi, S.: Ionization by Cosmic Rays of the Ice Giant Atmospheres, Europlanet Science Congress 2022, Granada, Spain, 18–23 Sep 2022, EPSC2022-142, https://doi.org/10.5194/epsc2022-142, 2022.

16:30–16:45
|
EPSC2022-1263
|
solicited
Damya Souami, Bruno Sicardy, Stéfan Renner, and Maud Langlois

Neptune's incomplete ring arcs have been stable since their discovery in 1984 by stellar occultation. Although these structures should be destroyed within a few months through differential Keplerian motion, imaging data over the past couple of decades have shown that these structures remain stable.

We present the first SPHERE near-infrared observations of Neptune's ring arcs taken at 2.2 μm (broadband Ks) with the IRDIS camera at the Very Large Telescope (VLT) in August 2016.

We derive accurate mean motion values for the arcs and the nearby satellite Galatea. The trailing arcs Fraternité and Égalité have been stable since they were last observed at VLT in 2007 (cf. Fig 1 left). Furthermore, we confirm the fading away of the leading arcs Courage and Liberté. Finally, we confirm the mismatch between the arcs' position and the 42:43 inclined and eccentric corotation resonances with Galatea, thus demonstrating that no 42:43 corotation model works to explain the azimuthal confinement of the arcs' material (cf. Fig. 1 right).

Fig. 1 (left) 68 projected and co-added images of Neptune’s equatorial plane, revealing material along the arcs Fraternité and Égalité, as well as the satellites Proteus (P) and Galatea (G). The frame is 7.1x10.7 arcsec2 wide. (right) Equivalent width of the arcs (Fraternité and Égalité), at an angular resolution of 2°. The X-axis origin is the longitude LFr of the centre of the Fraternité arc measured from the J2000.0 ascending node, where LFr = 217.43 deg, at the reference epoch. (Souami et al. 2022)


We also present here our NOC21 (Neptune stellar Occultation Campaign 2021) observational campaign to study the evolution of the Neptunian system since Voyager-2.

On October 7th, 2021, we led and organised the largest occultation and imaging campaign by the Neptunian system ever undertaken since the Voyager flyby in 1989. This occultation event was observable across the Americas (North and South) as well as in Hawaii, and the campaign involved all large telescopes in the region that were equipped with fast cameras either in the infra-red K band (2.2 μm) or in the visible using a CH4 filter at 890 nm. Combined with Adaptive Optics images, these observations will bring new constrains on Neptune's rings dynamics

We will use the occultation data collected during the NOC21 campaign along with AO data obtained at Keck observatory around the occultation time, to address the following points:

  • the study of Neptune’s arcs’ system evolution using adaptive optics data,
  • the detection of the main Le Verrier and Adams rings (see Fig.1) in the NOC21 data to measure their optical depths. In particular, we will search for possible changes in density of the Adams rings since the Voyager-2 mission in 1989,
  • the search (in the NOC21 data) for any other narrow rings and/or small satellites and/or local debris such as arcs.

How to cite: Souami, D., Sicardy, B., Renner, S., and Langlois, M.: The evolution of Neptune’s arcs since Voyager-2. VLT/SPHERE observations of Neptune’s ring arcs and the 2021 Neptune stellar occultation campaign, Europlanet Science Congress 2022, Granada, Spain, 18–23 Sep 2022, EPSC2022-1263, https://doi.org/10.5194/epsc2022-1263, 2022.

16:45–17:00
|
EPSC2022-1245
Paul Schenk, Richard Cartwright, Chloé Beddingfield, and Julie Castillo-Rogez

The five major Uranian satellites provide important constraints on compositional and dynamical evolution in the Uranian system.  These bodies experienced endogenic activity in the past, morphologically distinct from those on Saturnian icy moons.  Uranian moons also exhibit compositional differences with their Saturnian counterparts.  Because our understanding of these bodies is based on the single 1986 Voyager flyby and telescope observations, much remains to be discovered and understood about how these moons formed and evolved.


  • 1. Introduction

The five major Uranian moons (diameters 930 to 1575 km and best density estimates of ~1.2 to 1.7 kg/m3)form a regular family of ice-rich planetary bodies, and record accretional conditions in the Uranian system.  Voyager 2 mapping of <40% of their surfaces provides our only resolved record of these worlds [1,2]. Earth- and space-based telescope observations provide additional constraints. Here we review these moons in context with the Saturnian system, with a view towards the now likely return to the Uranian system as a major NASA Flagship.

Figure 1: Voyager views of the 5 major Uranian icy moons.


  • 2. Composition and Interiors

Uranian satellites are markers of the composition of the region they formed in. Telescope observations indicate surface compositional differences from Saturnian moons. Saturnian moons have bright surfaces with strong H2O ice absorption bands (except Iapetus’ dark), partly due to E-ring deposition [e.g., 3]. Uranian moons have darker surfaces of H2O-ice mixed with spectrally neutral components possibly rich in organics and/or hydrated silicates. CO2 on Saturnian moons is complexed with other species (except CO2-ice on Enceladus) [4,5]; CO2 is in crystalline form on Uranian moons [4,5].  

Limited topography indicates Uranian moons are more rugged than inner Saturnian moons [7], provisionally attributed to global thermal resetting in saturnian moons.  Enceladus is the only confirmed ocean world among these moons (deep oceans have been suggested at Dione [8] and Mimas [9]).  Saturnian moons are involved in mean motion resonances that drive obliquity or eccentricity, whereas Uranian moons are not but likely shared such resonances in the past [10,11].  

Radioactive heating estimates range from ~0.1 mW/m2 for Miranda (similar to Mimas) to ~0.7 mW/m2 for Ariel/Umbriel (similar to Dione/Rhea, but three orders magnitude less than measured at Enceladus) to ~1.1 mW/m2 for Titania/Oberon [12].  If Uranian moons preserve liquid, it is likely as residual oceans < 30 km thick, or brine-filled porous cores [12]. Miranda is unlikely to preserve liquid presently unless recently tidally heated. 


  • 3. Tectonics, Volcanism, Past Heat Flow

The five Uranian moons betray various levels of tectonic activity, from deep walled troughs of Ariel (Fig. 2) to cryptic deep features on Umbriel’s limb [2,7].  Some are ancient but global extent and associated stresses are uncertain due to mapping limits.  (Cryo)volcanism of higher relief than in the Saturnian system is widespread on Miranda and Ariel (and unresolved on the others) but composition and eruption state are poorly known [7].

Figure 2.  Voyager stereo-derived DEM showing tectonic and resurfacing features on Ariel. Cylindrical map projection.


Ariel’s estimated past heat flux (6–92 mW/m2) [13,14] overlaps Tethys, Dione, Rhea, Triton, Pluto, and Charon (Fig. 3), and are consistent with tidal heating from past resonances [13,14]. Miranda’s maximum estimated heat flux (31–140 mW/m2) [14,15] is higher than Ariel, Tethys, Dione, and Rhea, and overlaps estimates for Enceladus [16,17]. High heat fluxes for Miranda suggest increases to eccentricity from past resonances [10,11]. 


Figure 3. Comparison of heat flux estimates on icy bodies.


  • 4. Comparison and Exploration

Like Saturn’s icy moons, the five major Uranian satellites are diverse, from little geologic activity to near global resurfacing as little as ~0.1 Gyr ago [17].  The two satellite systems are not identical, representing formation in distant compositionally distinct part of the Solar System, and under possibly much different formation conditions.  Cassini showed the value of a dedicated orbiter with instrumentation across the spectrum. Aside from resurfacing of Dione, Tethys, and esp. Enceladus [18], Cassini revealed magnetospheric and ring particle surface alterations [18, 19], satellite ring deposition [18,20] and other processes. Whether these occur(red) in the Uranian system must await a dedicated Uranian orbiter.  Such observations and interior property constraints from close encounters, will allow better understanding of formation processes of these moons and the Uranian system.


References

[1]. Smith, B., and 30 others, Science, 233, 43-64, 1986.

[2]. Croft, S., and L. Soderblom. In Uranus, Univ. Arizona Press, 1990.

[3]. Verbiscer, A., R. Frech, M. Showalter, and P. Helfenstein, Science, 315, 815, 2007.

[4]. Cartwright, R.J., Emery, J.P., Rivkin, A.S., Trilling, D.E. and Pinilla-Alonso, N., Icarus257, pp.428-456, 2015.

[5]. Cartwright, R.J., Emery, J.P., Pinilla-Alonso, N., Lucas, M.P., Rivkin, A.S. and Trilling, D.E.,  Icarus314, pp.210-231, 2018.

[6] Schenk, P, White O, Byrne P, Moore J. 2018. In Enceladus and the icy moons of Saturn (ed. P. Schenk), pp. 237–265. Tucson, AZ: University Arizona Press, 2018.

[7] Schenk, PM, and J.M. Moore, Phil. Trans. R. Soc. A. 378, 20200102, 2020

[8] Beuthe, M., et al., Geophys. Res. Lett. 43, 10, 088–10, 2016

[9] Rhoden, A., and M. Walker, Icarus, 376, 114872, 2022

[10] Tittemore, W. and Wisdom J., Icarus 85, 394–443. 1990

[11] Cuk, M., El Moutamid, M., & Tiscareno, M. S. Planetary Science Journal, 1, 22, doi: 10.3847/PSJ/ab9748, 2020

[12] Castillo-Rogez, J. C., and 7 others, submitted to J. Geophys. Res., 2022; AGU Fall meeting, 2021.

[13] Peterson, G, Nimmo F, Schenk P., Icarus 250, 116–122, 2015

[14] Beddingfield, C., Cartwright R., Leonard E., Nordheim T., Scipioni F., 2022 PSJ 3, 106,  2022

[15] Beddingfield, CB, Burr DM, Emery JP., Icarus 247, 35–52, 2015

[16] Bland M. T., Beyer R. A. and Showman A. P., Icarus, 192, 92, 2007; Bland M. T., Singer K. N., McKinnon W. B. and Schenk P. M. 2012 Geophys. Res. Lett., 39, L17204, 2012

[17]. Kirchoff, M., et al, Planet Sci. J., 3, 42, 2022.

[18].  Schenk, P., D. Hamilton, R. Johnson, W. McKinnon, J. Schmidt, M Showalter, Icarus, 211, 740-757, 2011.

[19] Howett, C. et al., Icarus, 216, 221-226, 2011.

[20] Ip, W., Geophys. Res. Lett., 33, L16203, 200.

How to cite: Schenk, P., Cartwright, R., Beddingfield, C., and Castillo-Rogez, J.: Uranian Mid-Sized Icy Moons: Unique Targets of Exploration in the Outer Solar System, Europlanet Science Congress 2022, Granada, Spain, 18–23 Sep 2022, EPSC2022-1245, https://doi.org/10.5194/epsc2022-1245, 2022.

Display time: Mon, 19 Sep 08:30–Wed, 21 Sep 11:00

Posters: Mon, 19 Sep, 18:45–20:15 | Poster area Level 1

L1.100
|
EPSC2022-1209
|
ECP
Marina Cano, Nadine Nettelmann, and Nicola Tosi

Background: Some fundamental properties of the interiors of the Ice giants Uranus and Neptune are far from being understood. According to structure models which follow observed gravitational harmonics J2 and J4, the interiors are composed of a H/He-rich envelope transitioning into an ice-rock interior. Formation theories can explain their current structure given certain conditions related to the formation location within the protoplanetary disk nebula and the degree of gas depletion during said formation are met, conditions which themselves seek an explanation [1].  

A rather sharp boundary yields the simplest solution to the gravity field [2] and the luminosity of the planets  [3]. Recently, the phase  separation of two major constituents (water and molecular hydrogen) in the evolved and cooled planets Uranus and Neptune has been proposed as an explanation for the presence of this sharp interface. Furthermore, different H2O/H2 demixing states may offer an explanation for the paradox between intrinsic heat flux of both planets [2]. On the other hand, evolution models guided by the observed luminosities suggest the existence of a compositional barrier inhibiting or slowing down convection. Assuming small differences in the structure of both planets, this mechanism can account for the faintness of Uranus and the brightness of Neptune [3]. However, their evolution could be affected by possible complementary processes such as phase separation [2] or condensation in their atmospheres. 

In this work, we follow up on the possibility of demixing between the major constituents in the H-He-H2O system. First, we show that interior models which adjust to the luminosity [3] lead to temperatures above the critical temperature for H2O/H2 demixing to occur, and thus would predict a protosolar atmospheric helium abundance. Second, we adopt the assumption of an initially more homogeneous interior which did cool sufficiently to allow for H2O/H2 demixing [2]. We find that for deep interior H/He phase separation, which occurs at higher temperatures, favourable interior conditions were met much earlier in the evolution [4].

Figure 1: Helium particle fraction as a function of assumed water mass fraction in the deep interior of Uranus. Error bars placed at ZH2O= 0 show the observed atmospheric He abundances of Jupiter, Saturn, Uranus, and Neptune, while also a value for Jupiter's deep interior. The grey area delimits the uncertainty region marking the lower limit of He/H ratio necessary for phase separation to occur in Uranus. This figure shows how the He/H ratio relevant to H/He demixing behaves with the water abundance.

In Figure 1, we plot the He particle fraction as a function of the assumed water mass fraction in the deep interior assuming full dissociation of water and hydrogen. Protosolar values for the atmospheric helium abundance Y were adopted for Uranus (0.26-0.28). The grey region shows the uncertainty region above which H/He demixing can occur, inferred from the H/He non-ideal entropy phase diagram of [4]. Figure 1 shows H/He phase separation cannot take place in a highly ice-rich interior ZH2O greater ~0.85. However, moving towards lower water contents, demixing can occur at pressure levels between 1.5 to 4 Mbar [4]. The atmospheric helium abundance prediction we aim for could be compared to probed in-situ measurements in the future. 

Acknowledgements:
The authors acknowledge support from the Research Unit 2440/2 funded by the DFG (Deutsche Forschungsgemeinschaft).  

[1] Frelikh R. and Murray-Clay R.A., AJ 154:98 (2017). [2] Bailey E. and Stevenson D.S., PSJ 2:64 (2021). [3] Scheibe L. et al., A&A 650:A200 (2021). [4] Schöttler M. and Redmer R., PRL 120:115703 (2018).


How to cite: Cano, M., Nettelmann, N., and Tosi, N.: On the possibility of phase separation in the H-He-H2O system in the Ice Giants, Europlanet Science Congress 2022, Granada, Spain, 18–23 Sep 2022, EPSC2022-1209, https://doi.org/10.5194/epsc2022-1209, 2022.

L1.101
|
EPSC2022-33
Thibault Cavalié, Jonathan Lunine, Olivier Mousis, and Olivia Venot

The formation of giant planets can mainly be explained by two models: core accretion and gravitational collapse. Measurements of magnetic and gravity fields, as well as deep composition can help to constrain which scenario led to the formation of the Solar System Giant Planets. The deep composition also holds keys to understanding how primordial ices condensed and trapped the heavy elements, in the form of pure condensates, amorphous ices or clathrates. While the Galileo probe enabled measuring the abundances of noble gases and other heavy elements in Jupiter, the elemental composition of Saturn and the Ice Giants remains poorly constrained. Observations coupled with thermochemical modeling can help us to constrain the deep composition of giant planets and can also be used in synergy with mass spectrometry measurements of an in situ probe.
In this paper, we will present recent results of thermochemical modeling of the Ice Giants and compare them with results obtained for Jupiter.

How to cite: Cavalié, T., Lunine, J., Mousis, O., and Venot, O.: Observations and thermochemical modeling of gas and ice giant planets, Europlanet Science Congress 2022, Granada, Spain, 18–23 Sep 2022, EPSC2022-33, https://doi.org/10.5194/epsc2022-33, 2022.

L1.102
|
EPSC2022-168
Nicholas Teanby, Patrick Irwin, Conor Nixon, Martin Cordiner, and Lucy Wright

Water vapour in the stratospheres of Uranus and Neptune has previously been shown to originate from external sources. These sources could include comet impacts [4], interplanetary dust particles [8], or rings and moons [1]. Stratospheric water was first detected on Uranus and Neptune by the Short-Wavelength Spectrometer (SWS) on the Infrared Space Observatory (ISO) [2], but the uncertainties were relatively large due to lack of constraint on the vertical water profiles and relatively low spectral resolution of the observations.

Here we present new observational constraints on Uranus’ and Neptune’s externally sourced stratospheric water abundance using disc-averaged high spectral resolution observations of the 557 GHz water emission line from Herschel’s Heterodyne Instrument for the Far-Infrared (HIFI). On both planets the emission line is significantly broadened by disc-averaging of Doppler shifts from planetary rotation, which was carefully accounted for in our analysis [10]. Derived stratospheric column water abundances are 0.56+0.26-0.06 x 1014 cm-2 for Uranus and 1.9+0.2-0.3 x 1014 cm-2 for Neptune. These results imply Neptune has about four times as much stratospheric water as Uranus, and are consistent with previous determinations from ISO-SWS and Herschel-PACS, but with improved precision.

For Uranus excellent observational fits are obtained by scaling photochemical model profiles [3,7] or with step-type profiles with water vapor limited to <=0.6mbar. However, Uranus’ cold stratospheric temperatures imply a ~0.03mbar condensation level, which further limits water vapor to pressures <=0.03 mbar. Neptune’s warmer stratosphere has a deeper ~1 mbar condensation level, so emission-line pressure broadening can be used to further constrain the water profile. For Neptune, excellent fits are obtained using step-type profiles with cutoffs of ~0.3-0.6 mbar or by scaling a photochemical model profile [7]. Step-type profiles with cutoffs >=1.0 mbar or <=0.1 mbar can be rejected with 4σ significance. Rescaling photochemical model profiles from [7] to match our observed column abundances implies similar external water fluxes for both planets: 8.3+4.0-0.9 x 104 cm-2s-1 for Uranus and 12.7+1.3-2.0 x 104 cm-2s-1 for Neptune.

This inferred water influx rates suggest that Uranus and Neptune may in fact have very similar IDP fluxes, unless there are significant water-loss processes that are not accounted for in current photochemical models [3,7]. This is unexpected as the IDP flux on Neptune is expected to be higher due to its closer proximity to the Kuiper belt. For example, the dynamical model of [8] predicts that the flux of IDP grains is around seven times higher on Neptune than on Uranus, but model uncertainties are large enough so as not to preclude a similar flux. The comet impact rates on Uranus and Neptune are also predicted to be quite similar [5,11], so both planets may experience similar external flux processes.

Our new analysis suggests that Neptune’s approximately four times greater observed water column abundance is primarily caused by its warmer stratosphere preventing loss by condensation, rather than by a significantly more intense external source. Larger error bars on the Uranus estimates are due to greater uncertainty in the high-altitude temperature profile. To reconcile these water fluxes with other observed stratospheric oxygen species (CO and CO2) requires either a significant CO component in interplanetary dust particles (Uranus) or contributions from cometary impacts (Uranus, Neptune). In particular, the large CO abundance in Neptune’s stratosphere suggests that we just happen to be observing Neptune at a time shortly after a large comet impact [4,6,9].

Further details of our results and analysis are available in our recent publication [10].

Fig1: Herschel-HIFI line-to-continuum ratio spectra of the 557GHz water line for HRS and WBS spectrometers. The water line is clearly visible at high signal to noise on both planets, but the line is broadened due to Doppler shift combined with the disc-broadened nature of the HIFI spectra. (Figure from https://doi.org/10.3847/PSJ/ac650f, see reference [10]).