Scattering and attenuation properties of the Martian crust through the S1222a seismic event
- 1Institut de Physique du Globe de Paris, Université Paris Cité, CNRS F-75005 Paris, France (menina@ipgp.fr)
- 2Institut de Recherche en Astrophysique et Planétologie, Université Toulouse III Paul Sabatier, CNRS, CNES, Toulouse, France,
- 3Earthquake Research Institute, The University of Tokyo, 1-1-1 Yayoi, Bunkyo-ku, Tokyo, Japan
- 4Institut Supérieur de l’Aéronautique et de l’Espace SUPAERO, Toulouse, France.
Since its deployment at the surface of Mars in 2019, the SEIS seismometer (Seismic Experiment for Interior Structure) of the NASA-InSight mission (Interior exploration using Seismic Investigations, Geodesy and Heat Transport) has detected hundreds of small magnitude seismic events. But recently, the seismic event S1222a of magnitude 4.9 which primarily contains energy above 0.1 Hz was reported by the Mars Quake Service. It is characterized by two temporally separated arrivals with a gradual beginning, a broad maximum and a very long decay lasting up to 1 hour. In this work, we propose to use seismic coda analysis on this specific event to explore the attenuation properties of Martian crust and to provide an Earth-Mars-Moon comparison.

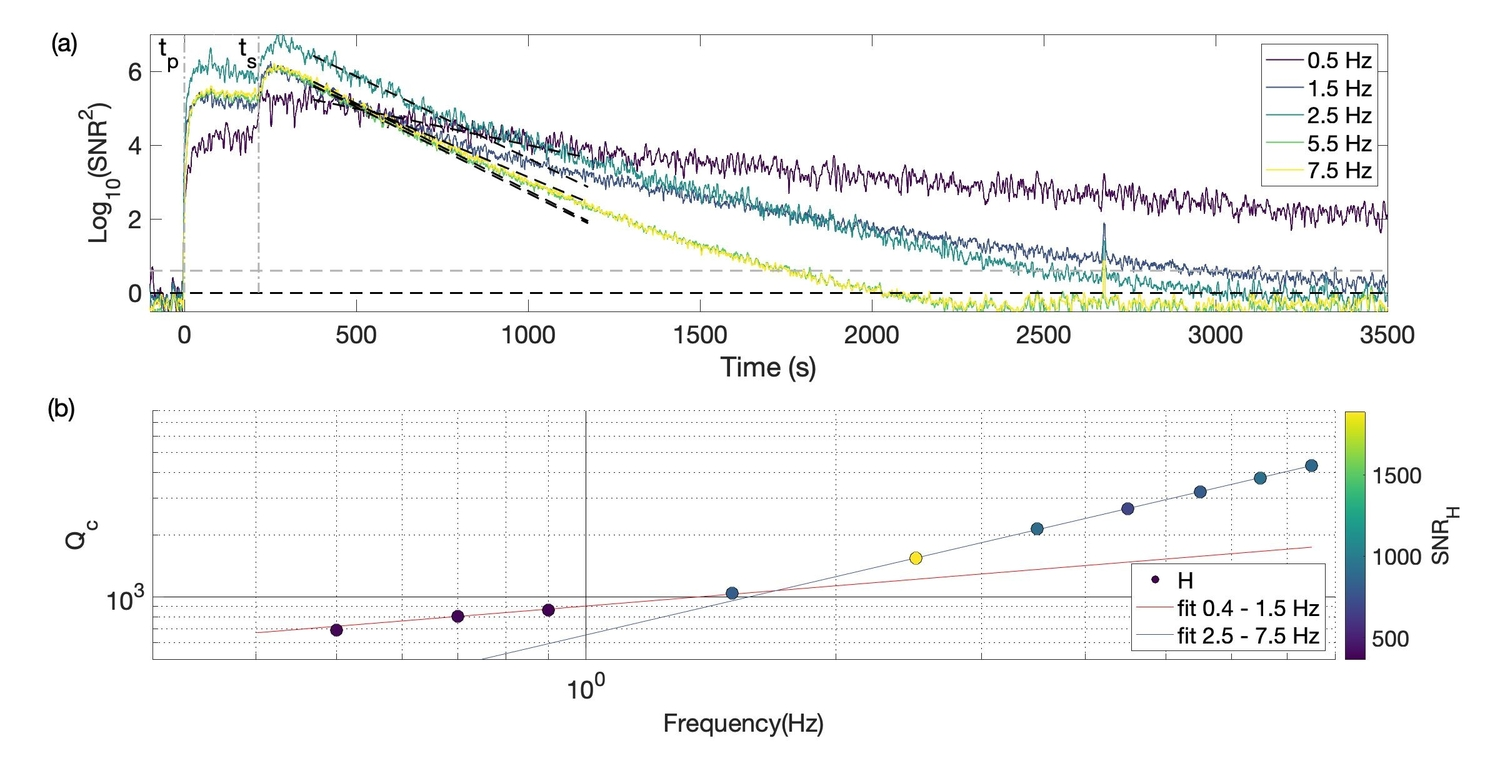
Fig 1: Envelope characteristics of the S1222a Broadband event. The data were collected on the VBB sensors with sampling rates of 20 samples per second. (a) Base 10 logarithm of energy envelopes normalized by the noise level as a function of time and fit of the coda decay (black dashed lines). The gray dashed line indicates signal-to-noise ratio (SNR) = 2. The different colors correspond to different frequency bands indicated in inset. The time t = 0 s corresponds to the first arrival. tP and tS refer to the arrival times of the first and second wave packets (red dashed lines). (b) Frequency dependence of Qc in the 0.4 –7.5 Hz frequency band. The color bar indicates the SNR measured on the horizontal components. The red and black dashed line shows the power-law fit Qc = 900f0.36and Qc = 655f0.94 respectively (f is the frequency.).
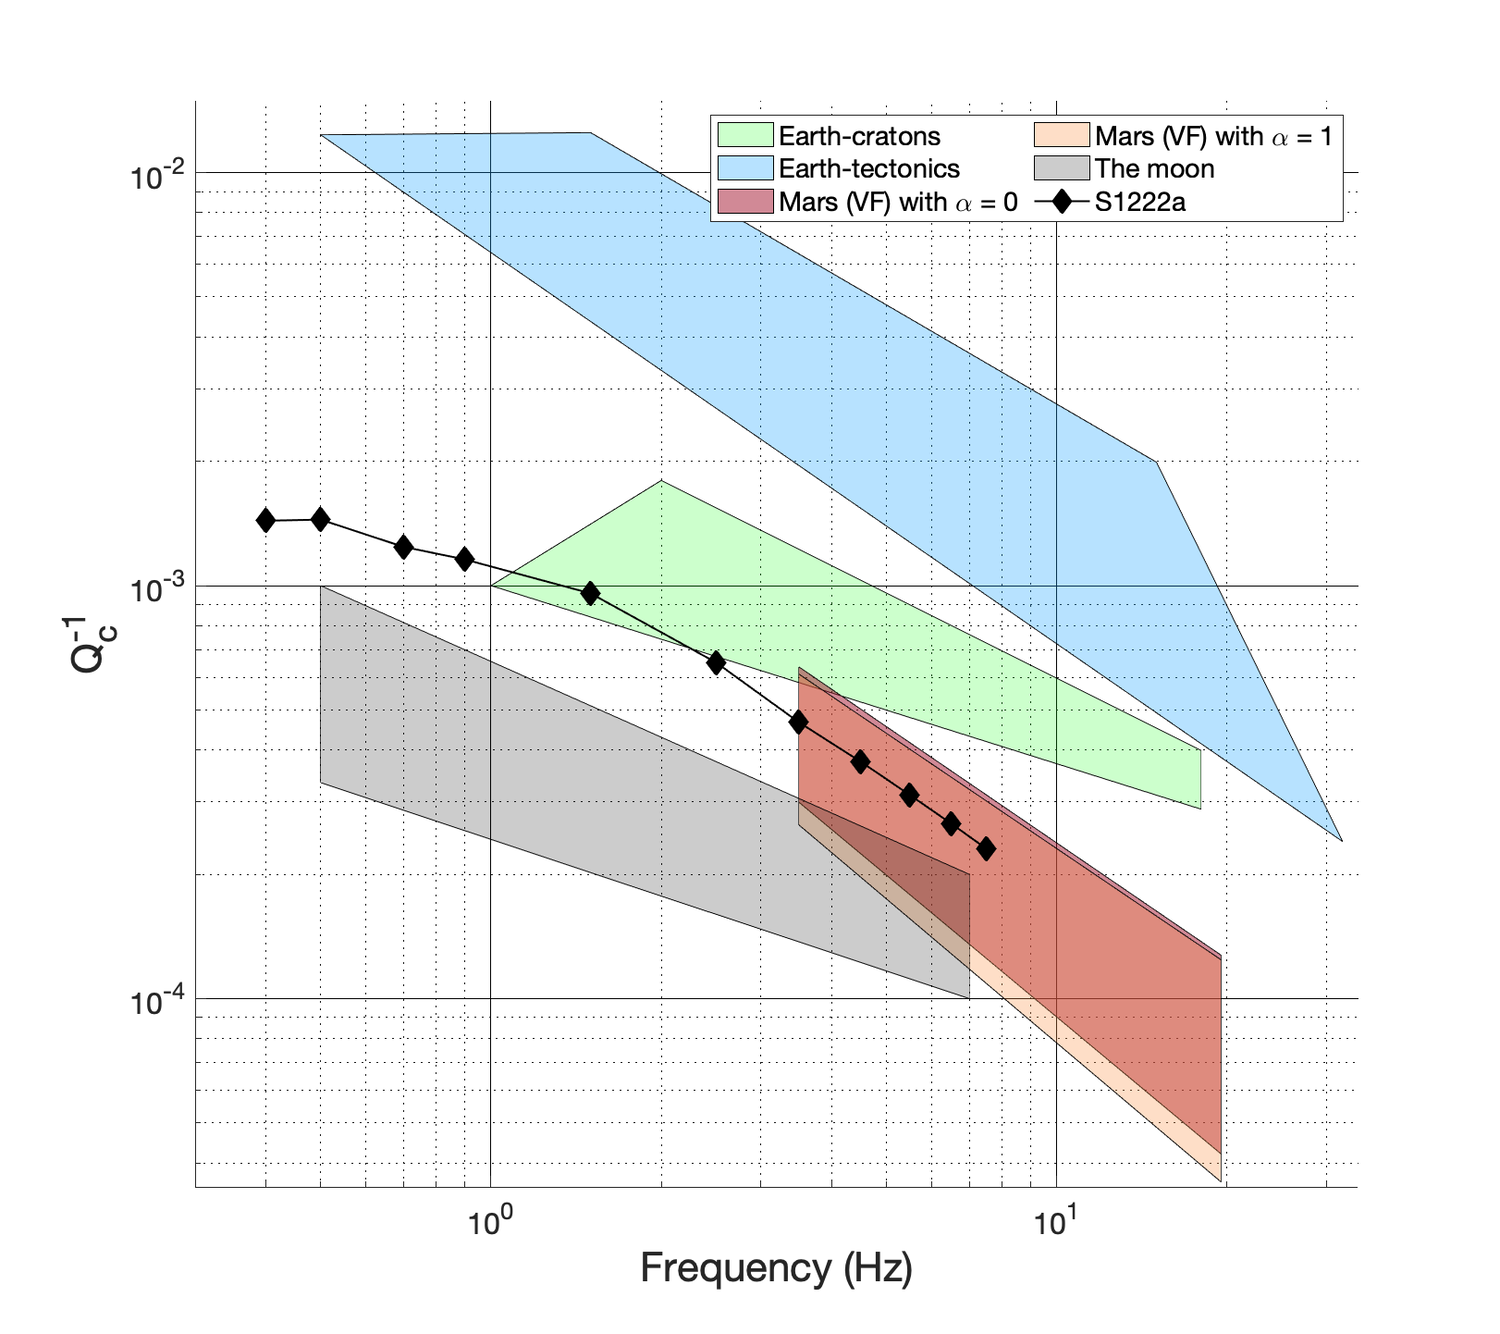
We employ basic multiple-scattering concepts to examine and to compare the energetic characteristics of the Earth, Martian and Lunar crust. We measured the coda quality factor Qc, that characterizes the rate of decay of the seismogram envelope, to have a first view of the attenuation characteristics [1] (see fig 1.a). We performed a fit of the frequency dependence of Qc using a parameterization of the form Qc = Q0 fn. Based on linear least-squares applied to the logarithm of Qc (see fig.1.b), we obtain two very distinct regimes of Qc as a function of the frequency f. In the [0.4 Hz - 1.5 Hz] range Q0 = 900 and n 0.36, when at higher frequency, Q0 = 655 and n 0.94 This result is specific to Mars and could be related to the stratification of the attenuation properties in the Martian crust. The quasi-linear frequency increase of Qc seen in [2.5 Hz – 7.5 Hz] range suggests that the coda decay is governed by a frequency independent attenuation time. Similar values of Q0 and n, in this frequency range, were reported by using a Very High Frequency group events [2] (see Fig 2 in orange and red).

Fig 2: Coda attenuation as a function of the frequency for the Earth-cratons regions (green), the Earth-tectonics regions (bleu), the Moon (gray), Mars ( α= 0 in red and α= 1 in orange) and the S1222a BB event (black).
In the case of the regional earthquakes on Earth, the frequency dependence of Qc is radically different between tectonic areas and shields. Q0varies from 100 to 400 in tectonic areas (blue) [e.g. 3] and from 600 to 1000 in shields areas (green) [e.g. 4], where the frequency exponent n is equal to 1 and 0.1-0.5 respectively. [5] report coda Qc values of 2400 at 0.5 Hz and possibly as large as 10000 at 7 Hz on the Moon (gray). This result suggests that Q0 is a factor of 2 to 4 larger than on Mars when the frequency exponent n is more likely in the range of 0.4 – 0.6. To summarize, our Qc measurements exhibit two different regimes of frequency dependence. At higher frequency, the Q0 and n valuesare very close to the one found on Very High Frequency group events. The unique combination of high Q0 with a frequency exponent n =1 also distinguishes very clearly Mars from the Earth. By the time of the meeting, we hope to present the first results of envelope modeling based on elastic radiative transport in a stratified medium to quantify the contribution of the scattering and the absorption to the total attenuation.
References:
[1] Aki, K. (1969). Analysis of the seismic coda of local earthquakes as scattered waves. Journal of geophysical research, 74(2), 615-631.
[2] Menina et al. (2021), Energy Envelope and Attenuation Characteristics of High‐Frequency (HF) and Very‐High‐Frequency (VF) Martian Events, Bulletin of the Seismological Society of America (2021) 111 (6): 3016–3034.
[3] Mayeda, K., Koyanagi, S., Hoshiba, M., Aki, K., & Zeng, Y. (1992). A comparative study of scattering, intrinsic, and coda Q− 1 for Hawaii, Long Valley, and central California between 1.5 and 15.0 Hz. Journal of Geophysical Research: Solid Earth, 97(B5), 6643-6659.
[4] Mitchell, B, J et al. (2008). A continent-wide map of 1-Hz Lg coda Q variation across Eurasia and its relation to lithospheric evolution. Journal of Geophysical Research: Solid Earth, 113(B4).
[5] Gillet, K., et al (2017). Scattering attenuation profile of the Moon: Implications for shallow moonquakes and the structure of the megaregolith. Physics of the Earth and Planetary Interiors, 262, 28-40.
How to cite: menina, S., Margerin, L., kawamura, T., Lognonné, P., Xu, Z., Onodera, K., Calvet, M., and Garcia, R.: Scattering and attenuation properties of the Martian crust through the S1222a seismic event, Europlanet Science Congress 2022, Granada, Spain, 18–23 Sep 2022, EPSC2022-805, https://doi.org/10.5194/epsc2022-805, 2022.

